Population Ecology Size – represented by N Density – number of individuals per area – 100...
12
Population Ecology Population Ecology Size Size – represented by N – represented by N Density Density – number of individuals – number of individuals per area – 100 buffalo/km per area – 100 buffalo/km 2 2 Dispersion Dispersion – how individuals – how individuals are distributed – Clumped, are distributed – Clumped, uniform or random uniform or random Age structure Age structure – abundance of – abundance of individuals at each age. individuals at each age. Allows for predictions Allows for predictions
-
Upload
brianne-harrison -
Category
Documents
-
view
215 -
download
0
Transcript of Population Ecology Size – represented by N Density – number of individuals per area – 100...
Population EcologyPopulation Ecology
SizeSize – represented by N – represented by N DensityDensity – number of individuals per – number of individuals per
area – 100 buffalo/kmarea – 100 buffalo/km22
DispersionDispersion – how individuals are – how individuals are distributed – Clumped, uniform or distributed – Clumped, uniform or randomrandom
Age structureAge structure – abundance of – abundance of individuals at each age. Allows for individuals at each age. Allows for predictionspredictions

Dispersion PatternsDispersion Patterns

Age structure diagramsAge structure diagrams

Survivorship CurvesSurvivorship Curves
Type IType I – most individuals survive to – most individuals survive to middle age. Then mortality is high. middle age. Then mortality is high. HumansHumans
Type IIType II – length of survivorship is – length of survivorship is random. Hydrarandom. Hydra
Type IIIType III – most die young (oyster) – most die young (oyster)

Survivorship CurvesSurvivorship Curves
Population GrowthPopulation Growth
1.1. Biotic potentialBiotic potential – growth rate of the – growth rate of the population under ideal conditionspopulation under ideal conditions
• Age at reproductive maturityAge at reproductive maturity• Clutch sizeClutch size• Frequency of reproductionFrequency of reproduction• Reproductive lifetimeReproductive lifetime• Survivorship of offspringSurvivorship of offspring
Carrying CapacityCarrying Capacity
2. 2. Carrying capacityCarrying capacity – the maximum number – the maximum number of individuals that can be sustained in a of individuals that can be sustained in a habitathabitat
3. 3. Limiting factorsLimiting factors – factors that prevent a – factors that prevent a population from reaching its biotic population from reaching its biotic potentialpotential
• Density dependent factorsDensity dependent factors – increase as – increase as density increases. Ex. Parasites, density increases. Ex. Parasites, competition, toxic waste, predationcompetition, toxic waste, predation
• Density independent factorsDensity independent factors – natural – natural disastersdisasters
Growth PatternsGrowth Patterns
Exponential growthExponential growth – reproductive – reproductive rate is always above zero – J-shaped rate is always above zero – J-shaped curvecurve
Logistic GrowthLogistic Growth – when limiting – when limiting factors restrict population sizefactors restrict population size

Exponential GrowthExponential Growth
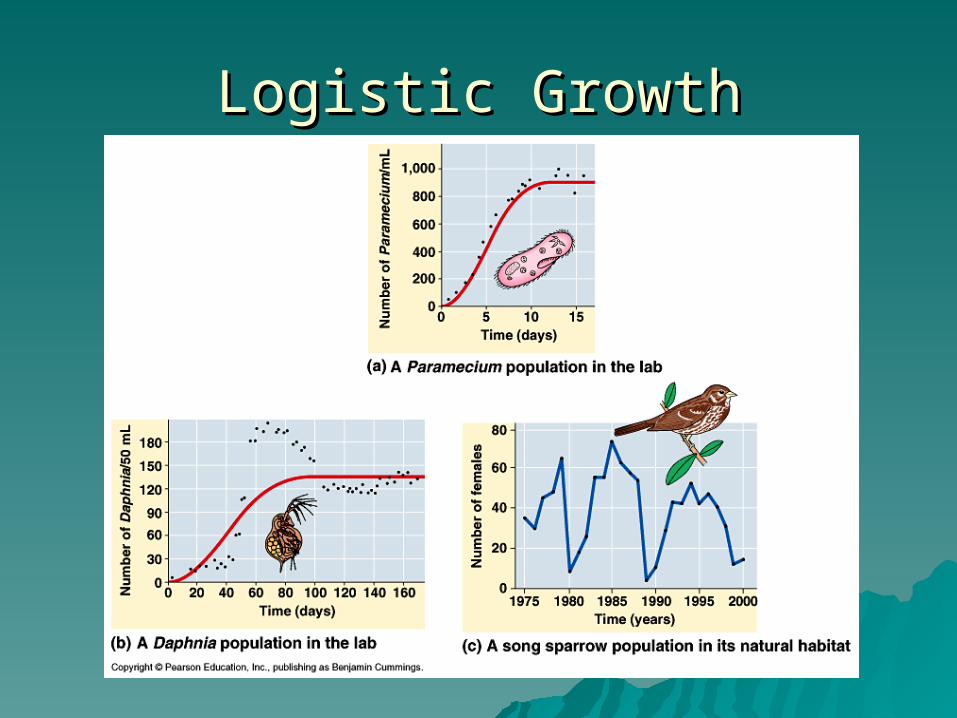
Logistic GrowthLogistic Growth

Predator/PreyPredator/Prey

Life StrategiesLife Strategies
r-selected speciesr-selected species – exhibits rapid – exhibits rapid growth – quickly invade a habitat, growth – quickly invade a habitat, reproduce, then die. Many offspring, reproduce, then die. Many offspring, small, require little parental care. small, require little parental care. Ex. InsectsEx. Insects
K-selected speciesK-selected species – size remains – size remains constant, small numbers of offspring, constant, small numbers of offspring, extensive parental care. Ex. extensive parental care. Ex. Humans, elephantsHumans, elephants