Population Ecology. Ecologists study life at many levels, from individual organism to the entire...
61
Population Ecology
-
Upload
chloe-riley -
Category
Documents
-
view
221 -
download
0
Transcript of Population Ecology. Ecologists study life at many levels, from individual organism to the entire...

Population Ecology
Ecologists study life at many levels, from individual organism to the entire biosphere.

Ecology: “eco” means house “ology”means study of.

Levels of organizationCells – Tissue-Organs – Organ systems -Organisms
Population – a group of individuals of the same species that live in the same area at a given time

Example: a group of white-tailed deer in an oak-hickory forest in southeastern PA

Community - groups of living organisms that interact with one another in a particular area.

Example: deer, mice, bushes and snakes in the forest community

Ecosystem: a community together with its physical environment
Biosphere: all parts of the earth that hosts life, with all of its organisms and environments.

Ecosystems include both biotic and abiotic factors. Biotic factors are parts of the ecosystem that are living.

Abiotic factors are parts of the ecosystem that are non-living.
Biotic factors:

Abiotic:
Organisms depend on resources provided by their habitat for survival.

The specific environment in which an organism lives is its habitat.
A habitat provides an organism with resources. A resource is anything an organism needs to survive.

Describing Populations….
The OVERALL health of a population can often be monitored by tracking how its size changes.

Population size describes the number of individual organisms present in a given population at a given time.

Population Ecology
Deals with the # of individuals of a particular species that are found in an area and how and why those numbers change or remain fixed over time.

Population ecologists study…
How populations respond to its environment
Competition for resources, predations, disease and other environmental pressures

Determine population size by sampling. Instead of counting every individual, ecologists count every organism in a small area than estimate the number of individuals in the larger area.

Population density describes the number of individuals within a population per unit area.
For example: 1500 golden toads per 4 sq. kilometers
In general, larger animals have lower population density because they need more resources.

High population density can make it easier to find mates and group together. However, it also leads to more competition for resources.

Overcrowded organisms can also lead to increase of disease and vulnerable to predators.

Age structure diagrams show the number of males & females in different age groups within a population.
Age structure describes the relative number of organisms of each age with in a population.
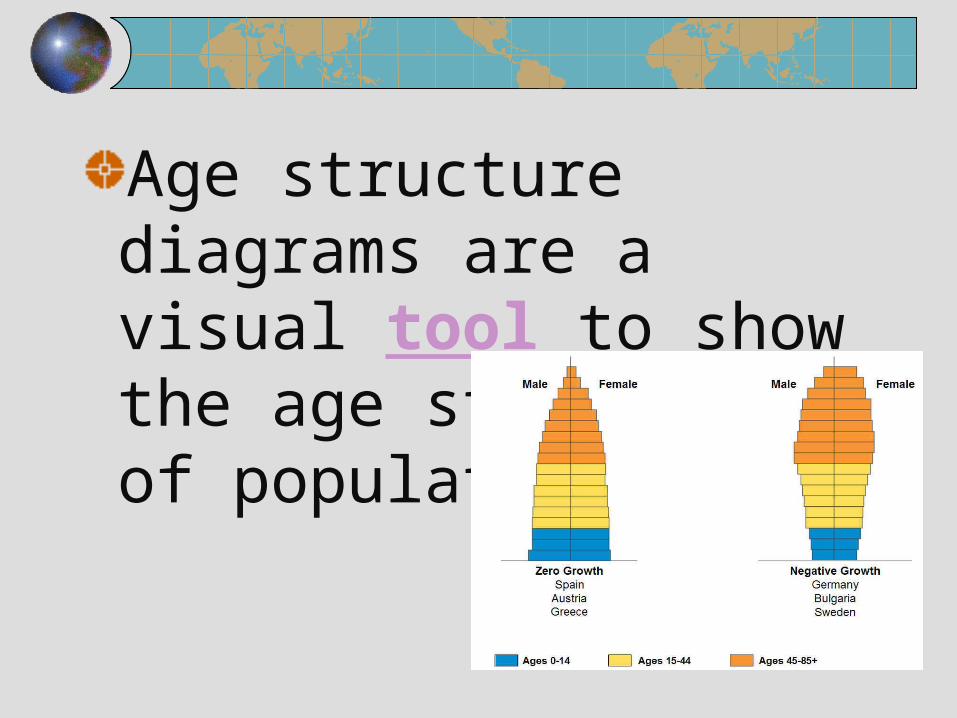
Age structure diagrams are a visual tool to show the age structure of populations.
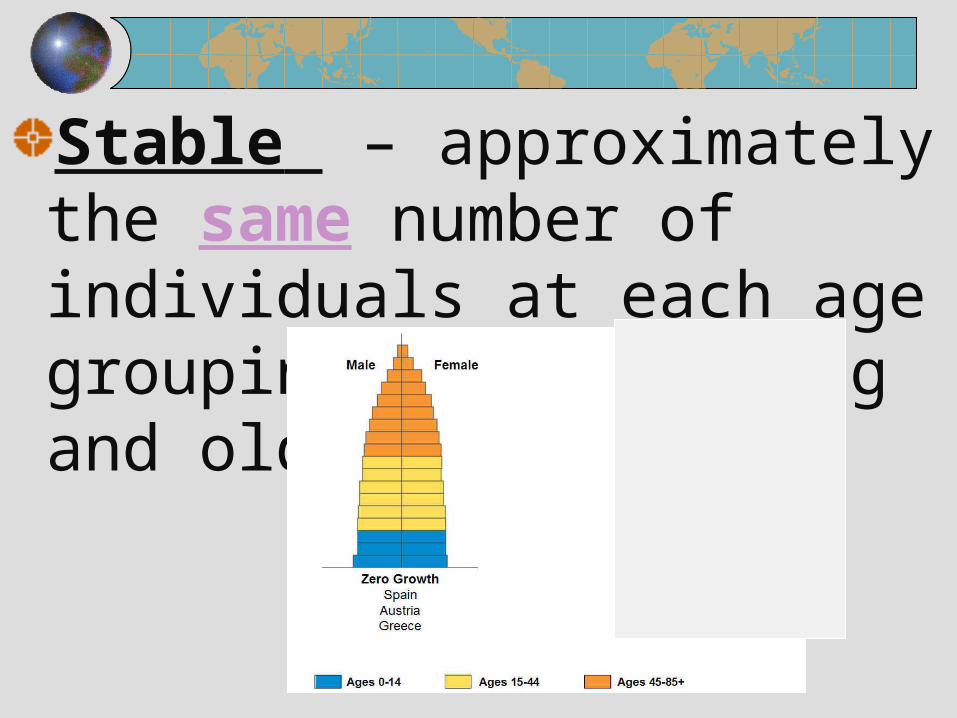
Stable – approximately the same number of individuals at each age grouping, mix of young and old
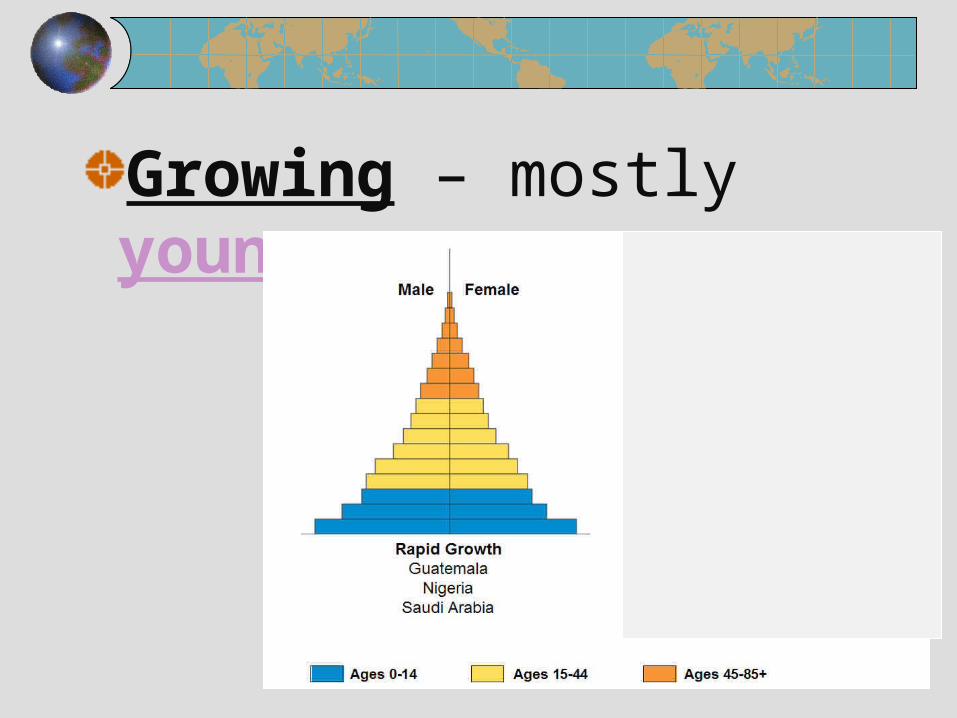
Growing – mostly young
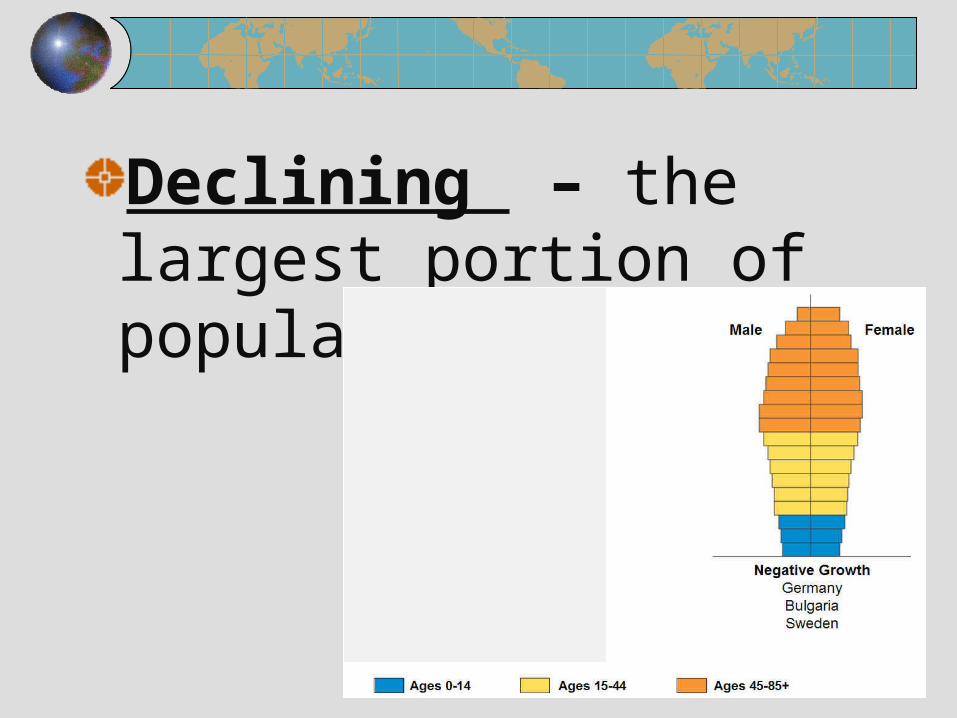
Declining – the largest portion of population is older

A population’s growth rate is determined by births, deaths, immigration and emigration.
All things being equal, when a population birthrate is greater than its death rate, population size will increase.
When death rate is greater than its birth rate, population size will decrease.

In addition to births & deaths, population size can also change by individuals moving in & out.

Immigration – movement of individuals into a populationEmigration – movement of individuals into a population

Birthrate – number of live births per 1000 in a given yearDeath rate – number of deaths per 1000 in a given year

CALCULATING GROWTH RATE
Growth rate (r) = birth rate (b)+ I – death rate (d) + E

Population growth is typically reported as a net change per 1000 individuals.

Exponential growth is when a population increases by a fixed percentage each year.

Exponential growth occurs in nature only when the starting population is small & the environmental conditions are ideal.

This type of growth usually does not last long. Most populations are constrained by limiting factors.

Limiting factors are characteristics of the environment that limit population growth. Limiting factors determine a population’s carrying capacity.

Example: New population is introduced…mold growing on bread.

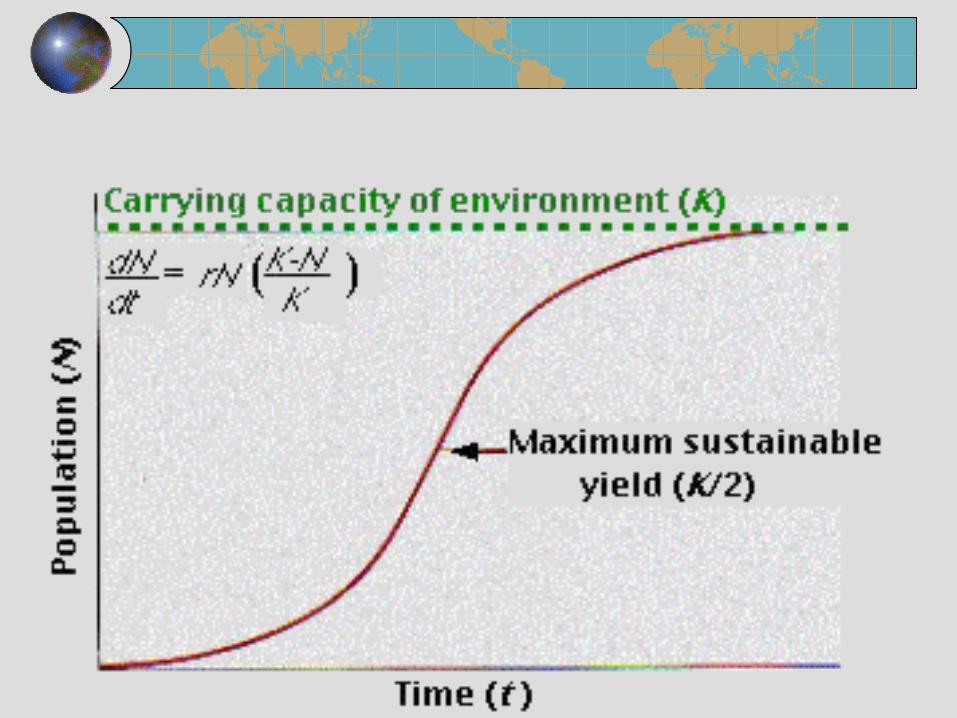
Logistic Growth describes how a population’s initial exponential increase is slowed & finally stopped by limiting factors.

Carrying capacities are not fixed. Carrying capacity is the largest population size a given environments can sustainably support.

Examples of limiting factors:
1) Food 2) Disease3) Predators4) Space5) Water
Limiting factors have more of an effect in dense populations & other limiting factors affect all populations in the same way.

Density–DEPENDENT factor:
factors that limits the population size or density
Disease (example: HIV)CompetitionPredatorsParasitesFood
Density INDEPENDENT factor: affect ALL populations, regardless of size of the population

TemperatureStormsFloodsDroughtVolcanic eruption

Biotic potential is the maximum ability to produce offspring in ideal conditions.

Biotic potential is based on…
• Age at which reproduction takes place
• % of life span that an organism can reproduce
• Number of offspring in each reproduction period
• Generally larger animals have a lower biotic potential than microscope organisms.
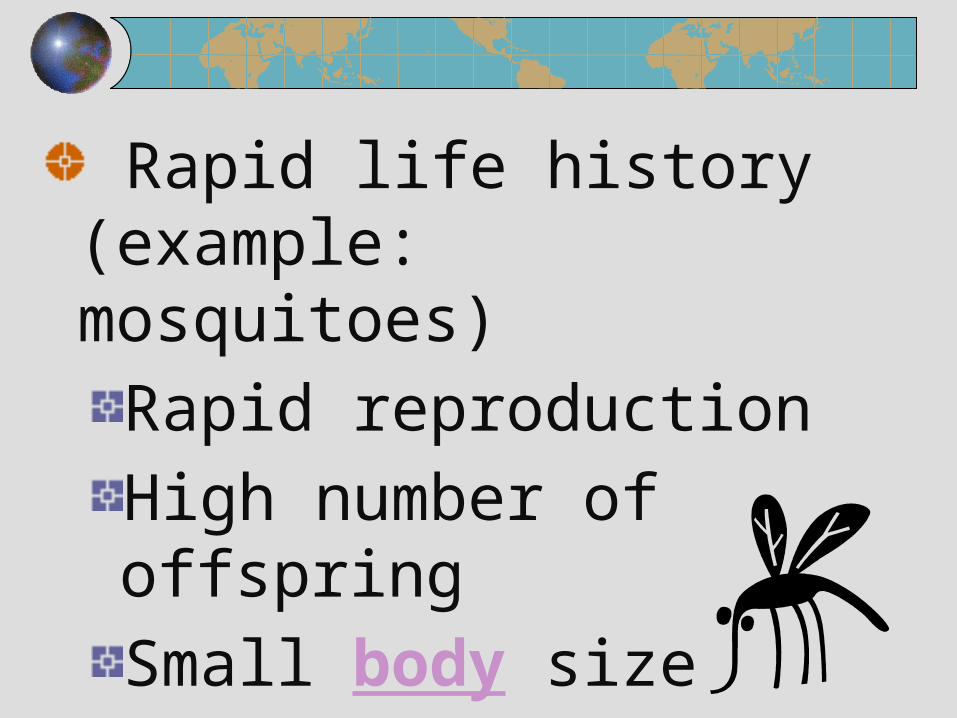
Rapid life history (example: mosquitoes)
Rapid reproductionHigh number of offspringSmall body size

Small body sizeOrganisms mature rapidlyReproduce earlyOrganisms have a short life span
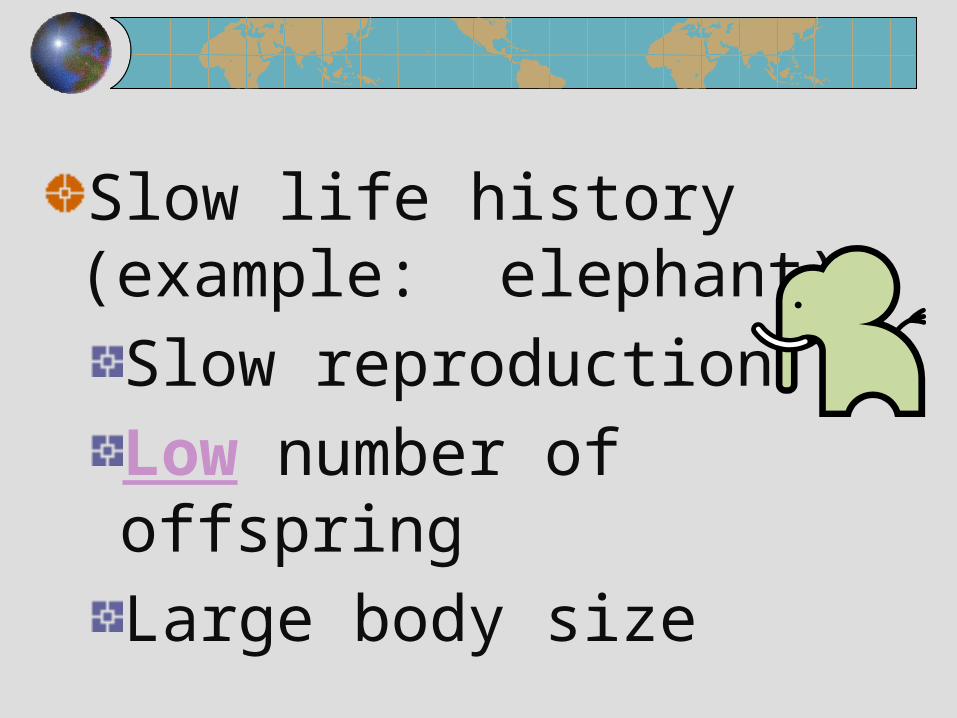
Slow life history (example: elephant)
Slow reproductionLow number of offspringLarge body size
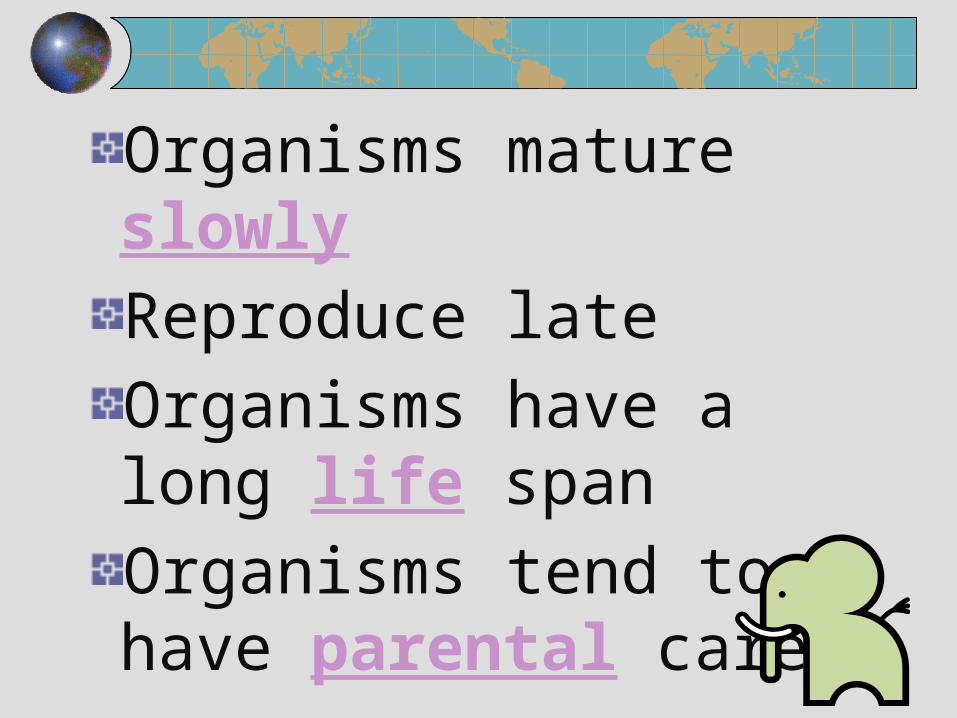
Organisms mature slowlyReproduce lateOrganisms have a long life spanOrganisms tend to have parental care