APHG U2 Population Density Arithmetic Density Physiological Density Agricultural Density.

Coastal areas are the most developed in the nation. This narrow fringe–comprising17% of the contiguous U.S. land area–is home to more than 53% of the nation'spopulation. Further, this coastal population is increasing by 3,600 people per day,giving a projected total increase of 27 million people between now and 2015.
To cite this material. This material has been produced by the Government of theUnited States of America and holds no copyright.
The following reference format is suggested:
National Oceanic and Atmospheric Administration (NOAA). 1998 (on-line)."Population: Distribution, Density and Growth" by Thomas J. Culliton. NOAA'sState of the Coast Report. Silver Spring, MD: NOAA.
URL: http://state_of_coast.noaa.gov/bulletins/html/pop_01/pop.html

Coastal areas are crowded and becoming more so every day. More than139 million people–about 53% of the national total–reside along thenarrow coastal fringes. This population is expected to increase by anaverage of 3,600 people per day, reaching 165 million by the year 2015.This rate of growth is faster than that for the nation as a whole.
Photo 1. More than 53% of the U.S. population lives in the coastalzone.
Their population growth and related development place many of theNation's coastal areas under increasing pressure. Growth brings jobs,creates economic prosperity, adds new industries, improves regionalinfrastructure, enhances educational opportunities, and increases taxrevenues. It also burdens local environments, however. For example,population pressures include increased solid waste production, highervolumes of urban nonpoint runoff, loss of green space and wildlifehabitat, declines in ambient water quality, and increased demands forwastewater treatment, potable water and energy supplies. Ironically, as thecoastal population grows, the natural features that may have attractedpeople to the coast are lost or diminished.
The challenges of assimilating increasing numbers of people along thecoast while minimizing the potential environmental degradation fromdevelopment are considerable. Communities are trying new ways tomitigate the impact of population growth. Maryland's "Smart Growth"program, for example, restricts state spending on roads, sewers, schools,and other public infrastructure to areas adjacent to Washington, DC andBaltimore, and established cities and towns across the state. The objectiveis to preserve over 500,000 acres of open space and farmland. In Florida,Oregon, and New Jersey, rules have been adopted to lessen theenvironmental impacts of development and to preserve open space. In

Photo 2. Population growth brings economicprosperity to the coast, but diminishes thenatural features of the coastal environment.
Orlando, Florida, the city government has entered into partnership with theowners of several tracts southeast of the city. The purpose is to developthe large parcel (12,000 acres) in a manner that preserves more than 40%of the total land area as parks or natural open spaces in a clustered pattern(Ewing, 1997).(top)

The Crowding of Our Shorelines
Coastal areas are becoming more crowded every year in the United States.In 1960, an average of 187 people were living on each square mile ofcoastal land (excluding that in Alaska). This population density increased to273 persons per square mile by 1994, and is expected to reach 327 by2015. Population densities are highest along the East Coast, especially inthe Northeast.
Photo 3. The coastal zone is only 17% of the land area of the UnitedStates, yet its population outnumbers the interior by 16 million.
There are 673 coastal counties in the United States: 285 in the Atlantic, 142in the Gulf of Mexico, 88 in the Pacific, and 158 in the Great Lakes region.These counties are classified as coastal because they are located entirely orpartially within the nation's coastal watersheds. Coastal counties accountfor about 17% of the land area in the contiguous United States. Countiesthat are located inland from coastal watersheds, i.e., the 2,470 noncoastalcounties, account for 83% of the land area.
The population on the coast outnumbers the population of the nation's vastnoncoastal interior by over 16 million people. The noncoastal population,numbering about 122 million, is distributed across the majority of thenational land area. The noncoastal population today is similar in density tothe coastal population of the early 1980s. Appendix A lists population databy coastal county between 1960 and 1994.

Photo 5. The populations of seven Florida countieswill increase over 45% by the year 2015 (see Table1).
Photo 4. The coastal zone contains 14 of the Nation's 20 mostpopulous cities.
The coast includes the nation's most populous cities. In fact, 14 of the 20largest cities are located in the coastal zone. The population in seven ofthese cities exceeds one million people. The surrounding suburban areas,however, are experiencing the most rapid growth. For example, Howardand Charles Counties in Maryland and Prince William and Fairfax Countiesin Virginia–all located within the Washington, DC metropolitan area–havegrown considerably during the past 20 years.
Coastal counties lead in many demographic indicators. During the lastdecade, 17 of the 20 fastest growing counties were located along the coast.In addition, the coast accounts for 19 of the 20 most densely populatedcounties in the country. Coastal counties are also undergoing moredevelopment than noncoastal areas, as they include 16 of the 20 countieswith the largest number of new housing units under construction. With 18of the 20 leading counties in per capita income located along the coast,these counties are also among the nation's wealthiest (Bureau of theCensus, 1994a).(top)
Hot Spots of Growth
Between 1994 and 2015, the largest coastal population increases areexpected to be in southern California, Florida, Texas, and Washington(Figure 1). Ten counties will account for almost one-third of all anticipatedcoastal population growth (Table 1). The largest population increases areprojected for Los Angeles (1.6 million) and San Diego (1.3 million)Counties in California and Harris County (Houston, 1.3 million) in Texas.
Table 1. Leading counties in population growth,1994-2015
County
PopulationChange,
1994-2015 County
PercentChange in
Population,1994-2015
1. Los Angeles,CA
1,603,499 1. Flagler, FL 55
2. San Diego, CA 1,280,284 2. Hernando, FL 543. Harris, TX 1,264,147 3. Citrus, FL 514. Orange, CA 825,281 4. Charlotte, FL 505. Riverside, CA 813,505 5. Osceola, FL 50

6. SanBernardino,CA
760,098 6. Collier, FL 50
7. Broward, FL 633,323 7. Dillingham, AK 498. Dade, FL 585,892 8. Pasco, FL 469. Palm Beach,
FL 575,424 9. Prince of
Wales-OuterKetchikan, AK
45
10. King, WA 572,869 10. Matanuska-Susitna,AK
45
Sources: Bureau of the Census, 1997; NPA Data Services, Inc., 1995.
Many areas along the coast have grown rapidly from a small populationbase in the past few decades. Rapid population growth has occurred since1960 in vacation and retirement communities in Florida, especially along itswestern coast. Rapid rates of growth have also occurred in "exurban"counties such as Prince William (VA), Stafford (VA) and Calvert (MD),located along the Washington, DC metropolitan area's outer fringe. Dare(NC), Dorchester and Berkeley (SC) and Virginia Beach (VA) Countiestypify southeastern counties where economic development and relocatingretirees are fueling rapid population growth.
Many of the nation's most rapidly growing counties are in Florida.Duringthe past several years, the state's population has increased by about 4,400people per week. Large numbers of people have flocked to the Miami-Ft.Lauderdale metropolitan area, as well as to Florida's southwest coast.
Growth along the southern California coast–from Santa Barbara to SanDiego–has also been rapid, averaging about 4,000 newcomers every week.This area's population is expected to increase by 5.6 million people overthe next 20 years. The southern California coastal population is projected toreach almost 24 million by 2015.(top)
Trends in Growth
Coastal population growth includes both a movement toward the shore andthe expansion of a large population base. Coastal population grew rapidlyin the 1960s and 1980s. In the 1960s, coastal population soared by 16%,from 95 million people to over 110 million; in the 1980s, the populationgrew another 11% (14 million). Population increases during the 1990s andbetween 2000 and 2010 are projected to increase be about 9% (12 to 13million people) in each decade.
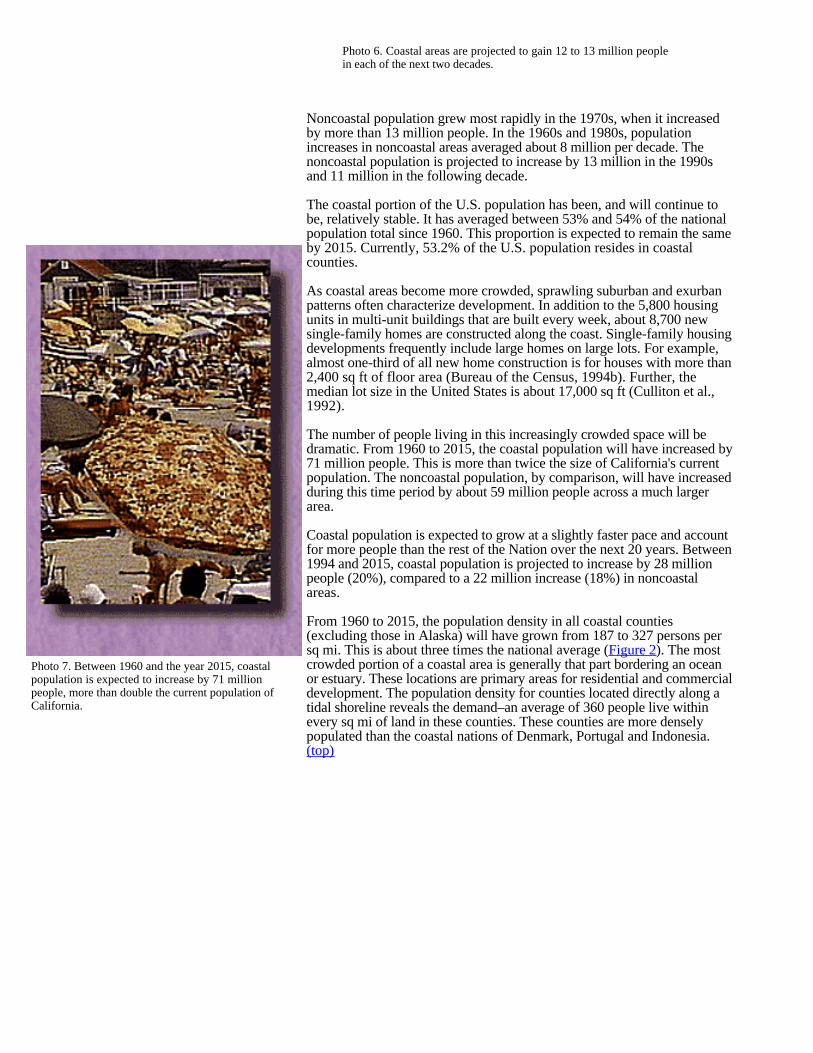
Photo 7. Between 1960 and the year 2015, coastalpopulation is expected to increase by 71 millionpeople, more than double the current population ofCalifornia.
Photo 6. Coastal areas are projected to gain 12 to 13 million peoplein each of the next two decades.
Noncoastal population grew most rapidly in the 1970s, when it increasedby more than 13 million people. In the 1960s and 1980s, populationincreases in noncoastal areas averaged about 8 million per decade. Thenoncoastal population is projected to increase by 13 million in the 1990sand 11 million in the following decade.
The coastal portion of the U.S. population has been, and will continue tobe, relatively stable. It has averaged between 53% and 54% of the nationalpopulation total since 1960. This proportion is expected to remain the sameby 2015. Currently, 53.2% of the U.S. population resides in coastalcounties.
As coastal areas become more crowded, sprawling suburban and exurbanpatterns often characterize development. In addition to the 5,800 housingunits in multi-unit buildings that are built every week, about 8,700 newsingle-family homes are constructed along the coast. Single-family housingdevelopments frequently include large homes on large lots. For example,almost one-third of all new home construction is for houses with more than2,400 sq ft of floor area (Bureau of the Census, 1994b). Further, themedian lot size in the United States is about 17,000 sq ft (Culliton et al.,1992).
The number of people living in this increasingly crowded space will bedramatic. From 1960 to 2015, the coastal population will have increased by71 million people. This is more than twice the size of California's currentpopulation. The noncoastal population, by comparison, will have increasedduring this time period by about 59 million people across a much largerarea.
Coastal population is expected to grow at a slightly faster pace and accountfor more people than the rest of the Nation over the next 20 years. Between1994 and 2015, coastal population is projected to increase by 28 millionpeople (20%), compared to a 22 million increase (18%) in noncoastalareas.
From 1960 to 2015, the population density in all coastal counties(excluding those in Alaska) will have grown from 187 to 327 persons persq mi. This is about three times the national average (Figure 2). The mostcrowded portion of a coastal area is generally that part bordering an oceanor estuary. These locations are primary areas for residential and commercialdevelopment. The population density for counties located directly along atidal shoreline reveals the demand–an average of 360 people live withinevery sq mi of land in these counties. These counties are more denselypopulated than the coastal nations of Denmark, Portugal and Indonesia.(top)

The following discussion addresses contrasts among five regions:Northeast (Maine to Maryland); Southeast (Virginia to eastern Florida);Gulf of Mexico (western Florida to Texas); Pacific (California toWashington, plus Alaska and Hawaii); and Great Lakes (western NewYork to Minnesota).
Coastal population trends show that the regions with warmer climates–theSoutheast, Gulf of Mexico, and Pacific–have grown most rapidly in recentdecades and will continue to do so in the near future. The Northeast andGreat Lakes regions have experienced far less rapid growth.
Population Distribution
The Northeast currently accounts for about one-third of the coastalpopulation (44 million people). Its population density of 654 persons persq mi is more than double that of any other region. The Pacific region(25%) is the next most heavily populated, with a density of 266 personsper sq mi (excluding Alaska). The Great Lakes (19%), Southeast (12%),and Gulf of Mexico (12%) account for a smaller share of the coastalpopulation. Of these three regions, population density is highest in theGreat Lakes (229 persons per sq mi) and lower in the Southeast (209persons per sq mi) and the Gulf of Mexico (142 persons per sq mi).(top)

Photo 8. The Northeast region, including this area of Maryland,has the highest population density in the United States.
Population Trends
Coastal population changes over time reveals several interesting trends. Forexample, projections indicate that the Pacific (28%), Southeast (14%), andGulf of Mexico (13%) regions will account for larger shares of the coastalpopulation in 2015. Each region is expected to increase by about one-third.The Northeast and Great Lakes regions will account for a smaller share ofthe coastal population. Although the population of the Northeast isprojected to increase by 2.9 million people between 1994 and 2015, it willaccount for only 29% of the U.S. coastal population, a decrease from 32%in 1994. The Great Lakes share of the coastal population will show asimilar trend by declining from 19% in 1994 to 17% in 2015 (Figure 3).
The Pacific region, with the third highest population among the regions in1960, is projected to have a population almost equal to the Northeast's by2015. From 1960 to 2015, the Pacific region's population will grow bymore than 28 million people–a 158% increase. The Southeast and the Gulfof Mexico regions can also expect rapid increases. The coastal Southeastaccounted for about 8 million people in 1960, but the number will soar toalmost 23 million by 2015–a 188% population increase. Likewise, the Gulfof Mexico is projected to increase from 8 million in 1960 to 22 million(175%). The Northeast will increase by 30%, from 37 million to 48million, and the Great Lakes by 17%, from 24 million to almost 28 millionduring this time frame.(top)
Trends in Housing Construction
The growth in housing construction dovetails with population trends. TheNortheast and Southeast regions together accounted for 8.2 million newhousing units between 1970 and 1994. The Pacific region accounted for5.2 million new units; the Gulf of Mexico region, 2.9 million units; and theGreat Lakes region, 2.6 million units.
Single-family homes make up about 60% of all new housing along thecoast. About 453,000 new single-family homes are constructed in coastalareas every year. Multi-unit dwellings (e.g., duplexes, condominiums,apartments) are built at the rate of 303,000 units per year.
More than 62% of all new housing starts along the Atlantic Coast and in theGreat Lakes region are for single-family dwellings. Multi-unit buildings aremore common in the Pacific Region; only 55% of new housingconstruction is for single-family homes.
The most dramatic growth since 1970 has occurred in Florida andCalifornia, where an estimated 7.6 million housing units were authorizedfor construction. Nearly 40% of all new housing construction along theU.S. coast occurs in these two states.(top)

Photo 9. Construction in Florida andCalifornia has accounted for 40% of all newhousing in coastal areas since 1970.
Photo 11. Seasonal housing in the UnitedStates is most heavily concentrated in theNortheast.
Seasonal Housing
The heaviest concentration of seasonal housing lies along the NortheastCoast, particularly on the barrier islands. In 1997, about 484,000 seasonalhomes (e.g., single-family homes, cottages, condominiums) are locatedalong the northeastern seaboard. More than one-fifth of these seasonaldwellings are concentrated along the New Jersey shore. Massachusetts(18%), New York (17%) and Maine (16%) also account for large shares ofsecond homes along the Northeast Coast.
Photo 10. Forty-one percent of all seasonal homes in theSoutheast region are found in the area between West Palm Beachand Miami.
More than 63% of seasonal housing in the Southeast is located along theFlorida coast. The area from West Palm Beach to Miami is one of thenation's leading tourist destinations, and accounts for 41% of all seasonalhomes from Virginia to Florida's southeast coast. North Carolina andSouth Carolina account for much of the remaining seasonal housing in theregion.
In the Gulf of Mexico, western Florida accounts for almost 70% of allseasonal dwellings. Rapid development has occurred along the state'ssouthwest coast in recent decades. For example, almost 14,000 newseasonal homes were constructed near Ft. Myers in the 1980s. Another10,000 seasonal dwellings were constructed in Collier County, home tosuch beach resorts as Marco Island and Naples.
Seasonal housing in Pacific coastal counties is most heavily concentrated inCalifornia, with about 60% of all seasonal dwellings in the Pacific regionlocated in the state. Most of the state's seaside homes are in the greater SanDiego and Los Angeles areas. The state of Washington accounts for about19% of second homes in this region. Hawaii, a tourist mecca, surprisinglyrepresents only 6% (12,876 units) of the regional total.
Michigan's extensive shoreline rimming the Great Lakes makes it theregional leader in seasonal housing. It accounts for 56% of all coastalseasonal dwellings in the region. New York (16%) and Wisconsin (13%)host many of the remaining second homes in the region.(top)

South Florida
The 16 counties of South Florida lie roughly within the area that extendsfrom Lake Okeechobee, south through the Everglades, and into the FloridaKeys. This diverse ecosystem includes wetlands, forested uplands,mangroves, beaches, and coral reefs. At one time, wetlands dominated theecosystem, covering much of central and southern Florida (South FloridaEcosystem Restoration Task Force, 1994).
Photo 12. The population explosion in South Florida hasdramatically changed the landscape from expansive wetlands toheavily developed communities.
Florida's population explosion began after World War II. In 1940, the statehad a population of 1.8 million; by 1996, the population had reached 14.3million, an increase of almost 700%. Much of this growth has been alongFlorida's lower east coast, an area that currently accounts for about 4.5million people. Dade County, which includes Miami, grew from more than267,000 in 1940 to over 2 million people by 1994 (Bureau of the Census,1996).
This expanding human presence has dramatically changed the SouthFlorida ecosystem. The construction of canals, levees, pumping stationsand water diversion/flood control structures that began in the late 1800s andcontinued through the 1960s has altered the area's natural hydrology. As aresult, problems in both water quality and water quantity have developed in

South Florida's natural systems, including the Everglades and itsassociated estuaries. In addition, while agricultural and urban demands onwater sources have been increasing, the conversion of land to agriculturaland urban uses, and the shunting of fresh water formerly stored inwetlands, soils and aquifers have reduced the water supply (South FloridaEcosystem Restoration Task Force, 1994).(top)
Puget Sound
Another rapidly developing coastal area is Puget Sound, Washington. In1940, the area's population totaled 860,000. It has increased by about400,000 people every 10 years since then. The area is now home to about3.2 million people. Rural areas are being engulfed by housing andcommercial developments. Forests and meadows are being replaced byroads, homes, office buildings and shopping malls. Keeping Puget Soundhealthy is a more and more difficult task.
Photo 13. Seattle has grown by 1.5 million people over the last30 years.
The area's population is expected to increase by another 1.4 million people,reaching 4.6 million in the year 2015. The fastest growing areas includeIsland County to the north and Thurston County to the south. Thepopulation of King County, in which Seattle lies, is expected to increase by26% to 2.2 million people by 2015. It already ranks 10th among coastalcounties in terms of absolute population, which makes it larger than thecoastal population for 11 states.
Seattle comprises about 9% of the Pacific population total. The Seattlearea's population has increased by 98% or 1.5 million people since 1967.An average of 1,100 people are moving into the Seattle metropolitan areaevery week.
Development is also rapid along the Puget Sound coast. An average of 500new homes are constructed every day, with single-family homesaccounting for about 55% of all new housing development in the region.
Growth along the edges of Puget Sound has created a number of concerns.Monitoring studies have shown significant increases of chemicalcontaminants in the tissues of birds and salmon. Fecal contamination hasclaimed over 40% of Puget Sound's commercial shellfish beds (more than

Photo 14. An expanding population increaseswastewater flows to the Chesapeake Bay.Improved wastewater treatment and a ban onphosphorus-containing detergents have reducedpoint sources of phosphorus by 70% since the1970s.
half of the restrictions coming in the last decade) (Puget Sound On-line,1997). Nearshore habitats are also being lost; for example, studies havedocumented a 73% decline in the Puget Sound salt marshes.
To combat these problems, the State of Washington developed a series ofwater quality initiatives that started in the 1980s. Monitoring has revealedthat the status of the Sound has not changed much since 1991. The fact thatwater quality has stabilized may be due to the ongoing efforts of state andlocal governments, citizens, tribes, businesses and others to preventpollution. The state legislature recently provided $4.4 million in additionalfunding for technical assistance to local governments to improve the healthof Puget Sound's shellfish; correct failing on-site sewage systems; andimprove scientific monitoring of water quality, habitat and resources (PugetSound On-line, 1997).(top)
Chesapeake Bay and Maryland
The population of Maryland changed from about 3.6 million in 1960 toalmost 5.2 million in 1994–an increase of about 3,900 people per month.This growth has yet to abate; to the contrary, an increase of 880,000 peopleis projected for the state's coastal counties between now and 2015.
Such growth had an enormous impact on the Chesapeake Bay, the largestestuarine system in the United States. The Bay's watershed, radicallychanged by European settlement three centuries ago, continues to undergochanges that reflect land use across this 64,000-sq-mi expanse. Urban,suburban and agricultural lands all leach more pollutants into the Bay thannatural forests or wetlands. About 40% of the land is no longer in itsnatural state, and wetlands are still being lost at a rate of about 8 acres perday (Chesapeake Bay Program Home Page, 1997).
An ever-expanding population has resulted in higher wastewater flows tothe Bay. Through increased wastewater treatment and a ban ofphosphorus-containing detergents, point sources of phosphorus have beenreduced by 70% since a peak in the 1970s–despite a 40% increase in flows.Recently implemented controls of nitrogen are already reducing the levelsof this pollutant entering the Bay from point sources, such as industries andmunicipal sewage treatment plants (Chesapeake Bay Program Home Page,1997).
The Maryland state legislature recently passed a bill, referred to as the"Smart Growth" legislation, to discourage low-density suburbandevelopment. The legislation earmarks state funding of infrastructure (e.g.,roads, sewers, schools) for new development to "growth areas" along theWashington-Baltimore metropolitan corridor and to established cities andtowns. Any development outside these growth areas would not receivestate support (Sustainable Communities Network, 1997).
A major objective of the legislation is to preserve Maryland's agriculturallands and green space. Without the legislation, it was feared that somehalf-million acres of open space and farmland would be lost over the next20 years (Sustainable Communities Network, 1997). Land use in thewatershed is far more than an aesthetic concern; it is a basic factor in theecological "health" of the Bay. Trees filter sediment and nutrients fromrunoff, and their roots stabilize the shoreline and reduce erosion. Byshading the water, riparian forests also reduce summer water temperatures,increasing dissolved oxygen levels. Limits on development reduce pollutantlevels carried in stormwater runoff, as well as the volume of wastewaterand solid waste requiring disposal (Chesapeake Bay Program, 1995).

Photo 15. Maryland's "Smart Growth" legislation was passed topreserve agricultural lands and open space by earmarking statefunds for public infrastructure to designated "growth areas" andestablished cities and towns.
(top)

The four individuals below are experts in the topic of Population:Distribution, Density and Growth. Here they voice their opinions on twoquestions relevant to that topic.
Question 1 – What can we do to limit the environmental impactsfrom increasing population growth in coastal areas? Pleaseprovide examples. Question 2 – How do increases in seasonal population affectcoastal environmental quality? What examples can you provide?
Experts
Sarah Cooksey WilliamMatuszeski Orrin Pilkey Niels West

Sarah Cooksey
Administrator, Delaware Coastal ManagementProgram, Delaware Department of NaturalResources and Environmental Control
Ms. Cooksey has been involved in environmental protection for the past 15years. For the past five years, she has been head of the Delaware CoastalManagement Program; for the past two years, manager of the DelawareNational Estuarine Research Reserve. Ms. Cooksey was also employed for anumber of years by the U.S. Environmental Protection Agency inWashington, D.C. where she worked with state governments on waterpollution control.
Response to Question 1
Response to Question 2
(top)
Question 1. What can we do to limit the environmental impactsfrom increasing population growth in coastal areas? Pleaseprovide examples.
Click here for audio response
(audio requires RealPlayer, see Using this Site)
To limit environmental impacts from increasing population, managers must dotwo things. We must provide incentives for responsible stewardship andliability for environmental impacts. The incentives range from financialcompensation for environmental protection to instilling in people a sense ofgood will toward coastal resources. Specific incentives would:
Provide mass transit at low cost and convenient locations to enticepeople out of their cars. Instill in all citizens an environmental stewardship ethic. Make people aware that they are causing the impacts and that they canhelp minimize them. Use our systems of reserves to provide lawmakers, homeowners,business owners, and developers education about sustainable coastalresources.
The provision for liability generally involves money. It would mean:
For every parcel of critical habitat lost or significantly altered, requiredouble in compensation. Not allowing development that impacts water or beaches that isnon-water/beach dependent. Requiring all housing developments to be on sewers, then requirenutrient removal, then limit discharge capacity. Enacting stream corridor protection requirements. Requiring open space for wildlife in all developments. Practicing pollution prevention.
Education is critical; enforcement is required; funding is mandatory.(top)
Question 2. How do increases in seasonal population affectcoastal environmental quality? What examples can you provide?
Click here for audio response
(audio requires RealPlayer, see Using this Site)
I have a lot of personal experience with seasonal population increase since Ilive near the "Summer Capital of the U.S.," Rehoboth Beach, Delaware.Seasonal population increases affect all aspects of the coastal environment.When the season starts, there is a noticeable decrease in wading birds and

shorebirds along our tidal and beach areas. This is due to boating traffic andpeople traffic. Solid waste increases along our roadsides. Cigarette butts clogstorm drains. Sewer discharges increases two orders of magnitude,exacerbating the nutrient loads of our already eutrophic Delaware InlandBays. We continue to be in an "ozone nonattainment area" because eventhough stationary air pollution controls are decreasing emissions, mobilesources are increasing.
We are also losing a sense of a coastal heritage. In many ways, people aren'tcoming to the beach to enjoy coastal resources. They are coming to shop.Outlet malls are becoming a large land use. Some people come to the beachand don't even see the water. Coastal environmental quality decreases, andsome people don't even know what they are missing. While some impacts arelessened by the end of September when most of the people leave, the marketfor second homes has caused permanent loss of coastal resource habitat.(top)
William Matuszeski
Director, Chesapeake Bay Program, U.S.Environmental Protection Agency
Mr. Matuszeski has been with the Chesapeake Bay Program Office since1991. Prior to that, he spent several years with water programs at theheadquarters office of the U.S. Environmental Protection Agency. From thelate 1970s to late 1980s, he was with the National Oceanic and AtmosphericAdministration, where he served as Director of State Programs in the Officeof Ocean and Coastal Resources Management and as the Executive Director ofthe National Marine Fisheries Service.
Response to Question 1
Response to Question 2
(top)
Question 1. What can we do to limit the environmental impactsfrom increasing population growth in coastal areas? Pleaseprovide examples.
Click here for audio response
(audio requires RealPlayer, see Using this Site)
It's important to realize that the problems we face in coastal areas are lessrelated to the numbers of people than to the way we choose to live. Certainly,we have the technology to accommodate even larger numbers of people ineven fragile areas like our coastlines, provided we are willing to change ourpatterns of land consumption, auto dependency and housing design. But theseare very big "ifs." Our underlying challenge is to change people's values. Tenyears ago no one would have predicted that Americans would buy wholesalethe idea of recycling bottles and cans. We need to bring about a similar changein thinking about how we live on the land and share the limited naturalresources of our coasts. The big home on the oversized lot with a lawn downto the water should become as out-of-date as throwing beer cans out of thegas guzzler. It shows the same level of respect for our environment.(top)
Question 2. How do increases in seasonal population affectcoastal environmental quality? What examples can you provide?
Click here for audio response
(audio requires RealPlayer, see Using this Site)
One major effect of seasonal development relates to the handling of

wastewater. Influxes of people require that these systems be capable ofhandling high flows. Continued reliance on septic tanks can overload coastalwaters with nitrogen, exacerbating the largest single estuarine water qualityproblem in the U.S., which is eutrophication. If modern sewer systems areintroduced, the capacity required to handle seasonal influxes can overburdenthe small number of taxpayers, thereby creating pressures for moredevelopment to share the cost of the large capacity systems. This can quicklychange the character of coastal areas and cause the loss of the very amenitiesand natural resource values which attract people.(top)
Orrin H. Pilkey
James B. Duke Professor of Earth Sciences,Division of Earth and Ocean Sciences, DukeUniversity and Director of the Duke UniversityProgram for the Study of DevelopedShorelines
Dr. Pilkey has taught and conducted research at Duke University for over 30years. Prior to joining the faculty at Duke University, he spent three years atthe University of Georgia Marine Institute. His expertise centers on both basicand applied coastal geology, primarily on barrier island coasts. Specific topicsof Dr. Pilkey's research include beach nourishment, validity of mathematicalmodels in predicting beach behavior and hazard mapping.
Response to Question 1
Response to Question 2
(top)
Question 1. What can we do to limit the environmental impactsfrom increasing population growth in coastal areas? Pleaseprovide examples.
Click here for audio response
(audio requires RealPlayer, see Using this Site)
The best way to limit the environmental impact from increasing population isto limit the increasing population. This is a very difficult thing to do. Perhapsone way to go about this is to slow down development, especiallyhigh-density development such as high rises and multifamily buildings thatare not there now. It would be very, very useful not to allow them to be built.
Another way to limit population's environmental impact is not to rebuilddestroyed buildings after storms. In my view, Hurricane Fran was an urbanrenewal project for Topsail Island, North Carolina. We should understandhow the islands "work" and try to live with them rather than live on them. Forexample, when storm overwash pushes sand onto an island, it should not bedumped back to the sea. The elevation of that island should be allowed to riseby the height of the sand that was deposited during the storm. In Rodanthe,North Carolina, a recent storm put four to five feet of sand over manysections of the town. The island is trying to increase its elevation in order torespond to the rising sea level.
Another approach is to work with nature on the back sides of barrier islandsor along the lagoon shorelines. Instead of building seawalls, construction ofsalt marshes will help improve water quality, provide habitat for fisheryresources and, at the same time, prevent or at least greatly reduce shorelineerosion.(top)
Question 2. How do increases in seasonal population affectcoastal environmental quality? What examples can you provide?
Click here for audio response

(audio requires RealPlayer, see Using this Site)
In my view, most coastal communities, especially tourist communities, andthis is most of the coastal communities, are really very small villages duringmost of the year. They become big and high-density villages during the touristseason. The tourist season may vary. Along most of the coast, the majorincrease in population density occurs during the summer and early fall. InFlorida, density increases during the winter.
Everything that impacts the coastal environment is a function of the highpopulation that occurs during the tourist season. This is the situation that putsthe most pressure on water quality on all sides of the barrier islands wheremany coastal communities are located. This is the situation that puts thepressure on the local politicians to come up with money to pay for beachnourishment. This is the population that calls for or is responsible for thepressure on politicians to build sea walls, which eventually destroy the verybeach that they want to enjoy. So overall, the increase in seasonal populationis, in my view, totally responsible for environmental problems on the coast.(top)
Neils West
Professor, Department of Marine Affairs,University of Rhode Island
Professor West has been with the University of Rhode Island Department ofMarine Affairs for over 20 years, specializing in coastal environmental impactanalysis, marine recreation and coastal demography. He has writtenextensively in his field and most recently completed a book entitled StatisticalMethods for Marine Affairs Professionals. Professor West is also on theeditorial board of the journals Coastal Management and Journal of ShorelineResearch.
Response to Question 1
Response to Question 2
(top)
Question 1. What can we do to limit the environmental impactsfrom increasing population growth in coastal areas? Pleaseprovide examples.
Click here for audio response
(audio requires RealPlayer, see Using this Site)
Environmental impacts caused by increasing coastal population can bereduced by providing more public access; a better regulatory system;construction standards; better inspection of septic systems; and greateremphasis on developing coastal managers, scientists and policy makers.Given the high densities in most coastal areas and the influx of seasonalvisitors, there is a great need to improve the use of open space withoutsignificantly reducing environmental quality for permanent residents andseasonal visitors. Accessibility to some popular coastlines has placed severedemands on existing roads and parking lots. The solution appears to be fast,inexpensive and comfortable public transportation, much the same way somecities have facilitated commuting to and from the city.
The second area where coastal impacts could be reduced is by improving localzoning and providing more open space. While state and local governmentbudgets are tight, we need to look at new ways in which acquistion of openspace on all governmental levels can continue. Many local, nongovernmentalorganizations realize the important role they play in providing initiative,

expertise and, in some instances, short-term loans to acquire valuableproperties.
Where coastal environmental problems are severe, improved enforcementshould be increased. Many coastal areas have been subjected to severedamage from hurricanes and floods that might have been minimized hadbuilding inspectors done their jobs properly. Many coastal waters have beencontaminated by non-point source pollution, a significant portion of whichcould have been prevented had the septic systems been properly maintained.
The final factor relates to public education and information. This should bedeveloped from kindergarten through college and include extension services.Such efforts should be directed toward local issues to enable citizens to placesuch messages in the context of their own environments.(top)
Question 2. How do increases in seasonal population affectcoastal environmental quality? What examples can you provide?
Click here for audio response
(audio requires RealPlayer, see Using this Site)
Coastal impacts from seasonal population shifts can be divided into twogroups. One relates to the biophysical environment; the other, to thesocioeconomic systems.
The seasonal influx of people to the nation's shores has increased bothquantitatively and qualitatively. As a result of more leisure time, increasedlongevity and income, a larger number of people spend time away fromhome. Recreational pursuits have also undergone significant change. At theturn of the century, coastal recreation was limited to sunbathing,beachcombing and fishing, and a very small number of recreational boaters.Today, this has changed. Coastal recreation encompasses a wide range ofactivities from diving to the use of personal water craft and off-road vehicles.
The growth of recreational activities has resulted in a rapid increase in threatsto coastal resources. These include dune destruction; tire ruts from overlandrecreational vehicles which, in turn, threaten endangered species (e.g., pipingplover); and destruction of seabed resources. Inexperienced divers andboaters have significantly impacted coral reefs. Some of this is inadvertent,caused more by ignorance than intent. Examples include damage of coral reefsby touching and dropping anchors on coral or seagrass beds rather than innonvegetated areas.
Socioeconomic impacts have been significant as well. A century ago, thecoastal environment included some of the poorest areas, settled by fishers andmarginal farmers. This has changed dramatically, and not necessarily for thebetter. The popularity of coastal areas has resulted in increased land costs withcorresponding increases in property taxes. This has resulted in a majorout-migration of the less well-to-do. Now, many coastal areas have become"standardized" to where regional characteristics have disappeared. That muchof the infrastructure is insured, with significant support from the federalgovernment, in some ways represents welfare to those who need it least.(top)

Text References
On-line References
Text References
Bureau of the Census. 1996. Population of states and counties of theUnited States: 1790-1990, from the 21 decennial censuses. Washington,DC: U.S. Department of Commerce. 226 pp.
Bureau of the Census.1996 (on-line). Population in coastal counties: April1, 1990 and July 1, 1994. Population Distribution Branch. URL:http://www.census.gov/population/estimates/county/9094cstl.txt
Bureau of the Census. 1996 (on-line). Population in coastal counties,1960-1980. Population Distribution Branch. URL:http://wwww.census.gov/population/estimates/county/6080cstl.txt
Bureau of the Census. 1994a. County and city databook, 1994.Washington, DC: Government Printing Office (GPO) for U.S. Departmentof Commerce (USDOC). 928 pp.+ apps.
Bureau of the Census. 1994b. Statistical abstract of the United States.Washington, DC: GPO for USDOC. 1,011 pp.
Chesapeake Bay Program. 1995 (on-line). State of the Chesapeake Bay.Annapolis, MD: U.S. Environmental Protection Agency. URL:http://www.chesapeakebay.net/bayprogram/state/state.htm
Chesapeake Bay Program Home Page. 1997 (on-line). The bay andecosystem. URL: http://www.epa.gov.r3chespk/
Culliton, T.J., J.J. McDonough III, D.G. Remer and D.M. Lott. 1992.Building along America's coasts: 20 years of building permits, 1970-1989.Silver Spring, MD: NOAA, ORCA, Strategic Environmental Assessments(SEA) Division. 25 pp. + apps.

Culliton, T.J., M.A. Warren, T.R. Goodspeed, D.G. Remer, C.M.Blackwell and J.J. McDonough III. 1990. 50 years of population changealong the nation's coasts, 1960-2010. Rockville, MD: NOAA, ORCA,SEA Division. 41 pp.
Ewing, R. 1997. Is Los Angeles style sprawl desirable? Chicago, IL:Journal of the American Planning Association 63(1). pp. 107-126.
National Oceanic and Atmospheric Administration. 1992. Coastal trendsdata base. Silver Spring, MD: NOAA, ORCA, SEA Division.
National Planning Association (NPA) Data Services, Inc. 1995. Keyindicators of county growth, 1970-2015. Washington, DC: NPA. Database + apps.
South Florida Ecosystem Restoration Task Force. 1994. Interagencyworking group ecosystem restoration and maintenance. Jacksonville, FL:U.S. Army Corps of Engineers. 127 pp. + apps.
Sustainable Communities Network. 1997 (on-line). Smart Growth:Development that serves economy, community, and environment. URL:http://www.sustainable.org/SGN/sgn_index.html(top)
On-line References
The following references were accessed via URL on the World Wide Web(WWW) between June and October 1997.
Note: Population is a broad topic, as evidenced by the thousands ofaddresses generated from a WWW search. The following references are notexhaustive; rather, they provide specific supplementary information relatedto the text.
Population
Center for Neighborhood Technology/The Metropolitan Initiative. BriefingPaper: Southeast Florida Metropolitan Area.
http://www.cnt.org/mi/se_fla.htm
Describes the physical, environmental, economic, social and governmentalstructure of Southeast Florida, including Palm Beach, Broward, Dade andMonroe Counties, and how population growth has affected the region.
Lew, Alan A. 1996. Geography USA: A Virtual Textbook. NorthernArizona University.
http://www.for.nau.edu/~alew/ustxtwlc.html
Provides historical and current information on the economic and geographicfactors that drive development and the distribution of population centers inthe major geographic regions of the United States. See chapter 4, theMid-Atlantic; chapter 5, the Eastern Mountain Regions: New England and
Appalachia - Part 1. New England and the Maritime Provinces; chapter 6,the South; chapter 10, the Pacific; and chapter 7, the Midwest.
Population Action International. Why Population Matters.
http://www.populationaction.org/why_pop/whypop.htm
Web-based version of Population Action International's "Why PopulationMatters" providing links to sections with information on the effects ofpopulation on the economy, environment, and human health and safety.
Princeton University. Princeton's Population Index Service.
http://popindex.princeton.edu/
Web site with search and browse links to Princeton's On-line PopulationIndices from 1986 to 1996. Indices have citations of numerous studies onmany different aspects of population.
United Nations Population Division. United Nations PopulationInformation Network (POPIN).
http://www.undp.org/popin/popin.htm
Many links to worldwide information sources on population anddevelopment.
U.S. National Aeronautics and Space Administration/Goddard SpaceflightCenter. Ocean Planet: Perils - Swarming the Shores.
http://seawifs.gsfc.nasa.gov/OCEAN_PLANET/HTML/peril_coastal_develop
Brief statements on the effects of human activities on coastal beaches andshorelines in the United States and the Mediterranean. The MediterraneanOceanic Database is also accessible. Has links to printed references onpopulation and coastal impacts.(top)
Management
Florida State University. Atlas of Florida - Population.
http://cartlab-www.freac.fsu.edu/FloridaAtlas/Population/pop18.html
Presents, as part of a larger work, The Atlas of Florida World Wide Web, asection on population within Florida. The section has maps, graphs andtext on population growth, population distribution for 1980 and 1990,population density for the year 1990, population change and migration ofpopulation by county within Florida between 1960 and 1990 andpopulation change by metropolitan statistical areas between 1980 and 1990.
The Heinz Center. The Heinz Center: Program on Sustainable Coasts.
http://www.heinzctr.org/Programs/sustainable_coasts.htm
Discusses some factors that are affecting the overall health conditions ofcoastal regions of the United States.

Puget Sound Water Quality Action Team. Puget Sound On-line.
http://www.wa.gov/puget_sound/
Presents several resources devoted to maintaining and improving thequality of the waters within Puget Sound. Gives recent news; maps of theestuary and its surroundings; indications of the current environmental statusof Puget Sound, estuary-wide and by county; status of important projectsdesigned to protect or improve the water quality; and library resources withinformation about the Sound.
Sustainable Communities Network. Smart Growth: Development ThatServes Economy, Community, and Environment.
http://www.smartgrowth.org/
Presents information on how intelligent community design and function canaffect and improve the quality of life in urban environments. Has a list ofprinted references, a list of other Internet sites with related information, anda forthcoming link to on-line case studies.
U.S. Department of the Interior/National Park Service. Population Growth:Everglades National Park.
http://www.nps.gov/ever/eco/crowds.htm
Explains the demands on water in South Florida and in the Everglades fromoverdevelopment and population growth. Offers data on daily populationincreases and tourism, and describes effects from alterations to the land.Also, has information about threats to the Everglades, water management,water quality, non-native species, loss of species and conservation actions.
U.S. Environmental Protection Agency. The Chesapeake Bay ProgramHome Page.
http://www.chesapeakebay.net/bayprogram/
Gives general information about the U.S. EPA's Chesapeake BayProgram. The Bay and Ecosystem section contains a downloadable report,Population Estimates and Projections for States, Counties and ModelingSegments within the Chesapeake Bay Watershed, as well as otherinformation on the region's projected population growth into the nextcentury.(top)
Internet Data Bases
U.S. Department of Commerce/NOAA/NOS/Office of Ocean Resourcesand Conservation Assessment. Coastal Trends: Population andDevelopment in Coastal Areas SQL Data.
http://www-orca.nos.noaa.gov/../cgi-bin/orca_prod_details.pl?3_SEA_Coasta
On-line searchable data sets for Coastal Population (1960 - 1990) andCoastal Development in the United States. Two types of spatial searchesare possible: Population and Building Permits by Coastal County, andPopulation by Estuary. Results of searches can be viewed on-line anddownloaded.

U.S. Department of Commerce/Bureau of the Census. Population inCoastal Counties: 1960 to 1980.
http://www.census.gov/population/estimates/county/6080cstl.txt
Table shows population in U.S. coastal counties for the years from 1960 to1980.
U.S. Department of Commerce/Bureau of the Census. Population inCoastal Counties: April 1, 1990 and July 1, 1994.
http://www.census.gov/population/estimates/county/9094cstl.txt
Table shows population in U.S. coastal counties for the years from 1990 to1994.(top)

Appendix A Coastal County Population Data

Ap
pe
nd
ix
Pre
vie
wF
ollo
win
g is
a s
egm
ent o
f App
endi
x A
.
Clic
k he
re to
vie
w th
e fu
ll A
ppen
dix
A (
490K
).
(bac
k to
Nat
iona
l Pic
ture
)(b
ack
to A
ppen
dice
s)
Coa
stal
Cou
nty
Pop
ulat
ion
Dat
a
(bac
k to
Nat
iona
l Pic
ture
)(b
ack
to A
ppen
dice
s)

coastal county: A county is defined as coastal if: 1) at least 15% of itstotal land area is located within the nation's coastal watershed; or, 2) aportion of its land accounts for at least 15% of a coastal cataloging unit.The United States has 673 coastal counties.
coastal zone: all U.S. waters subject to the tide, U.S. waters of theGreat Lakes, specified ports and harbors on inland rivers, waters that arenavigable by deep-draft vessels, including the contiguous zone and parts ofthe high seas, and the land surface or land substrata, ground waters, andambient air proximal to those waters.
ecosystem: a discrete environmental unit, consisting of living andnonliving parts that interact to form a stable system. The term can beapplied at any scale, from a drop of pondwater to the entire biosphere (i.e.,the Earth can be viewed as a single ecosystem).
mitigation: restoration to compensate for a specific environmental impact,usually off-site.
nonpoint urban runoff: precipitation-related discharge of septicleachate, animal wastes, etc. from impervious surfaces, lawns, and otherurban land uses.
uplands: the elevated, typically forested lands beyond the lowlands thatborder rivers and coasts.
watershed: the entire region that drains into a river, river system or waterbody.
wetland: a habitat or vegetative community dependent on seasonal,intermittent or permanent flooding. (top)

Acknowledgments
Photo Credits
About the Author
Acknowledgments
NPA Data Services, Inc. provided the population projection data for thispaper. The Bureau of the Census, U.S. Department of the Interior,provided historical information on coastal counties. Craig Russell ofNOAA's Strategic Environmental Assessments (SEA) Division assisted incompiling and organizing the data and producing the graphics. David M.Lott, also of SEA, produced the population maps.(top)
Photo Credits
Many of the photos were gathered from NOAA archives or weregenerously provided from personal collections of NOAA staff members.
Others were contributed from outside of NOAA, and we gratefully thankthe following institutions and individuals:
Photo 1. National Sea Grant ProgramPhoto 8. Chesapeake Bay FoundationPhoto 13.Courtesy, Corel Corporation. Note: This image may not be savedor downloaded and is only to be used for viewing purposes.Photo 14. Chesapeake Bay FoundationPhoto 15. Chesapeake Bay Foundation(top)
About the Authors

Thomas J. Culliton is a physicalscientist with the Human ActivitiesAssessment Branch of NOAA'sStrategic EnvironmentalAssessments Division. Sincecoming to the SEA Division in1984, he has authored threewidely recognized publications oncoastal population: SelectedCharacteristics of Coastal States,1980-2000; 50 Years ofPopulation Change Along theNation's Coasts, 1960-2010; andBuilding Along America's Coasts,1970-1989. He received hisbachelor's and master's degrees ingeography from the University ofMaryland.
(top)

Return to National Picture
Figure 1. Projected population change from 1994-2015: absolute numbers

Return to National Picture
Figure 2. Population Density, 1960-2015
Note: Does not include AlaskaSources: U.S. Bureau of the Census, 1997; National Planning Association, 1995

Return to Regional Contrasts
Figure 3. Projected population change by Coastal Region, 1994-2015