
Assessment of Coho Salmon from the Kenai River, Alaska, 1997

POPULATION ASSESSMENT: OREGON COAST COHO SALMON ESU
Thomas E. NickelsonNorthwest Region Research and Monitoring Program
Oregon Department of Fish and Wildlife
Oregon Department of Fish and WildlifeP.O. Box 59Portland, OR 97207
March 2001


i
Table of Contents
Abstract ........................................................................................................................... iiIntroduction......................................................................................................................1Population Units ..............................................................................................................1Coho Salmon Life History................................................................................................5Habitat Use and Freshwater Distribution .........................................................................7Estimates of Theoretical Juvenile Production and Adult Equivalents ..............................8Critical and Viable Population Levels ..............................................................................8
Critical Threshold .........................................................................................................9Viable Threshold ........................................................................................................10
Assessment of the Status of Population Complexes .....................................................10Necanicum Complex..................................................................................................12Nehalem Complex .....................................................................................................13Tillamook Complex ....................................................................................................16Nestucca Complex.....................................................................................................18Siletz Complex ...........................................................................................................19Yaquina Complex.......................................................................................................21Alsea Complex...........................................................................................................25Siuslaw Complex .......................................................................................................27Lakes Complex ..........................................................................................................28Umpqua Complex ......................................................................................................31Coos Complex ...........................................................................................................32Coquille Complex.......................................................................................................35
Trends and Patterns of Abundance ...............................................................................37Comparative Health of Population Complexes ..............................................................38
Abundance Relative to the Critical Threshold ............................................................38Viability.......................................................................................................................38Productivity ................................................................................................................42Overall Ranking of Population Health ........................................................................42
References ....................................................................................................................44

ii
Abstract
The status of wild populations of coho salmon (Oncorhynchus kisutch) in the OregonCoast ESU is examined. Populations are grouped into 12 units termed “populationcomplexes.” Trends of abundance of coho salmon of each complex are examined forthe period 1990-2000 based on random surveys of spawners. Estimates of theoreticaljuvenile production for the 1997-99 broods are made for each complex. Probability ofextinction is estimated for the major populations of most complexes. The relative healthof each population complex is ranked relative to the other complexes based on metricsof abundance, viability, and productivity.

1
Introduction
Coho salmon in Oregon coastal basins are listed as threatened under theEndangered Species Act. Under the Section 4(d) of the Act, rules have been adoptedto govern take. These rules require Hatchery and Gene Management Plans (HGMPs)for hatchery programs and Fisheries Management and Evaluation Plans (FMEPs) forfisheries that might impact listed coho salmon. Assessment of population status is anintegral part of these plans. The purpose of this report is to provide assessments forpopulations within the Oregon Coast ESU.
There have been several reviews of the status of Oregon coastal coho salmonduring the past decade. Nickelson et al. (1992) judged the populations of coho salmonin the Alsea, Siltcoos, Tahkenitch, Coos, and Coquille basins to be healthy. Huntingtonet al. (1994) concluded that coho salmon in the Siltcoos, Tahkenitch, Coos, Coquille,and Smith (Umpqua) river basins were healthy. Kostow (1995) examined the status ofcoastal coho salmon at a larger geographic scale of several basins combined but didnot judge health. Finally, Weikamp et al. (1995) examined coho salmon at the scale ofthe entire Oregon Coast ESU and concluded that they were threatened.
This report, identifies twelve population units within the Oregon Coast ESU,describes their recent status, and ranks their health relative to one another. Althoughpatterns of relative health were identified, no attempt is made to analyze their causes.This will come with future work.
Population Units
The first step in assessing salmonid populations is to identify independentpopulation units. Population units can be viewed as a hierarchy of levels of complexityand geographic scope. The highest level in the hierarchy of population units for cohosalmon on the Oregon Coast is the Evolutionarily Significant Unit (ESU) (Waples 1995),developed to help implement the Endangered Species Act for salmon. There are twoESUs identified on the Oregon Coast for coho salmon, the Oregon Coast ESU and theSouthern Oregon/Northern California Coasts ESU (Weitkamp et al. 1995). Within theOregon Coast ESU, which includes coastal basins south of the Columbia River to CapeBlanco, Kostow (1995) identified three Gene Conservation Groups (GCG): North/MidCoast, Umpqua, and Mid/South Coast. For the purposes of fisheries management, theNorth/Mid Coast GCG was split into Northern and North Central sub-aggregates and theUmpqua and Mid/South Coast were combined into a South Central aggregate (PFMC1999). For the purpose of designing monitoring programs, the Oregon Plan monitoringprogram adopted the split of the North/Mid Coast GCG because population trends in thetwo areas were different, but rejected the combining of the South Central aggregate(Jacobs et al. 2000). This resulted in four Gene Conservation Areas (GCA) within theOregon Coast ESU: North Coast, Mid Coast, Umpqua, and Mid-South Coast.

2
McElhany et al. (2000) defines an independent population as “...any collection ofone or more local breeding units whose population dynamics or extinction risk over a100-year time period is not substantially altered by exchanges of individuals with otherpopulations.” For the purpose of this population assessment, we have coined the term“Population Complex” to refer to these independent populations. A population complexis then comprised of smaller breeding units, which we term populations. These unitsare independent from each other at shorter scales of time.
ODFW (1995) lists 81 coastal coho salmon populations within the boundaries ofthe Oregon Coast ESU. This list includes a few large basins, subbasins of large basins,and many small direct ocean tributaries that are probably too small to supportindependent populations.
The approach used to identify population complexes for this analysis was to startwith the major basins and then estimate the probable sphere of influence of populationsin these larger basins on populations in smaller nearby streams [See Labelle (1992) forinformation on straying between streams]. Because the rate of genetic interchangeamong streams is unknown and is probably not “black and white,” assignment of groupswas, to some extent, arbitrary. However, some guiding principles were used in thisprocess.
1. Groupings were primarily based on geography, similarity of habitats, andpotential similarity of life history types.
2. Small streams were grouped with nearby larger rivers.
3. Second, where available, abundance trend data were used to aid grouping. Forexample, peak spawner counts in Beaver Creek, which lies midway betweenthe Yaquina and Alsea basins tends to track with the Alsea, and not theYaquina, (Figure 1) and therefore was included in the Alsea Complex.
4. Where possible, coastal headlands were used as boundaries between adjacentgroups.
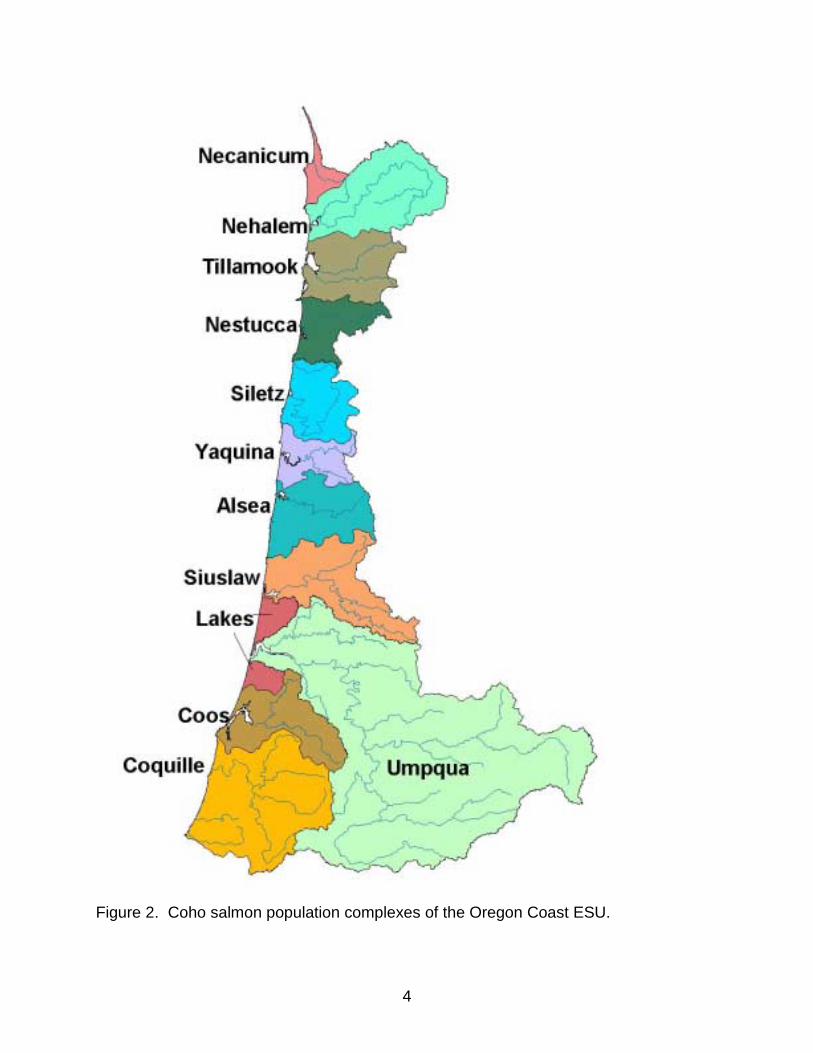
Ultimately, 12 population complexes were identified (Table 1 and Figure 2). Withinsome complexes, primary populations were also identified (Table 2). Most complexesalso contain secondary populations; streams which, based on the results of a populationviability model (Nickelson and Lawson 1998), are too small (<40 miles of habitat) tosustain a viable population (Figure 3). Populations in streams with less than 40 miles ofhabitat have increasingly greater probabilities of experiencing very low abundances andthus depensatory effects on the populations and greater probabilities of extinction. Thatis not to say that these populations are not important to the abundance and diversity ofcoho salmon of the complex. However, they are not demographically independent asdefined by McElhany et al. (2000). These secondary populations are included in ODFW(1995).

3
0
10
20
30
40
50
60
70
80
1990 1991 1992 1993 1994 1995 1996 1997 1998 1999 2000Year
Peak
Fis
h pe
r Mile
YaquinaNF BeaverAlsea
Figure 1. Trend of peak counts of spawning coho salmon in standard index sites of midcoast streams of the Oregon Coast ESU.
Table 1. Population complexes for coho salmon for the Oregon Coast ESUPopulation Complex Description Major Headland Necanicum Necanicum River - Arch Cape Creek Cape Falcon Nehalem Short Sands Creek - Spring Creek Tillamook Watseco Creek - Netarts Bay Cape Lookout Nestucca Rover Creek - Neskowin Creek Cascade Head Siletz Salmon River - Rocky Creek Cape Foulweather Yaquina Spencer Creek - Thiel Creek Alsea Beaver Creek - China Creek Heceta Head Siuslaw Cape Creek - Siuslaw River Lakes Siltcoos, Tahkenitch, & Tenmile Lakes Umpqua Entire Umpqua basin Coos Coos River - Big Creek Cape Arago Coquille Coquille River - Sixes River
4
Figure 2. Coho salmon population complexes of the Oregon Coast ESU.

5
Table 2. Individual coho salmon populations within population complexes for theOregon Coast ESU. Gene Conservation Area Population Complex Primary Populations North Coast Necanicum Necanicum River
Nehalem North Fork Nehalem River Nehalem River
Tillamook Kilchis River Wilson River Trask River Tillamook River
Nestucca Little Nestucca River Nestucca River
Mid Coast Siletz Salmon River Siletz River
Yaquina Yaquina River
Alsea Drift Creek Alsea River Yachats River
Siuslaw North Fork Siuslaw River Siuslaw River
Umpqua Umpqua Smith River Umpqua River
Mid-South Coast Lakes Siltcoos Lake Tahkenitch Lake Tenmile Lakes
Coos Coos River
Coquille Coquille River
Coho Salmon Life History
Adult coho salmon migrate into fresh water in the fall to spawn. Spawning of wildcoho salmon usually occurs from mid-November through February. Adult spawningcoho salmon are typically 3 years old and they are often accompanied by 2-year-oldjacks (precocious males) from the next brood. Jacks typically comprise about 5-10% ofa brood return except in lake systems where they have averaged 24% over the past 10years. The abundance of jacks is an indicator of brood strength. The number ofhatchery jacks is used to predict abundance of 3-year-old adults the following year

6
(Sharr et al. 2000). However, while this general trend appears to hold for numbers ofspawning wild fish, a similar predictor has yet to be developed, probably because of theerror associated with counting jacks on the spawning grounds.
0%
2%
4%
6%
8%
10%
12%
14%
16%
18%
0 20 40 60 80 100 120 140 160
Basin Size in Miles
Prob
abili
ty o
f a S
mal
ler P
opul
atio
n O
ccur
ring
<20 Spawners<15 Spawners<10 Spawners<5 Spawners
Figure 3. The relationship between basin size and probability of a smaller population ofcoho salmon occurring within 10 generations.
Spawning occurs primarily in small tributaries located throughout coastal basins.The parents normally exhibit strong homing to their natal stream. The female digs anest (redd) in the gravel and lays her eggs, which are immediately fertilized byaccompanying adult males or jacks. The eggs are covered by digging and displacinggravel from the upstream edge of the nest. Each female lays about 2,500 eggs. Theadults die soon after spawning. Sex ratios of spawning adults tend to average around50:50 at most locations (Table 3). However, Moring and Lantz (1975) observed 77%males in three small Alsea River tributaries over a period of 14 years. They concludedthat males tend to move around a lot and visit multiple streams.
The eggs hatch in about 35-50 days, depending upon water temperature (warmtemperature speeds hatching). The alevins remain in the gravel 2 or 3 weeks until theyolk is absorbed and emerge as fry to actively feed in the spring. Most juvenile cohosalmon spend 1 summer and 1 winter in fresh water. The following spring,approximately 1 year after emergence, they undergo physiological changes that allow

7
them to survive in seawater. They then migrate to the ocean as silvery smolts about 10-12 cm in length.
The smolts undergo rapid growth in the ocean, reaching about 40-50 cm by fall.Little is known of the ocean migrations of juvenile coho salmon from Oregon coastalstreams, however based on what is known, it appears migrations are mostly limited tocoastal waters. Initial ocean migration appears to be to the north of their natal stream(Fisher and Pearcy 1985; Hartt and Dell 1986). After the first summer in the ocean, asmall proportion of the males attain sexual maturity and return to spawn as jacks.Migration patterns during the fall and winter are unknown. Those fish remaining at seagrow little during winter but feed voraciously during the next spring and summer,growing to about 60-80 cm in length. During this second summer in the ocean, asubstantial percentage of these maturing adults are caught in ocean troll and sportfisheries, usually to the south of their natal stream (Lewis 2000). The survivors return totheir home streams or neighboring streams where they spawn and die to complete thelife cycle.
Table 3. Observations of coho salmon sex ratio at adult traps. Population % % complex males females Location Run years Data source Nehalem 52% 48% North Fork trap 1998-1999 Life Cycle Monitoring Siletz 50% 50% Mill Cr. trap 1997-1999 Life Cycle Monitoring Yaquina 51% 49% Mill Cr. trap 1997-1999 Life Cycle Monitoring Alsea 77% 23% Drift Cr. tributaries 1959-1972 Moring & Lantz (1975)
50% 50% Cascade Cr. trap 1997-1999 Life Cycle Monitoring Umpqua 55% 45% Smith River trap 1999 Life Cycle Monitoring Coos 63% 37% Winchester Cr., S. 1999 Life Cycle Monitoring Coos R., & Fall Cr.
Habitat Use and Freshwater Distribution
Spawning and rearing of juvenile coho salmon generally take place in small lowgradient (generally <3%) tributary streams, although rearing may also take place inlakes where available. Coho salmon require clean gravel for spawning and cool watertemperatures (53-58°F preferred, 68°F maximum) for rearing (Reiser and Bjornn 1979).Fry emerge from February to early June (Moring and Lantz 1975) and occupybackwater pools and the stream margins (Mundie 1969; Lister and Genoe 1970;Nickelson et al. 1992a). During summer, coho prefer pools in small streams, whereasduring winter, they prefer off-channel alcoves, beaver ponds, and dam pools withcomplex cover (Nickelson et al. 1992a, 1992b). Complexity, primarily in the form oflarge and small wood is an important element of productive coho salmon streams(Nickelson et al. 1992b; Rodgers et al. 1993). Little is known about residence time orhabitat use of estuaries during seaward migration. It is usually assumed that cohosalmon spend only a short time in the estuary before entering the ocean. However,

8
recent research is finding that rearing in the upper ends of tidal reaches can beextensive.
The distribution of coho salmon within a basin is primarily determined by twofactors: marine survival, and the distribution of freshwater habitat of different levels ofquality. When marine survival has been very poor as in recent years, coho will be foundin only the highest quality habitats. Coast-wide, these habitats comprise about 22% ofthe habitat (Nickelson 1998). When marine survival increases, as could occur with achanging climate regime, coho will redistribute into freshwater habitats of lower quality.Thus coho salmon population dynamics function with a classic “source-sink” relationshipamong stream reaches.
Estimates of Theoretical Juvenile Production and Adult Equivalents
A theoretical estimate of the number of eggs, fry, parr, and smolts was calculatedfor each population complex for the 1997-1999 broods (Table 4). Number of eggsdeposited was estimated by assuming a 50:50 sex ratio and 2,500 eggs per female.Number of fry was assumed to be 65% of egg deposition. To estimate parr, adults wereassumed to spawn in high quality habitat Nickelson (1998) until fully seeded. Anyadults in excess of full seeding were assumed to spawn in moderate quality habitat.Egg to parr survival was then based on the relative seeding level of each habitatcategory and the equations of Nickelson and Lawson (1998). Parr abundance wasestimated by multiplying survival rate by egg deposition. Smolt abundance wasestimated by multiplying number of summer parr by an overwinter survival rate of 0.34for high quality habitat and 0.20 for moderate quality habitat as calculated from theequations of Nickelson and Lawson (1998).
Conversion rates were calculated to determine the number of adults expectedfrom a known number of individuals at a given juvenile life stage. Actual adultequivalents are influenced by many factors the most important being: 1) marine survival,2) freshwater habitat quality, and 3) freshwater juvenile density. For the purpose of thisexercise, conversion rates were calculated for juvenile fish rearing in fully seededmoderate quality habitat (Nickelson 1998) based on the equations of Nickelson andLawson (1998) and the estimated rates of adults per smolt from Sharr et al. (2000).Table 5 presents conversion rates for a range of marine survival and the 1990-99average.
Critical and Viable Population Levels
McElhany et al. (2000) identify two numeric populations levels that delineatecategories of risk for salmonid populations. These are: “a viability threshold abovewhich populations have negligible risk of extinction due to local factors” and “a criticalthreshold below which populations are at relatively high risk of extinction in the nearfuture.”

9
Table 4. Estimates of abundance of juvenile life stages based on spawner abundance.Population 1997 Brood (millions) 1998 Brood (millions) 1999 Brood (millions)Complex Eggs Fry Parr Smolts Eggs Fry Parr Smolts Eggs Fry Parr SmoltsNecanicum 0.32 0.21 0.05 0.02 1.18 0.77 0.23 0.06 0.89 0.58 0.11 0.03Nehalem 1.47 0.95 0.59 0.20 1.49 0.97 0.60 0.20 4.35 2.83 1.15 0.39Tillamook 0.42 0.28 0.11 0.04 0.34 0.22 0.10 0.03 2.72 1.77 0.29 0.09Nestucca 0.42 0.27 0.11 0.04 0.21 0.14 0.08 0.03 2.69 1.75 0.32 0.09Siletz 0.83 0.54 0.30 0.10 0.49 0.32 0.19 0.07 1.43 0.93 0.36 0.12Yaquina 0.48 0.31 0.19 0.07 0.46 0.30 0.18 0.06 3.25 2.11 0.59 0.20Alsea 1.40 0.91 0.56 0.19 1.78 1.16 0.71 0.24 6.95 4.52 1.23 0.42Siuslaw 0.84 0.54 0.33 0.11 1.36 0.88 0.54 0.18 3.50 2.27 1.19 0.40Lakes 10.75 6.99 0.81 0.27 13.89 9.03 0.88 0.30 15.89 10.33 0.92 0.31Umpqua 3.70 2.41 1.40 0.47 11.41 7.41 2.03 0.69 9.78 6.36 1.93 0.65Coos 1.41 0.92 0.39 0.13 3.96 2.57 0.55 0.19 6.01 3.91 0.63 0.21Coquille 7.15 4.65 1.19 0.30 3.40 2.21 0.35 0.12 3.98 2.59 0.37 0.13
Table 5. Adult equivalent conversion rates for each juvenile life stage of coho salmon.Survival to smolt Survival to adult based on:
in moderate Maximum observed Minimum observed 1990-99 averageLife Stage quality habitat smolt to adult survival smolt to adult survival smolt to adult survival
Smolt 0.1200 0.0090 0.0210Summer Parr 0.203 0.0243 0.0018 0.0043
Fry 0.025 0.0030 0.0002 0.0005Egg 0.016 0.0019 0.0001 0.0003
Critical ThresholdThe habitat-based, life cycle model of Nickelson and Lawson (1998) was used to
determine risk of extinction as a function of population size. The model includesalgorithms to address the depensatory influence of random events on spawningsuccess at low densities. These effects include skewed sex ratios and asynchronousspawning timing. These factors can prevent spawners from finding mates and results inreduced productivity when spawner numbers are extremely small.
The model was run using actual 1994 population sizes as the starting point. Fourbroods were simulated with 10% marine survival to fill each basin with fish, and then 16generations were simulated with stochastic marine survival averaging 1%. Fisheryexploitation rate was modeled as zero. This very severe set of conditions was modeledto insure a relatively high frequency of extinction to facilitate differentiating the effect ofpopulation size. All major coastal basins were modeled, and 1,000 iterations of eachsimulation were run. To assess risk of extinction as a function of population size,spawner abundance was converted to fish per mile by dividing total spawners by thenumber of miles in each basin. Then for the 16 generations of very low survival, theprobability of extinction (defined as <0.05 fish/mile) within four generations was

10
estimated when population densities were 0.1-1.0, 1.1-2.0, ... 9.1-10.0, 10.1-20.0, and>20.0 fish per mile.
The results of this analysis were that probability of extinction increased rapidlywhen spawner densities were less than four fish per mile (Figure 4). This result wasconsistent across basins. Critical populations levels were therefore defined for eachpopulation complex at the abundance that would equate to four fish per mile on thespawning grounds (i.e. miles of spawning habitat times four).
Viable ThresholdFigure 4 demonstrates that above the critical threshold, population size has little
or no affect on probability of extinction. Nickelson and Lawson (1998) also found thatabove a critical level there was no relationship between abundance and probability ofextinction in 100 years. They found that the most important factor determining theviability of the population was the quantity of high quality habitat. Each population musthave access to an adequate quantity of high quality habitat [i.e. habitat that can sustainpopulations at abundances above the critical threshold through periods of poor (definedas 3%) marine survival]. The model of Nickelson and Lawson (1998) was used todetermine the quantity of high quality habitat needed to sustain populations.
Figure 5 suggests that when a population has access to less than 15 miles ofhigh quality habitat, the probability of extinction increases rapidly. Therefore, a viabilitythreshold was defined as the availability of at least 15 miles of high quality habitat.Using the methods of Nickelson (1998), these values can be calculated for eachpopulation complex.
Assessment of the Status of Population Complexes
Population assessments were completed at the level of the 12 populationcomplexes. The presentations of the analyses have been standardized, as much aspossible, to facilitate the making of comparisons. However, the level of informationavailable for a population complex is not always comparable to that available for others.
Abundance of wild coho salmon spawners in Oregon coastal streams has beenestimated annually since 1990 using stratified random surveys (Jacobs and Nickelson1998), and is maintained in an ODFW database. Surveys were originally designed toestimate populations at the coast-wide level. Thus, 95% confidence intervals at thecoast-wide level averaged +28%, while those at the basin level averaged +99%. Withthe advent of the Oregon Plan for Salmon and Watersheds in 1997 (OPSW 1997), thesampling rate was increased from 240 sites to 480 sites, with the goal of estimatingpopulations at the level of the Gene Conservation Area (GCA) within about +30%. Thislevel of effort should result in confidence intervals at the basin level being +50-60%.Further implementation of Oregon Plan monitoring in 1998 resulted in the adoption of anintegrated rotating panel sampling design based on EPA’s GIS-based Environmental

11
0.00
0.05
0.10
0.15
0.20
0.25
0.30
0.35
0.40
0.45
0.1-
1.0
1.1-
2.0
2.1-
3.0
3.1-
4.0
4.1-
5.0
5.1-
6.0
6.1-
7.0
7.1-
8.0
8.1-
9.0
9.1-1
0.0
10.1-
20.0
>2
0.0
Fish per Mile
Prob
abili
ty o
f Ext
inct
ion
Figure 4. Probability of extinction of basin level populations as a function of spawnerdensity. Data are combined for all major coastal basins. After Sharr et al. (2000).
0
0.05
0.1
0.15
0 10 20 30 40 50 60 70 80 90 100
Miles of High Quality Habitat
Prob
abili
ty o
f Ext
inct
ion
in 9
9 Ye
ars
<10 Spawners<20 Spawners<5 Spawners
Figure 5. The relationship between the quantity of high quality habitat (habitat that willsupport populations of coho salmon when marine survival is 3%) and probability ofextinction defined as <20, <10, or <5 spawners.

12
Monitoring and Assessment Program (EMAP) (Stevens 1997) site selectionprocedure (Jacobs et al. 2000). Estimates of spawner abundance in the Lake systems(Siltcoos, Tahkenitch, and Tenmile) are based on extrapolation of estimates in standardindex areas to the rest of each basin (Jacobs et al. 2000). Estimates for the UmpquaComplex are the sum of counts at Winchester Dam on the North Umpqua River andestimates from spawning surveys in the rest of the basin.
Estimates of spawner abundance during fall and winter 2000-01 were influencedby extremely dry conditions and low stream flows. These conditions affected thepopulation estimates in a variety of ways. Some factors, such as improved viewingconditions could lead to overestimation of the populations. Other factors, such asmainstem spawning, extended spawner life-span, and spawning after the termination ofsurveys (which were extended past the normal date of termination) would lead tounderestimation of populations. The problem of late spawning was particularly noted inthe Yaquina, Alsea, and Coos complexes.
Estimates of pre-harvest abundance of adult coho salmon were made for eachpopulation complex by dividing spawner abundance by one minus exploitation rate.Exploitation rates were acquired from ODFW IJ Unit databases (Curt Melcher, personalcommunication, October 2000).
Prior to 1998, the number of hatchery fish on the spawning grounds wasestimated from the proportion of recovered carcasses found to have “hatchery” scalepatterns. The scale analysis has a subjective element and can be problematic becauseof the lack of adequate samples from known wild fish. It is possible for wild fish,particularly if there is a lake in the system, to have scale patterns similar to hatcheryfish. Beginning with adults returning in 1998, almost all hatchery fish have been markedby the removal of their adipose fin. As a result, the subjectivity has been taken out ofthe estimation of the number of hatchery strays. All estimates of spawner abundancereported here have had hatchery fish removed and therefore represent our bestestimate of the abundance of wild spawners.
Necanicum ComplexThe Necanicum Complex consists of coho salmon inhabiting the Necanicum
River and a few small direct oceans tributaries to its south. There is an estimated 70miles of spawning habitat available to the coho salmon of this complex. The criticalpopulation level for the Necanicum Complex is 300 adult spawners. However, given thecurrent state of the habitat, this complex is not viable because high quality habitat isestimated to be present in only 3 miles of stream, well below the 15-mile thresholdneeded to support a viable population.
The abundance of coho salmon spawners of the Necanicum Complex hasranged from about 200 to about 1,100 and has averaged about 600 since 1990 (Figure6 and Table 6). In four of those years, spawner abundance fell below the criticalthreshold of 300 fish. In two additional years, the 95% confidence intervals of the

13
population estimate fell below the critical level. Recruits per wild spawner have beenhighly variable, with four of the last eight broods falling to one or below (Table 6 andFigure 7). Hatchery fish have been observed on the spawning grounds. Of 60 scalesamples collected during 1990-99, 19 (32%) had hatchery scale patterns.
Smolt production was estimated for the 1997 through 1999 broods. Estimatedsmolt abundance ranged from 15 thousand to 55 thousand for the Necanicum Complex(Table 4).
0
200
400
600
800
1000
1200
1400
1600
1800
1989 1990 1991 1992 1993 1994 1995 1996 1997 1998 1999 2000
Return Year
Spaw
ner A
bund
ance
SpawnersCritical Threshold
Figure 6. Trend in adult coho salmon abundance relative to the critical population levelfor the Necanicum Complex. Error bars are 95% confidence limits.
Nehalem ComplexThe Nehalem Complex consists of coho salmon inhabiting the Nehalem Basin,
one small direct ocean tributary to the north and a few to the south. There is anestimated 470 miles of spawning habitat available to the coho salmon of this complex.The critical population level for the Nehalem complex is 1,900 adult spawners. Thehabitat of this complex has the potential to support a viable population because highquality habitat is estimated to be present in 110 miles of stream, well above the 15-milethreshold.
The population of wild coho salmon spawners of the Nehalem Complex hasranged from about 1,000 to about 14,500 and has averaged about 3,100 since 1990(Figure 8 and Table 7). In six of those years, spawner abundance fell below the criticalthreshold of 1,900 fish. In only two years since 1990 has the lower 95% confidence limitnot extended below the critical threshold. Recruits per wild spawner have been highly

14
Table 6. Population parameters for the Necanicum Complex coho salmon.Return Wild Pre-harvest Recruits perYear spawners wild population spawner1990 191 614 1991 1,135 2,079 1992 185 378 1993 941 1,631 8.51994 408 438 0.41995 211 241 1.31996 768 838 0.91997 253 289 0.71998 946 1,026 4.91999 728 788 1.02000 468 506 2.0
Annual mean 567 803 2.5
0.00
1.00
2.00
3.00
4.00
5.00
6.00
7.00
8.00
9.00
1992 1993 1994 1995 1996 1997 1998 1999 2000
Return Year
Rec
ruits
per
Spa
wne
r
Figure 7. Trend in recruits per spawner for Necanicum Complex wild coho.
variable, with four of the last eight broods falling below one (Table 7 and Figure 9).However, the 1997 brood was very productive: a parent stock of about 1,200 producingan estimated 15,700 adults and 14,500 spawners in the 2000-2001 run.
Hatchery strays have comprised a significant portion of the spawning populationin most years. However, the occurrence of stray hatchery fish has been concentrated in

15
the North Fork Nehalem near the hatchery where 90% of the spawners (444 of 491samples collected in 1990-99) have been of hatchery origin, compared to 35% (68 of194) in the rest of the basin.
Results of past surveys in the North Fork Nehalem suggested little naturalproduction of coho salmon was taking place in that subbasin, which was heavilyinfluenced by hatchery fish. However, since the North Fork above Waterhouse Fallsbecame a Life-Cycle Monitoring Site in 1998 (Solazzi et al. 2000) and most of thehatchery fish are now marked, we have found that significant natural production isoccurring. Wild adult spawning populations were estimated to be 657 in 1998 and 737in 1999 (Table 8), and have averaged 52% males. Since 1998, all hatchery fishcaptured in the Waterhouse Falls trap have been removed from the system. As aresult, the proportion of hatchery fish in the spawning population above the falls hasbeen reduced to about 30% (fish are able to avoid the trap by jumping the falls), downfrom 90% in previous years. Another factor in the reduction of hatchery fish on thespawning grounds is the reduction in smolt releases from Nehalem Hatchery from800,000 to 200,000.
Estimated wild smolt production in the North Fork has been 42,000, 22,000, and32,000 in 1998, 1999, and 2000, respectively (Solazzi et al. 2001). Estimates of smoltproduction for the entire Nehalem Complex for the 1997-1999 broods range from about200 thousand to about 400 thousand (Table 4).
0
4000
8000
12000
16000
20000
1989 1990 1991 1992 1993 1994 1995 1996 1997 1998 1999 2000
Return Year
Spaw
ner A
bund
ance
SpawnersCritical Threshold
Figure 8. Trend in adult coho salmon abundance relative to the critical population levelfor the Nehalem Complex. Error bars are 95% confidence limits.

16
Table 7. Population parameters for the Nehalem Complex coho salmon.Return Wild Pre-harvest Recruits perYear spawners wild population spawner1990 1,552 4,9901991 3,975 7,2801992 1,268 2,5931993 2,265 3,925 2.51994 2,007 2,153 0.51995 1,463 1,670 1.31996 1,057 1,153 0.51997 1,173 1,339 0.71998 1,190 1,291 0.91999 3,713 4,018 3.82000 14,508 15,701 13.4
Annual mean 3,106 4,192 3.0
0
2
4
6
8
10
12
14
1992 1993 1994 1995 1996 1997 1998 1999 2000
Return Year
Rec
ruits
per
Spa
wne
r
Figure 9. Trend in recruits per spawner for Nehalem Complex wild coho.
Tillamook ComplexThe Tillamook Complex consists of coho salmon inhabiting the tributaries to
Tillamook and Netarts bays and one small direct ocean tributary to the north ofTillamook Bay. There is an estimated 250 miles of spawning habitat available to thecoho salmon of this complex. The critical population level for the Tillamook Complex is1,000 adult spawners. However, given the current state of the habitat, this complex is
17
not viable because high quality habitat is estimated to be present in only 12 miles ofstream, below the 15-mile threshold needed to support a viable population.
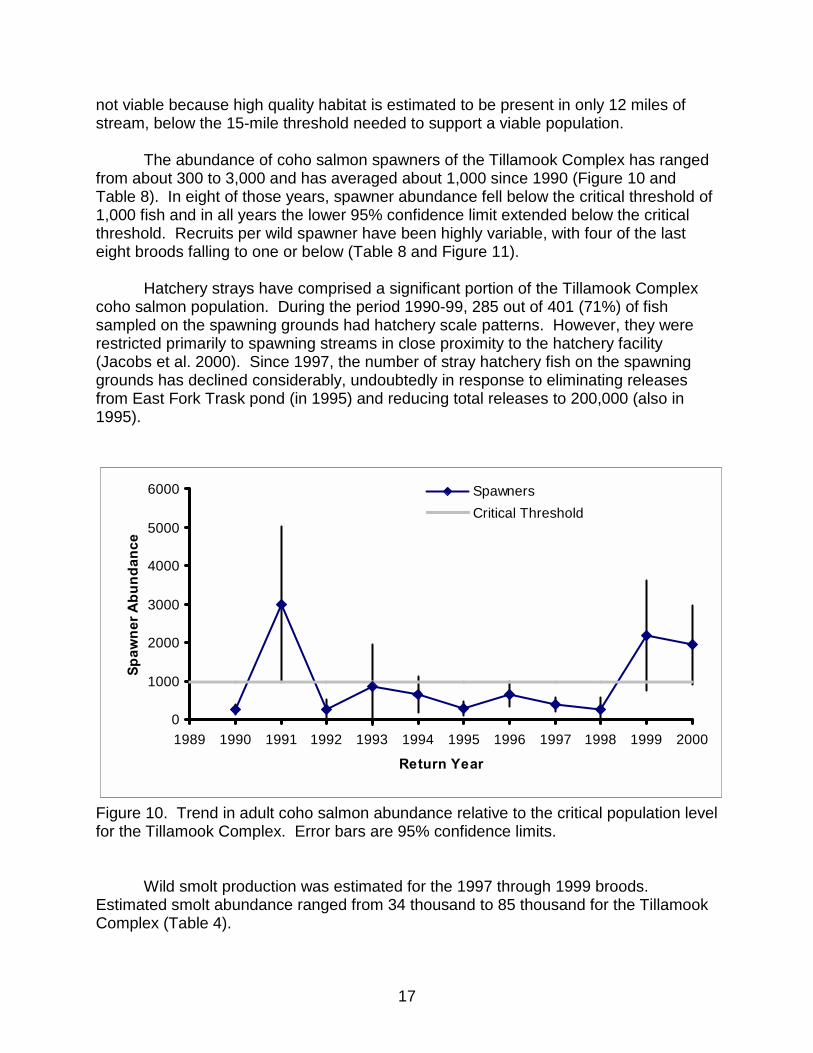
The abundance of coho salmon spawners of the Tillamook Complex has rangedfrom about 300 to 3,000 and has averaged about 1,000 since 1990 (Figure 10 andTable 8). In eight of those years, spawner abundance fell below the critical threshold of1,000 fish and in all years the lower 95% confidence limit extended below the criticalthreshold. Recruits per wild spawner have been highly variable, with four of the lasteight broods falling to one or below (Table 8 and Figure 11).
Hatchery strays have comprised a significant portion of the Tillamook Complexcoho salmon population. During the period 1990-99, 285 out of 401 (71%) of fishsampled on the spawning grounds had hatchery scale patterns. However, they wererestricted primarily to spawning streams in close proximity to the hatchery facility(Jacobs et al. 2000). Since 1997, the number of stray hatchery fish on the spawninggrounds has declined considerably, undoubtedly in response to eliminating releasesfrom East Fork Trask pond (in 1995) and reducing total releases to 200,000 (also in1995).
0
1000
2000
3000
4000
5000
6000
1989 1990 1991 1992 1993 1994 1995 1996 1997 1998 1999 2000
Return Year
Spaw
ner A
bund
ance
SpawnersCritical Threshold
Figure 10. Trend in adult coho salmon abundance relative to the critical population levelfor the Tillamook Complex. Error bars are 95% confidence limits.
Wild smolt production was estimated for the 1997 through 1999 broods.Estimated smolt abundance ranged from 34 thousand to 85 thousand for the TillamookComplex (Table 4).

18
Table 8. Population parameters for the Tillamook Complex coho salmon.Return Wild Pre-harvest Recruits perYear spawners wild population spawner1990 265 8521991 3,000 5,4951992 261 5341993 860 1,490 5.61994 652 700 0.21995 289 330 1.31996 661 721 0.81997 388 443 0.71998 271 294 1.01999 2,175 2,354 3.62000 1,942 2,102 5.4
Annual mean 979 1,392 2.3
0.00
1.00
2.00
3.00
4.00
5.00
6.00
1992 1993 1994 1995 1996 1997 1998 1999 2000
Return Year
Rec
ruits
per
Spa
wne
r
Figure 11. Trend in recruits per spawner for Tillamook Complex wild coho.
Nestucca ComplexThe Nestucca Complex consists of coho salmon inhabiting streams located
between Cape Lookout on the north and Cascade Head on the south. These includethe Nestucca River, Sand Lake tributaries, and Neskowin Creek. There is an estimated190 miles of spawning habitat available to the coho salmon of this complex. The criticalpopulation level for the Nestucca Complex is 800 adult spawners. However, this

19
complex is not viable because high quality habitat is estimated to be present in only 14miles of stream, slightly below the 15-mile threshold needed to support a viablepopulation.
The abundance of coho salmon spawners of the Nestucca Complex has rangedfrom less than 200 to about 2,200 and has averaged about 800 since 1990. (Figure 12and Table 9). In seven of those years, spawner abundance fell below the criticalthreshold of 800 fish and in all years the lower 95% confidence limit extended below thecritical threshold. Recruits per wild spawner have been highly variable, with three of thelast eight broods falling to one or below (Table 9 and Figure 13). Hatchery fish havebeen observed at times on the spawning grounds. Of 66 scale samples collectedduring 1990-99, 8 (12.1%) had hatchery scale patterns.
Smolt production was estimated for the 1997 through 1999 broods. Estimatedsmolt abundance ranged from 29 thousand to 89 thousand for the Nestucca Complex(Table 4).
0
1000
2000
3000
4000
5000
6000
1989 1990 1991 1992 1993 1994 1995 1996 1997 1998 1999 2000
Return Year
Spaw
ner A
bund
ance
SpawnersCritical Threshold
Figure 12. Trend in adult coho salmon abundance relative to the critical population levelfor the Nestucca Complex. Error bars are 95% confidence limits.
Siletz ComplexThe Siletz Complex consists of coho salmon inhabiting mid-coast streams
located between Cascade Head on the north and Cape Foulweather on the south.These include Salmon River, Devils Lake tributaries and Siletz River. There is anestimated 170 miles of spawning habitat available to the coho salmon of this complex.The critical population level for the Siletz Complex is 700 adult spawners. The habitat

20
of this complex has the potential to support a viable population because high qualityhabitat is estimated to be present in 51 miles of stream, more than the 15-milethreshold.
The abundance of coho salmon spawners of the Siletz Complex has ranged fromabout 400 to about 3,000 and has averaged about 1,300 since 1990 (Figure 14 and
Table 9. Population parameters for the Nestucca Complex coho salmon.Return Wild Pre-harvest Recruits perYear spawners wild population spawner1990 189 6081991 968 1,7731992 708 1,4481993 442 766 4.11994 390 418 0.41995 1,919 2,191 3.11996 794 866 2.01997 332 379 1.01998 169 183 0.11999 2,248 2,433 3.12000 1,155 1,250 3.8
Annual mean 847 1,120 2.2
0.00
1.00
2.00
3.00
4.00
5.00
1992 1993 1994 1995 1996 1997 1998 1999 2000
Return Year
Rec
ruits
per
Spa
wne
r
Figure 13. Trend in recruits per spawner for Nestucca Complex wild coho.

21
Table 10). In only two of those years, spawner abundance fell below the criticalthreshold of 700 fish. However, every year except 1992 and 2000 the lower 95%confidence limit extended below the critical threshold. Recruits per wild spawner havebeen highly variable, with four of the last eight broods falling to below one (Table 10 andFigure 15). However, the 1997 brood was very productive: a parent stock of about 700producing an estimated 3,300 adults and 3,000 spawners in the 2000-2001 run.
Hatchery fish have been very common in the spawning population since 1990,with 1343 of 1569 (85.6%) of scales samples collected in 1990-99 having hatcheryscale patterns. Over 90% of the spawners in the Salmon River portion of this complexhave been hatchery fish, whereas 66% of the spawners in the Siletz River have beenhatchery fish. The number of hatchery smolts that could potentially interact with thiscomplex was gradually reduced from 1.5 million to 250,000 between the 1991 and 1997brood years.
A Life-Cycle Monitoring Site is located at Mill Creek, a Siletz River tributary.Adult abundance in Mill Creek since 1997 has ranged from 55 to 147 (Solazzi et al.2001) and has averaged 50% males. Smolt production has ranged from about 4,300 toabout 9,500. Estimated smolt abundance for the entire Siletz Complex ranged from 66thousand to 121 thousand for the 1997-99 broods (Table 4).
Table 10. Population parameters for the Siletz Complex coho salmon.Return Wild Pre-harvest Recruits perYear spawners wild population spawner1990 831 2,6721991 1,023 1,8741992 2,641 5,4011993 874 1,515 1.81994 1,584 1,700 1.71995 819 935 0.41996 1,329 1,449 1.71997 667 761 0.51998 388 421 0.51999 1,147 1,241 0.92000 3,036 3,286 4.9
Annual mean 1,304 1,932 1.5
Yaquina ComplexThe Yaquina Complex consists of coho salmon inhabiting mid-coast streams
located from Cape Foulweather to Thiel Creek, just north of Yaquina Bay. The YaquinaRiver is the primary watershed, the remainder being small ocean tributaries. There is

22
an estimated 140 miles of spawning habitat available to the coho salmon of thiscomplex. The critical population level for the Yaquina Complex is 600 adult spawners.
0
1000
2000
3000
4000
5000
6000
1989 1990 1991 1992 1993 1994 1995 1996 1997 1998 1999 2000
Return Year
Spaw
ner A
bund
ance
SpawnersCritical Threshold
Figure 14. Trend in adult coho salmon abundance relative to the critical population levelfor the Siletz Complex. Error bars are 95% confidence limits.
0.00
1.00
2.00
3.00
4.00
5.00
6.00
1992 1993 1994 1995 1996 1997 1998 1999 2000
Return Year
Rec
ruits
per
Spa
wne
r
Figure 15. Trend in recruits per spawner for Siletz Complex wild coho.

23
The habitat of this complex has the potential to support a viable population becausehigh quality habitat is estimated to be present in 58 miles of stream, more than the 15-mile threshold.
The Yaquina coho salmon population has experienced a boom or bust inabundance over the past decade. The abundance of coho salmon spawners of theYaquina Complex has ranged from about 400 to about 5,700 and has averaged about1,700 since 1990 (Figure 16 and Table 11). In five of those years, spawner abundancefell below the critical threshold of 600 fish and in two additional years the spawningpopulation was only slightly above the threshold. Recruits per wild spawner have beenhighly variable over the last eight years (Table 11 and Figure 17). The1991-93 broodsexperienced excellent survival, producing seven to ten recruits per spawner.Unfortunately, the offspring of those returns faired much poorer and recruits perspawner fell below one.
Hatchery fish originating from a private hatchery comprised about 53% of thespawning population in the 1980s (Jacobs and Cooney 1997). During the 1990s, thepercentage dropped to about 21%. However, the hatchery programs that contributed tothese strays have now been eliminated.
0
2000
4000
6000
8000
10000
1989 1990 1991 1992 1993 1994 1995 1996 1997 1998 1999 2000
Return Year
Spaw
ner A
bund
ance
SpawnersCritical Threshold
Figure 16. Trend in adult coho salmon abundance relative to the critical population levelfor the Yaquina Complex. Error bars are 95% confidence limits.
A Life-Cycle Monitoring Site is located at Mill Creek, a Yaquina River tributary.Adult abundance in Mill Creek since 1997 has ranged from 92 to 138 (Solazzi et al.2001) and has averaged 51% males. A reservoir located within the Mill Creekwatershed provides rearing habitat and in some years produces large smolts thatapparently survive well. Estimated marine survival of the 1995 brood was 10%. Smolt

24
production has ranged from about 1,400 to about 6,700. Estimated smolt abundancefor the entire Yaquina Complex ranged from 62 thousand to 201 thousand for the 1997-99 broods (Table 4).
Table 11. Population parameters for the Yaquina Complex coho salmon.Return Wild Pre-harvest Recruits perYear spawners wild population spawner1990 381 1,2251991 380 6961992 633 1,2941993 549 951 2.51994 2,448 2,627 6.91995 5,668 6,470 10.21996 5,127 5,591 10.21997 384 438 0.21998 364 395 0.11999 2,596 2,810 0.62000 628 680 1.8
Annual mean 1,742 2,107 4.0
0
2
4
6
8
10
12
1992 1993 1994 1995 1996 1997 1998 1999 2000
Return Year
Rec
ruits
per
Spa
wne
r
Figure 17. Trend in recruits per spawner for Yaquina Complex wild coho.

25
Alsea ComplexThe Alsea Complex consists of coho salmon inhabiting mid-coast streams
located from Beaver Creek south to China Creek, just north of Heceta Head.Populations include Beaver Creek, Drift Creek, Alsea River and Yachats River. There isan estimated 360 miles of spawning habitat available to the coho salmon of thiscomplex. The critical population level for the Alsea Complex is 1,400 adult spawners.The habitat of this complex has the potential to support a viable population becausehigh quality habitat is estimated to be present in 97 miles of stream, well above the 15-mile threshold.
The abundance of coho salmon spawners of the Alsea Complex has ranged fromabout 1,000 to over 8,600 and has averaged about 3,000 since 1990 (Figure 18 andTable 12). Twice in the past decade, spawner abundance fell below the criticalthreshold of 1,400 fish. However, every year except 1999 the lower 95% confidencelimit extended below the critical threshold (Figure 18) and the Alsea River population,the largest in the complex fell to about 200 fish in 1998. Recruits per wild spawner havebeen highly variable over the last eight years (Table 12 and Figure 19), but have beenbelow one only twice.
Hatchery fish have been common in the spawning population in some years ofthe last decade, particularly in Beaver Creek and the Alsea River. Of 424 scalesamples collected during 1990-99, 84 (19.8%) had hatchery scale patterns. However,the hatchery programs that contributed to the strays have now been eliminated.
0
2000
4000
6000
8000
10000
12000
14000
16000
1989 1990 1991 1992 1993 1994 1995 1996 1997 1998 1999 2000
Return Year
Spaw
ner A
bund
ance
SpawnersCritical Threshold
Figure 18. Trend in adult coho salmon abundance relative to the critical population levelfor the Alsea Complex. Error bars are 95% confidence limits.

26
Table 12. Population parameters for the Alsea Complex coho salmon.Return Wild Pre-harvest Recruits perYear spawners wild population spawner1990 1,694 5,4471991 1,589 2,9101992 8,656 17,7011993 1,928 3,341 2.01994 2,578 2,766 1.71995 1,029 1,175 0.11996 4,046 4,412 2.31997 1,123 1,282 0.51998 1,423 1,543 1.51999 5,563 6,021 1.52000 3,219 3,484 3.1
Annual mean 2,986 4,553 1.6
0
1
2
3
4
1992 1993 1994 1995 1996 1997 1998 1999 2000
Return Year
Rec
ruits
per
Spa
wne
r
Figure 19. Trend in recruits per spawner for Alsea Complex wild coho.
A Life-Cycle Monitoring Site is located at Cascade Creek, an Alsea Rivertributary. Adult abundance in Cascade Creek since 1997 has ranged from 6 to 39(Solazzi et al. 2001) and has averaged 50% males. Smolt production has ranged from13 to about 1,400. Smolt production has also been monitored for many years in fourother Alsea Complex streams: upper Lobster and East Fork Lobster creeks in the AlseaBasin and Cummins and Tenmile creeks, direct ocean tributaries (Figure 20).

27
Estimated smolt abundance for the entire Alsea Complex ranged from 190 thousand to416 thousand for the 1997-99 broods (Table 4).
0
1000
2000
3000
4000
5000
6000
7000
8000
9000
10000
1987 1988 1989 1990 1991 1992 1993 1994 1995 1996 1997 1998 1999 2000 2001
Year
Estim
ated
Sm
olt A
bund
ance
U LobsterEF LobsterCumminsTenmile
Figure 20. Estimated smolt production from four Alsea Complex streams.
Siuslaw ComplexThe Siuslaw Complex consists of coho salmon inhabiting the Siuslaw Basin and
small ocean tributaries north to Heceta Head. There is an estimated 580 miles ofspawning habitat available to the coho salmon of this complex. The critical populationlevel for the Siuslaw Complex is 2,300 adult spawners. The habitat of this complex hasthe potential to support a viable population because high quality habitat is estimated tobe present in 158 miles of stream, well above the 15-mile threshold. It should be notedhowever, that the estimate of habitat quality is based on a sample size of only 15% ofthe available stream miles, much less than any other complex.
The abundance of coho salmon spawners of the Siuslaw Complex has rangedfrom less than 700 to more than 7,600 and has averaged about 3,800 since 1990(Figure 21 and Table 13). Twice in the past decade, spawner abundance fell below thecritical threshold of 2,300 fish and in 5 other years the lower 95% confidence limitextended below the critical threshold. Recruits per wild spawner exhibited a downwardtrend from 1993 to 1999, which was dramatically reversed in 2000, when the 1997brood produced about 7,100 adults and 6,500 spawners from about 700 parentspawners (Table 13 and Figure 22).

28
Hatchery fish have been common in the spawning population in some years ofthe last decade, although they have primarily been concentrated in one or twotributaries just below Lake Creek Falls, the result of a hatchery program to introducecoho salmon into the watershed above the falls, which has been discontinued. In otherparts of the basin, of 302 scale samples collected in 1990-99, 84 (27.8%) had hatcheryscale patterns.
Table 13. Population parameters for the Siuslaw Complex coho salmon.Return Wild Pre-harvest Recruits perYear spawners wild population spawner1990 2,685 8,6331991 3,740 6,8501992 3,440 7,0351993 4,428 7,674 2.91994 3,205 3,439 0.91995 6,089 6,951 2.01996 7,625 8,315 1.91997 668 763 0.21998 1,086 1,178 0.21999 2,798 3,028 0.42000 6,549 7,088 10.6
Annual mean 3,847 5,541 2.4
Smolt production was estimated for the 1997 through 1999 broods. Estimatedsmolt abundance ranged from 113 thousand to 402 thousand for the Siuslaw Complex(Table 4).
Lakes ComplexThe Lakes Complex consists of coho salmon inhabiting the three major coastal
lake basins: Siltcoos, Tahkenitch, and Tenmile. There is an estimated 100 miles ofspawning habitat available to the coho salmon of this complex. The critical populationlevel for the Lakes Complex is 400 adult spawners. The habitat of this complex has thepotential to support a viable population. The lakes provide excellent winter rearinghabitat, which has the effect that all 100 miles of stream function as high quality habitat.As a result, this is one of the most productive complexes on the coast and trends inabundance reflect just that.
The abundance of coho salmon spawners of the Lakes Complex has rangedfrom about 2,000 to about 13,500 and has averaged about 9,000 over the past 10 years(Figure 23 and Table 14). Abundance during the past decade has never fallen belowthe critical threshold of 400 fish. Recruits per spawner have been variable over the last8 years, with the only one year falling to below one (Table 14 and Figure 24). Hatchery

29
0
2000
4000
6000
8000
10000
12000
1989 1990 1991 1992 1993 1994 1995 1996 1997 1998 1999 2000
Return Year
Spaw
ner A
bund
ance
SpawnersCritical Threshold
Figure 21. Trend in adult coho salmon abundance relative to the critical population levelfor the Siuslaw Complex. Error bars are 95% confidence limits.
0.00
2.00
4.00
6.00
8.00
10.00
12.00
1992 1993 1994 1995 1996 1997 1998 1999 2000
Return Year
Rec
ruits
per
Spa
wne
r
Figure 22. Trend in recruits per spawner for Siuslaw Complex wild coho.
fish have been rare in the spawning population with only 22 of 2,540 (0.9%) of scalessampled during 1990-99 having hatchery scale patterns.

30
Smolt production was estimated for the 1997 through 1999 broods. Estimatedsmolt abundance ranged from 274 thousand to 311 thousand for the Lakes Complex(Table 4).
0
2000
4000
6000
8000
10000
12000
14000
16000
1989 1990 1991 1992 1993 1994 1995 1996 1997 1998 1999 2000
Return Year
Spaw
ner A
bund
ance
SpawnersCritical Threshold
Figure 23. Trend in adult coho salmon abundance relative to the critical population levelfor the Lakes Complex. Population estimation methods do not allow calculation ofconfidence intervals.
Table 14. Population parameters for the Lakes Complex coho salmon.Return Wild Pre-harvest Recruits perYear spawners wild population spawner1990 4,629 14,8841991 7,495 13,7271992 1,986 4,0611993 10,145 17,582 3.81994 5,841 6,267 0.81995 11,216 12,804 6.51996 13,493 14,714 1.51997 8,603 9,821 1.71998 11,108 12,048 1.11999 12,710 13,755 1.02000 12,178 13,180 1.5
Annual mean 9,037 12,077 2.2

31
0.00
1.00
2.00
3.00
4.00
5.00
6.00
7.00
1992 1993 1994 1995 1996 1997 1998 1999 2000
Return Year
Rec
ruits
per
Spa
wne
r
Figure 24. Trend in recruits per spawner for Lakes Complex wild coho.
Umpqua ComplexThe Umpqua Complex consists of coho salmon inhabiting the Umpqua Basin.
Populations are found in Smith River, lower basin tributaries, and the North Fork andSouth Fork subbasins. There is an estimated 1,230 miles of spawning habitat availableto the coho salmon of this complex. The critical population level for the UmpquaComplex is 4,900 adult spawners. The habitat of this complex has the potential tosupport a viable population because high quality habitat is estimated to be present in169 miles of stream, well above the 15-mile threshold.
The abundance of coho salmon spawners of the Umpqua Complex has rangedfrom about 3,000 to about 12,800 and has averaged about 7,500 since 1990 (Figure 25and Table 15). In four of those years, spawner abundance fell below the criticalthreshold of 4,900 fish. Recruits per wild spawner have been variable, with three of thelast four broods falling to below one (Table 15 and Figure 26). Hatchery fish have beencommon in the spawning population in most years though in low numbers – 112 of 943(11.9%) scale samples collected during 1990-99 exhibiting hatchery patterns.
A Life-Cycle Monitoring Site is located at West Fork Smith River. Adultabundance in West Fork Smith River in 1999 was estimated to be 264 fish (Solazzi etal. 2001). In addition, a mark-recapture estimate for adult coho salmon crossing SmithRiver Falls yielded an estimate of 1,541, of which 55% were males. Smolt production inthe West Fork Smith River has ranged from about 10,900 to about 22,400. Estimatedsmolt abundance for the entire Umpqua Complex ranged from 472 thousand to 686thousand for the 1997-99 broods (Table 4).

32
0
3000
6000
9000
12000
15000
18000
1989 1990 1991 1992 1993 1994 1995 1996 1997 1998 1999 2000
Return Year
Spaw
ner A
bund
ance
SpawnersCritical Threshold
Figure 25. Trend in adult coho salmon abundance relative to the critical population levelfor the Umpqua Complex. Error bars are 95% confidence limits.
Table 15. Population parameters for the Umpqua Complex coho salmon.Return Wild Pre-harvest Recruits perYear spawners wild population spawner1990 4,113 13,2251991 4,875 8,9291992 3,759 7,6871993 10,244 17,754 4.31994 5,338 5,727 1.21995 12,809 14,622 3.91996 10,824 11,804 1.21997 2,960 3,379 0.61998 9,153 9,927 0.81999 7,685 8,317 0.82000 10,947 11,847 4.0
Annual mean 7,519 10,293 2.1
Coos ComplexThe Coos Complex consists of coho salmon inhabiting the Coos Basin. There is
an estimated 220 miles of spawning habitat available to the coho salmon of thiscomplex. The critical population level for the Coos Complex is 900 adult spawners.The habitat of this complex has the potential to support a viable population because

33
0
1
2
3
4
5
1992 1993 1994 1995 1996 1997 1998 1999 2000
Return Year
Rec
ruits
per
Spa
wne
r
Figure 26. Trend in recruits per spawner for Umpqua Complex wild coho.
high quality habitat is estimated to be present in 56 miles of stream, more than the 15-mile threshold.
The abundance of coho salmon spawners of the Coos Complex has ranged fromabout 1,100 to about 15,300 and has averaged about 8,100 since 1990 (Figure 27 andTable 16). Abundance during the past decade has never fallen below the criticalthreshold of 900 fish and in only four years has the lower 95% confidence limit fallenbelow the critical threshold. Hatchery fish have been found on the spawning grounds insome years of the last decade but for the period 1990-99, have averaged only 5.1% ofthe population (53 of 1,032 scale samples having hatchery patterns).
Recruits per wild spawner exhibited a downward trend from 1993 to 1999, with1995 to 1999 falling to below one (Table 16 and Figure 28). This is the result of a seriesof five consecutive extremely strong broods not replacing themselves. During the mid1990s, marine survival of coho salmon of this complex was much higher than most ofthe complexes to the north. At the end of the 1990s, survival came down to the levelthat the other complexes had been experiencing. The downward trend in recruits perspawner reversed in 2000, when the 1997 brood produced about 5,800 adults and5,400 spawners from about 1,100 parent spawners.
Life-Cycle Monitoring Sites are located at Fall Creek, a South Fork Coos Rivertributary and at Winchester Creek, the major tributary to South Slough. Adultabundance in Fall Creek in 1999 was 35 fish (Solazzi et al. 2001). Smolt production inFall Creek was about 1,700 in 1999 and about 300 in 2000. Adult abundance inWinchester Creek in 1999 was estimated to be 44 fish (Solazzi et al. 2001). Smolt

34
production in Winchester Creek was about 2,200 in 1999 and about 3,100 in 2000.Estimated smolt abundance for the entire Coos Complex ranged from 133 thousand to214 thousand for the 1997-99 broods (Table 4). Returns to the two streams in 2000were very low, at least partially due to extremely low streamflows during the migrationperiod.
0
5000
10000
15000
20000
25000
30000
35000
1989 1990 1991 1992 1993 1994 1995 1996 1997 1998 1999 2000
Return Year
Spaw
ner A
bund
ance
SpawnersCritical Threshold
Figure 27. Trend in adult coho salmon abundance relative to the critical population levelfor the Coos Complex. Error bars are 95% confidence limits.
Table 16. Population parameters for the Coos Complex coho salmon.Return Wild Pre-harvest Recruits perYear spawners wild population spawner1990 2,273 7,3091991 3,813 6,9841992 16,545 33,8341993 15,284 26,489 11.71994 14,685 15,756 4.11995 10,351 11,816 0.71996 12,128 13,226 0.91997 1,127 1,287 0.11998 3,167 3,435 0.31999 4,808 5,203 0.42000 5,312 5,749 5.1
Annual mean 8,136 11,917 2.9

35
0.00
2.00
4.00
6.00
8.00
10.00
12.00
14.00
1992 1993 1994 1995 1996 1997 1998 1999 2000
Return Year
Rec
ruits
per
Spa
wne
r
Figure 28. Trend in recruits per spawner for Coos Complex wild coho.
Coquille ComplexThe Coquille Complex consists of coho salmon inhabiting streams from the
Coquille Basin south to Sixes River. Populations are found in the Coquille River, NewRiver, and Sixes River. There is an estimated 320 miles of spawning habitat availableto the coho salmon of this complex. The critical population level for the CoquilleComplex is 1,300 adult spawners. The habitat of this complex has the potential tosupport a viable population. Although high quality habitat is estimated to be present inonly 21 miles of stream, only slightly greater than the 15-mile threshold, the lowlandarea of the Coquille Basin, much of which becomes a lake during winter, provides winterrearing habitat. In fact, recent research (Miller 1998) has documented a life historypattern in Coquille River coho salmon whereby large numbers of juveniles activelymigrate to lowland reaches during spring and fall, presumably to take advantage of theover-wintering habitat.
The abundance of coho salmon spawners of the Coquille Complex has rangedfrom about 2,100 to about 16,200 and has averaged about 5,500 since 1990 (Figure 29and Table 17). Since 1990, abundance has never fallen below the critical threshold of1,300 fish and in only three years has the lower 95% confidence limit fallen below thecritical threshold. Recruits per wild spawner have exhibited a general downward trendover the last eight years, but with only the 1996 brood falling below one (Table 17 andFigure 30). Hatchery fish have been uncommon on the spawning grounds with only 42(5.3%) of 800 scales sampled from 1990-99 having hatchery patterns.

36
Smolt production was estimated for the 1997 through 1999 broods. Estimatedsmolt abundance ranged from 119 thousand to 296 thousand for the Coquille Complex(Table 4).
0
5000
10000
15000
20000
25000
1989 1990 1991 1992 1993 1994 1995 1996 1997 1998 1999 2000
Return Year
Spaw
ner A
bund
ance
SpawnersCritical Threshold
Figure 29. Trend in adult coho salmon abundance relative to the critical population levelfor the Coquille Complex. Error bars are 95% confidence limits.
Table 17. Population parameters for the Coquille Complex coho salmon.Return Wild Pre-harvest Recruits perYear spawners wild population spawner1990 2,712 8,7201991 5,651 10,3501992 2,115 4,3251993 7,384 12,797 4.71994 5,035 5,402 1.01995 2,116 2,416 1.11996 16,169 17,632 2.41997 5,720 6,530 1.31998 2,718 2,948 1.41999 3,183 3,445 0.22000 7,478 8,093 1.4
Annual mean 5,480 7,514 1.7

37
0
1
2
3
4
5
1992 1993 1994 1995 1996 1997 1998 1999 2000
Return Year
Rec
ruits
per
Spa
wne
r
Figure 30. Trend in recruits per spawner for Coquille Complex wild coho.
Trends and Patterns of Abundance
Over the period of years examined (1990-2000), most populations variedindependently from one another. This was true of both spawner abundance and pre-harvest abundance. Of 66 possible comparisons of abundance with each parameter,only six tracked together (Table 18), and were therefore significantly correlated(p<0.05). One would expect to find at least three significant correlations just fromrandom chance. It might also be expected that adjacent complexes would be morelikely to be correlated than distant complexes. Examination of the shaded diagonal cellsof Table 18 shows that of adjacent complexes, only the Umpqua and Lakes weresignificantly correlated. Only the Umpqua and Lakes, Umpqua and Siuslaw, and Siletzand Alsea exhibited significant correlations of both spawner abundance and pre-harvestabundance.
Whereas there were few correlations among population complexes, some distinctpatterns of abundance are evident. The only population complex that experienced asignificant trend in coho salmon spawner abundance was the Lakes (p=0.026), whichincreased at an average rate of 12 percent per year (Figure 23). The next closest toexhibiting a trend was the Umpqua, which increased an average 7% per year withp=0.163. For all other complexes, p ranged from 0.31 to 0.94. There were nosignificant trends in pre-harvest abundance because harvest impacts on coastal cohosalmon decreased from a high of about 70% in 1990 to a low of about 7% in 1994 andhave since remained low (Figure 31).

38
Populations in the various complexes tended to peak in different years. Over the11-year period, only one pattern occurred in all of the complexes: the below averagereturn in 1990 (Figure 32). A similar below average return occurred in 1997 in allcomplexes except the Coquille. In 1991, the populations in the North Coast GCA wereabove average while all other complexes except the Coquille were below average. In1993 and 1996, complexes from the Siuslaw south and the Yaquina south had aboveaverage spawner populations whereas those to the north except the Necanicum werebelow average. In 2000, spawner populations were above average in nine of the twelvecomplexes and may have been underestimated in the other three. The Yaquina, andCoos had spawners observed after the end of the survey season, although they were alljacks and adult males in the Coos. The Necanicum is a small basin where mainstemspawning could have been a factor.
Because of the large decline in harvest impacts, the pattern of interannualvariation in pre-harvest abundance was somewhat different from that of spawnerabundance. For example, whereas 1990 was a below average year for spawnerabundance coast wide, it was an above average year for pre-harvest abundance inseven of the twelve complexes (Figure 33). The below average spawner abundanceresulted from the high harvest impacts. However, the below average spawnerabundance observed in most complexes in 1997 and 1998 (Figure 32) was a reflectionof the below average pre-harvest abundance in all complexes except the Necanicum in1998 (Figure 33).
Comparative Health of Population Complexes
The relative health of the population complexes can be compared using threemethods: 1) comparing spawner abundance to the critical threshold; 2) comparing theviability of the complexes; and 3) comparing relative productivity of the populations.
Abundance Relative to the Critical ThresholdThe critical threshold “below which populations are at relatively high risk of
extinction in the near future” (McElhaney et al. 2000) is defined as four spawners permile. At abundances less than four fish per mile, modeling suggested that depensatoryprocesses, such as spawners not finding one another, will result in higher probabilitiesof extinction. With the exception of the Siletz Complex, population complexes from theYaquina north have experienced spawner abundances below the critical threshold moreoften in the 1990s than have population complexes to the south (Table 19). Ofparticular interest, the Nehalem, Tillamook, and Nestucca complexes were at or belowthe critical threshold most years from 1990 to 1998.
ViabilityThere are two aspects to viability: assessment of the habitat of a complex relative
to the defined viability standard and estimated probability of extinction. Populationviability analysis using the life-cycle model of Nickelson and Lawson (1998)

39
demonstrated that above the critical threshold of four spawners per mile, abundancehad little effect on population viability (Figure 4). However, for populations modeled inhypothetical river basins, the probability of extinction increased rapidly as the quantity ofhigh quality habitat available to the population was decreased from 15 miles (Figure 5).Thus, 15 miles of high quality habitat was used as criteria to determine if a populationwas viable: i.e. has “negligible risk of extinction due to local factors” (McElhaney et al.2000). Based on this criteria, three population complexes, the Necanicum, Tillamook,and Nestucca complexes, were judged not viable. This conclusion was reinforced whenthe Nickelson-Lawson life-cycle model was used to conduct population viability analysison the primary populations of each complex using 1999 spawner abundances. Each ofthese populations had a much higher probability of extinction than any populations in
Table 18. Correlation matrices for spawner abundance and pre-harvest abundanceamong complexes. Significant (p<0.05) correlation coefficients are shown in bold type.
Complex Nec Neh Til Nes Sil Yaq Als Siu Lks Ump CooNecanicum - Spawner AbundanceNehalem 0.05 -Tillamook 0.57 0.56 -Nestucca 0.00 0.27 0.46 -Siletz -0.30 0.66 0.20 0.15 -Yaquina -0.14 -0.22 -0.17 0.55 -0.09 -Alsea -0.19 0.04 0.04 0.25 0.65 0.02 -Siuslaw 0.04 0.38 0.17 0.39 0.44 0.62 0.13 -Lakes 0.44 0.30 0.27 0.46 -0.20 0.46 -0.28 0.41 -Umpqua 0.26 0.29 0.02 0.43 0.01 0.58 -0.18 0.69 0.78 -Coos -0.09 -0.21 -0.28 0.00 0.37 0.35 0.46 0.44 -0.21 0.22 -Coquille 0.34 0.12 0.12 -0.12 0.12 0.33 -0.01 0.60 0.48 0.33 0.20 Necanicum - Pre-Harvest AbundanceNehalem 0.15 -Tillamook 0.74 0.51 -Nestucca 0.06 0.21 0.45 -Siletz -0.19 0.38 0.04 0.15 -Yaquina -0.32 -0.37 -0.28 0.42 -0.23 -Alsea -0.19 -0.04 -0.09 0.22 0.86 -0.11 -Siuslaw 0.20 0.33 0.20 0.27 0.50 0.30 0.30 -Lake Basins 0.53 0.24 0.31 0.11 -0.46 0.10 -0.52 0.35 -Umpqua 0.31 0.19 -0.01 0.15 -0.03 0.27 -0.14 0.69 0.71 -Coos 0.03 -0.20 -0.19 0.06 0.61 0.09 0.69 0.46 -0.32 0.26 -Coquille 0.46 0.12 0.23 -0.24 0.00 0.09 -0.10 0.56 0.51 0.35 0.14

40
complexes that met the viability standard (Figure 34). It should be noted however, thatwith the exception of the Necanicum, all populations were well below the 5% probabilityof extinction in 100 years often used as a criteria for population sustainability(Thompson 1991; Allendorf et al. 1997; Goodman 1999)
0.0
0.1
0.2
0.3
0.4
0.5
0.6
0.7
0.8
1989 1990 1991 1992 1993 1994 1995 1996 1997 1998 1999 2000
Return Year
Har
vest
Impa
cts
Figure 31. Harvest impacts on coastal coho salmon. Harvest impacts in 2000 were notavailable but were assumed similar to those in 1999 based on the fisheries planned.
Complex 1990 1991 1992 1993 1994 1995 1996 1997 1998 1999 2000 Necanicum Nehalem Tillamook Nestucca Siletz Yaquina Alsea Siuslaw Lake Basins Umpqua Coos Coquille
Above average spawner abundance Below average spawner abundanceFigure 32. Patterns of spawner abundance relative to the eleven-year average.

41
Complex 1990 1991 1992 1993 1994 1995 1996 1997 1998 1999 2000 Necanicum Nehalem
Tillamook Nestucca
Siletz
Yaquina Alsea Siuslaw Lake Basins Umpqua
Coos
Coquille
Above average pre-harvest abundance Below average pre-harvest abundanceFigure 33. Patterns of pre-harvest abundance relative to the eleven-year average.
0% 1% 2% 3% 4% 5% 6% 7% 8% 9% 10%
Necanicum
Nehalem
Tillamook
Nestucca
Siletz
Yaquina
Alsea
Siuslaw
Lakes
Umpqua
Coos
Coquille
Probability of Extinction
Figure 34. Probability of extinction in 99 years (defined as the occurrence of a minimumpopulation of <2, adult spawners) estimated for each population complex in the OregonCoast ESU, except for the Nestucca, Siletz, Alsea, and Coquille complexes, which wereestimated for the largest primary population within the complex.

42
ProductivityProductivity is defined in the same way as Chilcote (2001): the number of recruits
per spawner. It is expressed as the intercept in the regression of natural log of recruitsper spawner on spawners, the α value in a Ricker recruitment function (Ricker 1975).Values of α were calculated for each population complex for brood years 1990-96.These values range from 0.84 for the Siletz Complex and 0.85 for the TillamookComplex to 2.30 for the Coos Complex (Table 19). Unexpectedly, the Necanicum andNestucca complexes, neither of which met the viability criteria, had higher α values thansix complexes that met the viability criteria. All six complexes have a history of cohosalmon hatchery programs.
Overall Ranking of Population HealthEach complex was ranked for viability, abundance, and productivity on a scale
from one to twelve with ties. Viability was ranked based on the sum of ranking forquantity of high quality habitat as a percentage of the criteria of 15 miles and theranking of probability of extinction. Abundance was ranked based on the sum ofranking for average spawner abundance as a percentage of the critical threshold foreach complex and the ranking of the number of years above the critical threshold.Productivity was ranked based on the value of the Ricker α for each complex.
The larger complexes tended to rank highest in viability, with the Umpqua andNehalem ranking one-two (Table 20). The three basins that failed to meet the viabilitycriteria ranked 10-12. The complexes of the Mid-South Coast GCA ranked first throughthird in abundance. This was likely the result of a period of marine conditions during themid 1990s that favored survival on the south coast but not the rest of the coast.Survival rates for coho salmon released from Cole Rivers Hatchery were high duringthis period, but were low elsewhere on the coast (Lewis 2000). Ranking of populationcomplexes based on productivity produced no discernable pattern (Table 20).
Table 19. Summary of the status of coho salmon population complexes.Average Number of years in Significant
Population Ctitical spawner last 11 above the spawner Ricker Complex viable? threshold abundance critical threshold trend? α value Necanicum No 300 600 7 No 1.51 Nehalem Yes 1,900 3,100 5 No 1.15 Tillamook No 1,000 1,000 3 No 0.85 Nestucca No 800 800 4 No 1.70 Siletz Yes 700 1,300 9 No 0.84 Yaquina Yes 600 1,700 6 No 1.96 Alsea Yes 1,400 2,900 9 No 1.04 Siuslaw Yes 2,300 3,800 9 No 1.25 Lakes Yes 400 9,000 11 +12%/yr 1.77 Umpqua Yes 4,900 7,600 7 No 1.29 Coos Yes 900 8,100 11 No 2.30 Coquille Yes 1,300 5,500 11 No 1.08

43
Table 20. Overall rankings of the relative health of population complexes.Relative Relative Ricker Average Overall
Complex viability abundance α value rank rankNorth Coast
Necanicum 12 7 5 8.0 9Nehalem 2 10 8 6.7 6Tillamook 11 12 11 11.3 12Nestucca 10 11 4 8.3 10
Mid-CoastSiletz 8 5 12 8.3 10Yaquina 7 7 2 5.3 3Alsea 6 4 10 6.7 6Siuslaw 4 6 7 5.7 5
UmpquaUmpqua 1 9 6 5.3 3
Mid-South CoastLakes 3 1 3 2.3 1Coos 5 2 1 2.7 2Coquille 8 3 9 6.7 6
With the exception of the Coquille and Nehalem complexes, the highest rankedcomplexes are located in the Mid-South GCA and the lowest ranked complexes arelocated in the North Coast GCA (Table 20). Overall, the relative health of populationsby GCA follows a trend from high ranks in the south to low ranks in the north (Figure35).
0 1 2 3 4 5 6 7 8 9 10 11
Overall rank
Ricker "a" value
Relative abundance
Relative viability
Average Rank
Mid-South Coast Umpqua Mid-Coast North Coast
Figure 35. Average rankings of population parameters by GCA.

44
References
Allendorf, F.W., Bayles D., Bottom D.L., Currens K.P., Frissell C.A., Hankin D.,Lichatowich J.A., Nehlsen W., Trotter P.C., and Williams T.H.. 1997. Prioritizingpacific salmon stocks for conservation. Cons. Biol. 11: 140-152.
Chilcote, M.W. 2001. Conservation assessment of steelhead populations in Oregon.Oregon Department of Fish and Wildlife, Unpublished manuscript. Portland.
Fisher, J. P., and W. G. Pearcy. 1985. Studies of juvenile salmonids off the Oregonand Washington coast, 1985. Oregon State University Sea Grant CollegeProgram, ORESU-T-85-004, Corvallis.
Goodman, D. 1999. Population viability analysis: the risk assessment paradigm. InWorkshop on assessing extinction risk for West Coast salmonids, Seattle, WA,November 13-15, 1996. NOAA Memo.
Hartt, A. C., and M. B. Dell. 1986. Early oceanic migrations and growth of juvenilePacific salmon and steelhead trout. International North Pacific FisheriesCommission Bulletin 46:1-105.
Huntington, C.W., W. Nehlsen, and J. Bowers. 1994. Healthy native stocks ofanadromous salmonids in the Pacific Northwest and California. Oregon Trout.Portland.
Jacobs, S.E. and C.X. Cooney. 1997. Oregon coastal salmon spawning surveys, 1994and 1995. Oregon Department of Fish and Wildlife, Fish Information Report 97-5. Portland.
Jacobs, S.E. and T.E. Nickelson. 1998. Use of stratified random sampling to estimatethe abundance of Oregon coastal coho salmon. Oregon Department of Fish andWildlife, Final Reports (Fish) Project # F-145-R-09, Portland.
Jacobs S., J. Firman, G. Susac, E. Brown, B. Riggers and K. Tempel. 2000. Status ofOregon coastal stocks of anadromous salmonids. Monitoring Program ReportNumber OPSW-ODFW-2000-3, Oregon Department of Fish and Wildlife,Portland.
Kostow, K. (editor). 1995. Biennial report of the status of wild fish in Oregon. OregonDepartment of Fish and Wildlife, Fish Division. Portland.
Labelle, M. 1992. Straying patterns of coho salmon (Oncorhynchus kisutch) stocks fromsoutheast Vancouver Island, British Columbia. Canadian Journal of Fisheries andAquatic Sciences 49:1843-1855.
Lewis, M.A. 2000. Stock assessment of anadromous salmonids, 1999. OregonDepartment of Fish and Wildlife, Oregon Plan for Salmon and Watersheds,Annual Progress Report number OPSW-ODFW-2000-4, Portland.

45
Lister, D. B., and H. S. Genoe. 1970. Stream habitat utilization by cohabitingunderyearlings of chinook (Oncorhynchus tshawytscha) and coho (O. kisutch)salmon in the Big Qualicum River, British Columbia. Journal of the FisheriesResearch Board of Canada 27:1215-1224.
McElhaney, P., M.H. Ruckelshaus, M.J. Ford, T.C. Wainwright, and E.P. Bjorkstedt.2000. Viable salmonid populations and the recovery of evolutionarily significantunits. U.S. Dept. Commer., NOAA Tech. Memo. NMFS-NWFSC-42, 156 p.
Miller, B. 1998. Juvenile salmonid out-migration in the North Fork Coquille River in1998. Oregon Department of Fish and Wildlife Life-Cycle Monitoring Projectunpublished Report. Charleston.
Moring, J. R., and R. L. Lantz. 1975. The Alsea watershed study: Effects of logging onthe aquatic resources of three headwater streams of the Alsea River, Oregon.Part I - Biological studies. Oregon Department of Fish and Wildlife, FisheryResearch Report Number 9, Corvallis.
Mundie, J. H. 1969. Ecological implications of the diet of juvenile coho in streams.Pages 135-152. In T. G. Northcote [ed.] Symposium on salmon and trout instreams. H. R. MacMillan Lectures in Fisheries. University. of British Columbia,Vancouver, B.C.
Nickelson, T.E. 1998. A habitat-based assessment of coho salmon productionpotential and spawner escapement needs for Oregon coastal streams. OregonDepartment of Fish and Wildlife, Fish Information Report 98-4. Portland.
Nickelson, T.E. and P. Lawson. 1998. Population viability of coho salmonOcorhynchus kisutch, in Oregon coastal basins: Application of a habitat-basedlife-cycle model. Canadian Journal of Fisheries and Aquatic Sciences 55: 2383-2392.
Nickelson, T. E., J. D. Rodgers, S. L. Johnson, and M. F. Solazzi. 1992a. Seasonalchanges in habitat use by juvenile coho salmon (Oncorhynchus kisutch) inOregon coastal streams. Canadian Journal of Fisheries and Aquatic Sciences49:783-789.
Nickelson, T. E., M. F. Solazzi, S. L. Johnson, and J. D. Rodgers. 1992b.Effectiveness of selected stream improvement techniques to create suitablesummer and winter rearing habitat for juvenile coho salmon (Oncorhynchuskisutch) in Oregon coastal streams. Canadian Journal of Fisheries and AquaticSciences 49:790-794.
ODFW 1995. Biennial report on the status of wild fish in Oregon. Oregon Departmentof Fish and Wildlife, Portland.
46
OPSW. 1997. The Oregon plan for restoring salmon and watersheds. Governor'sOffice, Salem, OR.
PFMC. 1999. Final Amendment 13 to the Pacific Coast Salmon Plan. Fisherymanagement regime to ensure protection and rebuilding of Oregon coastalnatural coho. Pacific Fishery Management Council. Portland, Oregon.
Reiser, D. W., and T. C. Bjornn. 1979. Habitat requirements of anadromous salmonids.Ch. 1. In W. R. Meehan [tech. ed.] Influence of forest and rangelandmanagement on anadromous fish habitat in the western United States andCanada. Pacific Northwest Forest and Range Experiment Station, USDA. ForestService, Portland.
Ricker, W.E. 1975. Computation and interpretation of biological statistics of fishpopulations. Bulletin of the Fisheries Research Board of Canada No. 191.Ottawa.
Rodgers, J. D., S. L. Johnson, T. E. Nickelson, and M. F. Solazzi. 1993. The seasonaluse of natural and constructed habitat by juvenile coho salmon (Oncorhynchuskisutch) and preliminary results from two habitat improvement projects on smoltproduction in Oregon coastal streams. In Proceedings of the coho workshop,May 26-28, 1992 at Nanaimo, B.C.
Sharr, S., C. Melcher, T. Nickelson, P. Lawson, R. Kope, and J. Coon. 2000. 2000review of Amendment 13 to the Pacific Coast Salmon Plan. Pacific FisheriesManagement Council. Portland.
Solazzi, M.F., S.L. Johnson, B. Miller, and T. Dalton. 2000. Salmonid Life-CycleMonitoring Project 1998 and 1999. Monitoring Program Report Number OPSW-ODFW-2000-2, Oregon Department of Fish and Wildlife, Portland.
Solazzi, M.F., S.L. Johnson, B. Miller, and T. Dalton. 2001. Salmonid Life-CycleMonitoring Project 1998 and 1999. Monitoring Program Report Number OPSW-ODFW-2001-2, Oregon Department of Fish and Wildlife, Portland.
Stevens D.L. 1997. Variable density grid-based sampling designs for continuousspatial populations. Environmetrics: 8 167-195.
Thompson, G.G. 1991. Determining minimum viable populations under the EndangeredSpecies Act. NOAA Technical Memorandum NMFS F/NWC-198.
Waples, R.S. 1995. Evolutionarily significant units and the conservation of biologicaldiversity under the Endangered Species Act. In Evolution and the aquaticecosystem: Defining unique units in population conservation. Am. Fish. Soc.Symp. 17:8-27.

47
Weitkamp, L.A., T.C. Wainwright, G.J. Bryant, G.B. Milner, D.J. Teel, R.G. Kope, andR.S. Waples. 1995. Status review of coho salmon from Washington, Oregonand California. NOAA Technical Memorandom NMFS-NWFSC-24.


