Population Ageing, Government Budgets and the … Ageing, Government Budgets and the Baby Boomers...
30
Population Ageing, Government Budgets and the Baby Boomers Ann Harding Presentation to the Institute of Actuaries of Australia Conference on ‘The New Super Landscape’, Sydney, 30 November 2006 NATSEM, University of Canberra The research presented in this presentation was partly funded by ARC Grant No LP562493
Transcript of Population Ageing, Government Budgets and the … Ageing, Government Budgets and the Baby Boomers...
Population Ageing, Government
Budgets and the Baby Boomers
Ann Harding Presentation to the
Institute of Actuaries of Australia Conference on ‘The
New Super Landscape’, Sydney, 30 November 2006
NATSEM, University of Canberra
The research presented in this presentation was partly funded by ARC Grant No LP562493
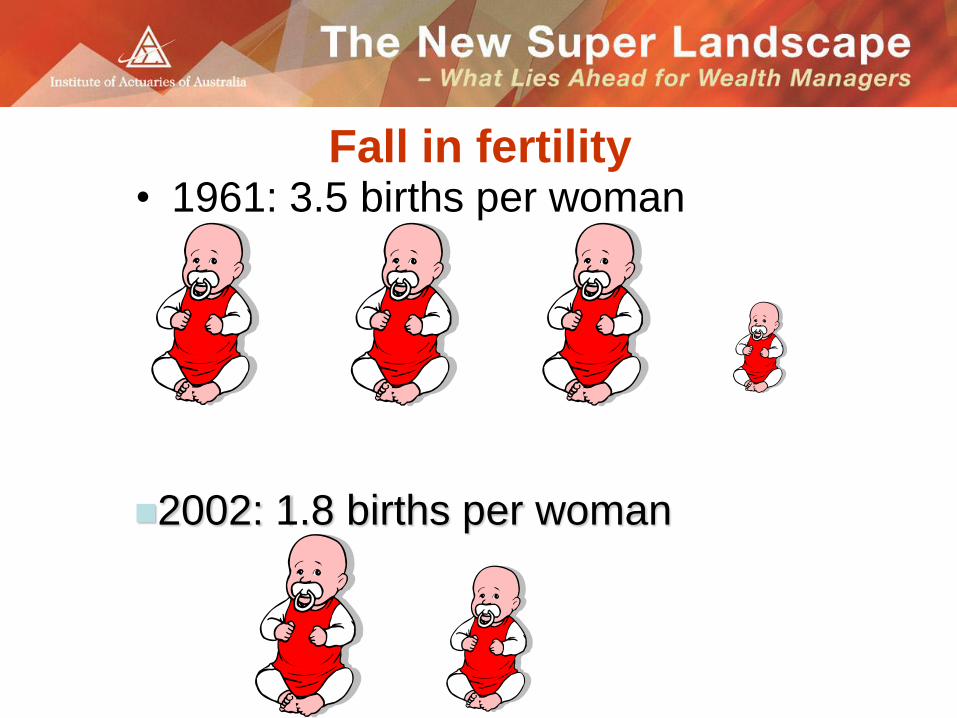
Fall in fertility • 1961: 3.5 births per woman
2002: 1.8 births per woman
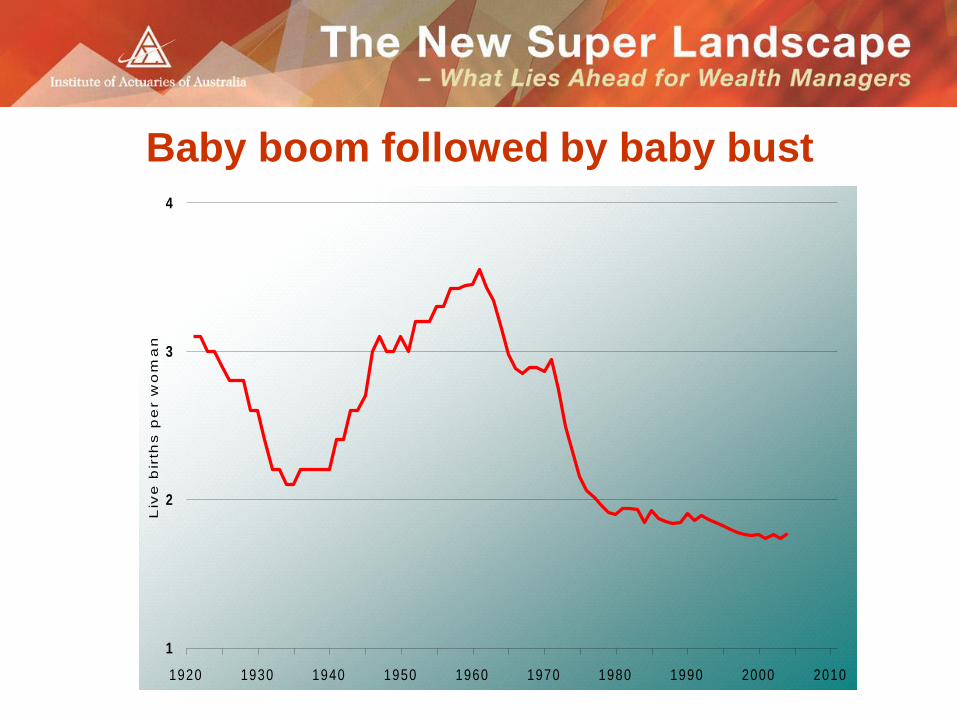
Baby boom followed by baby bust
1
2
3
4
1920 1930 1940 1950 1960 1970 1980 1990 2000 2010
Liv
e b
irth
s p
er w
om
an
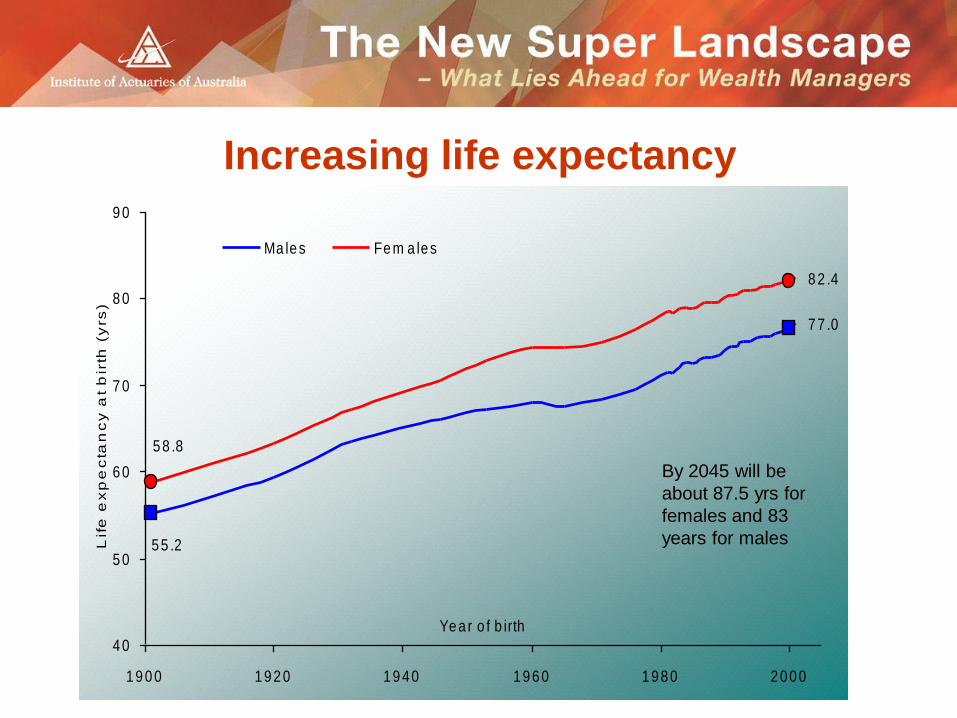
Increasing life expectancy
5 5 .2
7 7 .0
5 8 .8
8 2 .4
4 0
5 0
6 0
7 0
8 0
9 0
1 9 0 0 1 9 2 0 1 9 4 0 1 9 6 0 1 9 8 0 2 0 0 0
Ye a r o f b irth
Lif
e e
xp
ec
tan
cy
at
bir
th (
yrs
)
Ma le s Fe m a le s
By 2045 will be
about 87.5 yrs for
females and 83
years for males
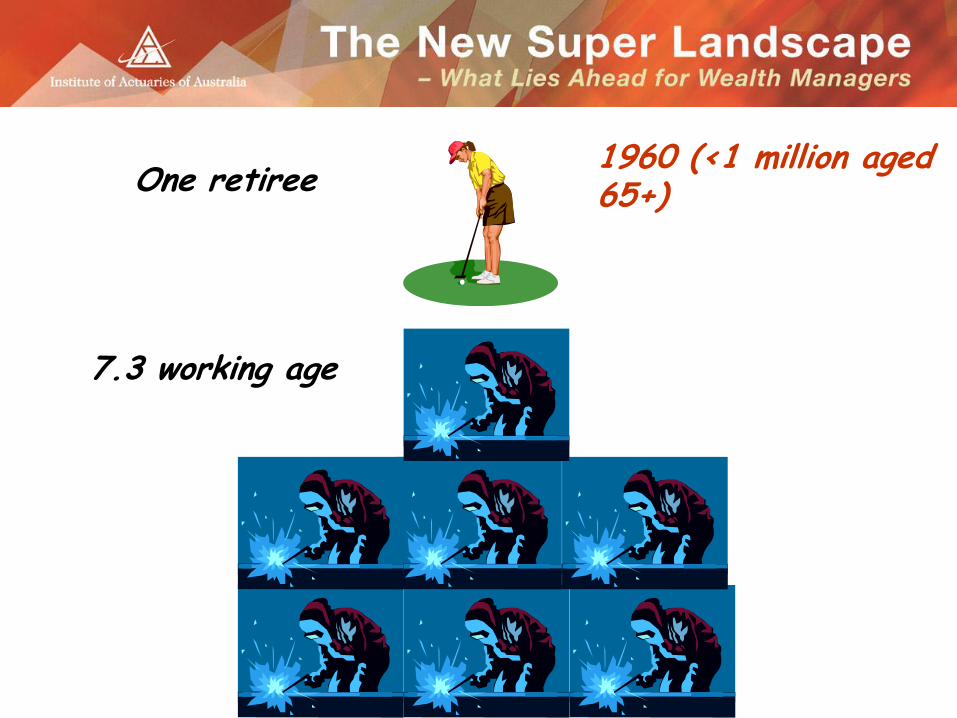
One retiree 1960 (<1 million aged 65+)
7.3 working age
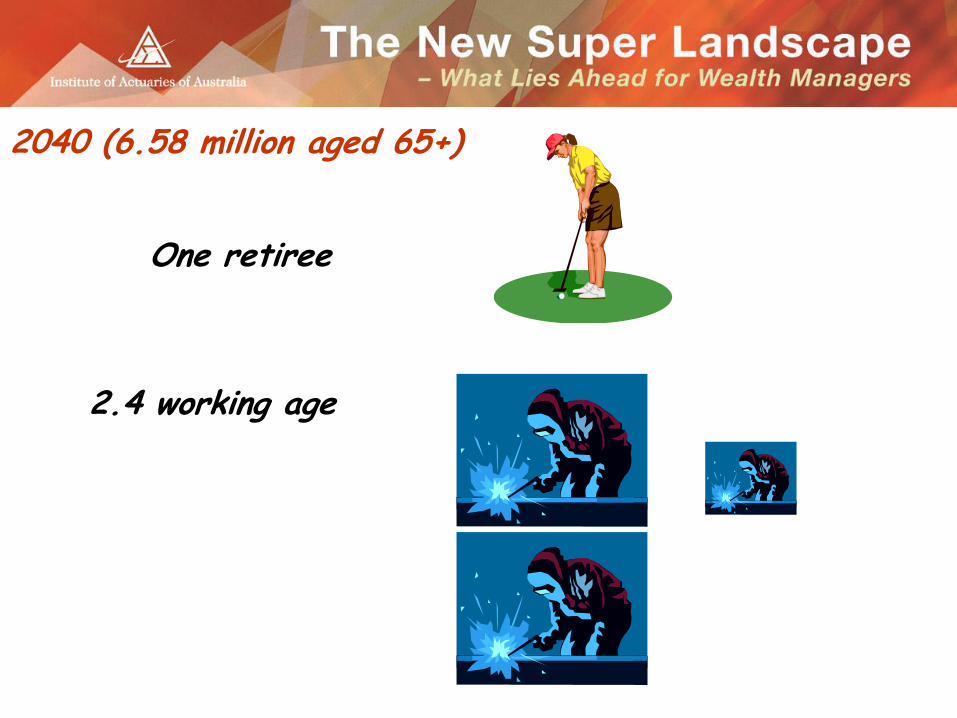
One retiree
2040 (6.58 million aged 65+)
2.4 working age
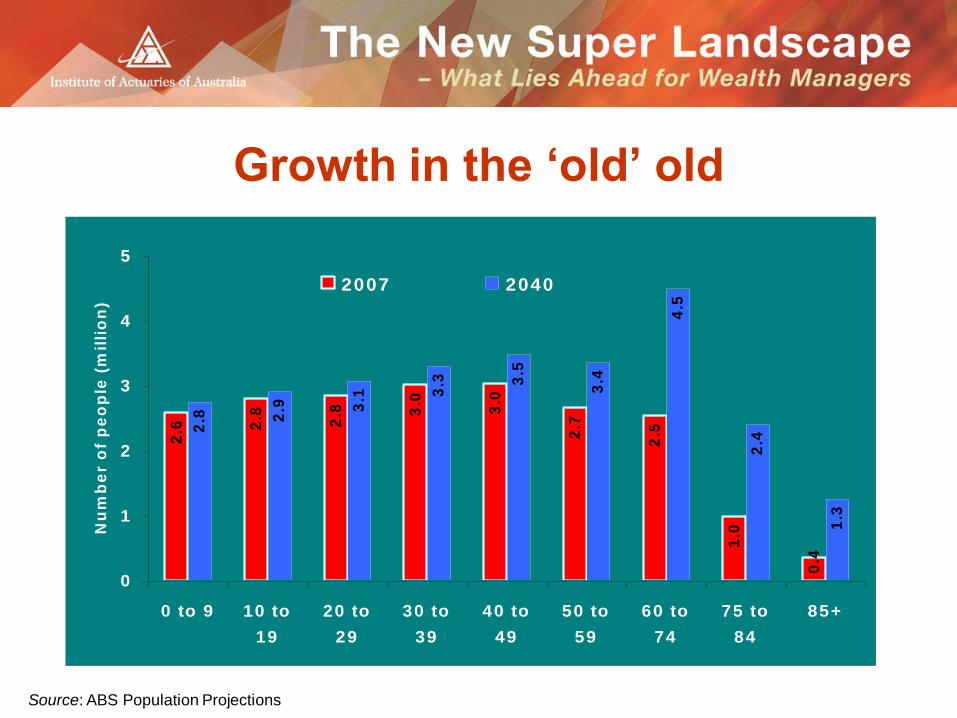
Growth in the ‘old’ old 2
.6 2.8 2.8 3
.0
3.0
2.7
2.5
1.0
0.4
2.8 2
.9 3.1 3
.3 3.5
3.4
4.5
2.4
1.3
0
1
2
3
4
5
0 to 9 10 to
19
20 to
29
30 to
39
40 to
49
50 to
59
60 to
74
75 to
84
85+
Nu
mb
er
of
pe
op
le (
mil
lio
n)
2007 2040
Source: ABS Population Projections
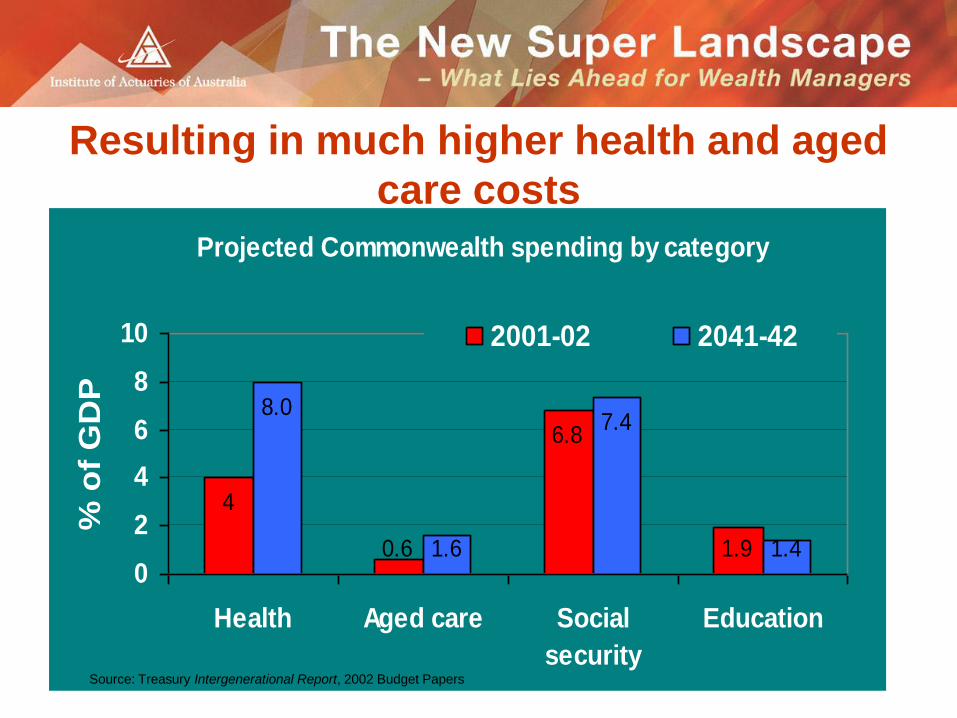
Resulting in much higher health and aged
care costs
Projected Commonwealth spending by category
4
0.6
6.8
1.9
8.0
1.6
7.4
1.40
2
4
6
8
10
Health Aged care Social
security
Education
% o
f G
DP
2001-02 2041-42
Source: Treasury Intergenerational Report, 2002 Budget Papers
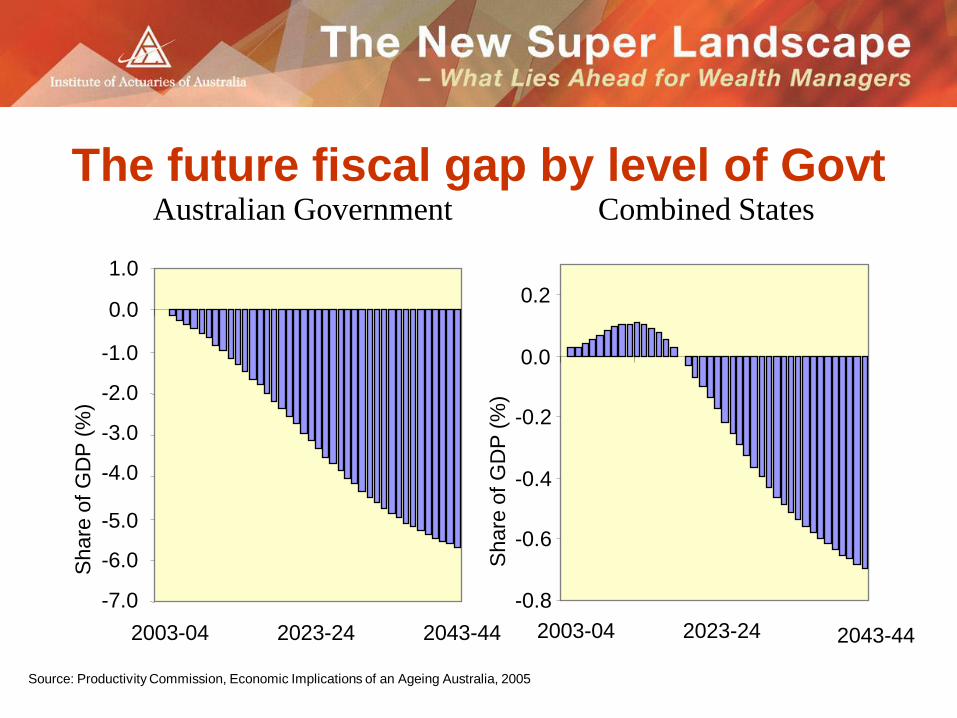
The future fiscal gap by level of Govt Australian Government Combined States
-7.0
-6.0
-5.0
-4.0
-3.0
-2.0
-1.0
0.0
1.0
2003-04 2023-24 2043-44
Share
of
GD
P (
%)
-0.8
-0.6
-0.4
-0.2
0.0
0.2
2003-04 2023-24 2043-44
Share
of
GD
P (
%)
Source: Productivity Commission, Economic Implications of an Ageing Australia, 2005
The policy response?
• ‘Future generations of taxpayers would
face higher taxes … or governments
would need to reduce the projected growth
in spending’ (IGR, p. 6)
• Projected magnitude of gap of 5% of GDP
in 2042 equals ‘the entire amount
allocated to health’ Sources: Treasurer, 2004, Australia’s Demographic Challenges (available from www.treasurer.gov.au);
Treasury, 2002, Budget Paper No. 5, Intergenerational Report 2002-03, May.
The ageing population and future
labour supply
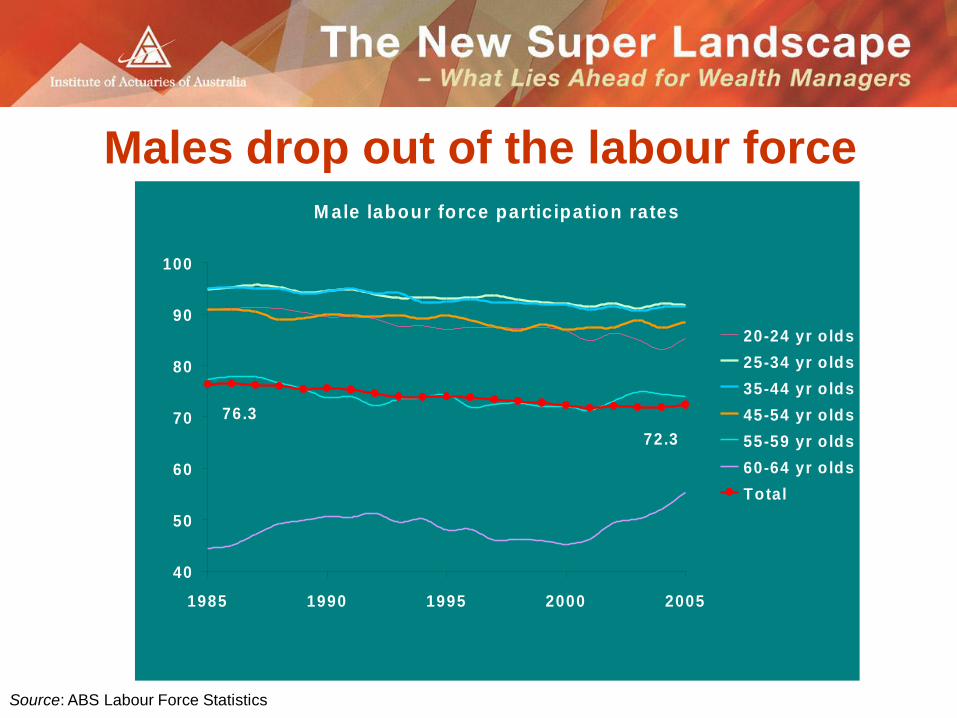
Males drop out of the labour force
Source: ABS Labour Force Statistics
M ale labour force participation rates
40
50
60
70
80
90
100
1985 1990 1995 2000 2005
20-24 yr o lds
25-34 yr o lds
35-44 yr o lds
45-54 yr o lds
55-59 yr o lds
60-64 yr o lds
Total
72.3
76.3
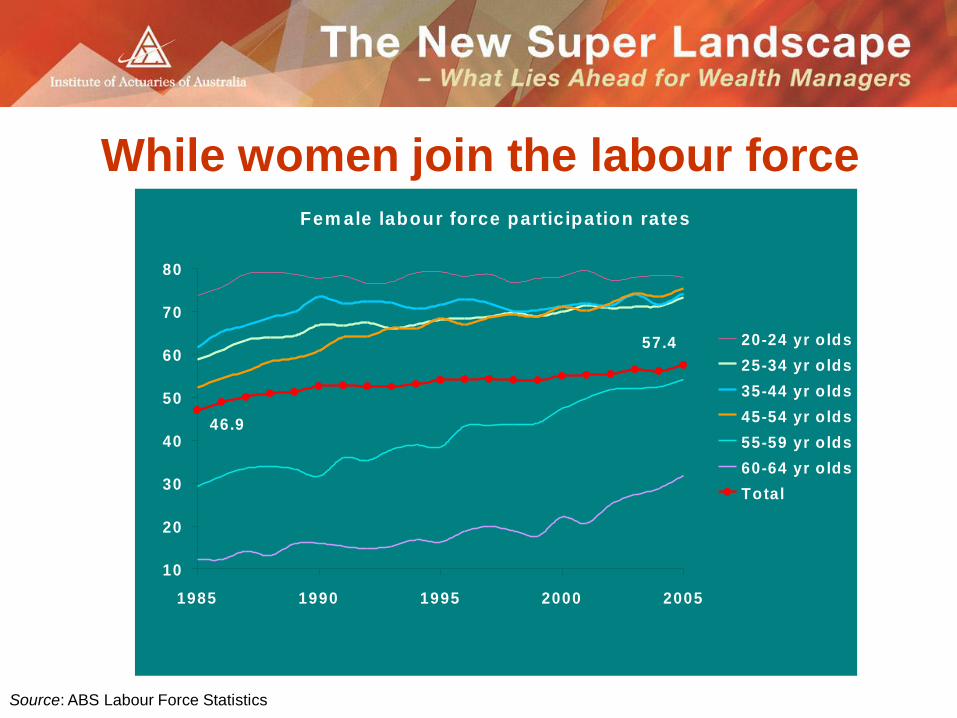
While women join the labour force
Source: ABS Labour Force Statistics
Fem ale labour force participation rates
10
20
30
40
50
60
70
80
1985 1990 1995 2000 2005
20-24 yr o lds
25-34 yr o lds
35-44 yr o lds
45-54 yr o lds
55-59 yr o lds
60-64 yr o lds
Total
46.9
57.4
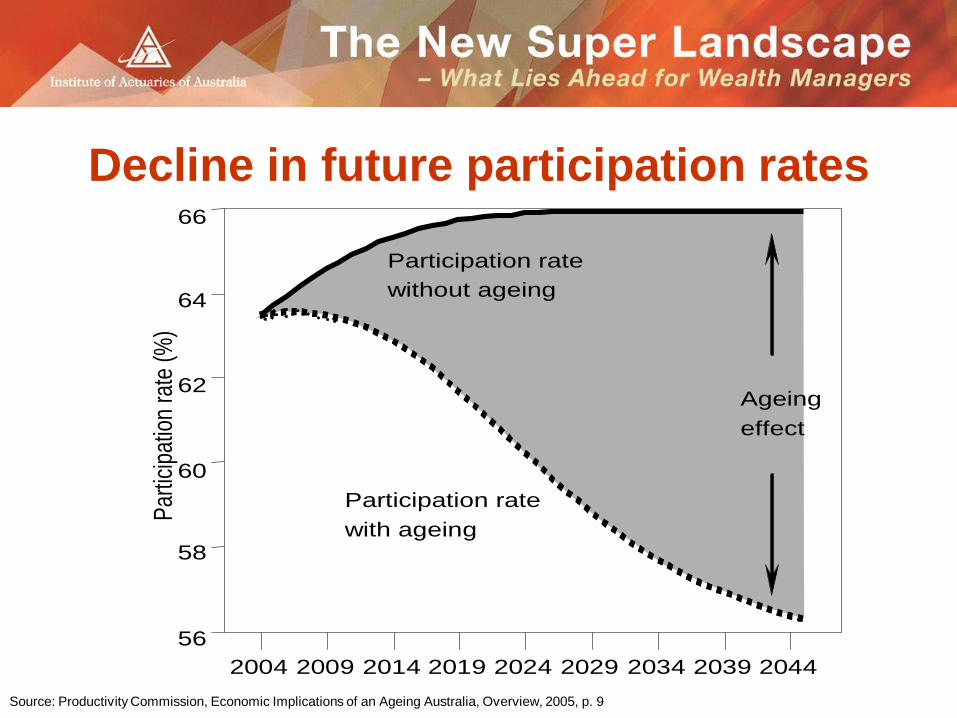
Decline in future participation rates P
artic
ipat
ion
rate
(%
)
2004 2009 2014 2019 2024 2029 2034 2039 2044
56
58
60
62
64
66
Participation rate
with ageing
Participation rate
without ageing
Ageing
effect
Source: Productivity Commission, Economic Implications of an Ageing Australia, Overview, 2005, p. 9
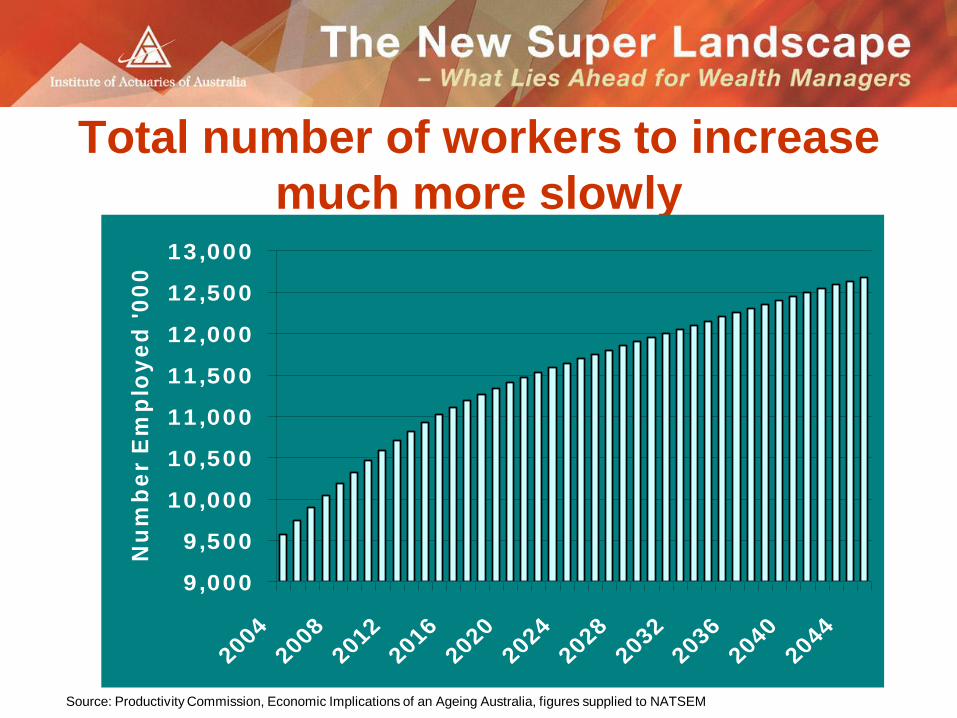
Total number of workers to increase
much more slowly
Source: Productivity Commission, Economic Implications of an Ageing Australia, figures supplied to NATSEM
9,000
9,500
10,000
10,500
11,000
11,500
12,000
12,500
13,000
2004
2008
2012
2016
2020
2024
2028
2032
2036
2040
2044
Nu
mb
er
Em
plo
ye
d '
00
0
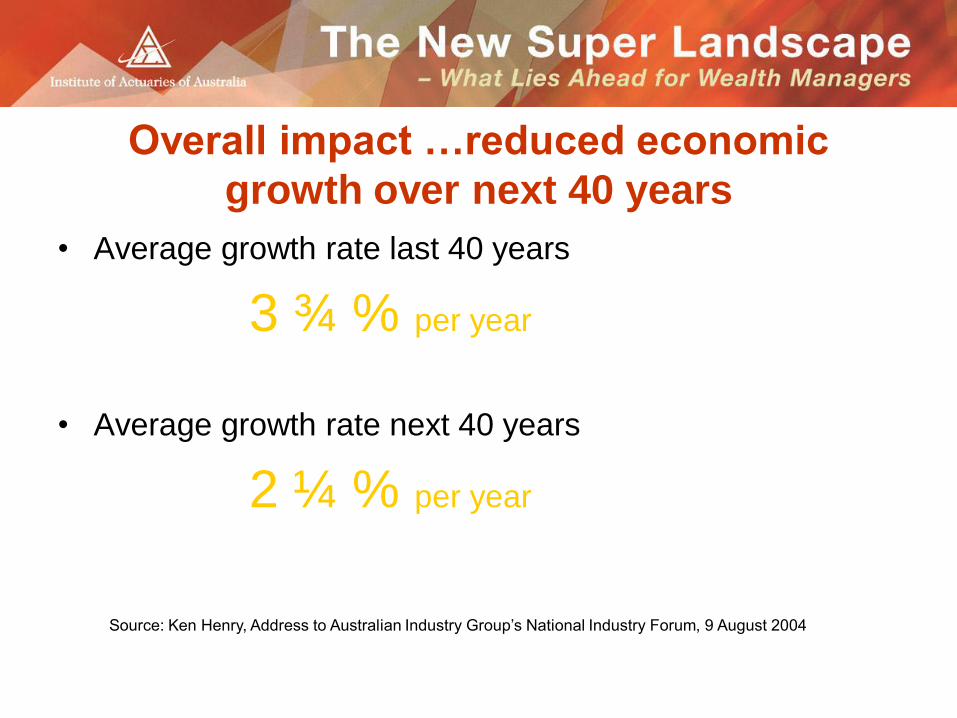
Overall impact …reduced economic
growth over next 40 years
• Average growth rate last 40 years
3 ¾ % per year
• Average growth rate next 40 years
2 ¼ % per year
Source: Ken Henry, Address to Australian Industry Group’s National Industry Forum, 9 August 2004
A comfortable retirement for the
boomers?
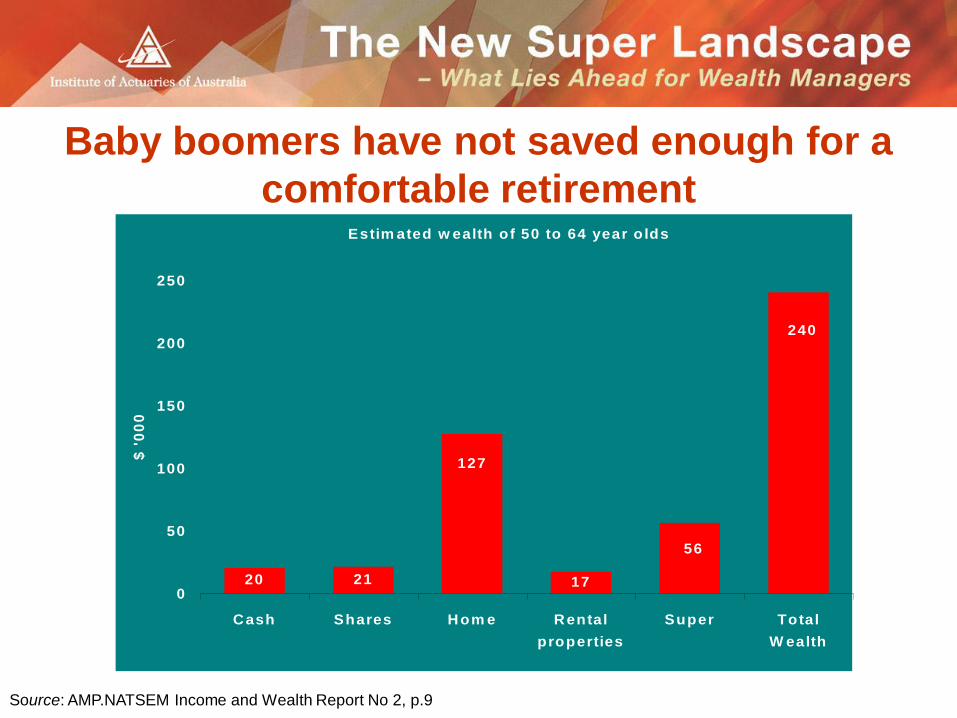
Baby boomers have not saved enough for a
comfortable retirement
Source: AMP.NATSEM Income and Wealth Report No 2, p.9
Estim ated w ealth of 50 to 64 year o lds
2120
240
127
56
170
50
100
150
200
250
Cash Shares Hom e Rental
properties
Super Total
W ealth
$ '
00
0
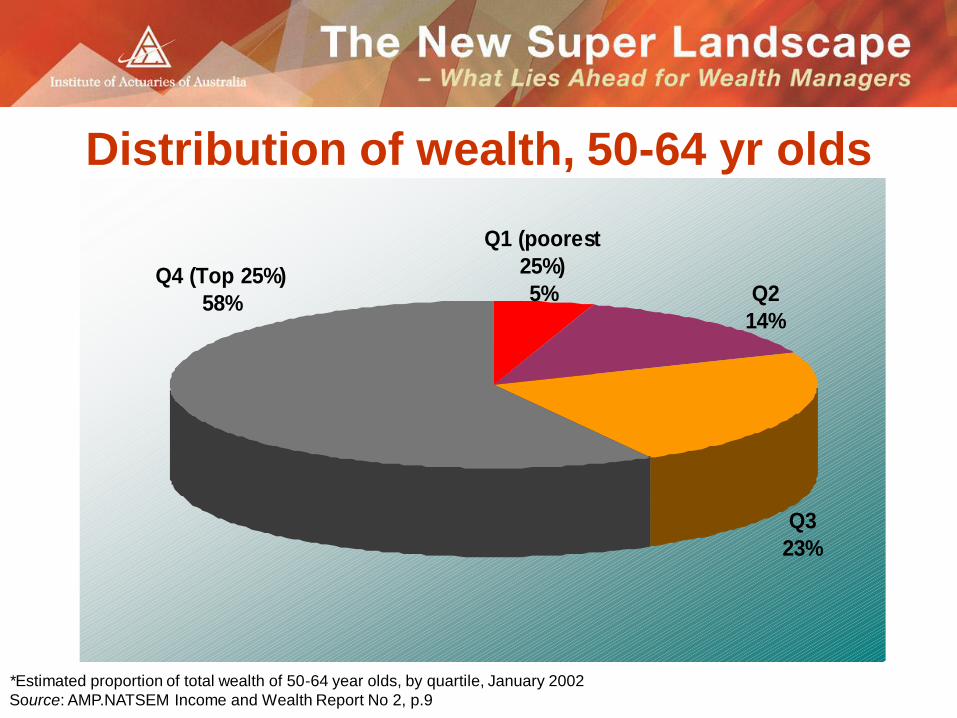
Distribution of wealth, 50-64 yr olds
Q2
14%
Q1 (poorest
25%)
5%
Q3
23%
Q4 (Top 25%)
58%
*Estimated proportion of total wealth of 50-64 year olds, by quartile, January 2002
Source: AMP.NATSEM Income and Wealth Report No 2, p.9
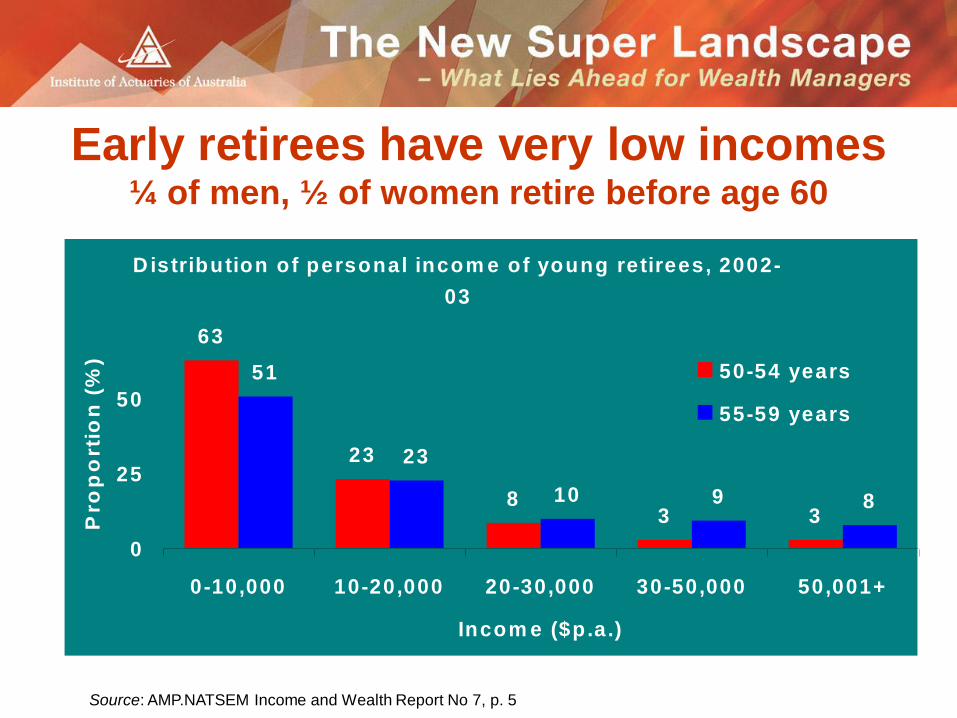
Early retirees have very low incomes ¼ of men, ½ of women retire before age 60
Source: AMP.NATSEM Income and Wealth Report No 7, p. 5
Distribution of personal incom e of young retirees, 2002-
03
63
23
83 3
51
23
10 9 8
0
25
50
0-10,000 10-20,000 20-30,000 30-50,000 50,001+
Incom e ($p.a.)
Pro
po
rtio
n (
%)
50-54 years
55-59 years
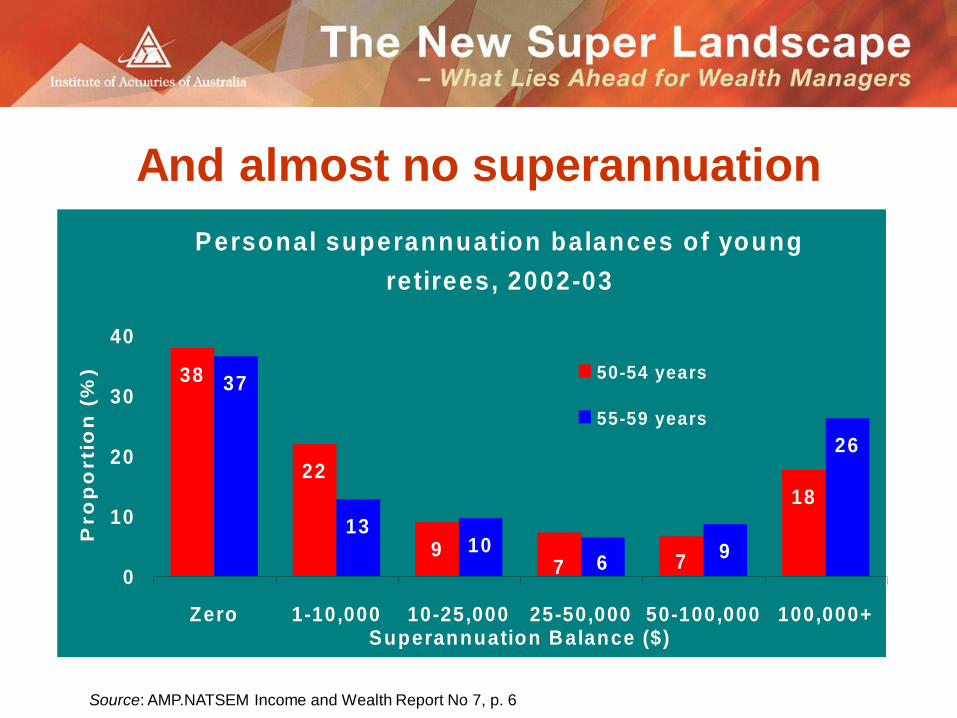
And almost no superannuation
Source: AMP.NATSEM Income and Wealth Report No 7, p. 6
Personal superannuation balances of young
retirees, 2002-03
38
22
9
18
37
1310 9
26
77 60
10
20
30
40
Zero 1-10,000 10-25,000 25-50,000 50-100,000 100,000+Superannuation Balance ($)
Pro
po
rti
on
(%
) 50-54 years
55-59 years
Treasurer’s view
“As our retirement income system matures, is
it fair to allow those with superannuation
assets to retire early, run down their assets and
then rely on taxpayers to fund the major part
of their retirement? This is an important issue
that we will need to consider very carefully.”
Costello, 2004
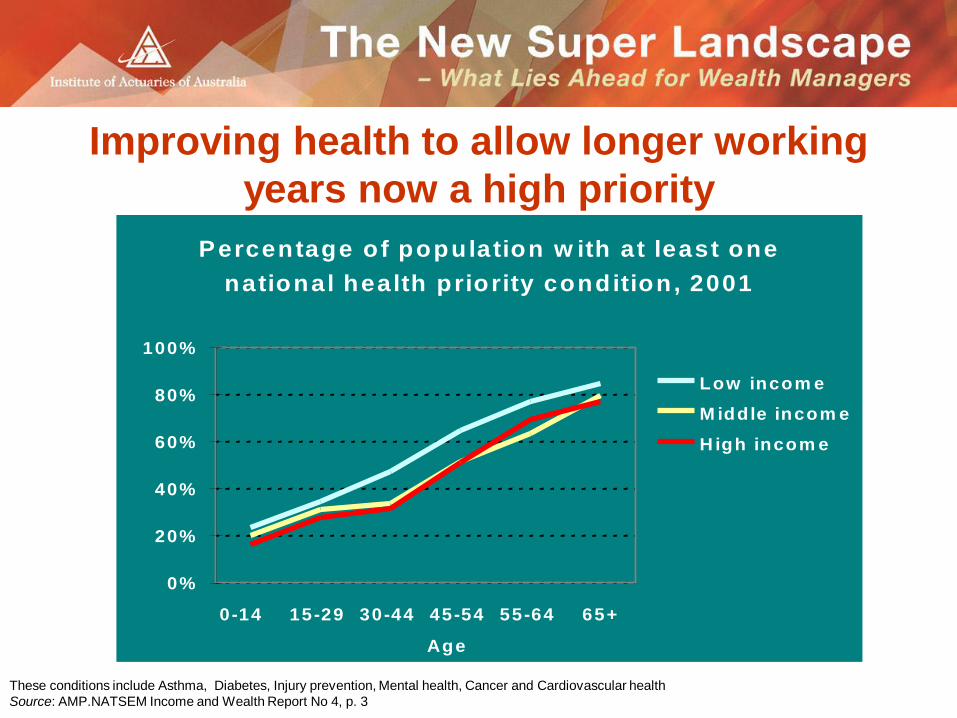
Improving health to allow longer working
years now a high priority
Percentage of population w ith at least one
national health priority condition, 2001
0%
20%
40%
60%
80%
100%
0-14 15-29 30-44 45-54 55-64 65+
Age
Low incom e
M iddle incom e
H igh incom e
These conditions include Asthma, Diabetes, Injury prevention, Mental health, Cancer and Cardiovascular health
Source: AMP.NATSEM Income and Wealth Report No 4, p. 3
Projecting the future
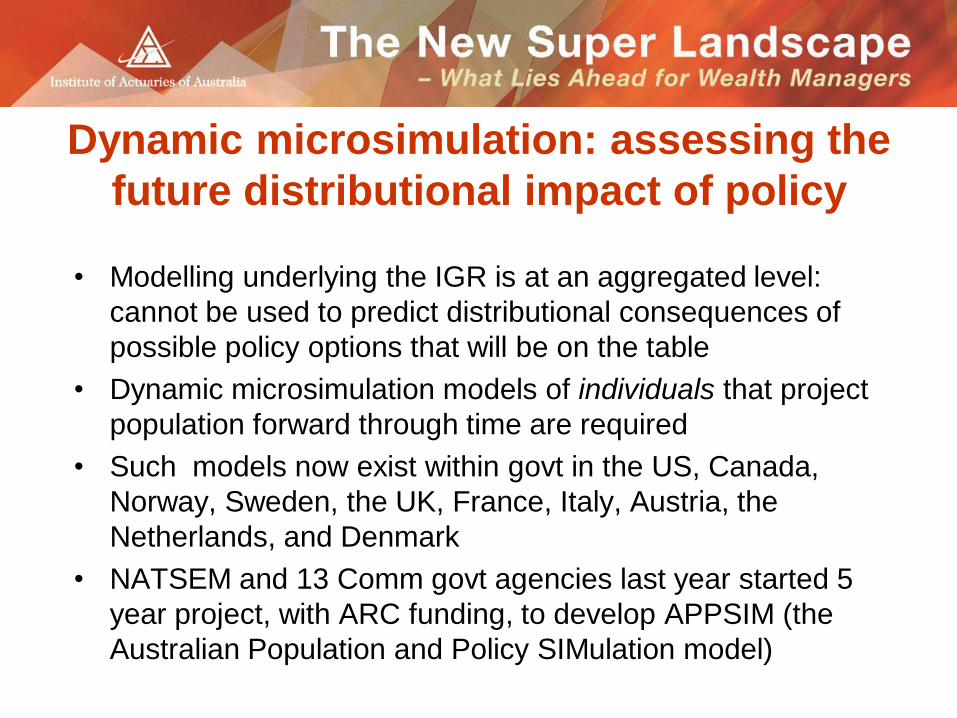
Dynamic microsimulation: assessing the
future distributional impact of policy
• Modelling underlying the IGR is at an aggregated level:
cannot be used to predict distributional consequences of
possible policy options that will be on the table
• Dynamic microsimulation models of individuals that project
population forward through time are required
• Such models now exist within govt in the US, Canada,
Norway, Sweden, the UK, France, Italy, Austria, the
Netherlands, and Denmark
• NATSEM and 13 Comm govt agencies last year started 5
year project, with ARC funding, to develop APPSIM (the
Australian Population and Policy SIMulation model)
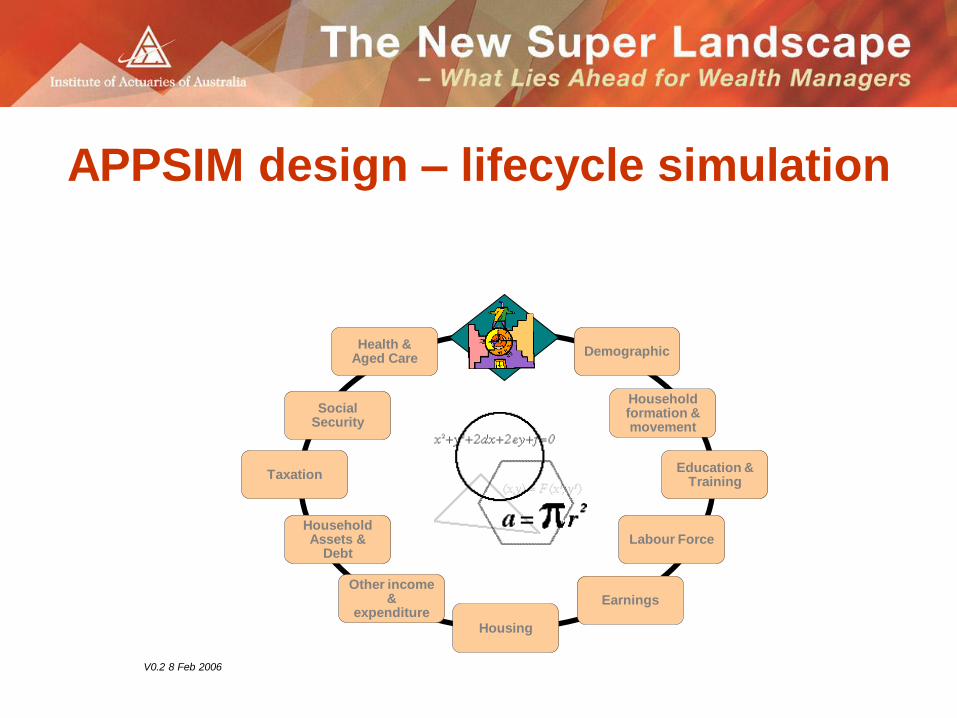
Labour Force Household Assets &
Debt
Earnings
Taxation
Social Security
Education & Training
Household formation & movement
Demographic Health &
Aged Care
Other income &
expenditure Housing
New Year
?
V0.2 8 Feb 2006
APPSIM design – lifecycle simulation
Developing modelling infrastructure to
look at equity issues associated with
population ageing
• Who will pay the increased taxes predicted in the IGR?
• Who will pay more for their pharmaceuticals, medical services, education, child care, or aged care?
• What will be the impact between the different generations?
• Modelling to help ensure that we cope with the impacts of population ageing in the fairest and most efficient way
Policy responses to population ageing
• Treasury’s 3P’s - population, participation, and
productivity
– Govt focussing on welfare, workplace and labour
market reform
– Reforming super’n; encouraging business to look at
older/disdavantaged employees; chronic diseases
and LFP
– Immigration very partial solution
• Age pension reforms
– Impose an upper limit on exemption of home from the
pension means test
– Raise age at which get pension beyond 65 yrs

Conclusions • Effective labour supply growth to slow sharply in less
than 10 years time
– Lower labour force participation rates
– Reduced average hours
– Slower growth in worker numbers
• But about 1/4 of men and 1/2 of women retire before age 60
• Most 50-64 year olds have not saved enough for a financially comfortable retirement
• Many baby boomers will need to work longer and save harder if they want a comfortable retirement
• Economic growth to slow and fiscal pressures on govt to increase

Stay in touch with new research
NATSEM research freely available from
www.natsem.canberra.edu.au
To stay in touch via automatic email notification of new
research:
AMP:NATSEM reports freely available from
www.amp.com.au/ampnatsemreports