Poor Participants and Even Poorer Free Riders in Nepal’s ...
39
Draft: Comments are welcome 1 Poor Participants and Even Poorer Free Riders in Nepal’s Community Forestry Programme Baikuntha Aryal 1 * and Arild Angelsen 1Ψ Abstract Common property resource management (CPRM) is often considered a win-win option for conserving resources and biodiversity, and enhancing local development and poverty reduction. This includes community-based forest management schemes, where Nepal has been a pioneer with its community forestry programme (CFP) launched in the late 1970s. While the programme has halted forest degradation, the economic gains are less documented and more debatable. This study investigates the factors determining the participation in community forestry and the resulting impact of participation on forest income. Based on the data of 452 households from 16 villages in central Nepal, our analysis suggests that poverty tends to increase participation in the programme. However, we find no evidence of participation increasing forest income. On the contrary, the free riders are the ones that appear to be gaining from CFP. The free riders are the poorest with an average income more than 40% below that of participants, suggesting membership may be too costly for the very poorest both in terms of membership costs and the restrictions membership imposes on forest use. Key words: Community forestry, Nepal, poverty, participation, free riding. 1 Introduction The Community Forestry Programme (CFP) of Nepal was introduced in 1978 and transferred the management and use rights over national forests to the local communities. Locally formed Community Forest User Groups (CFUG) are responsible for executing operational plans of management of CFP. A steadily growing number of CFUGs – more than 13,000 by 2004 – is a strong indication of the popularity of the programme. 1 Department of Economics and Resource Management, Norwegian University of Life Sciences, P.O. Box 5003, N 1432, Ås, Norway Email: * [email protected] , Ψ [email protected]
Transcript of Poor Participants and Even Poorer Free Riders in Nepal’s ...
Draft: Comments are welcome
1
Poor Participants and Even Poorer Free Riders in Nepal’s
Community Forestry Programme
Baikuntha Aryal1* and Arild Angelsen1Ψ
Abstract
Common property resource management (CPRM) is often considered a win-win option for
conserving resources and biodiversity, and enhancing local development and poverty reduction.
This includes community-based forest management schemes, where Nepal has been a pioneer
with its community forestry programme (CFP) launched in the late 1970s. While the programme
has halted forest degradation, the economic gains are less documented and more debatable. This
study investigates the factors determining the participation in community forestry and the
resulting impact of participation on forest income. Based on the data of 452 households from 16
villages in central Nepal, our analysis suggests that poverty tends to increase participation in the
programme. However, we find no evidence of participation increasing forest income. On the
contrary, the free riders are the ones that appear to be gaining from CFP. The free riders are the
poorest with an average income more than 40% below that of participants, suggesting
membership may be too costly for the very poorest both in terms of membership costs and the
restrictions membership imposes on forest use.
Key words: Community forestry, Nepal, poverty, participation, free riding.
1 Introduction The Community Forestry Programme (CFP) of Nepal was introduced in 1978 and transferred the
management and use rights over national forests to the local communities. Locally formed
Community Forest User Groups (CFUG) are responsible for executing operational plans of
management of CFP. A steadily growing number of CFUGs – more than 13,000 by 2004 – is a
strong indication of the popularity of the programme.
1 Department of Economics and Resource Management, Norwegian University of Life Sciences, P.O. Box 5003, N 1432, Ås, Norway Email: * [email protected], Ψ [email protected]

Draft: Comments are welcome
2
Although all households in the local communities are supposed to become the members, this is
far from being the case. In our sample less than half (49%) of the villagers were the participants.
In principle, only members are allowed to collect forest products from community forests (CF),
and the prime reason to join the programmes is therefore to get access to basic forest products. In
practice however, many non-members use CF and thereby become free riders (19% in our
sample). Moreover, non-forest benefits can also play an important role for joining a CFUG, for
example, building social network, maintaining social status, or a concern for forest degradation.
Thus, we found that 15% of the members did not collect anything from CF.
This paper addresses two questions: First, what makes people participate in CFP? Second, do
participants gain in terms of higher forest income from participation? As part of answering these
we deal with the issue of free riding explicitly, as free riding is and alternative strategy to
membership. This issue is quite surprisingly missing from most of the literature on CFM in
Nepal.
The emerging consensus suggests that the CFM programme has succeeded in halting the forest
degradation and deforestation (Arnold 1995; Pokharel 2002; Maharjan 2003). Implementation of
community forestry as the primary forest policy in Nepal is leading to rejuvenation of once
degraded forest areas in the mountains. Nepal’s community forestry policy is considered to be
one of the most progressive forest policies in the world (Bhatia 1999). The empirical evidence on
equity and the economic benefits from CFM is, however, rather mixed (Kumar 2002; Adhikari,
Falco et al. 2004). Related to this, both policy makers and researchers have tended to overlook
the programme’s economic incentives to the local users, with most of the analyses being done on
the broader institutional issues rather than individual incentives (Das 2000 cited in Adhikari et al.
2004).
Kumar (2002: 764) argues that participation in common pool resources helps the rich more than
the poor: “Common pool resource management is well suited for the regeneration at the cost of
poor” (see also Graner, 1997). After the forests were handed to the local communities for
management most of them have been protected for regeneration and hence restricted the access
causing significant problems to the households. Despite of a large literature on community

Draft: Comments are welcome
3
forestry in Nepal, few studies explicitly tell whether it is benefiting the local users or not.
Exceptionally, Bhattarai and Ojha (2000) found that the poor households because of lack of
interest and rich households do not benefit from participating and middle income households are
benefiting most. Dev et al. (2003) notes that CFP may have had positive impact on community
infrastructure, development activities, income generating opportunities and social capital, but
due to restrictions on use of common property possibly generate destitution to the poorer
households. Similarly, Adhikari (2004) even found that the proportion of benefits of rich is three
times to poor.
This paper thus contributes to filling important gaps in the discussion on the impact of CFP in
Nepal, by both considering the individual incentives for both participation and free-riding, and
by comparing the forest income implications of the decision. The paper is organized as follows:
A brief background to the programme is given in section 2, followed by an outline of the
theoretical framework along with the estimation model in section 3. Section 4 presents the
overview of data and introduction to study area. The results and discussion of key findings in
relation to the two questions asked are given in section 5, before we conclude in the final section.
2 The Community Forestry Programme in Nepal The forest history of Nepal fits well into the larger international picture, where deforestation and
forest degradation has been an alarming issue for several decades. The deforestation rate
increased rapidly soon after the forests were nationalized in 1957. With the realization of the
government’s inability to manage forest under its control, the devolution of forest management
started in 1978 with the transfer of use rights and management responsibilities from centralized
government to Community Forest User Groups (CFUGs). This concept was incorporated in
Nepal’s First National Forestry Plan (1976), and its related legislation of 1977. This legislation,
the rules and the regulations framed under it and ensuing government and donor programmes
have made the development of community forestry possible in Nepal. The Tenth Five-year Plan
(2002-2007) mentioned that 'the user-group approach' is particularly useful in mainstreaming
poor and deprived communities in forestry sector activities (NPC 2003).

Draft: Comments are welcome
4
Under the CFP, the CFUGs are responsible for managing the forest patches transferred to them.
Before the forest is transferred, the CFUGs with the close consultation and supervision of Forest
Officers make the operational plan, which details all the necessary rules and regulations for
resource conservation and benefits sharing. The member households are generally barred from
using forest products commercially. However, the CFUGs can sell the forest products to
individuals or groups or anyone for the benefit of the community. Through this sale, membership
fees, donor assistance and other income sources many CFUGs are financially very strong. For
this reason, in some cases, the positions in the executive committee of CFUGs are more
attractive than being the elected leader of the Village Development Committees (VDC). CFUGs
can launch a number of community development projects such as building schools, distributing
piped drinking water, running health posts and constructing village roads. However, these
extended benefits are enjoyed by both the members and non-members, as the exclusion of non-
members is costly and probably would also violate local norms of equal access to such services.
The rural households get forest products such as fuelwood from different sources: community
forest, state forest, or private forest/own woodlots. Not all forests are declared community
forests, thus households can go to the forests that have less restrictions (state or private forest).
Participating in CFP is therefore a real option for most households when alternatives are
available.
Members are allowed to collect forest products from CF for their home consumption. But this is
limited to a fixed quota, which varies from one group to another depending on the resource
abundance. Typically the newer CFUGs open forests for collection less frequently than the older
ones. Although each member household is entitled with the fixed quota, CFUGs have provision
to provide extra amount of forest products to households affected by natural and other calamities.
Moreover, households having broad social, ritual or similar functions also get extra quota.
Since the start-up in the mid-hills of Nepal, the programme has expanded to all over the country.
As of May 2004, 1.06 million hectare of forestland, mainly in the mid-hills had been handed
over to 13,125 CFUGs with 1.5 million households (35% of total population of the country)

Draft: Comments are welcome
5
involved (CFD, 2003)2. The government of Nepal is planning to hand over most of the potential
community forests to local communities by 2010.
3 Theoretical Framework and Estimation
3.1 A conceptual framework
The individual expected costs and benefits are the starting point for analyzing the decision about
participating in the community forest management. As Ostrom (1999) points out, this approach
starts with “the basic costs benefit calculations of a set of users utilizing a resource. Each user
has to compare the expected net benefits of harvesting from a resource continuing to use the old
rules to the benefits he or she expects to achieve with a new sets of rules.” As also noted by
Ostrom, it is important to find out how the user attributes affect the individual cost benefit
analysis. The decision to participation is also affected by the users’ perception towards the
resource and the status of their resource base.
At the broader level, the decision is influenced by both internal attributes of community forestry
such as community size (Varughese and Ostrom 2001), socioeconomic heterogeneity (Baland
and Platteau 1996), institutional setting, and property rights structure (Baland and Platteau 1999;
Ostrom 1999) and external influences such as national forestry policy (Ostrom 1999). Because
the practice varies across systems and time and the complexity and dynamics involved none of
the previous studies prescribes the single set of factors for the successful management of
community forestry (Agrawal and Gibson 1999; Baland and Platteau 1999; Ostrom 1999; Buchy
and Hoverman 2000; Agrawal 2001; Varughese and Ostrom 2001). It largely depends on the
type of community and socio economic situation in the area. Yet some attempts have been made
to identify common success factors (Agrawal 2001; Pagdee, Kim et al. 2006).
As a synthesis of the above literature, general agricultural household models (e.g., Sadoulet and
de Janvry, 1995), as well as our knowledge of the study area, we specify four different types of
costs and benefits involved in the households’ decision, and then hypothesize how the magnitude
2 Record of Community Forestry Division, Department of Forest, HMG/N, Kathmandu, Nepal

Draft: Comments are welcome
6
of these will be determined by various household, spatial and community level variables.
Particular attention is paid to how poverty affects the decision.
The primary benefit of participation is the presumed better access to the community forest. The
importance of these benefits should be higher for poor households with few alternative income
opportunities. Note that the better access is not necessarily guaranteed. Consider the non-
hypothetical situation with no or only weak sanctions against free riders, thus free riding is
common. The enforcement of the rules with respect to members’ use is, however, more effective.
In this situation being a member can actually limit the access: members have to obey to the rules,
while non-members do not.
A second benefit is the “social and political gains” from participation, in the form of social
prestige and networks, but also gaining political power from participation (cf. section 2). The
latter is probably more important for better-off income groups. Thus, a pattern of high
participation among generally better-off and politically influential groups, who do not need the
forest benefits per se, would indicate that this motivation is important.
The growing concern over environmental degradation, particularly among young households, is
another motivating factor for participating in CFP. Therefore, relatively young households, who
may not need forest products for their livelihood, often participate in order to contribute in
resource conservation.
The costs of participation are in terms of time spent in CFUG activities and cash contributions
(membership fee). Generally, we hypothesize that poor households have lower opportunity costs
of labor but value cash more, making the net effect ambiguous. These costs and benefits are
illustrated in figure 3.1.
At the next level, these costs and benefits are determined by a set of poverty variables, (other)
household characteristics, and spatial and community level variables. Poverty variables are
household income and assets/wealth, thus allowing for both welfare (income) and asset based
definitions of poverty (e.g., Vosti and Reardon, 1997). Household characteristics include age and

Draft: Comments are welcome
7
education of household head, sex of household head, and household size. Spatial and community
level include area of CF, participation rates, and distance to forest. The full list of variables at
this level is included in Table 3.1.
Figure 3.1: A conceptual framework for participation decisions and impact on forest income.
One problem is that one cannot observe all the costs and benefits associated with the
participation. Hence the variables entering the empirical models are those referred to in Table
3.1. However, the framework sketched enables a more consistent and theory based interpretation
of our findings. In the table we have made some hypotheses of how the various variables impact
the participation decision. One hypothesis we will test is that there is a U-shaped relationship for
participation, and poverty (both income and asset): the poorest participate because they need
access and have few alternatives, while the richest participate because of the social and political
benefits. Then, for a middle group the participation rates are lower. However, an alternative
hypothesis is also conceivable: The poor cannot afford being member of CFUG, and in situations
with poor enforcement of rules they choose a strategy of free riding instead.
Participation decision
Forest income
Access to CF
Social & political capital
Resource conservation
Poverty variables
Household characteristics
Spatial & community variables
Cost of participation

Draft: Comments are welcome
8
The second research question is how participation (and free riding) affects forest income. The
causal linkages are depicted in Figure 3.1. While CF participation has a direct impact on forest
income, it is also necessary to control for the impact of the three sets of variables at the bottom of
the figure. Their hypothesized impact is also given in Table 3.1. In the empirical analysis, we
distinguish forest income in absolute and relative terms, i.e. as share of total income. We
hypothesize that the share of forest income declines as the total income goes up, i.e. lower forest
dependency among the richer households.
3.2 Estimation
The empirical analysis of section 5 consists of simple descriptive methods (cross-tabulations,
scatter plots, and correlation matrices) and regression (Probit) analysis of the participation
decision, while the forest income analysis uses OLS regression with predicted participation to
control for the endogeneity of the participation decision.
From our conceptual framework, the decision to participate in the CFP depends on the costs and
benefits of joining the programme. Since there are no entry restrictions, participation decision is
an individual choice, and can be modeled as a function of the set of variables described
previously.
The two commonly used models for such discrete choice decisions are the Logit and Probit
models. There is no clear cut demarcation on whether to use Logit or Probit, the main difference
lies in the underlying assumptions: Where logistic regression is based on the assumption that the
categorical dependent reflects an underlying qualitative variable and uses the binomial
distribution, Probit regression assumes the categorical dependent reflects an underlying
quantitative variable and it uses the cumulative normal distribution. In most applications,
however, these models are quite similar, but with one difference seen on the logistic distribution
curve (Logit) being slightly flatter than the standard normal curve (Probit) (Gujarati 2003).
One strength of Probit model is that it analyses rational choice behavior as suggested by
McFadden (1981). Further, participation decision being a latent variable in which utility is

Draft: Comments are welcome
9
different for participants and non participants, the binary outcome is a result of individual choice.
Since Probit model is motivated by such latent variable (Cameron and Trivedi 2005) we use a
Probit model to find the factors responsible for participation decisions.
i i i i i iP Y Z Sα β η θ ε= + + + + (1)
Where, Pi is the participation in CFP which takes the value ‘1’ if the household participates and
‘0’ if does not; Yi is the vector of poverty variables; Zi is the vector of household characteristics,
Si is the vector of spatial and community variables including market for forest products; i denotes
households; iα , β , η and θ are unknown parameters and εi is the stochastic error term, whose
distribution is assumed as 2(0, )i Nε σ∼ . The associated log likelihood function is
1 0
log ( , , ) log log 1i i
i i i i i i
P P
Y Z S Y Z SL β η θ β η θβ η θσ σ= =
+ + + + = Φ + −Φ
∑ ∑ (2)
Where, Φ (.) is the cumulative function of the standard normal distribution. By normality
assumption, we optimize this log likelihood function directly by iteration algorithm of a general
non-linear optimization program (Greene 2000) to estimate parameters of the model.
We used a similar approach to analyze the free-riding decision:
i i i i i iR Y Z Sτ ν= + ℘+ + + (3)
Where, Ri is the free riding such that Ri = 1, if the household is free rider and 0 if not. The right
hand side variables have the same meaning as in equation (1); , ,i andτ℘ are the unknown
parameters and iν is error term. The similar log likelihood function holds for the equation (3)
also. The participation and free riding variables are mutually exclusive, as the same household
cannot be participant or free rider at the same time, but they are influenced by the same
variables. Therefore, we use the same set of variables to estimate the fitted value of these two.
For the second research question in the impact of participation and free riding on forest income,
we followed the steps of Two-Stage Least Squares suggested in Wooldridge (2002) and
discussed in Cameron and Trivedi (2005). For the two endogenous variables – participation in

Draft: Comments are welcome
10
CFP and free riding in CFP, we used the fitted participation, iP from equation (1) and fitted free
riding, ˆiR from equation (3) as the first stage. Then in second stage, we run regression of forest
income on iP and ˆiR and other poverty, household and spatial and community variables
(equation 4).
ˆ ˆi i i i i i i iF W Z S P Rξ γ ψ δ ς ϑ υ= + + + + + + (4)
Where, Fi is the income from forest; Wi is the vector of wealth variables; Zi is the vector of
household characteristics and Si is the vector of spatial and community level variables; iP and ˆiR
are the predicted participation and free riding estimated from equation (1) and (3) respectively;
, , , ,i andξ γ ψ δ ς ϑ are unknown parameters and iυ is error term. To avoid the inconsistency of
instruments ( iP and ˆiR ), the same Wi, Zi and Si used in equation (4) are used to estimate the
instruments (Wooldridge 2002) but income variables used in the first stage regression are
skipped.
In our analysis, equation (4) represents two different regression equations – one for absolute
forest income and another for relative forest income. We define absolute forest income as the
total forest product collected valued at market prices without deducting the costs associated with
it and relative forest income is defined as the share of absolute forest income in total household
income.
3.3 Description of variables
The variables are categorized into three broad categories: poverty-related variables, (other)
household characteristics, and spatial and community level variables. The definition of the
variables and their expected signs in the two regressions are given in the following table. The
signs of the variables in first stage Probit regression of free riding is hence discussed in chapter 5
and not presented here.

Draft: Comments are welcome
11
Table 3.1: Variables used in Probit and regression models and their expected signs Probit model of CF participation Regression of forest income Variables Indicators/Description Expected
sign Reasons Expected
sign Reasons
Dependent and predicted variable cfmember forinc
Participation in community forestry programme Income from forest in 100,000 Rs.
Dependent variable
± Increased forest access Dependent variable
Poverty variables totinc totincsq wealth13 wealth2 wealth3
Total Income in 100,000 Rs. Square of total income Wealth category (poorest) Wealth category (middle) Wealth category (rich)
- + - -
Poor depend more on access Political motives to participate Default As for income As for income
+ - ? ?
Poor have fewer alternatives Dependency decreases for rich Demand of more inputs from forest, but also more alternatives
Household characteristics agehead agesq edumem sexhead migrated castel adultequi4 freerider
Age of the household head Square of age of the household head Share of educated members in the households Gender of the household head (1=male, 0=female) 1 = The HH in-migrated: 0 otherwise 1 = Lower caste: 0 otherwise Household size (adult equivalence) 1 = Household is free rider, 0 otherwise
+ - + - - + +
Resource management Opportunity declines Awareness of resource mgmt. Females resource friendly Exploit more They are relatively poor Demand of more forest product
- + - + + + + +
Alternative sources Fewer alternatives Awareness/more opportunities Physical strength Exploit more Poor have fewer alternatives More hands in forest use Get benefits w/o cost sharing
Spatial variables distance market vdc
Distance to the community forest (kms) 1 = Market for forest products in villages: 0 otherwise Village dummies
- -
Distance reduces incentives More other opportunities
- +
Distance reduces the benefits Opportunity to buy FPs
Community level variables cfarea memper othsource cfnumber
Area of CF per household in the village Participation rate 1 = Availability and use of other source for forest products Number of CFUGs in the village
+ + -
FPs more available Group pressure Alternatives reduce prob.
+ ? + +
Increased availability Lower share available/ more effective mgmt. Alternatives increase income Well managed and more access
3 Wealth categories are made up of landholdings, household assets and total livestock unit. These three variables are classified into three groups each. The categories are as follows: (1) land less than .50 ha, between .50 and 1 ha, and more than 1 ha, (2) assets less than 100000, between 100000 and 500000, and more than 500000 and (3) livestock unit less than 1, between 1 and 2, and more than 2. The scores are given in ascending order for each category in each groups, smallest landholders get score 1, for example. The scores are summed up in order to construct the wealth category such that wealth category 1 consists sum 3 and 4; wealth category 2 consists sum 5 and 6; and wealth category 3 consists sum 7, 8 and 9. 4 On the basis of weights estimated by Deaton (1982) (presented in Cavendish 2002).

Draft: Comments are welcome
12
4 Study area and data The study site lies in the Central Development Region of Nepal. The region is more developed
compared to the other four development regions in the country, having the capital city in the
region being one of the main reasons. The region extends from the Northern border of the
country to the Southern border and has large geographical diversities from high mountain to the
plain land extending from 270 21’ to 280 13’ north latitude, and from the altitude of 141 m to
7134 m asl. The study area covers the altitude from 141 m to nearly 4000 m. It has a great
variation in geographic, level of development, access to benefits and availability and use of
resources.
Household data collected during fieldwork between January and May 2004 together with data
from secondary sources will be the basis for this analysis. The household survey covered 452
households selected on a random basis from 16 villages in five districts in central Nepal. The
criteria of selecting the villages were distance to market and forests, existence of community
forestry, distance to the main road and location (plain land and mid hills). The secondary
information was collected through direct interviews, key informants interviews, various
publication from different agencies and focus group interviews. Leaders of community forestry
user groups (CFUG), chairmen of Village Development Committees, District Forest Officers and
personnel from donor assisted community forest projects were interviewed directly. Data
entering took place in the field in order to give room for consistency check, gap-filling and
follow-up interviews. The software DAD and Stata were used for the poverty and econometric
analysis.
CFM is being practiced in all five districts and in all 16 villages. The number of CFM is
relatively larger in the mid hills than in the plain land and the capital district of the country. The
following table shows the status of CFUG in the five districts.

Draft: Comments are welcome
13
Table 4.1 Status of CFUG in the study area5. District No. of
CFUG CF Area
(ha) Area per
CFUG (ha) No. of hhs involved
Average size (hhs)
Average income
Average expenditure
Chitawan6 Dolakha7 Kathmandu8 Kavrepalanchowk9 Sindhupalchowk10
14 257 139 390 409
7,453 28,259 4,421 18,178 22,311
532.35 109.96 31.81 46.61 54.55
8,972 38,898 16,022 33,861 45,539
641 151 115 87 111
2,923,403 29,754 12,509 38,005
NA
2,283,634 14,566 9,908 23,539
NA
Chitawan district has by far the highest income levels for the CFUGs, which is only partly
explained by the larger average size of the groups (and the higher forest area per groups). The
district is in more fertile Terai region with good availability of high value forest products.
Furthermore, donors’ support to some CFUGs and a small number of CFUGs may have also
contributed to the high income. Kathmandu has the lowest average income due to small amount
of forest handed over. Three other districts from mid hills have about the same level of income
and they have more CFUGs than other two districts.
5 Results and Discussion This section first presents some basic figures on forest use and participation. The next three sub-
sections analyses participation from three complementary perspectives: household responses to
the question of why they are members, a village level analysis of participation rates, and then a
household level regression (Probit) analysis of participation. The last section uses the result of
the latter to estimate the impact of participation on forest income. 5 Source: Community Forestry Division, Department of Forest, Kathmandu, Nepal (May 2004). 6 This district is in the Terai region of Nepal. This is a plain area and has more fertile land growing varieties of crops. Being the main transit point to western and eastern part of the country, this has a good market access and trade relation to India. This district has a large amount of forests (including shrubs and grassland, forest is nearly 69% of total area). 7 This is one of the undeveloped districts of the country. Bordering with China in the north, it does not have much arable land. 47% of total land area of this district is covered by forest. Lack of arable land, low economic activities and few alternatives to livelihood characterize this district. 8 This is the capital of Nepal. Though most developed district of the country, it still has backward rural areas where the forest is still main sources of fuel. Forest cover is 34% of total land area. All types of economic activities are found in this district. 9 Community forestry program was first launched in this district in late 1970s. Most forest area is under community forestry that accounts 28% of total land area of the districts. Agriculture is the dominant economic activity in this district. 10 This district is adjacent to Kavrepalanchowk and has large forest area under community management. Total forests account for 30%. Agriculture is the basic economic activity in this district. Being one of the transits to China, business of Chinese goods can be found en route to Kathmandu.

Draft: Comments are welcome
14
5.1 Membership and forest use
Nearly half (48.9%) of the 452 sample households participate in community forestry programme
(CFP), with rates of participation being much higher in the mid hills than in the Terai (plain
land). It is found that 85 households (19%) collect at least one forest product from community
forestry without being member, i.e. are free riders. With the weak enforcement of operational
plans, some CFUGs have not taken any initiatives to make them the members. It is also notable
that 33 member households (14.9%) do not collect anything from community forestry. Adding
the non-member users and deducting non-use members, a total of 273 (67.7%) households use
community forestry for the forest products.
In addition to the community level benefits discussed in section 2, the primary benefit is the
basic forest products for household use. The table 5.1 shows the types of forest product the
households get from different sources, and how these differ between members and non-members.
Fuelwood is the main forest product that the households, whether they are participating in CFP
or not, need and collect from forests followed by fodder, building materials (mainly poles) and
tree leaves. Tree leaves are mainly collected for making leaf plates that are used during the
parties and rituals.
Table 5.1: Percentage of households getting forest products by sources* Source
Types Own farm/
Private forest State forest Community
forest Buying from
Market
Members 70.6 4.1 63.3 6.8 Fuelwood
Non members 61.9 12.1 29.0 16.5
Members 16.7 1.4 36.7 0.5 Building
materials Non members 9.1 5.2 6.1 3.0
Members 0.9 18.6 10.4 0.0 Timber
Non members 0.4 10.0 2.6 0.0
Members 31.2 3.6 14.9 0.9 Tree leaves
Non members 11.3 4.3 6.5 4.8
Members 42.1 4.5 70.1 0.5 Fodder
Non members 27.7 10.8 28.6 0.4
* Most households get forest products from more than one source. So the share does not add to 100.

Draft: Comments are welcome
15
The table identifies private forest/own woodlots and community forest as the most important
sources of forest products except timber. All other forest products than timber are collected from
these sources and only a small amounts are collected from state forests. Restriction to timber
collection from community forests could be the reason for this. It is interesting to note that the
members use more forest resources of any kind of forest resources and there is only a weak
indication that non-members use more state forest than the members.
The table points to the problem of free riding in community forestry: up to 30% non members
use community forests for fuelwood and fodder. This might be explained by weak enforcement
of operational plan (e.g. lack of patrolling) and therefore inability to take action against the free
riders. Some poor may be too poor to become member (fees and labor inputs), but require forest
products for fulfilling basic needs. There is a clear negative correlation (-0.19) between total
income and free riding.
Comparing benefits for the users and non-users (members and non-members in this case) is a
possible indicator of success of any programme. The main problem is, however, selection bias
and we will address that issue below. But a simple comparison can be an illustrative first step,
and table 5.2 presents the absolute and relative forest income for different household groups.
The overall picture of table 5.2 is that the share of forest income is higher for the non-members
than the members of community forestry. This can be given at least two interpretations. It can
question the success of community forestry in economic aspects and the role of CFP in poverty
reduction. One possible explanation for this is that the access is limited to domestic use of forest
products and any kind of commercialization of forest products is prohibited. This indicates the
CFP is still more conservation oriented than economic benefit oriented. People from community
forestry user groups and the organizations supporting them also admitted that the programme
was too much focused on the conservation side and had given minimum attention to utilize the
resource as economic goods11.
11 Personal discussion with leaders of CFUGs and donor organisations.

Draft: Comments are welcome
16
But, it may equally be used as an argument for the CFP being vital for those with few alternative
forest income sources. In most cases alternative sources are available, but they are not distributed
equally across villages and households. And further caveat is that CFP may contribute to the long
term sustainability of forest use, and our study does not inform us about these aspects. But CFP
has been operating for some years and the medium term benefits should be visible by now. On
the conservation side, more than one-third households (34.7%) think that the forest cover has
increased due to community forestry. But on the economic side, even the average income from
forest is NRs. 9,613 and NRs. 14,245 for members and non-members respectively. This means
the members are poorer and it may support the distributional issue of the resources.
Table 5.2: Forest income12 in total household income for members and non members of CFP Absolute forest income Relative forest incomeHousehold group Total
hhs Members
of CF % of total hhs
Member Non-member Member Non-member
Female 35 15 42.9 19,440 16,406** 14.7 13.5** Sex of the household head Male 417 206 49.4 8,897 14,040** 12.1 13.1**
21-30 38 24 63.2 6,201 2,445 16.0 4.7 31-40 94 54 57.4 7,639 12,950** 13.0 15.0** 41-50 120 49 40.8 12,106 11,177** 12.8 12.3** 51-60 104 54 51.9 7,140 14,754** 8.7 11.5**
Age of the household head
61+ 96 40 41.7 14,609 21,556** 13.2 16.5** Bottom 20% 91 52 57.1 4,488 4,732** 21.7 22.4** 20-40% 90 42 46.7 7,243 4,558** 16.0 9.8* 40-60% 91 38 41.8 7,358 8,266** 9.2 10.7** 60-80% 90 42 46.7 9,016 11,543** 6.9 9.1**
Income Quintiles
Top 20% 90 47 52.2 19,757 44,074** 5.8 16.0** Wealth 1 156 88 56.4 7,579 16,366** 19.2 17.1** Wealth 2 189 90 47.6 8,627 17,839** 8.0 14.4**
Wealth category
Wealth 3 107 43 40.2 15,839 6,434 6.9 7.0** None 139 66 47.5 11,547 21,154** 15.5 17.9** Primary 167 84 50.3 10,034 6,399** 11.3 12.4** High School 78 37 47.4 7,625 26,784** 14.7 13.5** SLC 39 23 59.0 7,608 4,448* 6.8 7.4**
Education level of the household head
Higher 29 11 37.9 5,674 2,560 3.5 1.4 <100 31 14 45.2 3,573 18,604** 7.6 19.0** 100-500 97 62 63.9 12,794 12,942** 12.5 14.7** 500-1000 77 35 45.5 7,484 24,637** 9.4 17.4** 1000-5000 166 95 57.2 9,984 18,228** 14.8 15.8**
Distance to the forest (m)
>5000 81 15 18.5 4,714 2,916** 6.5 5.2** Total 452 221 48.9 9,613 14,245** 12.3 13.1**
Note: Difference between members and non members is ** significant at 1% and * significant at 5% level.
12 Total forest income from all sources.

Draft: Comments are welcome
17
As can be seen from the table 5.2, female-headed households have a larger share of forest
income compared with male-headed households, though the number of female-headed
households is small. An increasing trend of females becoming members of CFUG and resource
awareness was observed during the field visit also.
Forest income share for different age groups has a U shaped form: decreasing at first and
increasing after attaining middle age. This could reflect the alternative income opportunities for
different age groups, with the middle age group having the best opportunities. The share of forest
income decreases with the size of landholdings. This share takes the same pattern for both
members and non-members. As landholding is a wealth indicator, this shows that forest
dependency is higher for the poor households.
When grouping the households in income quintiles, the share of forest income decreases as the
income level increases for the member households, whereas the trend is not clear for the non-
members, especially the highest income group from non-members have larger share of forest in
their total income. As it was found in another analysis (Aryal and Angelesen, 2006 manuscript),
the rich households collect high value forest products, which makes the forest income share
larger for them. Comparing members and non-members in different income quintiles, the pattern
is mixed. But, there is some evidence that the poorest households can benefited from being
members, while among the richest households the forest benefits are higher for non-members.
The same is true when the households are categorized in terms of wealth. In terms of
participation, the pattern is U shaped - poor and rich are participating more than the middle
income group, but wealth categories indicate the poor participate more than the rich.
It is surprising to see that the membership appears to be more beneficial to the households far
from the forest, while the dependency is much higher for non-members living close to the forest.
This indicates that there are restrictions imposed by CFP and that non-members living close to
the forest can enjoy better forest access and relatively more forest income.
The overall picture of this table is that income poor and small landholders benefit more from
being members of CFP. However, the total share is higher for non-members given the

Draft: Comments are welcome
18
restrictions to commercial use of forest products from CFP, free riding problem, and richer
households collecting high value forest products.
5.2 Why people join CFP?
During the survey, households were asked to rank the three main reasons for joining the CFM.
Table 5.3 presents their responses.
Table 5.3: Households’ preferences for joining the CFP Rank 1 Rank 2 Rank 3 Reasons
No. of hhs % No. of hhs % No. of hhs %
Score
Economic
Easy access
Benefit sharing
Avoid exclusion from extracting
forest products
166
141
25
0
75.1
63.8
11.3
0
146
21
106
19
66.1
9.5
48.0
8.6
49
13
6
30
22.2
5.9
2.7
13.6
63.2
36.0
22.1
5.1
Environmental (Conserving forests) 42 19.0 19 8.7 63 29.4 17.1
Social and Institutional
Rights over forest products
Others in the society are members
Rights of decision making
Social prestige
Information sharing
Network building
12
8
4
0
0
0
0
5.4
3.6
1.8
0
0
0
0
42
14
9
12
5
1
1
19.1
6.3
4.1
5.4
2.3
0.5
0.5
98
26
27
22
6
16
1
44.4
11.8
12.2
10.0
2.7
7.2
0.5
16.5
5.9
4.3
3.5
1.2
1.4
0.2
Force
Fear of what others say
Because the forest officer asked
1
0
1
0.5
0
0.5
1
0
1
0.5
0
0.5
4
1
3
1.9
0.5
1.4
0.7
0.1
0.6
Note: The score is calculated on the basis of weights given for each ranks (3 for rank 1, 2 for rank 2 and 1 for rank 3).
Percentages are calculated on the basis of total response for each rank.
The table indicates that the economic benefits from community forestry are the predominant
reasons to join CFP. Participation is perceived to provide access to forest resources, and this is
the single most important reasons to join. The environmental and conservation issue is the
second most important reason. This response is mainly given by younger households, which

Draft: Comments are welcome
19
indicates an increasing awareness towards the environmental impact of degrading forest
resources and the need to preserve it for future uses.
A significant number of households also mentioned social and institutional reasons for joining
CFP, although few state this as their primary reason for being member. One notes that what is
often perceived as an important benefit of CFP – rights of decision-making – gets relatively low
scores. This indicates that for the majority of participants, the decision-making process does not
matter a lot, but rather the more tangible benefits they can get. It may also reflect that most
people have limited say in the decision making process, mostly because of social, cultural and
economic domination of some elite members (see also Agrawal and Gupta 2005; Adhikari et al.
2004; Maskey et al. 2006)
One also notes that 33 member households (14.9%) do not collect anything from community
forestry. This clearly shows that membership of CFP is not only a function of economic benefits
but has social and environmental values too. Almost one third of the members told that
participation increased their social status. Very few households join CFP due to force, indicating
that the decision is self-motivated.
5.3 Village/Community level effect in participation
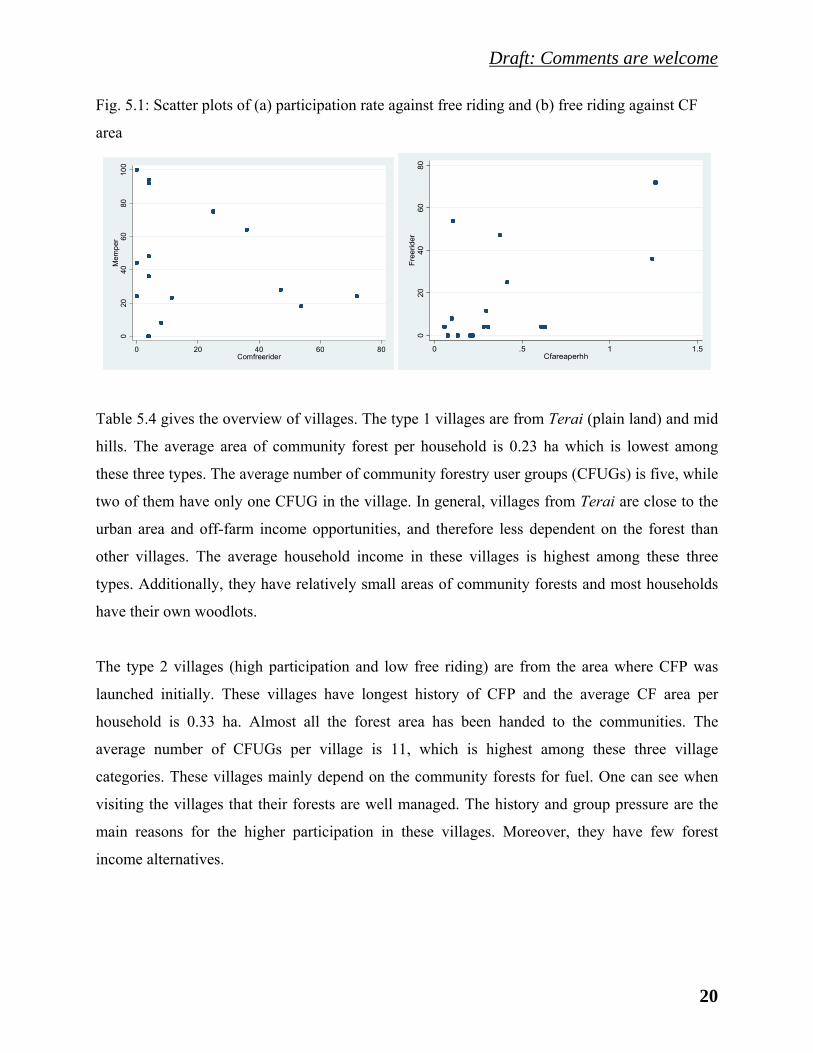
Village or community also has an effect on participation in CFP. Figure A1 shows that the
membership to CFP varies dramatically among the villages from very low to 100% participation
rates. The scatter plot of participation rate against the free riding (left panel of fig 5.1) indicates
that there are three types of villages: (1) low participation - low free riding, (2) high participation
- low free riding and (3) low participation - high free riding. The cut-off lines are 70% for
participation and 20% for free riding.
Draft: Comments are welcome
20
Fig. 5.1: Scatter plots of (a) participation rate against free riding and (b) free riding against CF
area 0
2040
6080
100
Memper
0 20 40 60 80Comfreerider
020
4060
80Freerider
0 .5 1 1.5Cfareaperhh
Table 5.4 gives the overview of villages. The type 1 villages are from Terai (plain land) and mid
hills. The average area of community forest per household is 0.23 ha which is lowest among
these three types. The average number of community forestry user groups (CFUGs) is five, while
two of them have only one CFUG in the village. In general, villages from Terai are close to the
urban area and off-farm income opportunities, and therefore less dependent on the forest than
other villages. The average household income in these villages is highest among these three
types. Additionally, they have relatively small areas of community forests and most households
have their own woodlots.
The type 2 villages (high participation and low free riding) are from the area where CFP was
launched initially. These villages have longest history of CFP and the average CF area per
household is 0.33 ha. Almost all the forest area has been handed to the communities. The
average number of CFUGs per village is 11, which is highest among these three village
categories. These villages mainly depend on the community forests for fuel. One can see when
visiting the villages that their forests are well managed. The history and group pressure are the
main reasons for the higher participation in these villages. Moreover, they have few forest
income alternatives.

Draft: Comments are welcome
21
Table 5.4: Villages by CF area, participants and free riders
Type Villages No. of CFUGs
CF area/hhs
Membership (%)
Free riding (%)
Average income (Rs.)
Forest income
share (%) Fulbari 1 0.63 0.0 3.9 168,400 0.6 Chalal 4 0.10 8.0 8.0 122,662 16.1 Shivanagar 4 0.30 23.1 11.5 152,927 3.4 Kushadevi 12 0.08 24.0 0.0 118,503 27.3 Patihani 2 0.28 36.0 4.0 165,685 1.5 Balthali 11 0.13 44.0 0.0 137,495 24.2 Barhabise 7 0.06 48.0 4.0 91,043 7.6
1
Average 5 0.23 26.2 4.5 136,674 11.5 Tukucha 15 0.61 92.0 4.0 130,812 2.9 Paanchkhaal 10 0.31 94.0 4.0 182,366 3.9 Mahadevsthan 13 0.20 100.0 0.0 55,313 47.1 Kuvinde 6 0.22 100.0 0.0 43,302 9.7
2
Average 11 0.33 96.5 2.0 102,948 15.9 Dakshinkali 2 0.11 17.9 53.9 95,743 16.7 Boch 6 1.26 24.0 72.0 54,993 13.2 Chhaimale 13 0.37 27.8 47.2 86,070 12.2 Lakuridanda 7 1.24 64.0 36.0 57,291 12.1 Bansbari 13 0.42 75.0 25.0 51,277 11.5
3
Average 8 0.68 41.7 46.8 69,075 13.2 Total 8 0.39 18.8 48.9 114,727 12.7
Type 3 villages (low participation and high free riding) are from upper hills and Kathmandu, the
capital district. The average CF area per household in this type is 0.68 ha whereas the average
number of CFUG per village is eight. Villages from Kathmandu are less dependent on forest for
fuel, but depend more on tree leaves and fodder. Because of being close to the capital city, the
members may have less interest in patrolling and catching free riders than finding a more
lucrative off-farm work in the capital. The village with highest rate of free riding is far from the
capital, and has the largest area of community forestry (1.26 hectare per household). One
possible explanation is that forest abundance reduces the incentives for good management. These
villages have lowest average household income among three types of villages.
Table 5.4 and the correlation matrix (table 5.5) suggest that free riding is less of a problem when
the number of CFUGs is high and CF area is small. This pattern is further illustrated in the
scatter plot of free riding against the area (right panel of fig. 5.1).

Draft: Comments are welcome
22
This result is consistent with the hypothesis of institutional economics that the incentives for
enforcement of property rights is strongly correlated with the scarcity (and value) of the
resources (e.g. North (1987). Moreover, it may be difficult for the CFUGs to control the larger
area from encroachment and unauthorized use as well as difficult to carry out appropriate
conservation measures.
Table 5.5: Correlation matrix of community level variables and income
CF area No. of CFUG Free riding Participation
rate Forest income
Total income
No. of CFUG -0.01
Free riding 0.48*** -0.14***
Participation rate 0.03 0.61*** -0.35***
Forest income -0.43*** 0.27*** -0.16*** -0.09*
Total income -0.28*** -0.27*** -0.51*** -0.12** 0.00
Market Access -0.24*** 0.09* -0.18** 0.09* 0.17** -0.26***
* Significant at 10%, ** significant at 5% and *** significant at 1% level of significance
Negative and significant correlation between area and forest income also suggest that when the
resource is abundant, benefits may be below optimum as the resources are under utilized.
Positive correlation between forest income and number of CFUGs also support the above
arguments. One interesting finding is that average household income has a strong negative
correlation with free riding indicating poor being free riders.
The correlation matrix illustrates some causal links between community level variables - higher
number of CFUGs implies low free riding and high participation. This may suggest the
fragmentation of resources reduces free riding, as the enforcement is easier and less costly.
Moreover, negative correlation suggests low free riding in the presence of market possibly
because buying from market is easier, less time consuming and has lower opportunity cost.
The above discussion hence suggests high participation and low free riding when the number of
CFUGs is higher. Free riding is higher when the resource is abundance (larger area of CF) as
discussed above. It is rather surprising that free riding is negatively correlated with market
access, when market creates higher incentives to free riders. But this may indicate that free riders

Draft: Comments are welcome
23
are poor and the CF use is mainly the subsistence one. and there is indication that free riders are
from the villages with low household income. Forest income is negatively correlated with
membership; weakly suggesting members not benefiting in terms of income from forests
possibly because the non participants negatively affecting the benefits of participants. The
possible explanations are – (1) less forest products available for participants and (2) participants
incur costs in terms of fee, time and other liabilities, which the non participants do not need and
with free riding there are fewer members to share the costs.
5.4 Factors determining the participation in CFP
This section moves to the household level and investigates determinants of participation in CFP
by regression analysis. Table 5.6 presents five Probit models with different sets of explanatory
variables. The first model has only income variables. Wealth categories are added in the second
model, and the third model is further extended by adding household characteristics. The fourth
model is the full model with income, household and spatial variables. The fourth model also
includes the community level variables: area of community forestry per household, participation
rate in the village and availability of other sources of forest products. We follow these four
models simultaneously in our discussion. Since we are answering the second research question
‘impact of participation in forest income’, income variables are removed from fifth model, which
will be discussed in section 5.6.
The validity of all models but model 1 is confirmed by the statistically significant Wald Chi-
square statistics, indicating that the control variables in each model are jointly significant. In
addition to these variables, we used village dummies in the model. But since we are not doing
comparative analysis of the villages, their parameters are not presented here.

Draft: Comments are welcome
24
Table 5.6: Determinants of participation in CFP
Dependent variable = Participation in CFP
Model (1) (2) (3) (4) (5)
Total income -0.099 (0.116) 0.025 (0.113) -0.382 (0.195)** -0.133 (0.219)
Total income squared 0.025 (0.020) 0.012 (0.016) 0.081 (0.038)** 0.055 (0.039)
Wealth cat (middle) -0.262 (0.141)* 0.162 (0.188) 0.147 (0.223) 0.163 (0.217)
Wealth cat (rich) -0.492 (0.174)*** 0.251 (0.222) 0.400 (0.267) 0.485 (0.278)*
Age of hh head -0.062 (0.038) -0.049 (0.045) -0.060 (0.045)
Age squared 0.000 (0.000) 0.000 (0.000) 0.000 (0.000)
Gender of hh head (male) -0.150(0.288) -0.294 (0.302) -0.243 (0.293)
Adult equivalence 0.244 (0.054)*** 0.189 (0.063)*** 0.185 (0.065)***
Educated member in hh 0.045 (0.005)*** 0.039 (0.006)*** 0.038 (0.006)***
Caste of hh (lower caste) -0.259 (0.172) -0.466 (0.218)** -0.410 (0.225)*
In migrated hh -0.756 (0.176)*** -0.239 (0.346) -0.341 (0.345)
Distance to CF -0.044 (0.070) -0.053(0.069)
Market for forest products 0.111 (0.233) 0.017(0.225)
CF area 2.521 (1.036)** 1.750(0.669)***
Participation rate 0.063 (0.013)*** 0.054(0.007)***
Other forest source -0.414 (0.285) -0.328 (0.277)
No. of observations 452 452 452 452 452
Pseudo R2 0.00 0.02 0.39 0.55 0.54
Wald χ2 1.99 10.75 101.81 156.56 368.13
Prob. > χ2 0.37 0.03 0.00 0.00 0.00
* Significant at 10%; ** significant at 5%; *** significant at 1%. Robust standard errors in parentheses
Poverty determinants
The probability of being member of CFP decreases as total household income increases.
Although this variable is significant only in third model, a negative sign in all but second model
indicates that poor are more likely to be the members of CFP. A positive sign of square of total
income indicates that the probability of being member increases after the households attains a
certain level of income (Rs. 121,000 in full model), which is more than the average household
income (Rs. 114,700). This makes a weak U shaped pattern, although statistically significant in
third model only, where the turning point (Rs. 236,000) is more than double the average
household income.
Draft: Comments are welcome
25
Wealth categories are statistically significant and have negative signs only in model two, while
adding other variables in model three and four both categories become insignificant and the signs
change to positive. Looking at model two alone, with income and wealth variables, wealth is
associated with decreasing probability of participation. But, wealth is positively correlated with
the new variables included in model 3: education (0.22), household size (0.36) and migration
(0.08), while it is negatively correlated with lower caste (-0.11). Thus, the wealth effect in this
model is captured through these variables.
The probability of the household being a member of CFP increases when the percentage of
educated members in the household increases. The coefficient shows that 1% increase in
educated members in the household increases probability of that household being CFP member
by 0.05. One could argue that the education reduces forest dependency and hence the incentives
for being member of CFP. But the positive sign indicates that other effects are dominating: first,
education can lead to increase awareness towards the resource conservation and therefore
increased participation. Second, educated households may have a better chance to exercise
political influence by joining the CFUG.
Caste system and classification under this system is often taken as the indicator of poverty in
Nepal. The lower the caste, the poorer the households are. A negative sign of the lower caste
variable indicates that the upper class households are more likely to be the member of CFP. This
reflects and confirms the prevalence of upper caste dominancy over lower caste in participating
in major activities all over the country. The data shows that only 38% households from this caste
participate in CFP compared to about 53% upper caste households joining CFP. For the lower
caste households, forest contributes 11.7% in their total income whereas for upper caste
households the contribution is 13%. Some researchers have argued that the elite dominate every
phases of CFUG’s development (e.g. Adhikari et al., 2004; Maskey et al., 2006).
In short, looking at the poverty determinants, we find a weak U shaped pattern between income
and participation decision, though motivation may be different – getting access to forest products
for poor and gaining social status and political influence for rich. It is seen that wealthier
households do not participate in CFP but the variables closely related to wealth such as education

Draft: Comments are welcome
26
and caste are important in participation decision, indicating educated and upper caste households
are more likely to join CFP. An interesting question arises whether relative poor, uneducated and
lower caste households are free riders. We answer to this question will in next section.
Household characteristics
Presence of more adult members in the household increases the probability of participation in
CFP. The variable is statistically significant at 1% level. Having more members in a household
increases the demand of forest products and this can be met through membership of CFP. Unit
increase in adult members in the household leads to 0.24 increase in the probability of that
household being CFP participant. The availability of surplus labor in the household is another
possible reason for this relationship. This result is consistent with the result found by Jumbe and
Angelsen (2006) in Malawi.
Migrants are less likely to join the CFP, as shown by the significant impact of this variable in
model 3 (although not significant in model 4). There are a couple of possible explanations of
this: the migrants may have less concern over the forest resources in their new place of residence
compared with the locals that have a stronger attachment to the forest; and immigrants are less
likely to participate in social life and village activities. Generally, migrants are thought to be
poor and depend more on natural resources, but our analysis shows that migrants are relatively
better off (average total income for migrants is more 15% more than non-migrants) and for this
reason they may be having alternative livelihood strategies.
Spatial and Community/village effects
The probability of a household to join CFP increases when the area of community forest is large.
The area may ensure the availability of forest products and hence attracts households to
participate in its management. From the coefficients of this variable, it is found that one hectare
increase in area of CF leads to 2.5 increase in probability of participation.
The higher participation rate in the village increases the probability of a household participating
in CFP. As discussed in section 5.3, the possible reasons for this are: (1) group pressure –
participation of majority households in the village compels other households to participate, and

Draft: Comments are welcome
27
(2) the participation rate is correlated with the history of CFP indicating the observed benefits
attract households to join the management.
Though statistically insignificant, there is a hint that the distance and availability of other sources
for forest products reduces the probability of participation in CFP.
Overall impression of this section is that the participation decision is motivated by two reasons –
access and socio political influence, former being for poor and latter being for rich. In terms of
wealth, the wealthier households do not participate, however their decision is influenced by other
household level variables associated with wealth indices. Resource abundance and group
pressure are other important factors in making participation decisions.
5.5 Free riders in CFP
The existence of free riders may affect the participation decisions and the benefits from
participation and from CF. In this section we analyze who are the free riders and in the following
section we try to find free riding effects in forest income.
We found that 85 households (31% of total users) use community forest without being member
in CFP. The table 5.7 presents the comparison of members, free riders and others. The table
shows that free riders have lowest income, smallest land size and highest forest dependency.
Some of the poor may be too poor to join the CFP, despite the need of forest products. It is
notable that out of 85 free riders, 74 are having total income less than average household income
(Rs. 114,700).
Compared to non free riding households, the free riding households have older heads. It is
interesting to note that among free riders, 35% households are from lower caste and only 10%
are migrants. Out of total migrants only 7.7% are free riders.

Draft: Comments are welcome
28
Table 5.7: Comparison of characteristics among members, free riders and others Members Free riders Others
Number of hhs 221 85 146
Total income (Rs.) 119,424 70,267 133,502
Forest income share 12.3 16.3 11.3
Land size (ha) 0.64 0.63 0.74
Age of hh head (years) 48.6 52 50.7
Educated members in the hh (%) 55 12.7 11.8
Lower caste hh 42 30 39
Migrated hh (%) 41.4 7.7 50.9
Distance to forest (km.) 2.3 3.1 4.1
To identify the factors responsible for a household to be the free riders we run 5 Probit models
(table 5.8) of free riders with the same variables that we used to find the factors of participation
in CFP. The significant Wald chi-square confirms the validity of all models suggesting the joint
effects of control variables are statistically significant.
The table 5.7 and Probit result (table 5.8) suggest that the uneducated and lower caste and non-
migrants households are more likely to be free riders. Moreover, probability of free riding
increases when there is no market for forest products and when the participation rate in the
village is low. This is consistent with the results found in Probit of participation in CFP.
The Probit results indicate that probability of a household being free rider significantly decreases
when the household gets richer. Income variables are statistically significant in models (1), (2)
and (3). When we added the spatial and community level variables in model (4), the income
became insignificant. This suggests that the free riding is concentrated in some villages and these
variables capture the income effect in this model.

Draft: Comments are welcome
29
Table 5.8: Factors determining free riding in CFP
Dependent variable = Free riding in CFP
Model (1) (2) (3) (4) (5)
Total income -0.524 (0.137)*** -0.575 (0.153)*** -0.505 (0.154)*** -0.208 (0.245)
Total income sq. 0.036 (0.013)*** 0.040 (0.014)*** 0.031 (0.015)** -0.008 (0.034)
Wealth cat (middle) 0.381 (0.167)** 0.192 (0.186) 0.232 (0.228) 0.147 (0.213)
Wealth cat (rich) 0.130 (0.214) -0.182 (0.242) 0.048 (0.299) -0.170 (0.287)
Age of hh head -0.028 (0.037) -0.027 (0.045) -0.015 (0.045)
Age squared 0.000 (0.000) 0.000 (0.000) 0.000 (0.000)
Gender of hh head (male) -0.199 (0.272) -0.381 (0.307) -0.418 (0.306)
Adult equivalence 0.031 (0.051) -0.049 (0.065) -0.058 (0.064)
Educated member in hh -0.018 (0.003)*** -0.028 (0.005)*** -0.027(0.004)***
Caste of hh (lower caste) 0.261 (0.167) 0.763 (0.215)*** 0.764 (0.211)***
In migrated hh -0.471 (0.207)** -0.256 (0.416) -0.186 (0.403)
Distance to CF 0.173 (0.072)** 0.180 (0.072)**
Market for forest products -0.606 (0.257)** -0.525 (0.245)**
CF area 3.387 (0.683)*** 3.494 (0.680)***
Participation rate 0.018 (0.009)** 0.018 (0.009)**
Other forest source -0.079 (0.337) -0.181 (0.329)
No. of observations 452 452 452 452 452
Pseudo R2 0.05 0.06 0.19 0.47 0.46
Wald χ2 15.25 17.04 65.80 170.29 174.88
Prob. > χ2 0.00 0.00 0.00 0.00 0.00
* Significant at 10%; ** significant at 5%; *** significant at 1%. Robust standard errors in parentheses
As it was found in section 5.4, the educated households are more likely to join the CFP. One
reason can be the concern towards resource conservation. Same argument may explain the
reasons for likelihood of uneducated households to be free riders. The residents of the area are
more likely to free ride than the migrants. The reason could be that the immigrants may have
alternative fuel sources and they may have alternative livelihood strategies. So they neither
participate in CFP nor free ride over the participants. In general, it is thought that migrants are
poor and depend more on forest, either being free riders or members, but our analysis shows that
they are relatively better off (cf. section 5.4) and depend less on the forest.
Free riding reduces if the market for forest products exists in the village. In the absence of
market, the households are compelled to depend on the forests to fulfill the demand of forest

Draft: Comments are welcome
30
products and free riding increases, if they are unable to participate for one and another reasons.
When market is available, they can buy the forest products from market which is easier, needs
less physical work, reduces the chances of being caught and is less time consuming. Free riding
is more likely when the participation rate is low in the village. The crowd behavior well suits
here such that if someone is not participating then why should I?
We found some intriguing results from section 5.4 and 5.5 – participation is high among poor
households and poor are the one who are more likely to be free riding. Comparisons of basic
characteristics of free riders and the participants (table 5.7), however suggest that free riders are
poorer than the participants (average income for free riders is 41% lower than that of
participants) and have higher share of forest income.
5.6 Community forestry and the poor
In this section we try to answer the second research question, i.e. what are the benefits in terms
of higher forest income from participation? For this purpose, we estimated the Probit of
community forestry participation on the basis of model 5 from table 5.6. Since we are looking at
the impact of participation in CFP on forest income – a component of total income, income
variables are removed from the model. The signs and significance levels are almost same for
other variables in fourth and fifth models. Predicted participation in CFP is thus estimated on the
basis of fifth model. As free riding is an important factor in benefiting by the forest use, we
estimated the predicted free riding from Probit of free riders. For the same reason as in Probit of
participation, income variables are removed from Probit of free riding when predicting. To
control for endogeneity of the participation and free riding, we used both predicted participation
and predicted free riding as regressors in the regression of forest income (table 5.9).

Draft: Comments are welcome
31
Table 5.9: Regression of forest income on different variables
Dependent variable Absolute forest income Relative forest income
Total income 0.165 (0.048)*** -1.216 (1.921)
Total income squared -0.008 (0.006) 0.183 (0.217)
Wealth cat (middle) -0.052 (0.039) -5.434 (2.239)**
Wealth cat (rich) -0.138 (0.052)*** -8.202 (2.928)***
Age of hh head -0.005 (0.010) 0.041 (0.439)
Age squared 0.000 (0.000) -0.000 (0.004)
Gender of hh head (male) 0.008 (0.069) 2.975 (2.963)
Adult equivalence 0.011 (0.011) 0.961 (0.604)
Educated member in hh 0.001 (0.000)** 0.076 (0.035)**
Caste of hh (lower caste) -0.033 (0.027) -3.501 (1.859)*
In migrated hh 0.007 (0.027) 8.127 (2.717)***
Distance to CF 0.001 (0.008) 0.539 (0.750)
Market for forest products 0.165 (0.038)*** 9.343 (2.170)***
CF area -0.097 (0.038)** -10.198 (2.856)***
No. of CFUGs 0.018 (0.005)*** 1.214 (0.248)***
Participation rate -0.002 (0.001)* -0.040 (0.046)
Other forest source 0.049 (0.027)* 4.460 (2.525)*
Predicted participation -0.121 (0.102) -8.005 (5.723)
Predicted free riding 0.108 (0.105) 14.940 (4.816)***
No. of observations 452 452
R2 0.26 0.21
F-statistics 2.23 8.20
Prob. > F 0.00 0.00
* Significant at 10%; ** significant at 5%; *** significant at 1%. Robust standard errors in parentheses
Validity of both regression equations is confirmed by the significant F-statistics, indicating the
joint effect of control variables is statistically significant.
It is surprising to see that the coefficients for predicted participation are negative but not
significant for both absolute and relative forest income. Thus the hypothesis that participation
does not affect forest income cannot be rejected, lending support to our earlier findings that
programme participation does not have any major positive effects on forest income, but possibly
the opposite. The possible explanation for this result is that most of the CFUGs limit the forest
use to household consumption and prohibits the sale of forest products by individual.

Draft: Comments are welcome
32
On the contrary, coefficients of predicted free riding are positive in both absolute and relative
forest income, and statistically significant for relative forest income. This suggests that free
riding increase forest income. In other words, it is more beneficial to be free rider than a
participant in the CFM, which in one way is just what any economic text book would suggest.
Looking at the relative forest income, free riders enjoy nearly 15% more income from forest than
those who are not free riding. In terms of absolute income they get 10,000 more than non-free
riding households.
The similar impression can be drawn from the higher participation rate in CFP at the village
level. The households from the high participating villages get less forest income in both absolute
and relative terms. Though this variable is significant in absolute forest income only, the
negative signs in both regressions indicate that more members in CFP leads to reduced income
from forests. However, this finding is justified, as the benefit is smaller when there are more
beneficiaries.
The above discussion clearly shows that participation in CFP does not have significant effect on
forest income, and it is weakly negative. Free riders are gaining, but from our discussion in
section 5.4, it was found that poor, uneducated, lower caste and non-migrant households were the
free riders and they are from the villages with no market for forest products, low participation
rate and large forest area. Being the poorest and having low opportunity cost of labor, the free
riders do not have much to loose by violating the rules and getting benefited with forest use.
Other determinants
As the household gets richer, absolute forest income increases while relative forest income or
forest dependence decreases. However, this variable is not statistically significant for relative
forest income. In terms of wealth indices, it is found that income from forest decreases when the
household becomes wealthier. The wealthy households may use alternative fuel source than
fuelwood and may use less forest products.
It is interesting to note that migrated households get more forest income than the locals in both
absolute and relative term. From our earlier discussions, it was found that migrants were less

Draft: Comments are welcome
33
likely to participate in the program and less likely to be free riders. This may indicate that they
get the forest products either from private or state forest or buy from the market.
On one hand area of community forestry decreases the income from forest for a household and
on other hand number of CFUGs increases the forest income in both absolute and relative term.
This is again in line with the conventional hypothesis that management is less efficient when the
resource is abundant and hence output from it is less. This may be the reason for negative sign of
area of community forest. More user groups imply close monitoring and effective execution of
rules and regulations. The distribution of forest products is efficient when more CFUGs exist and
hence the income from forest also increases.
It is likely that diversified sources provide more income. Positive and significant coefficients of
availability of alternative source and market for forest products indicate this. Market access and
existence of other forest source increase the forest income share by 9% and 4% respectively.
6 Conclusions Most of the rural population in Nepal depends on forest to fulfill the need of basic forest
products. A landmark shift in Nepal’s forestry policy transferred the management responsibilities
to local communities, who had the traditional use rights. Researches have found that this
devolution has been successful in halting the degradation of natural resources, but the
programme’s impact on improving the livelihoods and reducing poverty is not as positive as
often claimed.
Analyzing the household data of 452 household data from central Nepal, we focused on two
major reasons to join the CFP. First, participation provides the better (legal) access to forest
products. Relatively poor households participate in the programme to benefiting from the access.
Second, participants can gain political and social influence from the programme. These
households do not necessarily get any products from CF, but holds the power to influence other
participants and how to spend the income. A third reason, raised by young and educated
households, is the concern over forest degradation.

Draft: Comments are welcome
34
We found a weak U curve between the household income and participation. As mentioned
above, the motivations are different for different income groups. Wealth (an index of household
physical assets, landholding and livestock unit) affects participation decision negatively, i.e.
wealthier households do not join the programme. But other variables like household size, caste
and migration, which are closely associated with wealth, are also important in making the
decision. Growing concern over resource conservation is reflected in the educated household’s
decision to participate in the programme.
The participation decision is affected by the community and village level variables also. The
resource abundance may ensure the availability of better access and attracts the participation.
Group pressure is another factor that implies higher participation in CFP.
Existence of free riding in the programme cannot be rejected and we found that poor, uneducated
and lower caste households to be the free riders. Because of weak sanctions against free riders,
the number of free riders is large.
At the next level, we tried to answer what impact participation has on forest income. We found
that participation does not yield any significant positive effect on the forest income, but rather
tends to reduce it. On the contrary, free riders are found to be having higher income from forest
and free riders have higher forest incomes, although generally being much poorer than members.
Although free riding is bad from efficiency point of view, one may argue that it has positive
distributional effects.
7 References Adhikari, B. (2004). Community forestry in Nepal management rules and distribution of
benefits. Policy Brief, South Asian Network for Development and Environmental
Economics (SANDEE).

Draft: Comments are welcome
35
Adhikari, B., S. D. Falco, et al. (2004). "Household characteristics and forest dependency:
evidence from common property forest management in Nepal." Ecological Economics
48(2): 245-257.
Agrawal, A. (2001). "Common Property Institutions and Sustainable Governance of Resources."
World Development 29(10): 1649-1672.
Agrawal, A. (2000). Small is beautiful, but is large better? Forest-Management Institutions in the
Kumaon Himalaya, India. People and Forests. G. Clark, M. A.M. and E. Ostrom.
Cambridge, MIT Press: 57-85.
Agrawal, A. and K. Gupta (2005). "Decentralization and Participation: The Governance of
Common Pool Resources in Nepal's terai." World Development 33(7): 1101-1114.
Agrawal, A. and C. C. Gibson (1999). "Enchantment and Disenchantment: The Role of
Community in Natural Resource Conservation." World Development 27(4): 629-649.
Arnold, J. E. M. (1995). Managing forests as common property. Community Forestry Paper 136,
FAO.
Aryal, B. and A. Angelsen (2006). Self Selection and Households' Dependency on Forest: Does
Product Types Matter? (Manuscript).
Baland, J.-M. and J.-P. Platteau (1999). "The Ambiguous Impact of Inequality on Local
Resource Management." World Development 27(5): 773-788.
Baland, J. M. and J.-P. Platteau (1996). Halting Natural Resource Degradation. Is there a Role
for Local Communities. Oxford, Food and Agriculture Organization of the United
Nations, and Oxford University Press.
Bhatia, A., Ed. (1999). Participatory Forest Management: Implications for Policy and Human
Resources' Development in the Hindu Kush-Himalayas. Kathmandu, International Centre
for Integrated Mountain Development.
Bhattarai, B. and H. R. Ojha (2000). Distributional impact of community forestry, who is
benefiting from Nepal's community forests? Forest Action Research Series 00/01.
Buchy, M. and S. Hoverman (2000). "Understanding public participation in forest planning: a
review." Forest Policy and Economics 1(1): 15-25.
Cameron, A. C. and P. K. Trivedi (2005). Microeconometrics Methods and Applications. New
York, Cambridge University Press.

Draft: Comments are welcome
36
Dev, O. P., N. P. Yadav, et al. (2003). "Impacts of Community Forestry on Livelihoods in the
Middle Hills of Nepal." Journal of Forest and Livelihood 3(1).
Graner, E. (1997). The Political Ecology of Community Forestry in Nepal. Saarbrücken, Verlag
für Entwicklungspolitik
Greene, W. H. (2000). Econometric Analysis, Prentice Hall.
Gujarati, D. N. (2003). Basic Econometrics. New York, McGraw Hill.
Jodha, N. S. (1992). Common Property Resources - A Missing Dimension of Development
Strategies, The World Bank.
Jumbe, C. B. L. and A. Angelsen (2005). Forest dependence and participation in forest co-
management in Malawi. 6th International Conference of the European Society for.
Kumar, S. (2002). "Does "Participation" in common pool resource management help the poor? A
social cost-benefit analysis of joint forest management in Jharkhand, India." World
Development 30(5): 763-782.
Maharjan, M. R. (2003). Why right based approach in community forestry? CARE Nepal
Newsletter. 8 (1).
McFadden, D. (1981). Conditional Logit Analysis of Qualitative Choice Behavior. Econometric
Models and Economic Forecasts. R. S. Pindyck and D. L. Rubinfeld, McGraw-Hill Book
Company.
Maskey, V., T. G. Gebremedhin, et al. (2006). "Social and cultural determinants of collective
management of community forest in Nepal." Journal of Forest Economics 11: 261-274.
North, D. C. (1987). "Institutions, Transaction Costs and Economic Growth." Economic Inquiry
XXV(July): 419-428.
NPC (2003). The Tenth Plan, National Planning Commission, Nepal.
Ostrom, E. (1999). Self-Governance and Forest Resources. Bogor, Indonesia, CIFOR.
Pagdee, A., Y. Kim, et al. (2006). "What Makes Community Forest Management Successful: A
Meta-Study From Community Forests Throughout the World." Society and Natural
Resources 19: 33-52.
Pokharel, B. K. (2002). Contribution of community forestry to people's livelihoods and forest
sustainability: experience from Nepal. Paper presented in the Regional Workshop on
Adaptive Collaborative Management, 26-27 September. Bangkok, World Rainforest
Movement.

Draft: Comments are welcome
37
Sadoulet, E. and A. d. Janvry (1995). Quantitative Development Policy. Baltimore and London,
Johns Hopkins University Press.
Varughese, G. and E. Ostrom (2001). "The Contested Role of Heterogeneity in Collective
Action: Some Evidence From Community Forestry in Nepal." World Development 29(5):
747-765.
Vosti, S. and T. Reardon (1997). "Sustainability, Growth, and Poverty Alleviation- Apolicy and
agroecological perspective." Food Policy Statement(25).
Wooldridge, J. M. (2002). Econometric Analysis of Cross Section and Panel Data, The MIT
Press.

Draft: Comments are welcome
38
Appendix
Fig A1: Histogram of the participants of CFP by villages
0
20
40
60
80
100
1 2 3 4 5 6 7 8 9 10 11 12 13 14 15 16
Villages
Hou
seho
ld P
erce
ntag
e
Member Non member

Draft: Comments are welcome
39


![Licensing MotorcycleRiders’ Handbookironbrothersmc.com/motors/[Riders' book]/Riders' handbook.pdf · MotorcycleRiders’ Handbook. Motorcycle Riders’ Handbook Learner Approved](https://static.fdocuments.net/doc/165x107/5a7801147f8b9ad22a8e985c/licensing-motorcycleriders-ha-riders-bookriders-handbookpdf-motorcycleriders.jpg)