Ponemon Institute Data Breaches and Sensitive Data Risk
22
Data Breaches and Sensitive Data Risk Ponemon Institute© Research Report Sponsored by Informatica & Scale Venture Partners Independently conducted by Ponemon Institute LLC Publication Date: February 2016
Transcript of Ponemon Institute Data Breaches and Sensitive Data Risk

Data Breaches and Sensitive Data Risk
Ponemon Institute© Research Report
Sponsored by Informatica & Scale Venture Partners Independently conducted by Ponemon Institute LLC Publication Date: February 2016

Ponemon Institute© Research Report Page 1
Data Breaches and Sensitive Data Risks Ponemon Institute, February 2016
Part 1. Introduction Ponemon Institute is pleased to present the results of Data Breaches and Sensitive Data Risks sponsored by Informatica and Scale Venture Partners. The purpose of this research is to learn how organizations assess and minimize the risks to their sensitive and confidential information in order to prevent a data breach. We surveyed 432 U.S. IT and IT security practitioners. To ensure a knowledgeable and quality response, only IT practitioners whose job involves IT security and/or data protection activities in their companies participated in this research. Their primary responsibilities include evaluating program performance, managing IT security risks and managing IT budgets. Fifty-eight percent of respondents describe their companies’ security function as centralized across the enterprise, 25 percent say it is decentralized by line of business and 17 percent say it is hybrid. According to participants in this research, the two most significant security problems are: not knowing the location of sensitive data and not knowing the data risk. As shown in Figure 1, only 12 percent of respondents know the risk of structured data contained in databases. According to respondents, the companies represented in this research have an average of 4,275 structured databases. Similarly, very few know the risk to unstructured data contained in emails or files (8 percent of respondents), data located in the cloud (7 percent of respondents) and big data used for analytics (5 percent of respondents). The consequence of not knowing the risk makes a data breach the top security concern for companies represented in this research. However, they believe having the right technologies, including automated solutions that discover where sensitive data has proliferated, would increase their ability to mitigate the risk of a data breach. Other key takeaways from this research include the following: Sixty-two percent of respondents worry most about the inability to determine the location of their organizations’ sensitive or confidential data. This is followed by not knowing their organizations’ data risk (60 percent of respondents). Other concerns include the migration to new mobile platforms (56 percent of respondents) and third-party or outsourcer management of data. A data breach is the top IT security risk and one that is increasing. Companies continue to struggle with reducing the possibility of a data breach. When asked to select the one IT security risk that causes the most problems, it is the data breach of sensitive information, according to 35 percent of respondents. This is followed by employee/user negligence (21 percent of respondents). Non-compliance and malware/advanced persistent threats are considered the smallest IT security risk.
Figure 1. Do you know the risk to all sensitive data in your
organization?

Ponemon Institute© Research Report Page 2
Data breach risks are increasing. Sixty-five percent of respondents say the risk of a data breach of sensitive or confidential information is increasing and 63 percent say the risk of external attacks is increasing. Malware/advanced persistent threats (59 percent of respondents) are also increasing. Many companies use homegrown automated solutions to discover sensitive data and assess its risk. More than half (51 percent) of respondents say their companies use an automated solution to understand the data that needs to be protected. Sixty-four percent of respondents say the solution to discover sensitive data is developed in-house and 45 percent of respondents say they use a solution provided by a vendor. Respondents are uncertain what user activity is being tracked. While many companies are using these automated solutions, 49 percent of respondents say they don’t know what is being tracked. If they do know, 45 percent of respondents say they are tracking privileged user access, and 40 percent of respondents say they are tracking data risk escalation. However, the biggest gaps in what user activity is being tracked and what should be tracked are: privileged user access, cross border transfers, high volume access and new proliferation of data. Data classification is the technology most often used to stop data breaches. According to 74 percent of respondents, their companies are using data classification tools to improve data security. This tool is followed by: data monitoring (69 percent of respondents), encryption or tokenization (61 percent of respondents) and data discovery (55 percent of respondents). Certain risks could not be addressed by commercial solutions. According to respondents, it was not possible to find commercial solutions to deal with the risks of employee and user negligence and malicious insiders (68 percent and 66 percent of respondents, respectively). As a result, they had to build a solution in-house. Similarly, 49 percent of respondents say they had to build a solution to prevent data breaches and another 49 percent of respondents say there were no commercial solutions that addressed their malware/advanced persistent threats. Respondents predict the process and target-focused security controls that will be most relevant over the next three to five years. The most important process-focused controls will be: security intelligence analytics to identify risk and threats (52 percent of respondents), threat feeds and intelligence sharing (45 percent of respondents), advanced authentication and identification schemes (40 percent of respondents) and user provisioning and identity management, especially cloud and social media (37 percent of respondents). The most important target-focused security controls will be: cloud service brokers and cloud application gateways (40 percent of respondents), user awareness training (39 percent of respondents) information protection and control (DLP, tracking, masking, encryption) (35 percent of respondents) and database firewall/activity monitoring (30 percent of respondents). How do companies determine what changes to make to their security programs? With the multitude of security threats facing companies, how do they decide the areas of their IT security programs to refine or change? Sixty-seven percent of respondents look at threats and vulnerabilities that need to be attended to, and 63 percent say they decide based on budget or resource constraints. Fifty-three percent of respondents say their companies look at what parts of the program need to mature or evolve. What trends will influence IT security decision-making and programs? Over the next three to five years, the three top industry trends that will most affect companies’ decisions related to their security programs are: consumerization of IT and/or shadow IT (45 percent of respondents), mobility such as smartphones and tablets (40 percent of respondents) and increased stealth and sophistication of the attacker (34 percent of respondents).

Ponemon Institute© Research Report Page 3
Part 2. Key findings In this section, we provide an analysis of the key findings. The complete audited findings are shown in the appendix of this report. We have organized the report according to the following topics: § Data breaches are the top IT security risk § Technology solutions to address data security risks § The future of IT security programs and decision-making Data breaches are the top IT security risk What keeps IT practitioners up at night? As shown in Figure 2, the biggest worry is the inability to determine the location of their organizations’ sensitive or confidential data, according to 62 percent of respondents. This is followed by not knowing their organization’s data risk (60 percent of respondents). Other concerns include the migration to new mobile platforms (56 percent of respondents) and third party or outsourcer management of data. Figure 2. What keeps you up at night? Four responses permitted
46%
50%
56%
60%
62%
0% 10% 20% 30% 40% 50% 60% 70%
Temporary worker or contractor mistakes
Third party or outsourcer management of data
Migration to new mobile platforms
Not knowing the data risk
Not knowing where the data is

Ponemon Institute© Research Report Page 4
A data breach is the top IT security risk and one that is increasing. Companies continue to struggle with reducing the possibility of a data breach. When asked to select the one IT security risk that causes the most problems, it is the data breach of sensitive information, according to 35 percent of respondents and revealed in Figure 3. This is followed by employee/user negligence (21 percent of respondents). Non-compliance and malware/advanced persistent threats are considered the samllest IT security risk. Figure 3. What is your organization’s top IT security risk?
Consistent with these findings, respondents are most confident in the controls used to achieve compliance with regulations and minimize malware/advanced persistent threats. While employee and user negligence is a top IT security risk, respondents are fairly confident in the controls in place to prevent a security incident, as presented in Figure 4. Figure 4. How confident are you in the current controls used to manage security risks? Very confident and confident responses combined
5%
11%
11%
17%
21%
35%
0% 5% 10% 15% 20% 25% 30% 35% 40%
Non-compliance
Malicious insiders
Malware/advanced persistent threats
External attacks
Employee/user negligence
Data breach of sensitive information
33%
40%
44%
48%
51%
59%
0% 10% 20% 30% 40% 50% 60% 70%
Data breach of sensitive information
External attacks
Malicious insiders
Employee/user negligence
Malware/advanced persistent threats
Non-compliance
Ponemon Institute© Research Report Page 5
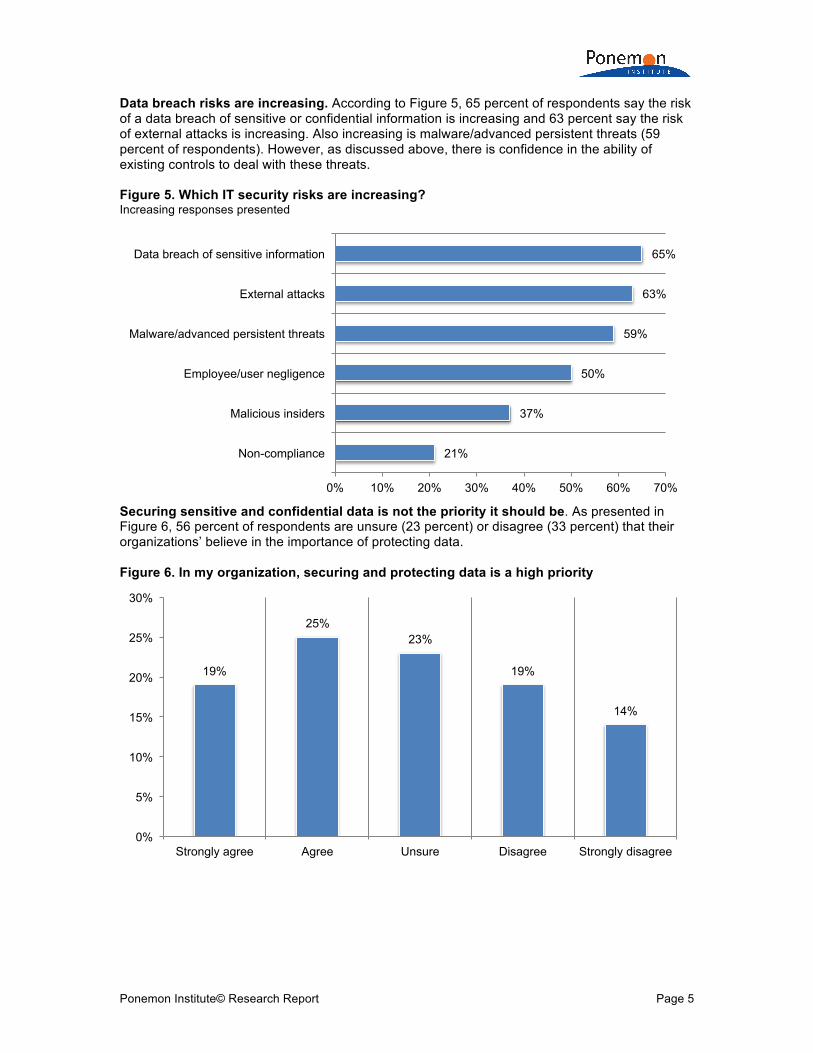
Data breach risks are increasing. According to Figure 5, 65 percent of respondents say the risk of a data breach of sensitive or confidential information is increasing and 63 percent say the risk of external attacks is increasing. Also increasing is malware/advanced persistent threats (59 percent of respondents). However, as discussed above, there is confidence in the ability of existing controls to deal with these threats. Figure 5. Which IT security risks are increasing? Increasing responses presented
Securing sensitive and confidential data is not the priority it should be. As presented in Figure 6, 56 percent of respondents are unsure (23 percent) or disagree (33 percent) that their organizations’ believe in the importance of protecting data. Figure 6. In my organization, securing and protecting data is a high priority
21%
37%
50%
59%
63%
65%
0% 10% 20% 30% 40% 50% 60% 70%
Non-compliance
Malicious insiders
Employee/user negligence
Malware/advanced persistent threats
External attacks
Data breach of sensitive information
19%
25% 23%
19%
14%
0%
5%
10%
15%
20%
25%
30%
Strongly agree Agree Unsure Disagree Strongly disagree

Ponemon Institute© Research Report Page 6
This lack of interest on the part of management could be related to not receiving information from the IT security function about the importance of safeguarding sensitive and confidential information. In fact, only 34 percent of respondents say their organizations have defined metrics to communicate the business impact of their security program to colleagues and management. On average, 35 percent of an organization’s data is considered sensitive or confidential. As shown in Figure 7, 54 percent of respondents say their organizations have no set schedule to assess the risk to its sensitive data. Figure 7. How frequently does your organization assess the risk of its sensitive data?
12% 8% 7%
19%
54%
0%
10%
20%
30%
40%
50%
60%
Monthly Quarterly Semi-Annually Annually No set schedule

Ponemon Institute© Research Report Page 7
Technology solutions to address data security risks Many companies use homegrown automated solutions to discover sensitive data and assess its risk. More than half (51 percent) of respondents say their companies use an automated solution to understand the data that needs to be protected. As shown in Figure 8, 64 percent of respondents say the solution to discover sensitive data is developed in-house and 45 percent of respondents say they use a solution provided by a vendor. Figure 8. What automated solutions does your organization use to discover sensitive data and asses its risk? More than one response permitted
64%
45%
23%
6%
0%
10%
20%
30%
40%
50%
60%
70%
Homegrown solution Vendor provided solution
Open source solution Other

Ponemon Institute© Research Report Page 8
Respondents are uncertain what user activity is being tracked. While many companies are using these automated solutions, 49 percent of respondents, as shown in Figure 9, say they don’t know what is being tracked. If they do know, 45 percent of respondents say they are tracking privileged user access, and 40 percent of respondents say they are tracking data risk escalation. However, the biggest gaps in what user activity is being tracked and what should be tracked are: privileged user access, cross border transfers, high volume access and new proliferation of data. Figure 9. What should be tracked and what is tracked today with an automated solution? More than one response permitted
28%
39%
11%
41%
27%
54%
49%
16%
24%
33%
33%
40%
45%
0% 10% 20% 30% 40% 50% 60%
Cannot determine *
New proliferation of data
High volume access
Cross border access
Cross border transfers
Sensitive data risk escalation
Privileged user access
Not a response for user activity that should be tracked
What is being tracked today User activity that should be tracked

Ponemon Institute© Research Report Page 9
Data classification is the technology most often used to stop data breaches. According to 74 percent of respondents, their companies use data classification tools to improve data security. This tool is followed by: data monitoring (69 percent of respondents), encryption or tokenization (61 percent of respondents) and data discovery (55 percent of respondents), as shown in Figure 10. Figure 10. Technologies or “tools” organizations have in place today to address data security More than one response permitted
Certain risks could not be addressed by commercial solutions. According to respondents, as shown in Figure 11, it was not possible to find commercial solutions to deal with the risks of employee and user negligence and malicious insiders (68 percent and 66 percent of respondents, respectively). As a result, they had to build a solution in-house. Similarly, 49 percent of respondents say they had to build a solution to prevent data breaches, and another 49 percent of respondents say there were no commercial solutions that addressed their malware/advanced persistent threats. Figure 11. For which risks did you need to build a solution in-house because there were no viable commercial alternatives? More than one response permitted
3%
25%
39%
49%
50%
55%
61%
69%
74%
0% 10% 20% 30% 40% 50% 60% 70% 80%
Other
User access activity monitoring of sensitive/high risk data
Data masking
Data risk analysis
Data loss prevention
Data discovery
Encryption/tokenization
Data monitoring
Data classification
27%
30%
49%
49%
66%
68%
0% 10% 20% 30% 40% 50% 60% 70% 80%
External attacks
Non-compliance
Data breach of sensitive information
Malware/advanced persistent threats
Malicious insiders
Employee/user negligence

Ponemon Institute© Research Report Page 10
Respondents predict the process and target-focused security controls that will be most relevant over the next three to five years. According to Figure 12, The most important process-focused controls will be: security intelligence analytics to identify risk and threats (52 percent of respondents), threat feeds and intelligence sharing (45 percent of respondents), advanced authentication and identification schemes (40 percent of respondents) and user provisioning and identity management, especially cloud and social media (37 percent of respondents). The most important target-focused security controls will be: cloud service brokers and cloud application gateways (40 percent of respondents), user awareness training (39 percent of respondents), information protection and control (DLP, tracking, masking, encryption) (35 percent of respondents), and database firewall/activity monitoring (30 percent of respondents). Figure 12. Which process and target-focused security controls will be the most relevant? More than one response permitted
37%
40%
45%
52%
0% 15% 30% 45% 60%
User provisioning and identity management especially cloud and
social media
Advanced authentication & Identification schemes
Threat feeds, intelligence sharing
Security intelligence analytics to identify risk
and threats
Process-focused security controls
30%
35%
39%
40%
0% 15% 30% 45%
Database firewall / activity monitoring
Information protection and control
User awareness, training
Cloud service brokers / cloud application
gateways
Target-focused security controls

Ponemon Institute© Research Report Page 11
The future of IT security programs and decision-making How do companies determine what changes to make to their security programs? With the multitude of security threats facing companies, how do they decide the areas of their IT security programs to refine or change? As shown in Figure 13, 67 percent of respondents look at threats and vulnerabilities that need to be attended to, and 63 percent say they decide based on budget or resource constraints. Fifty-three percent of respondents say their companies look at what parts of the program need to mature or evolve. Figure 13. How does your security operations team determine what areas of the IT security program need to be refined or changed? More than one response permitted
What trends will influence IT security decision-making and programs? Over the next three to five years, the three top industry trends that will most affect companies’ decisions related to their security programs are: consumerization of IT and/or shadow IT (45 percent of respondents), mobility such as smartphones and tablets (40 percent of respondents) and increased stealth and sophistication of the attacker (34 percent of respondents), as shown in Figure 14. Figure 14. Trends that will have the biggest impact on the IT security program’s decision-making process More than one response permitted
4%
47%
49%
53%
63%
67%
0% 10% 20% 30% 40% 50% 60% 70% 80%
Other
We look at changes to the company’s business strategy
We use a risk-based approach
We look at what parts of program need to mature (evolve)
We decide based on budget or resource constraints
We look at threats and vulnerabilities that need to be attended to
23%
26%
34%
40%
45%
0% 5% 10% 15% 20% 25% 30% 35% 40% 45% 50%
Ubiquitous, high-speed Internet access
Bring your own device (BYOD)
Increased stealth and sophistication of the attacker
Mobility – smartphones and tablets
Consumerization of IT and/or shadow IT

Ponemon Institute© Research Report Page 12
Part 3. Methods A sampling frame of 13,095 experienced IT and IT security practitioners located in the United States were selected as participants to this survey. To ensure knowledgeable responses, only IT practitioners whose job involves IT security and/or data protection activities in their companies were selected as participants in this research. Table 1 shows 537 total returns. Screening and reliability checks required the removal of 105 surveys. Our final sample consisted of 432 surveys (3.3 percent response rate). Table 1. Sample response Freq Pct% Total sampling frame 13,095 100% Total returns 537 4.1% Rejected or screened surveys 105 0.8% Final sample 432 3.3%
Pie Chart 1 reports the industry segments of respondents’ organizations. This chart identifies financial services (19 percent) as the largest segment, followed by health & pharmaceutical (11 percent), and public sector (11 percent). Pie Chart 1. Industry classification of respondents’ organizations
In addition to the United States, 72 percent of respondents reported having employees located in Europe, 67 percent responded Canada and 63 percent reported having employees in Asia-Pacific, as shown in Table 2.
Table 2. Location of employees Pct%
United States 100% Europe 72% Canada 67% Asia-Pacific 63% Latin America (including Mexico) 61% Middle East & Africa 54%
19%
11%
11%
10% 10%
7%
6%
5%
5%
4% 3%
3% 2% 4%
Financial services Health & pharmaceutical Public sector Retail Services Technology & software Industrial Consumer products Energy & utilities Transportation Communications Hospitality Entertainment & media Other

Ponemon Institute© Research Report Page 13
Part 4. Caveats
There are inherent limitations to survey research that need to be carefully considered before drawing inferences from the findings. The following items are specific limitations that are germane to most web-based surveys.
Non-response bias: The current findings are based on a sample of survey returns. We sent surveys to a representative sample of individuals, thus resulting in a large number of usable returned responses. Despite non-response tests, it is always possible that individuals who did not participate are substantially different in terms of underlying beliefs from those who completed the instrument. Sampling-frame bias: The accuracy is based on contact information and the degree to which the list is representative of individuals who are IT or IT security practitioners. We also acknowledge that the results may be biased by external events such as media coverage. We also acknowledge bias caused by compensating subjects to complete this research within a holdout period. Self-reported results: The quality of survey research is based on the integrity of confidential responses received from subjects. While certain checks and balances can be incorporated into the survey process, there is always the possibility that a subject did not provide a truthful response.

Ponemon Institute© Research Report Page 14
Appendix: Detailed Survey Results
The following tables provide the frequency or percentage frequency of responses to all survey questions contained in this study. All survey responses were captured in November 2015.
Survey response Freq. Total sampling frame 13,095 Total returns 537 Rejected or screened surveys 105 Final sample 432 Response rate 3.3%
Part 1. Screening S1. Which of the following best describes your role in managing the IT and/or
IT security function within your organization? Please select all that apply. Pct% Setting IT priorities 53% Managing IT budgets 55% Selecting vendors and contractors 47% Determining IT strategy 32% Evaluating program performance 61% Mitigating IT security risks 59% None of the above (stop) 0% Total 307%
S2. What best describes your level of involvement in leading IT security and/or data protection activities within your organization? Pct% Very significant 33% Significant 41% Moderate 26% Nominal (stop) 0% None (stop) 0% Total 100%
S3. What best defines your position level within the organization? Pct% C-level executive 4% Vice president 4% Director 25% Manager 38% Supervisor 29% Staff / associate (stop) 0% Technician (stop) 0% Contractor (stop) 0% Total 100%
S4. What best describes your organization’s global headcount (size)? Pct% Less than 1,000 18% 1,001 to 5,000 22% 5,001 to 10,000 23% 10,001 to 25,000 18% 25,001 to 75,000 11% More than 75,000 8% Total 100%
Ponemon Institute© Research Report Page 15
Part 2. State of IT security risk Q1. What function does your company’s IT security department report to? Pct%
CIO / CTO 28% CSO / CISO 34% Compliance 3% Finance & accounting 2% Human resources 0% Internal audit 2% Legal 0% Risk management 8% Lines of business (data owner) 23% Other (please specify) 0% Total 100%
Q2. How is your company’s security function organized? Pct% Centralized across the enterprise 58% Decentralized by line of business 25% Hybrid 17% Total 100%
Q3. At a high-level, how does you security operations team determine which areas of your company’s IT security program to refine or change? Please select all that apply. Pct% We look at what parts of program need to mature (evolve) 53% We look at changes to the company’s business strategy 47% We look at threats and vulnerabilities that need to be attended to 67% We decide based on budget or resource constraints 63% We use a risk-based approach 49% Other (please specify) 4% Total 283%
Q4. What is your organization's top IT security risk? Please select one top choice. Pct% Data breach of sensitive information 35% Employee/user negligence 21% External attacks 17% Malicious insiders 11% Malware/advanced persistent threats 11% Non-compliance 5% Other (please specify) 0% Total 100%
Q5. For each IT security risk, please rate your level of confidence that the current controls in place are effectively managing the risk? Please use the following scale: 1 = no confidence, 2 = not confident, 3 = somewhat confident, 4 = confident, and 5 = very confident. Very confident and Confident (4 or 5) responses combined. Pct% Data breach of sensitive information 33% Employee/user negligence 48% External attacks 40% Malicious insiders 44% Malware/advanced persistent threats 51% Non-compliance 59% Other (please specify) 0% Total 275%

Ponemon Institute© Research Report Page 16
Q6. For each IT security risk, please provide your opinion whether IT security risk is increasing, decreasing or staying the same over the next 12 months. Please use the following scale: 1 = increasing, 2 = decreasing and 3 = staying the same. Percent who selected 1 = increasing. Pct% Data breach of sensitive information 65% Employee/user negligence 50% External attacks 63% Malicious insiders 37% Malware/advanced persistent threats 59% Non-compliance 21% Other (please specify) 0% Total 295%
Q7. For which risks (if any) did you need to build something in-house because there were no viable commercial alternatives? Please select all that apply. Pct% Data breach of sensitive information 49% Employee/user negligence 68% External attacks 27% Malicious insiders 66% Malware/advanced persistent threats 49% Non-compliance 30% Other (please specify) 0% Total 289%
Q8. Do you have defined metrics to communicate the business impact of your security program to your peers and/or management? Pct% Yes 34% No 61% Unsure 5% Total 100%
Q9. Over the next 3-5 years, what industry trends (or forcing functions) will most affect your organization’s IT security program’s decision-making process? Please select your top 3 choices. Pct% Consumerization of IT and/or shadow IT 45% Mobility – smartphones and tablets 40% Increased stealth and sophistication of the attacker 34% Bring your own device (BYOD) 26% Ubiquitous, high-speed Internet access 23% IT Automation / API-level integrations 19% Weaponization of the Internet 18% Increased regulations and compliance requirements 17% Nation-state attacks 17% Software as a service (SaaS) 16% Internet Of Things 12% Work/life integration 10% Agile deployment methodologies 9% Virtualization 9% Infrastructure as a service (IaaS) 5% Total 300%

Ponemon Institute© Research Report Page 17
Q10. Over the next 3-5 years, which of the process-focused security controls will be the most relevant to your organization? Please select your top 3 choices. Pct% Security intelligence analytics to identify risk and threats (reactive and predictive) 52% Threat feeds, intelligence sharing 45% Advanced authentication & Identification schemes 40% User provisioning and identity management especially cloud and social media) 37% Incident response automation, orchestration 33% Forensics and incident investigation 20% Vulnerability management, assessment and testing 16% Enterprise risk management (including threat and risk modeling) 15% Converged physical/logical security 14% Governance, risk and compliance management 11% Metrics, dash-boarding, reporting 9% DevOps security controls 8% Total 300%
Q11. Over the next 3-5 years which of the target-focused security controls are the most relevant to your organization? Please select your top 3 choices. Pct% Cloud service brokers / cloud application gateways 40% User awareness, training 39% Information protection and control (DLP, tracking, masking, encryption) 35% Database firewall / activity monitoring 30% Intrusion detection and prevention 29% Software-defined networking & security automation 22% Enterprise endpoint management (proactive, reactive) 19% Sandboxing / process isolation / lightweight containers 16% Encryption / key management 15% Web application firewall 13% Compliance monitoring /reporting 10% Anti-spam / anti-phishing / brand reputation 10% Firewall 9% Social media / social networks content filtering 8% Network admission control 5% Total 300%
Part 3. State of data protection risk Q12. Do you know the risk to your organization’s sensitive or confidential
information? Q12a. Structured data contained in databases Pct%
Yes, all data 12% Yes, most data 21% Yes, some data 40% No 27% Total 100%
Q12b. Unstructured data contained in emails or files Pct% Yes, all data 8% Yes, most data 15% Yes, some data 24% No 53% Total 100%

Ponemon Institute© Research Report Page 18
Q12c. Big data used for analytics Pct% Yes, all data 5% Yes, most data 20% Yes, some data 28% No 47% Total 100%
Q12d. Data located in the cloud environment Pct% Yes, all data 7% Yes, most data 19% Yes, some data 30% No 44% Total 100%
Q13. In my organization, securing and/or protecting data is a high priority. Pct% Strongly agree 19% Agree 25% Unsure 23% Disagree 19% Strongly disagree 14% Total 100%
Q14. What percentage of your organization’s data is considered sensitive or confidential? Pct% Less than 5% 0% 5 to 10% 10% 11 to 25% 34% 26 to 50% 31% 51 to 75% 20% 76 to 100% 5% Total 100% Extrapolated value 35%
Q15a. Does your organization currently use any automated solution to discover sensitive data and assess its risk? Pct% Yes 51% No 38% Unsure 11% Total 100%
Q15b. If yes, what automated solutions does your organization use to discover sensitive data and assess its risk? Please select all that apply. Pct% Homegrown solution 64% Vendor provided solution (please specify) 45% Open source solution 23% Other (please specify) 6% Total 138%
Q16. How frequently does your organization access the risk of its sensitive data? Pct% Monthly 12% Quarterly 8% Semi-Annually 7% Annually 19% No set schedule 54% Total 100%
Ponemon Institute© Research Report Page 19
Q17a. What are the most important factors of user activity that should be tracked for high-risk sensitive data? Please select your top two choices. Pct% Privileged user access 54% Cross border transfers 41% High volume access 39% New proliferation of data 28% Sensitive data risk escalation 27% Cross border access 11% Total 200%
Q17b. What is being tracked today with an automated solution? Please select all that apply. Pct% Cross border transfers 33% Cross border access 33% High volume access 24% Privileged user access 45% New proliferation of data 16% Sensitive data risk escalation 40% Cannot determine 49% Total 240%
Q18. With respect to your organization’s ability to assess sensitive data risk, what keeps you up at night? Please select your top four choices.
Pct% Broken business processes 16% Employee mistakes 16% Hackers 35% Lack of data privacy controls 2% Malicious employees 10% Migration to cloud ecosystem 25% Migration to new mobile platforms 56% Non-compliance with laws or regulations 19% Not knowing the data risk 60%
Not knowing where the data is 62%
Temporary worker or contractor mistakes 46%
Third party or outsourcer management of data 50% Other (please specify) 3% Total 400%

Ponemon Institute© Research Report Page 20
Q19. Please select the technologies or “tools” your organization has in place today to address data security. Please select all that apply.
Pct% Data discovery 55% Data risk analysis 49% Data classification 74% Encryption/tokenization 61% User access activity monitoring of sensitive/high risk data 25% Data masking 39% Data monitoring 69% Data loss prevention 50% Other (please specify) 3% Total 425%
Q20. Approximately, how many structured databases are deployed within your organization today? Pct% Less than 1,000 30% 1,000 to 2,000 32% 2,001 to 5,000 15% 5,001 to 10,000 14% 10,001 to 25,000 6% More than 25,000 3% Total 100% Extrapolated average 4,275
Q21. Approximately, how many Big Data nodes are deployed within your organization today? Pct% Less than 250 33% 250 to 500 31% 501 to 1,000 18% 1,001 to 2,000 5% 2,001 to 5,000 6% More than 5,000 7% Total 100% Extrapolated value 1,022

Ponemon Institute© Research Report Page 21
Part 4. Organizational Characteristics D1. What best defines your organization’s primary industry classification? Pct%
Agriculture & food services 1% Communications 3% Consumer products 5% Defense & aerospace 1% Education & research 1% Energy & utilities 5% Entertainment & media 2% Financial services 19% Health & pharmaceutical 11% Hospitality 3% Industrial 6% Public sector 11% Retail 10% Services 10% Technology & software 7% Transportation 4% Other (please specify) 1% Total 100%
D2. Where are your employees located? Please select all that apply. Pct% United States 100% Canada 67% Europe 72% Middle East & Africa 54% Asia-Pacific 63% Latin America (including Mexico) 61% Total 417%
Please contact [email protected] or call us at 800.877.3118 if you have any questions.
Ponemon Institute
Advancing Responsible Information Management Ponemon Institute is dedicated to independent research and education that advances responsible information and privacy management practices within business and government. Our mission is to conduct high quality, empirical studies on critical issues affecting the management and security of sensitive information about people and organizations. As a member of the Council of American Survey Research Organizations (CASRO), we uphold strict data confidentiality, privacy and ethical research standards. We do not collect any personally identifiable information from individuals (or company identifiable information in our business research). Furthermore, we have strict quality standards to ensure that subjects are not asked extraneous, irrelevant or improper questions.