Polymorphism of the Transcription Factor 7-Like 2 Gene ...
18
nutrients Article Polymorphism of the Transcription Factor 7-Like 2 Gene (TCF7L2) Interacts with Obesity on Type-2 Diabetes in the PREDIMED Study Emphasizing the Heterogeneity of Genetic Variants in Type-2 Diabetes Risk Prediction: Time for Obesity-Specific Genetic Risk Scores Dolores Corella 1,2, *, Oscar Coltell 2,3 , Jose V. Sorlí 1,2 , Ramón Estruch 2,4 , Laura Quiles 1,2 , Miguel Ángel Martínez-González 2,5 , Jordi Salas-Salvadó 2,6 , Olga Castañer 2,7 , Fernando Arós 2,8 , Manuel Ortega-Calvo 2,9 , Lluís Serra-Majem 2,10 , Enrique Gómez-Gracia 2,11 , Olga Portolés 1,2 , Miquel Fiol 2,12 , Javier Díez Espino 2,13 , Josep Basora 2,6 , Montserrat Fitó 2,7 , Emilio Ros 2,14 and José M. Ordovás 2,15,16 1 Department of Preventive Medicine and Public Health, School of Medicine, University of Valencia, 46010 Valencia, Spain; [email protected] (J.V.S.); [email protected] (L.Q.); [email protected] (O.P.) 2 CIBER Fisiopatología de la Obesidad y Nutrición, Instituto de Salud Carlos III, 28029 Madrid, Spain; [email protected] (O.C.); [email protected] (R.E.); [email protected] (M.Á.M.-G.); [email protected] (J.S.-S.); [email protected] (O.C.); [email protected] (F.A.); [email protected] (M.O.-C.); [email protected] (L.S.-M.); [email protected] (E.G.-G.); miguel.fi[email protected] (M.F.); [email protected] (J.D.E.); [email protected] (J.B.); [email protected] (M.F.); [email protected] (E.R.); [email protected] (J.M.O.) 3 Department of Computer Languages and Systems, School of Technology and Experimental Sciences, Universitat Jaume I, 12071 Castellón, Spain 4 Department of Internal Medicine, Hospital Clinic, IDIBAPS, 08036 Barcelona, Spain 5 Department of Preventive Medicine and Public Health, University of Navarra—Navarra Institute for Health Research (IdisNa), 31009 Pamplona, Spain 6 Human Nutrition Unit, Biochemistry and Biotechnology Department, IISPV, University Rovira i Virgili, 43003 Reus, Spain 7 Cardiovascular Risk and Nutrition Research Group, Hospital del Mar Medical Research Institute (IMIM), 08003 Barcelona, Spain 8 Department of Cardiology, Hospital Txagorritxu, 01009 Vitoria, Spain 9 Department of Family Medicine, Distrito Sanitario Atención Primaria Sevilla, Centro de Salud Las Palmeritas, 41003 Sevilla, Spain 10 Research Institute of Biomedical and Health Sciences, University of Las Palmas de Gran Canaria, 35001 Las Palmas de Gran Canaria, Spain 11 Department of Epidemiology, School of Medicine, University of Malaga, 29071 Malaga, Spain 12 Palma Institute of Health Research (IdISPa), Hospital Son Espases, 07014 Palma de Mallorca, Spain 13 Department of Preventive Medicine and Public Health, University of Navarra—Navarra Institute for Health Research (IdisNA)—Servicio Navarro de Salud-Osasunbidea, 31009 Pamplona, Spain 14 Lipid Clinic, Endocrinology and Nutrition Service, Institut d’Investigacions Biomèdiques August Pi Sunyer (IDIBAPS), Hospital Clinic, 08036 Barcelona, Spain 15 Nutrition and Genomics Laboratory, JM-USDA Human Nutrition Research Center on Aging at Tufts University, Boston, MA 02111, USA 16 Department of Cardiovascular Epidemiology and Population Genetics, Centro Nacional de Investigaciones Cardiovasculares (CNIC), Madrid 28029—IMDEA Alimentación, 28049 Madrid, Spain * Correspondence: [email protected]; Tel.: +34-963-864-800 Received: 23 September 2016; Accepted: 17 November 2016; Published: 6 December 2016 Abstract: Nutrigenetic studies analyzing gene–diet interactions of the TCF7L2-rs7903146 C > T polymorphism on type-2 diabetes (T2D) have shown controversial results. A reason contributing to this may be the additional modulation by obesity. Moreover, TCF7L2-rs7903146 is one of the Nutrients 2016, 8, 793; doi:10.3390/nu8120793 www.mdpi.com/journal/nutrients
Transcript of Polymorphism of the Transcription Factor 7-Like 2 Gene ...

nutrients
Article
Polymorphism of the Transcription Factor 7-Like 2Gene (TCF7L2) Interacts with Obesity on Type-2Diabetes in the PREDIMED Study Emphasizing theHeterogeneity of Genetic Variants in Type-2 DiabetesRisk Prediction: Time for Obesity-Specific GeneticRisk ScoresDolores Corella 1,2,*, Oscar Coltell 2,3, Jose V. Sorlí 1,2, Ramón Estruch 2,4, Laura Quiles 1,2,Miguel Ángel Martínez-González 2,5, Jordi Salas-Salvadó 2,6, Olga Castañer 2,7,Fernando Arós 2,8, Manuel Ortega-Calvo 2,9, Lluís Serra-Majem 2,10, Enrique Gómez-Gracia 2,11,Olga Portolés 1,2, Miquel Fiol 2,12, Javier Díez Espino 2,13, Josep Basora 2,6, Montserrat Fitó 2,7,Emilio Ros 2,14 and José M. Ordovás 2,15,16
1 Department of Preventive Medicine and Public Health, School of Medicine, University of Valencia,46010 Valencia, Spain; [email protected] (J.V.S.); [email protected] (L.Q.); [email protected] (O.P.)
2 CIBER Fisiopatología de la Obesidad y Nutrición, Instituto de Salud Carlos III, 28029 Madrid, Spain;[email protected] (O.C.); [email protected] (R.E.); [email protected] (M.Á.M.-G.);[email protected] (J.S.-S.); [email protected] (O.C.); [email protected] (F.A.);[email protected] (M.O.-C.); [email protected] (L.S.-M.); [email protected] (E.G.-G.);[email protected] (M.F.); [email protected] (J.D.E.); [email protected] (J.B.);[email protected] (M.F.); [email protected] (E.R.); [email protected] (J.M.O.)
3 Department of Computer Languages and Systems, School of Technology and Experimental Sciences,Universitat Jaume I, 12071 Castellón, Spain
4 Department of Internal Medicine, Hospital Clinic, IDIBAPS, 08036 Barcelona, Spain5 Department of Preventive Medicine and Public Health, University of Navarra—Navarra Institute for Health
Research (IdisNa), 31009 Pamplona, Spain6 Human Nutrition Unit, Biochemistry and Biotechnology Department, IISPV, University Rovira i Virgili,
43003 Reus, Spain7 Cardiovascular Risk and Nutrition Research Group, Hospital del Mar Medical Research Institute (IMIM),
08003 Barcelona, Spain8 Department of Cardiology, Hospital Txagorritxu, 01009 Vitoria, Spain9 Department of Family Medicine, Distrito Sanitario Atención Primaria Sevilla,
Centro de Salud Las Palmeritas, 41003 Sevilla, Spain10 Research Institute of Biomedical and Health Sciences, University of Las Palmas de Gran Canaria,
35001 Las Palmas de Gran Canaria, Spain11 Department of Epidemiology, School of Medicine, University of Malaga, 29071 Malaga, Spain12 Palma Institute of Health Research (IdISPa), Hospital Son Espases, 07014 Palma de Mallorca, Spain13 Department of Preventive Medicine and Public Health, University of Navarra—Navarra Institute for Health
Research (IdisNA)—Servicio Navarro de Salud-Osasunbidea, 31009 Pamplona, Spain14 Lipid Clinic, Endocrinology and Nutrition Service, Institut d’Investigacions Biomèdiques August Pi
Sunyer (IDIBAPS), Hospital Clinic, 08036 Barcelona, Spain15 Nutrition and Genomics Laboratory, JM-USDA Human Nutrition Research Center on Aging at Tufts
University, Boston, MA 02111, USA16 Department of Cardiovascular Epidemiology and Population Genetics, Centro Nacional de Investigaciones
Cardiovasculares (CNIC), Madrid 28029—IMDEA Alimentación, 28049 Madrid, Spain* Correspondence: [email protected]; Tel.: +34-963-864-800
Received: 23 September 2016; Accepted: 17 November 2016; Published: 6 December 2016
Abstract: Nutrigenetic studies analyzing gene–diet interactions of the TCF7L2-rs7903146 C > Tpolymorphism on type-2 diabetes (T2D) have shown controversial results. A reason contributingto this may be the additional modulation by obesity. Moreover, TCF7L2-rs7903146 is one of the
Nutrients 2016, 8, 793; doi:10.3390/nu8120793 www.mdpi.com/journal/nutrients

Nutrients 2016, 8, 793 2 of 18
most influential variants in T2D-genetic risk scores (GRS). Therefore, to increase the predictive value(PV) of GRS it is necessary to first see whether the included polymorphisms have heterogeneouseffects. We comprehensively investigated gene-obesity interactions between the TCF7L2-rs7903146C > T polymorphism on T2D (prevalence and incidence) and analyzed other T2D-polymorphismsin a sub-sample. We studied 7018 PREDIMED participants at baseline and longitudinally (8.7 yearsmaximum follow-up). Obesity significantly interacted with the TCF7L2-rs7903146 on T2D prevalence,associations being greater in non-obese subjects. Accordingly, we prospectively observed in non-T2Dsubjects (n = 3607) that its association with T2D incidence was stronger in non-obese (HR: 1.81; 95%CI: 1.13–2.92, p = 0.013 for TT versus CC) than in obese subjects (HR: 1.01; 95% CI: 0.61–1.66; p = 0.979;p-interaction = 0.048). Accordingly, TCF7L2-PV was higher in non-obese subjects. Additionally,we created obesity-specific GRS with ten T2D-polymorphisms and demonstrated for the first timetheir higher strata-specific PV. In conclusion, we provide strong evidence supporting the need forconsidering obesity when analyzing the TCF7L2 effects and propose the use of obesity-specific GRSfor T2D.
Keywords: TCF7L2; type-2 diabetes; obesity; T2D-genetic risk scores; TCF7L2-predictive value;PREDIMED study
1. Introduction
It is common knowledge that obesity is associated with an increased risk of developing type2 diabetes (T2D) [1–3]. However, current genetic information adds some heterogeneity to thisnotion [4]. Thus, whereas some genetic variants may appear to be associated with T2D mainlyin obese subjects [5–7], others may show such association primarily in non-obese individuals [5,6,8].Understanding these differences is crucial to improving the predictive value of genetic variants wheninvestigating T2D as well as gene–diet interactions. Currently, the rs7903146 C > T Single nucleotidepolymorphism (SNP) in the Transcription Factor 7-Like 2 (TCF7L2) gene is the locus most stronglyassociated with T2D risk at the population level [9–11]. However, despite the strong overall associationof this SNP with higher T2D risk, various studies have suggested a modulation of this association byobesity [6,12–15].
Cauchi et al. [6] first reported that the association between the TCF7L2-rs7903146 SNP andprevalent T2D in Europeans was stronger in non-obese subjects. These findings were observed in otherpopulations [12–15]. Nevertheless, this potential heterogeneity by obesity has not been widely reflectedin the analytical approaches of subsequent investigations, and most of them have not formally testedthe interaction between the TCF7L2-rs7903146 polymorphism and obesity status in determining T2Drisk. A contributory factor is that previous findings were mainly based on cross-sectional or case-controlstudies [5,6,9,12–14] with a strong likelihood of being affected by potential biases, more prospectivestudies being required to assess this interaction on T2D incidence. Moreover, in addition to theTCF7L-2-rs7903146 SNP, other SNPs have been associated with T2D risk [10,16–18]. These SNPs arecombined and analyzed together in the so-called genetic risk scores (GRS) to predict T2D [16–18].However, simply summing up the number of risk alleles (unweighted or weighted) associated withT2D obtained from non-stratified genome-wide association studies (GWAS) in conventional GRScalculations may overlook important obesity-specific associations in T2D. Although the GRS usuallyinclude dozens of SNPs associated with T2D, one of the most important SNPs is the rs7903146 C > T inthe TCF7L2 gene [9–11,16]. Recently, large prospective studies have focused on the interaction betweensome multi-SNP GRS and BMI on T2D incidence [16–19], among them, that of Langerberg et al. [16],employing a case-cohort design in the EPIC interact study. The authors found a statistically significantinteraction between a GRS comprising 49 SNPs associated with T2D and BMI (three categories) indetermining T2D incidence, the genetic risk being greater in lean subjects. However, on examining the

Nutrients 2016, 8, 793 3 of 18
interaction of each SNP of the GRS with BMI on T2D incidence, no statistically significant interactionwith BMI was found for the TCF7L2-rs7903146 SNP [16]. This could be because they did not specificallytest the interaction with obesity and made a strict correction for multiple comparisons due to thesimultaneous analyses of 7 phenotypes and 49 SNPs in the same study. Bearing the results of theresult in EPIC cohort in mind, this interaction, therefore, must be prospectively validated in studiesfocusing on the TCF7L2-rs7903146 polymorphism (to avoid the need of correction for multiple SNPcomparisons) and obesity.
Furthermore, the heterogeneity of associations related to this locus also extends to BMI.The T-allele, conferring higher T2D risk, has been associated with lower BMI in some studies [20–23],but not in others [24–26]. A modulation of this association by T2D was first suggested by Helgason etal. [27] who showed that the TCF7L2-T2D risk allele was correlated with decreased BMI in T2D casesbut not in controls. Similar results were observed both by Cauchi et al. [21] and in a meta-analysisincluding more than 300,000 individuals [28], but further studies are required to explore this interactionprospectively. Moreover, as previous findings come from studies focusing on either obesity or T2D, it isnecessary to obtain comprehensive evidence of the interplay between both interactions prospectivelyin the same population. Therefore, our main aims were: (1) To investigate the interaction betweenthe TCF7L2-rs7903146 polymorphism and obesity status in determining T2D prevalence as well asT2D incidence after a median ~6-year follow-up and (2) to examine whether the association of theTCF7L2-rs7903146 SNP with obesity-related parameters depends on T2D status both at baseline andprospectively in the PREvención con DIeta MEDiterránea (PREDIMED) study. In addition, a secondaryaim was to construct obesity-specific GRS (analyzing 10 T2D-SNPs previously characterized [16])in determining T2D prevalence in a sub-sample of PREDIMED participants in order to extend thefindings to other T2D-SNPs.
2. Materials and Methods
The present study was conducted within the framework of the PREDIMED trial, the design ofwhich has been described in detail elsewhere [29]. Briefly, the PREDIMED study is a multicenter,randomized, and controlled clinical trial aimed at assessing the effects of the Mediterraneandiet (MedDiet) on the primary cardiovascular prevention [30]. This study was registered atcontrolled-trials.com (http://www.controlledtrials.com/ISRCTN35739639). Here we included 7018participants from whom DNA was isolated, the TCF7L2-rs7903146 determined, and who had validdata for the main clinical and lifestyle variables analyzed. From October 2003 physicians in PrimaryCare Centers selected high cardiovascular risk participants. Eligible were community-dwelling persons(55–80 years for men; 60–80 years for women) who met at least one of two criteria: T2D or three ormore cardiovascular risk factors [29]. The Institutional Review Board of each participating centerapproved the study protocol, and all participants provided written informed consent. The trial wasstopped following the statistical analysis of data obtained up to December 2010 (median follow-up of4.8 years), due to early evidence of the benefit of the MedDiet on the prevention of major cardiovascularevents [30]. However, the ascertainment of endpoints was extended. The present study is based on theextended follow-up (until 30 June 2012) using the same methods to obtain updated information onclinical events, including T2D. The median follow-up time in this extended follow-up was 5.7 years(maximum: 8.7 years). The present study was mainly conducted as an observational prospectivecohort design with adjustment for the nutritional intervention in the longitudinal analyses. In addition,some association analyses were carried out at baseline.
2.1. Demographic, Clinical, Anthropometric, and Dietary Measurements
The baseline examination included assessment of standard cardiovascular risk factors, medicationuse, socio-demographic factors, and lifestyle variables by validated questionnaires [29,30]. Weight andheight were measured with calibrated scales and a wall-mounted stadiometer, respectively. BMI and

Nutrients 2016, 8, 793 4 of 18
the waist-to-height ratio were calculated. Obesity was defined as BMI ≥30 kg/m2. Percentage of bodyfat was evaluated by using a validated equation [31].
2.2. Biochemical Determinations, DNA Extraction and Genotyping
At baseline, blood samples were obtained after overnight fasting. Fasting glucose and lipidswere measured as previously described [30,32]. Genomic DNA was extracted from buffy-coat andthe TCF7L2-rs7903146, was genotyped in the whole cohort on a 7900 HT Sequence Detection System(Applied Biosystems, Foster City, CA, USA) using a fluorescent allelic discrimination TaqManTMassay as previously reported [33]. Genotype frequencies did not deviate from Hardy–Weinbergequilibrium expectations.
For the secondary outcome focused on the predictive value of the obesity-specific GRSs,in addition to the TCF7L2-rs7903146 SNP, nine previously described SNPs associated with T2D,and included in a 49-SNP T2D-GRS [16], were selected and genotyped. The selected SNPs were:PRC1 (Protein Regulator of Cytokinesis 1)-rs12899811, ZFAND6 (Zinc Finger AN1-Type Containing6)-rs11634397, CDC123_CAMK1D (Cell Division Cycle Protein 123 Homolog_Calcium/CalmodulinDependent Protein Kinase ID)-rs11257655, KCNQ1 (Potassium Voltage-Gated Channel Subfamily QMember 1)-rs163184, ADYC5 (adenylyl cyclase 6)-rs6798189, IGF2BP2 (Insulin Like Growth Factor2 MRNA Binding Protein 2)-rs4402960, SLC30A8 (Solute Carrier Family 30 Member 8)-rs3802177,KLHDC5 (Kelch Domain-Containing Protein 5)-rs10842994, and HMGA2 (High Mobility GroupAT-Hook 2)-rs2261181. Genotyping was carried out with the HumanOmniExpress Illumina array in asub-sample (all the participants from one of the PREDIMED field centers, the PREDIMED-Valenciacenter; n = 1055 subjects), as it was not possible to genotype the whole cohort. Genotype frequenciesdid not deviate from Hardy–Weinberg equilibrium expectations.
2.3. Outcomes and Follow-Up
Clinical diagnosis of T2D was an inclusion criterion of the PREDIMED study [29], and thesesubjects were considered as prevalent cases of T2D. Incidence of T2D was a pre-specified secondaryoutcome of the PREDIMED trial [30]. New-onset diabetes during follow-up was diagnosed usingthe American Diabetes Association criteria, namely fasting plasma glucose levels ≥7.0 mmol/L(≥126.1 mg/dL) or 2-h plasma glucose levels ≥11.1 mmol/L (≥200.0 mg/dL) after a 75-g oral glucoseload, as previously reported [32]. A review of all medical records of participants was completed yearlyin each center by physician-investigators who were blinded to the intervention. When new-onsetdiabetes cases were identified on the basis of a medical diagnosis reported in the medical charts or ona glucose test during routine biochemical analyses (conducted at least once per year), these reportswere sent to the PREDIMED Clinical Events Committee [32]. When a new case of T2D was detected,the glucose analysis was repeated within the next three months, so that the new case of diabetes couldbe confirmed by the adjudication committee. Cases that occurred between 1 October 2003 and 30 June2012 (maximum: 8.7 years; median: 5.7 years) were included in the present analysis (n = 312).
Given that the study involved an open cohort, in which the inclusion of participants lasted from1 October 2003 to 1 December 2009, not all participants had the same length of follow-up period [29].Hence for the longitudinal analyses of BMI in relation to the polymorphism and T2D, two follow-upperiods were selected; one of up to four years and the other up to six years. There were a greaternumber of participants in the first period (n = 3141), as most of the cohort completed this follow-upperiod. A lower number of participants had anthropometric measurements at six years (n = 1750),but this group was considered to be of interest both for the internal replication of the finding and forproviding more evidence of the interaction. Only participants whose anthropometric data had beendirectly measured were included.

Nutrients 2016, 8, 793 5 of 18
2.4. Statistical Analyses
The present analysis was mainly conducted as an observational prospective cohort study withadjustment for the nutritional intervention in longitudinal analyses. In addition, some analyses werecarried out cross-sectionally at baseline (n = 7018). Prevalence of diagnosed T2D was analyzed asthe dependent variable at baseline. In the longitudinal analysis, incidence of T2D was considered asthe end-point in non-diabetic subjects (n = 3607). Moreover, baseline and annual BMI evolution wasconsidered as the dependent variable for evaluating the interaction of the polymorphism with T2D indetermining BMI.
2.4.1. Baseline Association and Interaction Analyses in Determining T2D Prevalence andObesity-Related Variables
Chi-square tests were used to test differences in percentages. We first tested the polymorphismby considering the 3 genotypes. The interactions between the TCF7L2-rs7903146 polymorphism andobesity in determining T2D prevalence at baseline was tested by multivariable logistic regressionmodels including main effect and interaction terms. Models were adjusted for basic potentialconfounders (age, gender, and center) (Model 1). Afterwards, an additional control for more potentialconfounders such as alcohol consumption, physical activity, adherence to the MedDiet, total energyintake, hypertension, and dyslipidemias was undertaken (Model 2). Analyses stratified by obesitystatus were also undertaken for models 1 and 2. CC subjects were considered as the reference categoryand the effect in CT and TT was estimated. Odds ratios (OR) and 95% Confidence intervals (CI) wereestimated. Likewise, the interaction between the TCF7L2 polymorphism and T2D in determiningobesity prevalence at baseline was evaluated by multivariable logistic regression models (model 1and model 2), and stratified analysis by T2D status undertaken. In addition, associations betweenthe TCF7L2 polymorphism and baseline BMI and other obesity-related variables were analyzed bylinear regression models including main effects and interaction terms. Multivariable adjustments forpotential confounding variables were carried out as indicated above. Analyses stratified by T2D werealso undertaken.
2.4.2. Interaction Analysis between the TCF7L2-rs7903146 Polymorphism and Obesity in DeterminingT2D Incidence
This analysis was carried out in non-T2D subjects at baseline. We used Cox regression modelswith the length of follow-up as the primary time variable. Follow-up time was calculated from thedate of enrollment to the date of diagnosis of T2D for cases, and to the date of the last visit or theend of the follow-up period (30 June 2012 for non-cases), or the date at death, whichever came first.Hazard ratios (HR) with 95% CI for the TCF7L2-rs7903146 genotypes (three categories), stratified byobesity were computed. Afterwards, C-allele carriers were grouped together and compared withC-carriers (recessive model). Multivariable Cox regression models with main effects and interactionterms were computed. In multivariable Model 1 (basic model) we adjusted for sex, age, center,and intervention group. In multivariable Model 2 additional adjustments were undertaken aspreviously described. Stratified analyses by obesity were carried out. In addition, Kaplan–Meiersurvival curves (one minus the cumulative T2D free survival) were plotted to estimate the probabilityof remaining free of T2D during follow-up depending on the TCF7L2 genotype and obesity status.
2.4.3. Predictive Value Calculations for the TCF72-rs7903146 Polymorphism on T2D Incidence andPrevalence in the Whole PREDIMED Participants
To estimate the predictive ability of the genetic models depending on the obesity status, we usedtwo approaches: (a) In non-T2D subjects, we estimated its sensitivity, specificity, positive predictivevalue (PPV), negative predictive value (NPV) for two categories (recessive model) in predicting T2Dincidence taking into account obesity status; (b) At baseline, we estimated the area under the receiveroperating characteristic curve (AUC) [19] of the TCF7L2-rs7903146 (as 0, 1 and 2) to predict T2D

Nutrients 2016, 8, 793 6 of 18
prevalence depending on obesity status (we selected the recessive and additive models for T2Dincidence and prevalence prediction based on the observed association results).
2.4.4. Construction of Obesity-Specific GRS with the TCF7L2 and Other T2D-SNPs; Association andEvaluation of the PV for T2D Prevalence
Taking into account the obesity-specific association of the TCF7L2 polymorphism with T2D,our secondary aim was to extend this analysis to more T2D SNPs. This was considered a pilotstudy as we only have genotype data from one of the PREDIMED field centers (PREDIMED-Valenciaparticipants with complete data; n = 1000 participants; 46% T2D prevalence). These SNPs wereselected from the list of 49 SNPs associated with T2D that were used in the EPIC-InterAct studyfor the multi-SNP GRS construction and T2D association [16]. From the list of the 49 T2D-SNP,in addition to the TCF7L2-SNP, we selected those included in our genotyping array (n = 27) andspecifically tested the association between the corresponding SNP and T2D by obesity status. ThoseSNPs showing suggestive heterogeneity in the associations in our population were included in theobesity-specific GRS analyses (PRC1-rs12899811, ZFAND6-rs11634397, CDC123_CAMK1D-rs11257655,KCNQ1-rs163184, ADYC5-rs6798189, IGF2BP2-rs4402960, SLC30A8-rs3802177, KLHDC5-rs10842994,and HMGA2-rs2261181). For some of these SNPs (in the ZFAND6, ADYC5, IGF2BP2, SLC30A8,KLHDC5, and HMGA2 genes), statistically significant or borderline significant interactions withBMI (or with waist circumference) in determining T2D were reported in the EPIC-InterAct study(p = 0.055, p < 0.01; p = 0.034; p = 0.099; p = 0.10, respectively) [16]. However, the authors did notconstruct obesity-specific GRS. Depending on the results obtained in the stratified analysis, SNPs weregrouped in two obesity-specific GRS. One GRS included five T2D-SNPs more associated with T2Din obese subjects (obGRS); and the other GRS included five T2D-SNPs more associated with T2D innon-obese subjects (nobGRS). nobGRS: TCF7L2-rs7903146, PRC1-rs12899811, ZFAND6-rs11634397,CDC123_CAMK1D-rs11257655 and KCNQ1-rs163184; obGRS: ADYC5-rs6798189, IGF2BP2-rs4402960,SLC30A8-rs3802177, KLHDC5-rs10842994 and HMGA2-rs2261181. SNPs in these GRS were consideredas additive (0, 1, or 2 risk alleles). Multivariable logistic regression models with prevalent T2D asdependent variable and the obesity-specific GRS (as continuous) as independent variables, adjusted forage, sex, and obesity were fitted for the total and for obese and non-obese subjects; OR and 95% CIwere calculated to estimate the association between the GRS and T2D.
Finally; the AUC of the two GRS predicting T2D at baseline in the PREDIMED-Valencia subsampleby obesity status (obesity-specific GRS) in the whole population and in obese and non-obese subjectswere calculated.
2.4.5. Longitudinal Association and Interaction Analysis between the TCF7L2-rs7903146Polymorphism and T2D in Determining BMI
The longitudinal influence of the TCF7L2-rs7903146 polymorphism and T2D on BMI was analyzedby multivariable-ANCOVA of repeated measures including those subjects having complete dataat baseline, 1, 2, 3, and 4 years (first four-year period) and at baseline, 1, 2, 3, 4, 5, and 6 years(second six-year period).
2.4.6. Power Calculations
Sample size in the PREDIMED study (n = 7447 participants) was estimated taking into accountthe expected incidence of the primary outcome (incidence of cardiovascular diseases) and thedifferences in the effects of the dietary interventions to be detected among groups [30]. In thepresent study, we focused on T2D prevalence and T2D incidence in PREDIMED participants withthe TCF7L2-rs7903146 data available (n = 7018). At baseline our study (including n = 3607 non-T2Dand n = 3411 T2D subjects), had a large statistical power (>80%) to detect associations (OR >1.2) atalpha = 5% between the TCF7L2 polymorphism and T2D prevalence in obese and non-obese subjects.Taking into account the similar sample size of T2D and non-T2D subjects at baseline, as well as the %

Nutrients 2016, 8, 793 7 of 18
of obese and non-obese subjects, our study has the strong advantage of having comparable statisticalpower to detect a similar association in both groups. Therefore, the lack of association between theTCF7L2-rs7903146 polymorphism and T2D risk in the stratified analyses in obese or non-obese subjectsis not due to the lack of power in one of the groups. At baseline, our sample size was adequatelypowered (power >80%) to detect statistically significant TCF7L2-obesity interactions (at alpha <5%) indetermining T2D prevalence (>40%) at an interaction effect of OR for interaction >1.21 (co-dominantmodel). Similar estimations in sample size and effects were computed for the interaction between theTC7L2 polymorphism and T2D in determining obesity risk. For continuous variables our sample sizeat baseline was adequately powered (power >80%) to detect statistically significant interactions andassociations in the effect strata. In the longitudinal analysis, taking into account that the number ofincident cases of T2D was small (n = 312) and that only non-T2D subjects at baseline were considered(n = 3607), the power to detect statistically significant interactions and association was lower thanin the baseline analysis. Therefore, at alpha = 5% and beta = 20%, our sample size was adequatelypowered (>80%) to detected interaction effects (recessive model) of HR >1.75. Statistical analyses wereperformed with the IBM SPSS Statistics version 22, NY. All tests were two-tailed and p values < 0.05were considered statistically significant.
3. Results
Table 1 shows the characteristics of the studied population (n = 7018 subjects) as a whole anddepending on the T2D status at baseline.
Table 1. Demographic, clinical, lifestyle, and genetic characteristics of the study participants at baselineaccording to the diabetes status.
Total (n = 7018) Non-Diabetic Subjects (n = 3607) T2D Subjects (n = 3411) p
Age (years) 67.0 ±6.2 66.6 ±6.1 67.4 ±6.3 <0.001Weight (Kg) 76.8 ±11.9 76.7 ±11.7 76.9 ±12.2 0.476
BMI (Kg/m2) 30.0 ±3.8 30.1 ±3.7 29.9 ±4.0 0.042Waist circumference (cm) 100.4 ±10.6 99.7 ±10.6 101.2 ±10.5 <0.001
Body fat (%) 39.3 ±7.4 39.9 ±7.2 38.7 ±7.7 <0.001Female sex: n, % 4025 (57.4) 2232 (61.9) 1793 (52.6) <0.001
Current smokers: n, % 989 (14.1) 581 (16.1) 408 (12.0) <0.001TCF7L2-rs7903146: n, % <0.001
CC 2770 (39.5) 1612 (44.7) 1158 (33.9)CT 3249 (46.3) 1569 (43.5) 1680 (49.3)TT 999 (14.2) 426 (11.8) 573 (16.8)
Intervention groups: n, % 0.059MedDiet + EVOO 2411 (34.4) 1204 (33.4) 1207 (35.4)MedDiet + nuts 2316 (33.0) 1235 (34.2) 1081 (31.7)Control group 2291 (32.6) 1168 (32.4) 1123 (32.9)
Energy intake (kcal/day) 2276 ±607 2322 ±603 2228 ±607 <0.001Total fat (% energy) 39.2 ±6.8 38.5 ±6.5 39.9 ±7.0 <0.001
Saturated fat (% energy) 10.0 ±2.3 9.7 ±2.2 10.2 ±2.3 <0.001MUFA (% energy) 19.5 ±4.6 19.2 ±4.3 19.7 ±4.8 <0.001
Carbohydrates (% energy) 41.9 ±7.2 42.8 ±6.9 40.9 ±7.3 <0.001Adherence to the MedDiet 8.7 ±2.0 8.7 ±2.0 8.6 ±2.0 0.003
Alcohol consumption (g/day) 8.4 ±14.2 9.1 ±14.8 7.6 ±13.5 <0.001Physical activity (MET.min/day) 231.6 ±240.4 225.5 ±226.8 238.0 ±253.8 0.030
SBP (mm·Hg) 149.3 ±20.8 149.0 ±20.6 149.7 ±21.0 0.187DBP (mm·Hg) 83.4 ±11.0 84.5 ±11.0 82.2 ±10.9 <0.001
Total cholesterol (mg/dL) 211.0 ±39.4 220.0 ±39.8 201.4 ±36.6 <0.001LDL-C (mg/dL) 130.3 ±35.1 137.9 ±36.2 122.1 ±31.8 <0.001HDL-C (mg/dL) 53.8 ±14.1 55.8 ±14.6 51.7 ±13.2 <0.001
Triglycerides (mg/dL) 137.4 ±79.7 132.6 ±73.9 142.4 ±85.2 <0.001Fasting glucose (mg/dL) 122.2 ±41.6 98.2 ±16.4 147.4 ±45.1 <0.001
Values are mean ± SD for continuous variables and number (%) for categorical variables. T2D indicates Type 2diabetes. BMI indicates body mass index, MUFA, Monounsaturated fatty acids; MedDiet, Mediterranean diet;EVOO, extra virgin olive oil, SPB: Systolic blood pressure, DBP: Diastolic blood pressure. p: p-value for thecomparisons (means or %) between non-diabetic and type 2 diabetic subjects.

Nutrients 2016, 8, 793 8 of 18
3.1. Interaction between the TCF7L2-rs7903146 Polymorphism and Obesity in Determining T2D at Baseline
Even though the TCF7L2-rs7903146 polymorphism was significantly associated with a higher T2Dprevalence in the whole population (p = 3.1 × 10⁻²¹), this association was of greater magnitude (OR:2.26; 95% CI: 1.84–2.78 for TT compared to CC homozygotes; p = 1.6 × 10⁻¹⁴) in non-obese (n = 3739)than in obese (n = 3279) subjects (OR: 1.51; 95% CI: 1.22–1.92 for TT compared to CC homozygotes;p = 0.0002) even after multivariable adjustment (Table 2).
Table 2. Association between the TCF7L2-rs7903146 polymorphism and prevalence of T2D dependingon the obesity status at baseline. Stratified logistic regression analysis.
Non-Obese p 3 for Interaction Obese
n OR 95% CI p-Value Genotype × Obesity n OR 95% CI p-Value
Model 1 1
TCF7L2 0.002CC 1424 1.00 (reference) 1346 1.00 (reference)CT 1742 1.79 (1.55–2.08) 5.5 × 10⁻¹⁵ 1507 1.28 (1.10–1.49) 0.0012TT 573 2.32 (1.90–2.85) 5.4 × 10⁻¹⁶ 426 1.51 (1.21–1.89) 0.0003
p 4: 2.5 × 10⁻²⁰ p 4: 0.0002
Model 2 2
TCF7L2CC 1.00 (reference) 1.00 (reference)CT 1.78 (1.54–2.09) 1.4 × 10⁻¹⁴ 0.003 1.27 (1.09–1.48) 0.0020TT 2.26 (1.84–2.78) 1.6 × 10⁻¹⁴ 1.53 (1.22–1.92) 0.0002
p 4: 4.3 × 10⁻¹⁹ p 4: 0.000171 Model 1: adjusted for sex, age, and field center; 2 Model 2: adjusted for sex, age, field center, total energy intake,adherence to the Mediterranean diet, alcohol intake, smoking, physical activity, dyslipidemia, and hypertension;3 p-value obtained for the interaction term between the TCF7L2 genotype and obesity in the correspondingmultivariable logistic regression model; 4 p-value obtained for the global TCF7L2 polymorphism in themultivariable logistic regression model.
3.2. Interaction between the TCF7L2-rs7903146 Polymorphism and T2D in Determining Obesity-RelatedMeasures at Baseline
At baseline, the T2D risk allele was significantly associated with lower averages for BMI, body fat,waist-to-height ratio, and lower prevalence of obesity (BMI ≥30 kg/m2) (Supplementary MaterialsTable S1). However, we detected a strong heterogeneity in these associations depending on T2Dstatus. Figure 1 shows these interactive effects on BMI (A) and % body fat (B), the TCF7L2-rs7903146polymorphism being inversely associated with these traits only in T2D subjects (p-interactions < 0.05).Likewise, the inverse association between the TCF7L2-rs7903146 polymorphism and obesity at baseline(Table 3) was statistically significant in T2D (p = 0.0002) but not in non-T2D subjects (p = 0.737).Accordingly, the multivariable adjusted OR for obesity in TT subjects compared to CC individuals was0.63; 95% CI 0.51–0.78; p = 1.63 × 10⁻⁵ in T2D, showing a reduced risk, and no association (0.93; 95%CI: 0.74–1.16; p = 0.493) in non-diabetic subjects.
Nutrients 2016, 8, 793 8 of 18
3.1. Interaction between the TCF7L2‐rs7903146 Polymorphism and Obesity in Determining T2D at Baseline
Even though the TCF7L2‐rs7903146 polymorphism was significantly associated with a higher
T2D prevalence in the whole population (p = 3.1 × 10⁻²¹), this association was of greater magnitude
(OR: 2.26; 95% CI: 1.84–2.78 for TT compared to CC homozygotes; p = 1.6 × 10⁻¹⁴) in non‐obese (n =
3739) than in obese (n = 3279) subjects (OR: 1.51; 95% CI: 1.22–1.92 for TT compared to CC
homozygotes; p = 0.0002) even after multivariable adjustment (Table 2).
Table 2. Association between the TCF7L2‐rs7903146 polymorphism and prevalence of T2D
depending on the obesity status at baseline. Stratified logistic regression analysis.
Non‐Obese p 3 for Interaction Obese
n OR 95% CI p‐Value Genotype × Obesity n OR 95% CI p‐Value
Model 1 1
TCF7L2 0.002
CC 1424 1.00 (reference) 1346 1.00 (reference)
CT 1742 1.79 (1.55–2.08) 5.5 × 10⁻¹⁵ 1507 1.28 (1.10–1.49) 0.0012
TT 573 2.32 (1.90–2.85) 5.4 × 10⁻¹⁶ 426 1.51 (1.21–1.89) 0.0003
p 4: 2.5 × 10⁻²⁰ p 4: 0.0002
Model 2 2
TCF7L2
CC 1.00 (reference) 1.00 (reference)
CT 1.78 (1.54–2.09) 1.4 × 10⁻¹⁴ 0.003 1.27 (1.09–1.48) 0.0020
TT 2.26 (1.84–2.78) 1.6 × 10⁻¹⁴ 1.53 (1.22–1.92) 0.0002
p 4: 4.3 × 10⁻¹⁹ p 4: 0.00017
1 Model 1: adjusted for sex, age, and field center; 2 Model 2: adjusted for sex, age, field center, total
energy intake, adherence to the Mediterranean diet, alcohol intake, smoking, physical activity,
dyslipidemia, and hypertension; 3 p‐value obtained for the interaction term between the TCF7L2
genotype and obesity in the corresponding multivariable logistic regression model; 4 p‐value
obtained for the global TCF7L2 polymorphism in the multivariable logistic regression model.
3.2. Interaction between the TCF7L2‐rs7903146 Polymorphism and T2D in Determining Obesity‐Related
Measures at Baseline
At baseline, the T2D risk allele was significantly associated with lower averages for BMI, body
fat, waist‐to‐height ratio, and lower prevalence of obesity (BMI ≥ 30 kg/m2) (Supplementary
Materials Table S1). However, we detected a strong heterogeneity in these associations depending
on T2D status. Figure 1 shows these interactive effects on BMI (A) and % body fat (B), the
TCF7L2‐rs7903146 polymorphism being inversely associated with these traits only in T2D subjects
(p‐interactions < 0.05). Likewise, the inverse association between the TCF7L2‐rs7903146
polymorphism and obesity at baseline (Table 3) was statistically significant in T2D (p = 0.0002) but
not in non‐T2D subjects (p = 0.737). Accordingly, the multivariable adjusted OR for obesity in TT
subjects compared to CC individuals was 0.63; 95% CI 0.51–0.78; p = 1.63 × 10⁻⁵ in T2D, showing a
reduced risk, and no association (0.93; 95% CI: 0.74–1.16; p = 0.493) in non‐diabetic subjects.
(a)
Figure 1. Cont.

Nutrients 2016, 8, 793 9 of 18Nutrients 2016, 8, 793 9 of 18
(b)
Figure 1. Adjusted means of BMI (a) and % body fat (b) at baseline depending on the
TCF7L2‐rs7903146 polymorphism and T2D diabetes status (n = in 7018 PREDIMED participants at
baseline. Means were adjusted for age, sex, center, total energy intake, physical activity, smoking,
drinking, adherence to the Mediterranean diet, dyslipidemia, and hypertension. The p‐values for the
interaction terms were obtained in the corresponding multivariable adjusted models. p 1 and p 2
values were obtained for the multivariable comparison of means between depending on the T2D
strata in non‐diabetic (n = 3607) subjects and T2D (n = 3411) subjects, respectively. Error bars: SE of
means.
Table 3. Association between the TCF7L2‐rs7903146 polymorphism and obesity depending on T2D
status. Stratified logistic regression analysis.
Non‐Diabetic p 3 for Interaction T2D Subjects
n OR 95% CI p‐Value Genotype × T2D n OR 95% CI p‐Value
Model 1 1
TCF7L2 0.008
CC 1612 1.00 (reference) 1158 1.00 (reference)
CT 1569 1.05 (0.91–1.20) 0.544 1680 0.78 (0.67–0.91) 0.001
TT 426 0.96 (0.77–1.19) 0.694 573 0.64 (0.52–0.78) 2.0 × 10⁻⁵
p 4: 0.685 p 4: 3.90 × 10⁻⁵
Model 2 2
TCF7L2
CC 1.00 (reference) 1.00 (reference)
CT 1.05 (0.91–1.21) 0.529 0.014 0.77 (0.66–0.90) 0.001
TT 0.93 (0.74–1.16) 0.493 0.63 (0.51–0.78) 1.6 × 10⁻⁵
p 4: 0.528 p 4: 3.02 × 10⁻⁵
1 Model 1: adjusted for sex, age, and field center; 2 Model 2: adjusted for sex, age, field center, total
energy intake, adherence to the Mediterranean diet, alcohol intake, smoking, physical activity,
dyslipidemia, and hypertension; 3 p‐value obtained for the interaction term between the TCF7L2
genotype and type‐2 diabetes in the corresponding multivariable logistic regression model; 4 p‐value
obtained for the global TCF7L2 polymorphism in the multivariable logistic regression model.
3.3. Interaction between the TCF7L2‐rs7903146 Polymorphism and Obesity in the Incidence of T2D
We analyzed the interaction between the TCF7L2‐rs7903146 polymorphism and obesity status in
determining the incidence of T2D in non‐diabetic subjects (n = 3607) over the extended follow‐up period
(with median 5.7 years) (Table 4). We observed that the association between the TCF7L2‐rs7903146 and
T2D incidence only was statistically significant in obese subjects (p = 0.035 in the basic model and p =
0.045 in the additionally adjusted model). Thus, we observer a significantly stronger association in
non‐obese (HR: 1.81; 95% CI: 1.13–2.92, p = 0.013 for TT versus CC) than in obese individuals (HR: 1.01;
95% CI: 0.61–1.66; p = 0.979); p‐interaction = 0.048. A recessive effect was found in agreement with results
obtained in previous studies [20]. Figure 2 shows T2D‐free survival Kaplan–Meier curves in non‐obese
(A) and obese subjects (B). Taking into account that a recessive effect was noted, homozygous subjects
for the risk allele (TT) were also compared with C‐allele carriers.
Figure 1. Adjusted means of BMI (a) and % body fat (b) at baseline depending on the TCF7L2-rs7903146polymorphism and T2D diabetes status (n = in 7018 PREDIMED participants at baseline. Means wereadjusted for age, sex, center, total energy intake, physical activity, smoking, drinking, adherence tothe Mediterranean diet, dyslipidemia, and hypertension. The p-values for the interaction terms wereobtained in the corresponding multivariable adjusted models. p 1 and p 2 values were obtained for themultivariable comparison of means between depending on the T2D strata in non-diabetic (n = 3607)subjects and T2D (n = 3411) subjects, respectively. Error bars: SE of means.
Table 3. Association between the TCF7L2-rs7903146 polymorphism and obesity depending on T2Dstatus. Stratified logistic regression analysis.
Non-Diabetic p 3 for Interaction T2D Subjects
n OR 95% CI p-Value Genotype × T2D n OR 95% CI p-Value
Model 1 1
TCF7L2 0.008CC 1612 1.00 (reference) 1158 1.00 (reference)CT 1569 1.05 (0.91–1.20) 0.544 1680 0.78 (0.67–0.91) 0.001TT 426 0.96 (0.77–1.19) 0.694 573 0.64 (0.52–0.78) 2.0 × 10⁻⁵
p 4: 0.685 p 4: 3.90 × 10⁻⁵
Model 2 2
TCF7L2CC 1.00 (reference) 1.00 (reference)CT 1.05 (0.91–1.21) 0.529 0.014 0.77 (0.66–0.90) 0.001TT 0.93 (0.74–1.16) 0.493 0.63 (0.51–0.78) 1.6 × 10⁻⁵
p 4: 0.528 p 4: 3.02 × 10⁻⁵
1 Model 1: adjusted for sex, age, and field center; 2 Model 2: adjusted for sex, age, field center, totalenergy intake, adherence to the Mediterranean diet, alcohol intake, smoking, physical activity, dyslipidemia,and hypertension; 3 p-value obtained for the interaction term between the TCF7L2 genotype and type-2diabetes in the corresponding multivariable logistic regression model; 4 p-value obtained for the global TCF7L2polymorphism in the multivariable logistic regression model.
3.3. Interaction between the TCF7L2-rs7903146 Polymorphism and Obesity in the Incidence of T2D
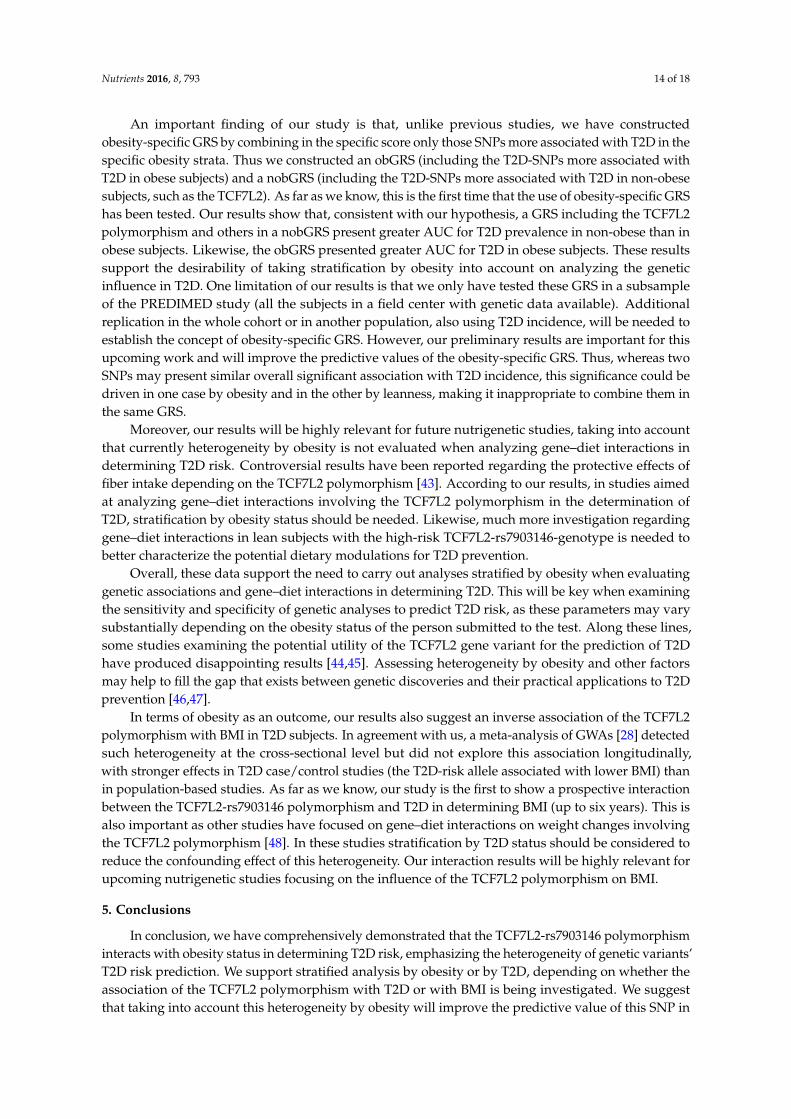
We analyzed the interaction between the TCF7L2-rs7903146 polymorphism and obesity status indetermining the incidence of T2D in non-diabetic subjects (n = 3607) over the extended follow-up period(with median 5.7 years) (Table 4). We observed that the association between the TCF7L2-rs7903146and T2D incidence only was statistically significant in obese subjects (p = 0.035 in the basic model andp = 0.045 in the additionally adjusted model). Thus, we observer a significantly stronger association innon-obese (HR: 1.81; 95% CI: 1.13–2.92, p = 0.013 for TT versus CC) than in obese individuals (HR: 1.01;95% CI: 0.61–1.66; p = 0.979); p-interaction = 0.048. A recessive effect was found in agreement withresults obtained in previous studies [20]. Figure 2 shows T2D-free survival Kaplan–Meier curves innon-obese (A) and obese subjects (B). Taking into account that a recessive effect was noted, homozygoussubjects for the risk allele (TT) were also compared with C-allele carriers.

Nutrients 2016, 8, 793 10 of 18
Furthermore, we estimated the influence of obesity status on T2D incidence over the5.7-year median follow-up period in this population in the whole sample and depending on theTCF7L2-rs7903146 polymorphism. Although for the whole population of T2D-free subjects at baselineobesity was significantly associated with higher TD2 risk (HR: 1.44; 95% CI: 1.14–1.82; p = 0.002),this association was heterogeneous in the different genotypes (Supplementary Materials Figure S1).Thus, in CC subjects, obesity was strongly associated with T2D incidence (HR: 1.75; 95% CI: 1.22–2.51;p = 0.002 in obese compared with non-obese). This significant association decreased in CT subjects(HR: 1.45; 95% CI: 102–2.07; p = 0.041 in obese versus non-obese subjects). No significant associationbetween obesity status and T2D incidence was found in subjects with the TT genotype (HR: 0.79; 95%CI: 0.43–1.46; p = 0.454).
Table 4. Incidence and hazard ratios (HR) for T2D depending on the TCF7L2-rs7903146 polymorphismand stratified by obesity after 5.7 years of median follow-up.
Obese Subjects 1 (n = 1693)
Cases Non-Cases Person-Years IncidenceRate 4
Model 1 2 Model 2 3
HR 95% CI p-Value HR 95% CI p-Value
TCF7L2genotypes 0.960 0.965
CC 73 677 4117.5 17.7 1.00 (reference) 1.00 (reference)CT 79 669 4203.8 18.8 1.04 (0.76–1.44) 0.777 1.05 (0.76–1.46) 0.750TT 21 174 1094.0 19.2 1.01 (0.62–1.65) 0.957 1.01 (0.61–1.66) 0.979
Non-Obese Subjects (n = 1904)
Model 1 2 Model 2 3
TCF7L2genotypes 0.035 0.045
CC 56 803 4819.0 11.6 1.00 (reference) 1.00 (reference)CT 57 758 4661.8 12.2 1.08 (0.75–1.57) 0.671 1.14 (0.79–1.66) 0.531TT 26 204 1285.7 20.2 1.82 (1.14–2.92) 0.012 1.81 (1.13–2.92) 0.013
1 Obesity: BMI ≥30 kg/m2; 2 Model 1: Adjusted for sex, age, field center, and dietary intervention group;3 Model 2: Adjusted for variables in model 1 plus total energy intake, adherence to the Mediterranean diet,alcohol intake, smoking, physical activity, dyslipidemia, and hypertension at baseline; 4 Crude incidence ratesare expressed per 1000 person-years of follow-up.
Nutrients 2016, 8, x FOR PEER REVIEW 10 of 18
Table 4. Incidence and hazard ratios (HR) for T2D depending on the TCF7L2-rs7903146 polymorphism and stratified by obesity after 5.7 years of median follow-up.
Obese Subjects 1 (n = 1693)
Cases Non-Cases Person-Years Incidence Rate 4
Model 1 2 Model 2 3 HR 95% CI p-Value HR 95% CI p-Value
TCF7L2 genotypes 0.960 0.965
CC 73 677 4117.5 17.7 1.00 (reference) 1.00 (reference) CT 79 669 4203.8 18.8 1.04 (0.76–1.44) 0.777 1.05 (0.76–1.46) 0.750 TT 21 174 1094.0 19.2 1.01 (0.62–1.65) 0.957 1.01 (0.61–1.66) 0.979
Non-Obese Subjects (n = 1904)Model 1 2 Model 2 3
TCF7L2 genotypes
0.035
0.045
CC 56 803 4819.0 11.6 1.00 (reference) 1.00 (reference) CT 57 758 4661.8 12.2 1.08 (0.75–1.57) 0.671 1.14 (0.79–1.66) 0.531 TT 26 204 1285.7 20.2 1.82 (1.14–2.92) 0.012 1.81 (1.13–2.92) 0.013 1 Obesity: BMI ≥30 kg/m2; 2 Model 1: Adjusted for sex, age, field center, and dietary intervention group; 3 Model 2: Adjusted for variables in model 1 plus total energy intake, adherence to the Mediterranean diet, alcohol intake, smoking, physical activity, dyslipidemia, and hypertension at baseline; 4 Crude incidence rates are expressed per 1000 person-years of follow-up.
(a) (b)
Figure 2. One minus the cumulative T2D-free survival by TCF7L2-rs7903146 genotypes in non-diabetic subjects at baseline (n = 3607) depending of the obesity status: non-obese subjects (a) and obese subjects (b). Cox regression models with outcome of T2D incidence by the TCF7L2-rs7903146 polymorphism (CC, CT and TT) were adjusted for sex, age, center, intervention group, alcohol, smoking, total energy intake and adherence to the Mediterranean diet, physical activity, smoking, drinking, dyslipidemia, and hypertension at baseline. HR and 95% CI were obtained in the multivariable adjusted model. The p-values for the TCF7L2 polymorphism and for the corresponding genotypes (TT versus CC or TT versus C-carriers) were obtained in the multivariable adjusted models.
3.4. Predictive ability of the TCF7L2-rs7903146 on T2D Incidence and Prevalence Depending on Obesity Status
Supplementary Materials Table S2 shows the sensitivity, specificity, PPV, and NPV for the TCF7L2-SNP (as recessive according to the observed association effect) on predicting T2D incidence in non-TD2 PREDIMED participants. Significantly better parameters were obtained in non-obese subjects (p = 0.03) than in obese subjects (p = 0.787).
Likewise, in the ROC analysis, the AUC for the TCF7L2 SNP (additive model) for T2D prevalence in PREDIMED participants was higher in non-obese (AUC: 0.58; p = 1.37 × 10⁻¹⁷) than in obese subjects (AUC: 0.53; p = 1.4 × 10⁻⁴) (Supplementary Materials Figure S2).
Figure 2. One minus the cumulative T2D-free survival by TCF7L2-rs7903146 genotypes in non-diabeticsubjects at baseline (n = 3607) depending of the obesity status: non-obese subjects (a) and obesesubjects (b). Cox regression models with outcome of T2D incidence by the TCF7L2-rs7903146polymorphism (CC, CT and TT) were adjusted for sex, age, center, intervention group, alcohol, smoking,total energy intake and adherence to the Mediterranean diet, physical activity, smoking, drinking,dyslipidemia, and hypertension at baseline. HR and 95% CI were obtained in the multivariable adjustedmodel. The p-values for the TCF7L2 polymorphism and for the corresponding genotypes (TT versusCC or TT versus C-carriers) were obtained in the multivariable adjusted models.

Nutrients 2016, 8, 793 11 of 18
3.4. Predictive Ability of the TCF7L2-rs7903146 on T2D Incidence and Prevalence Depending onObesity Status
Supplementary Materials Table S2 shows the sensitivity, specificity, PPV, and NPV for theTCF7L2-SNP (as recessive according to the observed association effect) on predicting T2D incidence innon-TD2 PREDIMED participants. Significantly better parameters were obtained in non-obese subjects(p = 0.03) than in obese subjects (p = 0.787).
Likewise, in the ROC analysis, the AUC for the TCF7L2 SNP (additive model) for T2D prevalencein PREDIMED participants was higher in non-obese (AUC: 0.58; p = 1.37 × 10⁻¹⁷) than in obesesubjects (AUC: 0.53; p = 1.4 × 10⁻⁴) (Supplementary Materials Figure S2).
3.5. Obesity Specific-GRS Construction, Association with T2D Prevalence and Estimations of the PredictiveValue of These GRS in a Subsample of Participants
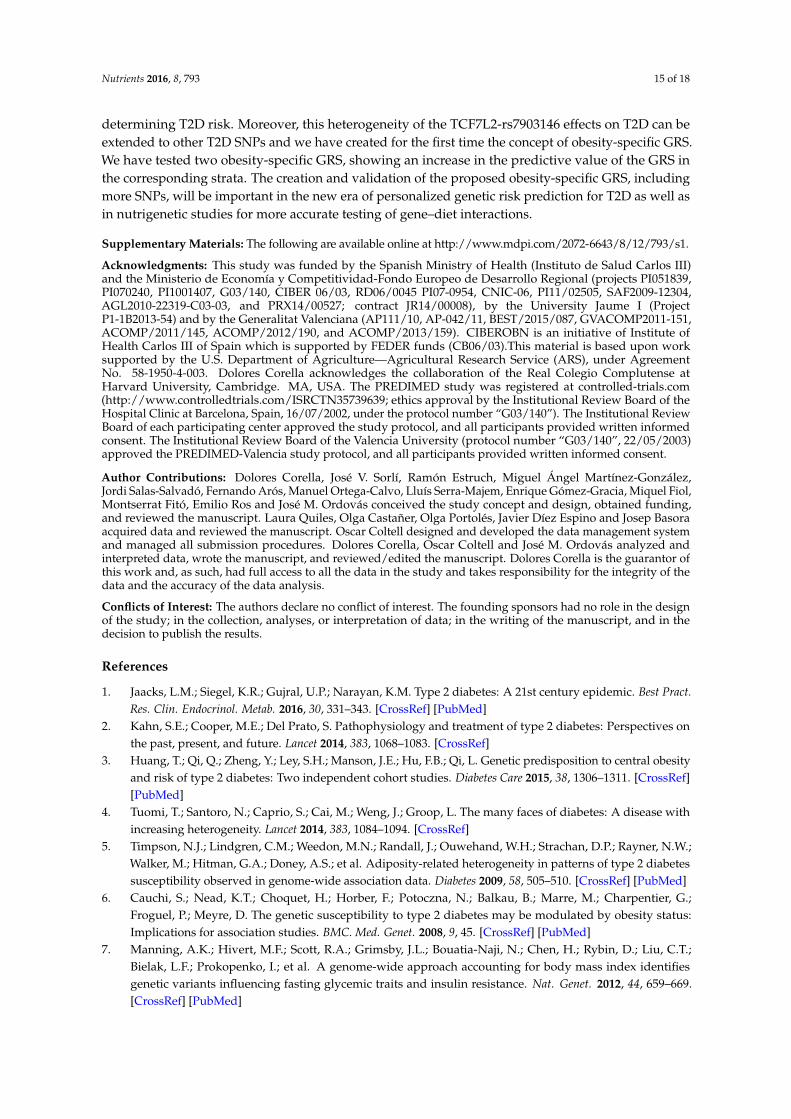
Our secondary aim was to extend the TCF7L2 analysis to more T2D SNPs. This wasconsidered a pilot study as we only have genotype data from one of the PREDIMED fieldcenters (n = 1000 PREDIMED-Valencia participants with complete data). In addition to theTCF7L2-rs7903146 SNP, we selected nine T2D-SNPs from the list of the 49 SNPs included inthe T2D-GRS used in the EPIC-Interact Study [16] (see statistical analysis for the SNP selection)and tested their association with T2D prevalence by obesity strata in our sample. Those SNPsshowing significant (or near significance) associations in one of the obesity strata were selectedfor combination in the corresponding obesity-specific GRS (nobGRS and obGRS). Five SNPs ineach score were combined (nobGRS: TCF7L2-rs7903146, PRC1-rs12899811, ZFAND6-rs11634397,CDC123_CAMK1D-rs11257655 and KCNQ1-rs163184; obGRS: ADYC5-rs6798189, IGF2BP2-rs4402960,SLC30A8-rs3802177, KLHDC5-rs10842994, and HMGA2-rs2261181 as indicated in methods).Supplementary Materials Figure S3 shows frequency distribution of nobGRS (A) and obGRS (B)in the whole sample (n = 1000). First, we tested the association of these obesity-specific GRS withT2D prevalence in obese and non-obese subjects (Supplementary Materials Table S3). As expected,the nobGRS was significantly associated with T2D in non-obese subjects (p = 0.006). No significantassociation was found for the nobGRS in obese subjects (p = 0.535). Likewise, the obGRS wassignificantly associated with T2D in obese subjects (p < 0.001), and not associated in non-obesesubjects (p = 0.130). We also estimated the predictive value for these obesity-specific GRS for T2D inthe whole sample (Supplementary Materials Figure S4) and by obesity strata (Figure 3). When weconsider the obesity-specific GRS in their specific strata, we observed that the nobGRS had greater andsignificantly AUC in non-obese (AUC: 0.581; p = 0.002) than in obese subjects (AUC: 0.522; p = 0.384).Likewise, the obGRS had higher AUC in obese (0.591; p = 0.004) than in non-obese subjects (0.531;p = 0.239), thus supporting our hypothesis.
Nutrients 2016, 8, 793 11 of 18
3.4. Predictive Ability of the TCF7L2‐rs7903146 on T2D Incidence and Prevalence Depending on Obesity
Status
Supplementary Materials Table S2 shows the sensitivity, specificity, PPV, and NPV for the
TCF7L2‐SNP (as recessive according to the observed association effect) on predicting T2D incidence
in non‐TD2 PREDIMED participants. Significantly better parameters were obtained in non‐obese
subjects (p = 0.03) than in obese subjects (p = 0.787).
Likewise, in the ROC analysis, the AUC for the TCF7L2 SNP (additive model) for T2D
prevalence in PREDIMED participants was higher in non‐obese (AUC: 0.58; p = 1.37 × 10⁻¹⁷) than in
obese subjects (AUC: 0.53; p = 1.4 × 10⁻⁴) (Supplementary Materials Figure S2).
3.5. Obesity Specific‐GRS Construction, Association with T2D Prevalence and Estimations of the Predictive
Value of These GRS in a Subsample of Participants
Our secondary aim was to extend the TCF7L2 analysis to more T2D SNPs. This was considered
a pilot study as we only have genotype data from one of the PREDIMED field centers (n = 1000
PREDIMED‐Valencia participants with complete data). In addition to the TCF7L2‐rs7903146 SNP,
we selected nine T2D‐SNPs from the list of the 49 SNPs included in the T2D‐GRS used in the
EPIC‐Interact Study [16] (see statistical analysis for the SNP selection) and tested their association
with T2D prevalence by obesity strata in our sample. Those SNPs showing significant (or near
significance) associations in one of the obesity strata were selected for combination in the
corresponding obesity‐specific GRS (nobGRS and obGRS). Five SNPs in each score were combined
(nobGRS: TCF7L2‐rs7903146, PRC1‐rs12899811, ZFAND6‐rs11634397,
CDC123_CAMK1D‐rs11257655 and KCNQ1‐rs163184; obGRS: ADYC5‐rs6798189,
IGF2BP2‐rs4402960, SLC30A8‐rs3802177, KLHDC5‐rs10842994, and HMGA2‐rs2261181 as indicated
in methods). Supplementary Materials Figure S3 shows frequency distribution of nobGRS (A) and
obGRS (B) in the whole sample (n = 1000). First, we tested the association of these obesity‐specific
GRS with T2D prevalence in obese and non‐obese subjects (Supplementary Materials Table S3). As
expected, the nobGRS was significantly associated with T2D in non‐obese subjects (p = 0.006). No
significant association was found for the nobGRS in obese subjects (p = 0.535). Likewise, the obGRS
was significantly associated with T2D in obese subjects (p < 0.001), and not associated in non‐obese
subjects (p = 0.130). We also estimated the predictive value for these obesity‐specific GRS for T2D in
the whole sample (Supplementary Materials Figure S4) and by obesity strata (Figure 3). When we
consider the obesity‐specific GRS in their specific strata, we observed that the nobGRS had greater
and significantly AUC in non‐obese (AUC: 0.581; p = 0.002) than in obese subjects (AUC: 0.522; p =
0.384). Likewise, the obGRS had higher AUC in obese (0.591; p = 0.004) than in non‐obese subjects
(0.531; p = 0.239), thus supporting our hypothesis.
(a) (b)
Figure 3. Cont.

Nutrients 2016, 8, 793 12 of 18
Nutrients 2016, 8, 793 12 of 18
(c) (d)
Figure 3. Receiver operating curves (ROC) of the two Genetic Risk Scores (GRS) [One including
T2D‐SNPs more associated in obese subjects (obGRS); and the other including T2D‐SNPs more
associated in non‐obese subjects (nobGRS)] to predict T2D (prevalent) at baseline in the
PREDIMED‐Valencia participants (n = 1000): (a) nobGRS in non‐obese subjects; (b) nobGRS in obese
subjects; (c) obGRS in non‐obese subjects; (d) obGRS in obese subjects. Areas under the curves (AUC)
and p‐values are indicated. The straight line represents the ROC expected by chance only. n = 493
non‐obese and n = 507 obese with genotype data for all the SNPs included in the GRS were analyzed.
Five SNPs were included in each unweighted additive (risk allele) GRS as follows: nobGRS:
TCF7L2‐rs7903146, PRC1‐rs12899811, ZFAND6‐rs11634397, CDC123‐CAMK1D‐rs11257655 and
KCNQ1‐rs163184; obGRS: ADYC5‐rs6798189, IGF2BP2‐rs4402960, SLC30A8‐rs3802177,
KLHDC5‐rs10842994, and HMGA2‐rs2261181.
3.6. Longitudinal Interaction between the TCF7L2‐rs7903146 Polymorphism and T2D in BMI
At baseline, we have observed a shared interactive effect between the FCF7L2‐rs7903146
polymorphism and T2D in determining BMI. Here we tested whether this shared interactive effect is
also observed longitudinally. We analyzed two periods based on the inclusion of a larger number of
participants (at four‐year follow‐up, with 3141 participants) or on a longer follow‐up period (at
six‐year follow‐up, with 1750 participants). Figure 4 shows the association between the TCF7L2‐SNP
and BMI longitudinally for every year of the four‐year follow‐up period. We observed a significant
heterogeneity (p‐interaction: 0.041) in non‐diabetic (A) and in T2D (B) subjects. In T2D subjects the
association between the SNP and lower BMI was detected yearly (p‐for the average inter‐subjects
effects: 0.02), whereas in non‐diabetic subjects no significant association with BMI was observed
over the follow‐up period (p: 0.975). The later analysis, including participants with six years of
follow‐up, confirmed these results (Supplementary Materials Figure S5).
(a) (b)
Figure 3. Receiver operating curves (ROC) of the two Genetic Risk Scores (GRS) [Oneincluding T2D-SNPs more associated in obese subjects (obGRS); and the other including T2D-SNPsmore associated in non-obese subjects (nobGRS)] to predict T2D (prevalent) at baseline in thePREDIMED-Valencia participants (n = 1000): (a) nobGRS in non-obese subjects; (b) nobGRSin obese subjects; (c) obGRS in non-obese subjects; (d) obGRS in obese subjects. Areas underthe curves (AUC) and p-values are indicated. The straight line represents the ROC expectedby chance only. n = 493 non-obese and n = 507 obese with genotype data for all the SNPsincluded in the GRS were analyzed. Five SNPs were included in each unweighted additive(risk allele) GRS as follows: nobGRS: TCF7L2-rs7903146, PRC1-rs12899811, ZFAND6-rs11634397,CDC123-CAMK1D-rs11257655 and KCNQ1-rs163184; obGRS: ADYC5-rs6798189, IGF2BP2-rs4402960,SLC30A8-rs3802177, KLHDC5-rs10842994, and HMGA2-rs2261181.
Nutrients 2016, 8, 793 12 of 18
(c) (d)
Figure 3. Receiver operating curves (ROC) of the two Genetic Risk Scores (GRS) [One including
T2D‐SNPs more associated in obese subjects (obGRS); and the other including T2D‐SNPs more
associated in non‐obese subjects (nobGRS)] to predict T2D (prevalent) at baseline in the
PREDIMED‐Valencia participants (n = 1000): (a) nobGRS in non‐obese subjects; (b) nobGRS in obese
subjects; (c) obGRS in non‐obese subjects; (d) obGRS in obese subjects. Areas under the curves (AUC)
and p‐values are indicated. The straight line represents the ROC expected by chance only. n = 493
non‐obese and n = 507 obese with genotype data for all the SNPs included in the GRS were analyzed.
Five SNPs were included in each unweighted additive (risk allele) GRS as follows: nobGRS:
TCF7L2‐rs7903146, PRC1‐rs12899811, ZFAND6‐rs11634397, CDC123‐CAMK1D‐rs11257655 and
KCNQ1‐rs163184; obGRS: ADYC5‐rs6798189, IGF2BP2‐rs4402960, SLC30A8‐rs3802177,
KLHDC5‐rs10842994, and HMGA2‐rs2261181.
3.6. Longitudinal Interaction between the TCF7L2‐rs7903146 Polymorphism and T2D in BMI
At baseline, we have observed a shared interactive effect between the FCF7L2‐rs7903146
polymorphism and T2D in determining BMI. Here we tested whether this shared interactive effect is
also observed longitudinally. We analyzed two periods based on the inclusion of a larger number of
participants (at four‐year follow‐up, with 3141 participants) or on a longer follow‐up period (at
six‐year follow‐up, with 1750 participants). Figure 4 shows the association between the TCF7L2‐SNP
and BMI longitudinally for every year of the four‐year follow‐up period. We observed a significant
heterogeneity (p‐interaction: 0.041) in non‐diabetic (A) and in T2D (B) subjects. In T2D subjects the
association between the SNP and lower BMI was detected yearly (p‐for the average inter‐subjects
effects: 0.02), whereas in non‐diabetic subjects no significant association with BMI was observed
over the follow‐up period (p: 0.975). The later analysis, including participants with six years of
follow‐up, confirmed these results (Supplementary Materials Figure S5).
(a) (b)
Figure 4. Longitudinal effect of the TCF7L2-rs7903146 polymorphism on BMI over a 4-year follow-upperiod in n = 3141 subjects depending on T2D status: (a) non-diabetic; (b) T2D subjects. Adjustedmeans BMI depending on the polymorphism (co-dominant model) and T2D at baseline and 1, 2, 3 and4 years of follow-up in all subjects having data for all the five measurements were estimated from arepeated-measures ANOVA model with interaction terms adjusted for dietary intervention (MedDietversus control), sex, age, center, BMI, adherence to the Mediterranean diet (AdMedDiet), smoking,drinking, and physical activity at baseline. Adjusted p values for the overall effect of the polymorphismand for the interaction among the polymorphism and T2D, were obtained in the multivariable model.
3.6. Longitudinal Interaction between the TCF7L2-rs7903146 Polymorphism and T2D in BMI
At baseline, we have observed a shared interactive effect between the FCF7L2-rs7903146polymorphism and T2D in determining BMI. Here we tested whether this shared interactive effect isalso observed longitudinally. We analyzed two periods based on the inclusion of a larger number ofparticipants (at four-year follow-up, with 3141 participants) or on a longer follow-up period (at six-yearfollow-up, with 1750 participants). Figure 4 shows the association between the TCF7L2-SNP andBMI longitudinally for every year of the four-year follow-up period. We observed a significant

Nutrients 2016, 8, 793 13 of 18
heterogeneity (p-interaction: 0.041) in non-diabetic (A) and in T2D (B) subjects. In T2D subjects theassociation between the SNP and lower BMI was detected yearly (p-for the average inter-subjectseffects: 0.02), whereas in non-diabetic subjects no significant association with BMI was observed overthe follow-up period (p: 0.975). The later analysis, including participants with six years of follow-up,confirmed these results (Supplementary Materials Figure S5).
4. Discussion
Combining longitudinal and cross-sectional analyses in a well-characterized population [30],we have obtained new epidemiological evidence to unravel the complex relationship between theTCF7L2-rs7903146 polymorphism, obesity, and T2D. At the population level, we have obtainedconsistent results showing that, on the one hand, the TCF7L2-rs7903146 polymorphism significantlyinteracts with obesity to determine the prevalence and incidence of T2D, and, on the other, thatT2D interacts with the TCF7L2-rs7903146 in BMI both at baseline and prospectively. As these threevariables are so closely interrelated [1,2] it is very difficult to distinguish cause from effect. Accordingto previous investigations [5,6,8], it seems most plausible that obesity status interacts with the TCF7L2gene, prompting the TT risk genotype to associate itself with a higher incidence of T2D in lean subjects;perhaps the effect we observed of the T-allele being associated with lower obesity risk in T2D subjectsis a secondary observation to the primary one. However, we cannot discard the real influence of theT-allele on body weight. Despite this SNP being one of the strongest common genetic determinant ofT2D yet described [9–11,34], there is still much controversy over the molecular mechanisms involvedin how this genetic variation of TCF7L2 gene leads to altered biological function [35–38].
Although some previous studies [5,6,12–14] have described that the TCF7L2-rs7903146polymorphism was more strongly associated with T2D in non-obese subjects, most of these studieshave been retrospective and prone to potential bias. Only one study has prospectively andspecifically analyzed the interaction between the TCF7L2-rs7903146 SNP and BMI in determiningT2D incidence [15]. However, this study included only men. Thus, our study, including both menand women, is the first prospective report showing that at the population level (analyzing bothmen and women) the TCF7L2 polymorphism is more associated with T2D incidence in non-obesesubjects. Our results support and extend the findings, adding more prospective evidence to theheterogeneity in the association. Recent prospective studies [16–19] have analyzed the interactionbetween genetic variants and BMI on T2D using multi-SNP GRS [39] rather than focusing specificallyon the TCF7L2-SNP (which was only one of the loci in the GRS). In the EPIC-InterAct study [16],where they analyzed the interaction between each of the SNPs of the GRS and BMI on T2D, despite thefact that they found that the global GRS significantly interacted with BMI, these authors did not findany significant interaction of BMI with the TCF7L2 SNP after correction for multiple comparisons.These results may be due to the fact that they undertook multiple comparisons and the statisticalsignificance was set at p < 0.05/343. These results could be considered as a false negative and so clearlyshow the need to continue investigating this interaction in more depth. Several studies have examinedthe effect of other T2D-SNPs integrated in GRSs, among them that from Talmud et al. [19], includingseven prospective studies and using a T2D 65-SNP GRS. They showed heterogeneity on the effects ofthe GRS by BMI in determining T2D (the 65-SNP GRS being associated with higher T2D incidencein leaner individuals). Talmud et al. [19] also evaluated the predictive value of the GRS and showedheterogeneity by BMI [19]. In our study, we have found better results for the TCF7L2-rs7903146 inpredicting T2D in non-obese than in obese subjects. In addition to the TCF7L2, other genes [8,40,41]could be associated with higher T2D risk in non-obese individuals. Moreover a recent study carried outin Chinese subjects [42] investigated the association between a 25-SNP GRS (global and by SNP) andT2D prevalence in obese and non-obese subjects separately, concluding that some SNP were stronglyassociated with T2D in non-obese subjects, whereas others were specific for obese subjects. However,the authors did not construct obesity-specific GRS.
Nutrients 2016, 8, 793 14 of 18
An important finding of our study is that, unlike previous studies, we have constructedobesity-specific GRS by combining in the specific score only those SNPs more associated with T2D in thespecific obesity strata. Thus we constructed an obGRS (including the T2D-SNPs more associated withT2D in obese subjects) and a nobGRS (including the T2D-SNPs more associated with T2D in non-obesesubjects, such as the TCF7L2). As far as we know, this is the first time that the use of obesity-specific GRShas been tested. Our results show that, consistent with our hypothesis, a GRS including the TCF7L2polymorphism and others in a nobGRS present greater AUC for T2D prevalence in non-obese than inobese subjects. Likewise, the obGRS presented greater AUC for T2D in obese subjects. These resultssupport the desirability of taking stratification by obesity into account on analyzing the geneticinfluence in T2D. One limitation of our results is that we only have tested these GRS in a subsampleof the PREDIMED study (all the subjects in a field center with genetic data available). Additionalreplication in the whole cohort or in another population, also using T2D incidence, will be needed toestablish the concept of obesity-specific GRS. However, our preliminary results are important for thisupcoming work and will improve the predictive values of the obesity-specific GRS. Thus, whereas twoSNPs may present similar overall significant association with T2D incidence, this significance could bedriven in one case by obesity and in the other by leanness, making it inappropriate to combine them inthe same GRS.
Moreover, our results will be highly relevant for future nutrigenetic studies, taking into accountthat currently heterogeneity by obesity is not evaluated when analyzing gene–diet interactions indetermining T2D risk. Controversial results have been reported regarding the protective effects offiber intake depending on the TCF7L2 polymorphism [43]. According to our results, in studies aimedat analyzing gene–diet interactions involving the TCF7L2 polymorphism in the determination ofT2D, stratification by obesity status should be needed. Likewise, much more investigation regardinggene–diet interactions in lean subjects with the high-risk TCF7L2-rs7903146-genotype is needed tobetter characterize the potential dietary modulations for T2D prevention.
Overall, these data support the need to carry out analyses stratified by obesity when evaluatinggenetic associations and gene–diet interactions in determining T2D. This will be key when examiningthe sensitivity and specificity of genetic analyses to predict T2D risk, as these parameters may varysubstantially depending on the obesity status of the person submitted to the test. Along these lines,some studies examining the potential utility of the TCF7L2 gene variant for the prediction of T2Dhave produced disappointing results [44,45]. Assessing heterogeneity by obesity and other factorsmay help to fill the gap that exists between genetic discoveries and their practical applications to T2Dprevention [46,47].
In terms of obesity as an outcome, our results also suggest an inverse association of the TCF7L2polymorphism with BMI in T2D subjects. In agreement with us, a meta-analysis of GWAs [28] detectedsuch heterogeneity at the cross-sectional level but did not explore this association longitudinally,with stronger effects in T2D case/control studies (the T2D-risk allele associated with lower BMI) thanin population-based studies. As far as we know, our study is the first to show a prospective interactionbetween the TCF7L2-rs7903146 polymorphism and T2D in determining BMI (up to six years). This isalso important as other studies have focused on gene–diet interactions on weight changes involvingthe TCF7L2 polymorphism [48]. In these studies stratification by T2D status should be considered toreduce the confounding effect of this heterogeneity. Our interaction results will be highly relevant forupcoming nutrigenetic studies focusing on the influence of the TCF7L2 polymorphism on BMI.
5. Conclusions
In conclusion, we have comprehensively demonstrated that the TCF7L2-rs7903146 polymorphisminteracts with obesity status in determining T2D risk, emphasizing the heterogeneity of genetic variants’T2D risk prediction. We support stratified analysis by obesity or by T2D, depending on whether theassociation of the TCF7L2 polymorphism with T2D or with BMI is being investigated. We suggestthat taking into account this heterogeneity by obesity will improve the predictive value of this SNP in
Nutrients 2016, 8, 793 15 of 18
determining T2D risk. Moreover, this heterogeneity of the TCF7L2-rs7903146 effects on T2D can beextended to other T2D SNPs and we have created for the first time the concept of obesity-specific GRS.We have tested two obesity-specific GRS, showing an increase in the predictive value of the GRS inthe corresponding strata. The creation and validation of the proposed obesity-specific GRS, includingmore SNPs, will be important in the new era of personalized genetic risk prediction for T2D as well asin nutrigenetic studies for more accurate testing of gene–diet interactions.
Supplementary Materials: The following are available online at http://www.mdpi.com/2072-6643/8/12/793/s1.
Acknowledgments: This study was funded by the Spanish Ministry of Health (Instituto de Salud Carlos III)and the Ministerio de Economía y Competitividad-Fondo Europeo de Desarrollo Regional (projects PI051839,PI070240, PI1001407, G03/140, CIBER 06/03, RD06/0045 PI07-0954, CNIC-06, PI11/02505, SAF2009-12304,AGL2010-22319-C03-03, and PRX14/00527; contract JR14/00008), by the University Jaume I (ProjectP1-1B2013-54) and by the Generalitat Valenciana (AP111/10, AP-042/11, BEST/2015/087, GVACOMP2011-151,ACOMP/2011/145, ACOMP/2012/190, and ACOMP/2013/159). CIBEROBN is an initiative of Institute ofHealth Carlos III of Spain which is supported by FEDER funds (CB06/03).This material is based upon worksupported by the U.S. Department of Agriculture—Agricultural Research Service (ARS), under AgreementNo. 58-1950-4-003. Dolores Corella acknowledges the collaboration of the Real Colegio Complutense atHarvard University, Cambridge. MA, USA. The PREDIMED study was registered at controlled-trials.com(http://www.controlledtrials.com/ISRCTN35739639; ethics approval by the Institutional Review Board of theHospital Clinic at Barcelona, Spain, 16/07/2002, under the protocol number “G03/140”). The Institutional ReviewBoard of each participating center approved the study protocol, and all participants provided written informedconsent. The Institutional Review Board of the Valencia University (protocol number “G03/140”, 22/05/2003)approved the PREDIMED-Valencia study protocol, and all participants provided written informed consent.
Author Contributions: Dolores Corella, José V. Sorlí, Ramón Estruch, Miguel Ángel Martínez-González,Jordi Salas-Salvadó, Fernando Arós, Manuel Ortega-Calvo, Lluís Serra-Majem, Enrique Gómez-Gracia, Miquel Fiol,Montserrat Fitó, Emilio Ros and José M. Ordovás conceived the study concept and design, obtained funding,and reviewed the manuscript. Laura Quiles, Olga Castañer, Olga Portolés, Javier Díez Espino and Josep Basoraacquired data and reviewed the manuscript. Oscar Coltell designed and developed the data management systemand managed all submission procedures. Dolores Corella, Oscar Coltell and José M. Ordovás analyzed andinterpreted data, wrote the manuscript, and reviewed/edited the manuscript. Dolores Corella is the guarantor ofthis work and, as such, had full access to all the data in the study and takes responsibility for the integrity of thedata and the accuracy of the data analysis.
Conflicts of Interest: The authors declare no conflict of interest. The founding sponsors had no role in the designof the study; in the collection, analyses, or interpretation of data; in the writing of the manuscript, and in thedecision to publish the results.
References
1. Jaacks, L.M.; Siegel, K.R.; Gujral, U.P.; Narayan, K.M. Type 2 diabetes: A 21st century epidemic. Best Pract.Res. Clin. Endocrinol. Metab. 2016, 30, 331–343. [CrossRef] [PubMed]
2. Kahn, S.E.; Cooper, M.E.; Del Prato, S. Pathophysiology and treatment of type 2 diabetes: Perspectives onthe past, present, and future. Lancet 2014, 383, 1068–1083. [CrossRef]
3. Huang, T.; Qi, Q.; Zheng, Y.; Ley, S.H.; Manson, J.E.; Hu, F.B.; Qi, L. Genetic predisposition to central obesityand risk of type 2 diabetes: Two independent cohort studies. Diabetes Care 2015, 38, 1306–1311. [CrossRef][PubMed]
4. Tuomi, T.; Santoro, N.; Caprio, S.; Cai, M.; Weng, J.; Groop, L. The many faces of diabetes: A disease withincreasing heterogeneity. Lancet 2014, 383, 1084–1094. [CrossRef]
5. Timpson, N.J.; Lindgren, C.M.; Weedon, M.N.; Randall, J.; Ouwehand, W.H.; Strachan, D.P.; Rayner, N.W.;Walker, M.; Hitman, G.A.; Doney, A.S.; et al. Adiposity-related heterogeneity in patterns of type 2 diabetessusceptibility observed in genome-wide association data. Diabetes 2009, 58, 505–510. [CrossRef] [PubMed]
6. Cauchi, S.; Nead, K.T.; Choquet, H.; Horber, F.; Potoczna, N.; Balkau, B.; Marre, M.; Charpentier, G.;Froguel, P.; Meyre, D. The genetic susceptibility to type 2 diabetes may be modulated by obesity status:Implications for association studies. BMC. Med. Genet. 2008, 9, 45. [CrossRef] [PubMed]
7. Manning, A.K.; Hivert, M.F.; Scott, R.A.; Grimsby, J.L.; Bouatia-Naji, N.; Chen, H.; Rybin, D.; Liu, C.T.;Bielak, L.F.; Prokopenko, I.; et al. A genome-wide approach accounting for body mass index identifiesgenetic variants influencing fasting glycemic traits and insulin resistance. Nat. Genet. 2012, 44, 659–669.[CrossRef] [PubMed]

Nutrients 2016, 8, 793 16 of 18
8. Perry, J.R.; Voight, B.F.; Yengo, L.; Amin, N.; Dupuis, J.; Ganser, M.; Grallert, H.; Navarro, P.; Li, M.; Qi, L.;et al. Stratifying type 2 diabetes cases by BMI identifies genetic risk variants in LAMA1 and enrichment forrisk variants in lean compared to obese cases. PLoS Genet. 2012, 8, e1002741. [CrossRef] [PubMed]
9. Grant, S.F.; Thorleifsson, G.; Reynisdottir, I.; Benediktsson, R.; Manolescu, A.; Sainz, J.; Helgason, A.;Stefansson, H.; Emilsson, V.; Helgadottir, A.; et al. Variant of transcription factor 7-like 2 (TCF7L2) geneconfers risk of type 2 diabetes. Nat. Genet. 2006, 38, 320–323. [CrossRef] [PubMed]
10. Voight, B.F.; Scott, L.J.; Steinthorsdottir, V.; Morris, A.P.; Dina, C.; Welch, R.P.; Zeggini, E.; Huth, C.;Aulchenko, Y.S.; Thorleifsson, G.; et al. Twelve type 2 diabetes susceptibility loci identified throughlarge-scale association analysis. Nat. Genet. 2010, 42, 579–589. [CrossRef] [PubMed]
11. Peng, S.; Zhu, Y.; Lü, B.; Xu, F.; Li, X.; Lai, M. TCF7L2 gene polymorphisms and type 2 diabetes risk:A comprehensive and updated meta-analysis involving 121,174 subjects. Mutagenesis 2013, 28, 25–37.[CrossRef] [PubMed]
12. Bouhaha, R.; Choquet, H.; Meyre, D.; Abid Kamoun, H.; Ennafaa, H.; Baroudi, T.; Sassi, R.; Vaxillaire, M.;Elgaaied, A.; Froguel, P.; et al. TCF7L2 is associated with type 2 diabetes in nonobese individuals fromTunisia. Pathol. Biol. (Paris) 2010, 58, 426–429. [CrossRef] [PubMed]
13. Lukacs, K.; Hosszufalusi, N.; Dinya, E.; Bakacs, M.; Madacsy, L.; Panczel, P. The type 2 diabetes-associatedvariant in TCF7L2 is associated with latent autoimmune diabetes in adult Europeans and the gene effect ismodified by obesity: A meta-analysis and an individual study. Diabetologia 2012, 55, 689–693. [CrossRef][PubMed]
14. Kalnina, I.; Geldnere, K.; Tarasova, L.; Nikitina-Zake, L.; Peculis, R.; Fridmanis, D.; Pirags, V.; Klovins, J.Stronger association of common variants in TCF7L2 gene with nonobese type 2 diabetes in the Latvianpopulation. Exp. Clin. Endocrinol. Diabetes 2012, 120, 466–468. [CrossRef] [PubMed]
15. Salpea, K.D.; Gable, D.R.; Cooper, J.A.; Stephens, J.W.; Hurel, S.J.; Ireland, H.A.; Feher, M.D.; Godsland, I.F.;Humphries, S.E. The effect of WNT5B IVS3C > G on the susceptibility to type 2 diabetes in UK Caucasiansubjects. Nutr. Metab. Cardiovasc. Dis. 2009, 19, 140–145. [CrossRef] [PubMed]
16. Langenberg, C.; Sharp, S.J.; Franks, P.W.; Scott, R.A.; Deloukas, P.; Forouhi, N.G.; Froguel, P.; Groop, L.C.;Hansen, T.; Palla, L.; et al. Gene-lifestyle interaction and type 2 diabetes: The EPIC interact case-cohort study.PLoS Med. 2014, 11, e1001647. [CrossRef] [PubMed]
17. Vassy, J.L.; Hivert, M.F.; Porneala, B.; Dauriz, M.; Florez, J.C.; Dupuis, J.; Siscovick, D.S.; Fornage, M.;Rasmussen-Torvik, L.J.; Bouchard, C.; et al. Polygenic type 2 diabetes prediction at the limit of commonvariant detection. Diabetes 2014, 63, 2172–2182. [CrossRef] [PubMed]
18. Scott, R.A.; Fall, T.; Pasko, D.; Barker, A.; Sharp, S.J.; Arriola, L.; Balkau, B.; Barricarte, A.; Barroso, I.;Boeing, H.; et al. Common genetic variants highlight the role of insulin resistance and body fat distributionin type 2 diabetes, independent of obesity. Diabetes 2014, 63, 4378–4387. [CrossRef] [PubMed]
19. Talmud, P.J.; Cooper, J.A.; Morris, R.W.; Dudbridge, F.; Shah, T.; Engmann, J.; Dale, C.; White, J.; McLachlan, S.;Zabaneh, D.; et al. Sixty-five common genetic variants and prediction of type 2 diabetes. Diabetes 2015, 64,1830–1840. [CrossRef] [PubMed]
20. Florez, J.C.; Jablonski, K.A.; Bayley, N.; Pollin, T.I.; de Bakker, P.I.; Shuldiner, A.R.; Knowler, W.C.;Nathan, D.M.; Altshuler, D. Diabetes Prevention Program Research Group. TCF7L2 polymorphisms andprogression to diabetes in the Diabetes Prevention Program. N. Engl. J. Med. 2006, 355, 241–250. [CrossRef][PubMed]
21. Cauchi, S.; Choquet, H.; Gutiérrez-Aguilar, R.; Capel, F.; Grau, K.; Proença, C.; Dina, C.; Duval, A.; Balkau, B.;Marre, M.; et al. Effects of TCF7L2 polymorphisms on obesity in European populations. Obesity (SilverSpring) 2008, 16, 476–482. [CrossRef] [PubMed]
22. Peter, I.; McCaffery, J.M.; Kelley-Hedgepeth, A.; Hakonarson, H.; Reis, S.; Wagenknecht, L.E.; Kopin, A.S.;Huggins, G.S.; Genetics Subgroup of the Look AHEAD Study. Association of type 2 diabetes susceptibilityloci with one-year weight loss in the look AHEAD clinical trial. Obesity (Silver Spring) 2012, 20, 1675–1682.[CrossRef] [PubMed]
23. Lyssenko, V.; Lupi, R.; Marchetti, P.; Del Guerra, S.; Orho-Melander, M.; Almgren, P.; Sjögren, M.; Ling, C.;Eriksson, K.F.; Lethagen, A.L.; et al. Mechanisms by which common variants in the TCF7L2 gene increaserisk of type 2 diabetes. J. Clin. Investig. 2007, 117, 2155–2163. [CrossRef] [PubMed]

Nutrients 2016, 8, 793 17 of 18
24. Pecioska, S.; Zillikens, M.C.; Henneman, P.; Snijders, P.J.; Oostra, B.A.; van Duijn, C.M.; Aulchenko, Y.S.Association between type 2 diabetes loci and measures of fatness. PLoS ONE 2010, 5, e8541. [CrossRef][PubMed]
25. Stolerman, E.S.; Manning, A.K.; McAteer, J.B.; Fox, C.S.; Dupuis, J.; Meigs, J.B.; Florez, J.C. TCF7L2 variantsare associated with increased proinsulin/insulin ratios but not obesity traits in the Framingham Heart Study.Diabetologia 2009, 52, 614–620. [CrossRef] [PubMed]
26. Gupta, V.; Vinay, D.G.; Sovio, U.; Rafiq, S.; Kranthi Kumar, M.V.; Janipalli, C.S.; Evans, D.; Mani, K.R.;Sandeep, M.N.; Taylor, A.; et al. Association study of 25 type 2 diabetes related Loci with measures of obesityin Indian sib pairs. PLoS ONE 2013, 8, e53944. [CrossRef] [PubMed]
27. Helgason, A.; Pálsson, S.; Thorleifsson, G.; Grant, S.F.; Emilsson, V.; Gunnarsdottir, S.; Adeyemo, A.; Chen, Y.;Chen, G.; Reynisdottir, I.; et al. Refining the impact of TCF7L2 gene variants on type 2 diabetes and adaptiveevolution. Nat. Genet. 2007, 39, 218–225. [CrossRef] [PubMed]
28. Locke, A.E.; Kahali, B.; Berndt, S.I.; Justice, A.E.; Pers, T.H.; Day, F.R.; Powell, C.; Vedantam, S.;Buchkovich, M.L.; Yang, J.; et al. Genetic studies of body mass index yield new insights for obesitybiology. Nature 2015, 518, 197–206. [CrossRef] [PubMed]
29. Martínez-González, M.A.; Corella, D.; Salas-Salvadó, J.; Ros, E.; Covas, M.I.; Fiol, M.; Wärnberg, J.; Arós, F.;Ruíz-Gutiérrez, V.; Lamuela-Raventós, R.M.; et al. Cohort profile: Design and methods of the PREDIMEDstudy. Int. J. Epidemiol. 2012, 41, 377–385. [CrossRef] [PubMed]
30. Estruch, R.; Ros, E.; Salas-Salvadó, J.; Covas, M.I.; Corella, D.; Arós, F.; Gómez-Gracia, E.; Ruiz-Gutiérrez, V.;Fiol, M.; Lapetra, J.; et al. Primary prevention of cardiovascular disease with a Mediterranean diet. N. Engl.J. Med. 2013, 368, 1279–1290. [CrossRef] [PubMed]
31. Gómez-Ambrosi, J.; Silva, C.; Catalán, V.; Rodríguez, A.; Galofré, J.C.; Escalada, J.; Valentí, V.; Rotellar, F.;Romero, S.; Ramírez, B.; et al. Clinical usefulness of a new equation for estimating body fat. Diabetes Care2012, 35, 383–388. [CrossRef] [PubMed]
32. Salas-Salvadó, J.; Bulló, M.; Estruch, R.; Ros, E.; Covas, M.I.; Ibarrola-Jurado, N.; Corella, D.; Arós, F.;Gómez-Gracia, E.; Ruiz-Gutiérrez, V.; et al. Prevention of diabetes with Mediterranean diets: A subgroupanalysis of a randomized trial. Ann. Intern. Med. 2014, 160, 1–10. [CrossRef] [PubMed]
33. Corella, D.; Carrasco, P.; Sorlí, J.V.; Estruch, R.; Rico-Sanz, J.; Martínez-González, M.Á.; Salas-Salvadó, J.;Covas, M.I.; Coltell, O.; Arós, F.; et al. Mediterranean diet reduces the adverse effect of the TCF7L2-rs7903146polymorphism on cardiovascular risk factors and stroke incidence: A randomized controlled trial in ahigh-cardiovascular-risk population. Diabetes Care 2013, 36, 3803–3811. [CrossRef] [PubMed]
34. Florez, J.C. Leveraging genetics to advance type 2 diabetes prevention. PLoS Med. 2016, 13, e1002102.[CrossRef] [PubMed]
35. Xia, Q.; Chesi, A.; Manduchi, E.; Johnston, B.T.; Lu, S.; Leonard, M.E.; Parlin, U.W.; Rappaport, E.F.; Huang, P.;Wells, A.D.; et al. The type 2 diabetes presumed causal variant within TCF7L2 resides in an element thatcontrols the expression of ACSL5. Diabetologia 2016, 59, 2360–2368. [CrossRef] [PubMed]
36. Zhou, Y.; Park, S.Y.; Su, J.; Bailey, K.; Ottosson-Laakso, E.; Shcherbina, L.; Oskolkov, N.; Zhang, E.;Thevenin, T.; Fadista, J.; et al. TCF7L2 is a master regulator of insulin production and processing.Hum. Mol. Genet. 2014, 23, 6419–6431. [CrossRef] [PubMed]
37. Mitchell, R.K.; Mondragon, A.; Chen, L.; Mcginty, J.A.; French, P.M.; Ferrer, J.; Thorens, B.; Hodson, D.J.;Rutter, G.A.; Da Silva Xavier, G. Selective disruption of TCF7L2 in the pancreatic β cell impairs secretoryfunction and lowers β cell mass. Hum. Mol. Genet. 2015, 24, 1390–1399. [CrossRef] [PubMed]
38. Dimas, A.S.; Lagou, V.; Barker, A.; Knowles, J.W.; Mägi, R.; Hivert, M.F.; Benazzo, A.; Rybin, D.; Jackson, A.U.;Stringham, H.M.; et al. Impact of type 2 diabetes susceptibility variants on quantitative glycemic traitsreveals mechanistic heterogeneity. Diabetes 2014, 63, 2158–2171. [CrossRef] [PubMed]
39. Bailey, K.A.; Savic, D.; Zielinski, M.; Park, S.Y.; Wang, L.J.; Witkowski, P.; Brady, M.; Hara, M.; Bell, G.I.;Nobrega, M.A. Evidence of non-pancreatic beta cell-dependent roles of TCF7L2 in the regulation of glucosemetabolism in mice. Hum. Mol. Genet. 2015, 24, 1646–1654. [CrossRef] [PubMed]
40. Läll, K.; Mägi, R.; Morris, A.; Metspalu, A.; Fischer, K. Personalized risk prediction for type 2 diabetes:The potential of genetic risk scores. Genet. Med. 2016. [CrossRef] [PubMed]

Nutrients 2016, 8, 793 18 of 18
41. Gamboa-Meléndez, M.A.; Huerta-Chagoya, A.; Moreno-Macías, H.; Vázquez-Cárdenas, P.;Ordóñez-Sánchez, M.L.; Rodríguez-Guillén, R.; Riba, L.; Rodríguez-Torres, M.; Guerra-García, M.T.;Guillén-Pineda, L.E.; et al. Contribution of common genetic variation to the risk of type 2 diabetes in theMexican Mestizo population. Diabetes 2012, 61, 3314–3321. [CrossRef] [PubMed]
42. Brito, E.C.; Lyssenko, V.; Renström, F.; Berglund, G.; Nilsson, P.M.; Groop, L.; Franks, P.W. Previouslyassociated type 2 diabetes variants may interact with physical activity to modify the risk of impaired glucoseregulation and type 2 diabetes: A study of 16,003 Swedish adults. Diabetes 2009, 58, 1411–1418. [CrossRef][PubMed]
43. Kong, X.; Xing, X.; Hong, J.; Zhang, X.; Yang, W. Genetic variants associated with lean and obese type 2diabetes in a Han Chinese population: A case-control study. Medicine (Baltimore) 2016, 95, e3841. [CrossRef][PubMed]
44. Palomaki, G.E.; Melillo, S.; Marrone, M.; Douglas, M.P. Use of genomic panels to determine risk of developingtype 2 diabetes in the general population: A targeted evidence-based review. Genet. Med. 2013, 15, 600–601.[CrossRef] [PubMed]
45. Evaluation of Genomic Applications in Practice and Prevention (EGAPP) Working Group. Recommendationsfrom the EGAPP Working Group: Does genomic profiling to assess type 2 diabetes risk improve healthoutcomes? Genet. Med. 2013, 15, 612–617.
46. Fox, C.S.; Hall, J.L.; Arnett, D.K.; Ashley, E.A.; Delles, C.; Engler, M.B.; Freeman, M.W.; Johnson, J.A.;Lanfear, D.E.; Liggett, S.B.; et al. Future translational applications from the contemporary genomics era:A scientific statement from the American Heart Association. Circulation 2015, 131, 1715–1736. [CrossRef][PubMed]
47. Keating, B.J. Advances in risk prediction of type 2 diabetes: Integrating genetic scores with Framingham riskmodels. Diabetes 2015, 64, 1495–1497. [CrossRef] [PubMed]
48. Roswall, N.; Ängquist, L.; Ahluwalia, T.S.; Romaguera, D.; Larsen, S.C.; Østergaard, J.N.; Halkjaer, J.;Vimaleswaran, K.S.; Wareham, N.J.; Bendinelli, B.; et al. Association between Mediterranean and Nordic dietscores and changes in weight and waist circumference: Influence of FTO and TCF7L2 loci. Am. J. Clin. Nutr.2014, 100, 1188–1197. [CrossRef] [PubMed]
© 2016 by the authors; licensee MDPI, Basel, Switzerland. This article is an open accessarticle distributed under the terms and conditions of the Creative Commons Attribution(CC-BY) license (http://creativecommons.org/licenses/by/4.0/).