
Polymer Semantic Segmentation with Hyperspectral Imaging ...
13
Polymer Semantic Segmentation with Hyperspectral Imaging and Artificial Neural Networks NHL Stenden Centre of Expertise in Computer Vision & Data Science Tianyi Liu Supervisors: Klaas Dijkstra, Dijkstra Willem Abstract—Since the 1950s, plastics have played an essential role in the world, and more than 8.3 billion tones of plastics have been produced. This number keeps increasing every year. Bio-polymers become a solution to the problem that non-degradable plastics are still used to produce frequently-used plastics products. How to sort them becomes a problem. A sorting solution neural network structure called GenNet has already developed by combine hyperspectral images with a neural network. This project is focusing on integrating a new neural network backbone to the GenNet which has already been able to learn and classify normal polymers such as PET, PEF, PP, and PE. The neural network backbone decided to integrate, called HRNet+OCR and HRNet. The HRNet+OCR achieved the highest IOU value 84.5% on semantic segmentation of public dataset Cityscapes, and it’s a derivative network from HRNet. Therefore, these two networks are decided to integrate into the GenNet and train and test on a dataset with polymers such as PET, PEF, PP, PE, and bottle made in the same material. The result is that HRNet and HRNet+OCR can not provide better performance than Deep Res U-Net and U-Net++. And the performance of HRNet+OCR will be significantly influenced by choice of the optimizer. By changing optimizer to Adam, HRNet+OCR shows a 46.128% increase on Mean IOU value on the dataset which includes plastics flakes and same material bottles. The HRNet and HRNet+OCR can learn hyperspectral data but may not be the best choice for it. Index Terms—DeepLearning, Plastics Classification, Hyper Spectral Imagery 1 I NTRODUCTION Since the 1950s, plastics have played an essential role in the world, and more than 8.3 billion tones of plastics have been produced. This number keeps increasing every year. Currently, there are still more than 350 million tones of plastics being produced every year, 6.3 billion tones of plastics are plastics waste, and only 9.5% of plastics waste has been recycled[1], but 79% of the waste plastics ended up in landfills or environment. If the demands of plastics keep increasing or unchanged, by 2050, there will be more plastics than fish in the ocean[2]. The reason why a large number of plastics were produced and discarded is that most of the one-time-use products are mainly made from plastics such as packaging, toys, electronics, and bottles. The plastics ended up in the environment will bring significant health risk for the living organism[3], and this risk will finally come back to human due to the fact that micro-plastics has already been found in the human body[4]. Bioplastics become a solution to the problem that non-recyclable plastics are still used to produce frequently-used plastics prod- ucts. Bioplastics are defined as being made from renew- able resources(bio-based), biodegradable resources, or both of them. Examples of bio-based, non-bio-degradable plastics are bio-PE, bio-PP, and bio-PET[5]. Examples of plastics that are both bio-based and bio-degradable are PLA(polylactic acid), PHA(polyhydroxyalkanoate), and PBS(polybutylene succinate). But until these days, bioplastics are still only a tiny part of all plastics products, which only take 0.02 percent of all the plastics products.[6] In 2019, 11 multinationals announced that they would work towards using only reusable, recyclable, or compostable packaging by 2025 or Tianyi Liu is a Mecgatronic Engineering student at the HZ University of Applied Sciences, E-mail: [email protected]. Klaas Dijkstra is a researcher at the NHL Stenden Centre of Expertise in Computer Vision & Data Science, E-mail: [email protected]. Willem Dijkstra is a researcher at the NHL Stenden Centre of Expertise in Computer Vision & Data Science, E-mail: [email protected]. earlier [7]. Due to the increasing interest in bio-plastics, how to sort and recycle different kinds of polymers become important. Because the surface information such as color and shapes are similar for different types of plastics, it is hard to learn and classify different normal polymers for the neural network with only surface information.Therefore, an FX17 hyperspectral imaging camera is used to help with sorting and recognizing the polymers. From previous research, a neural network code structure called GenNet was developed to classify regular plastics by combining the hyperspectral imaging and artificial neural network (ANNs)[8]. The GenNet is a modular which is integrated with four optimizers, two loss functions, a specially made dataloader for hyperspectral data, four preprocessing methods and has a complete process of preporcessing, training, validation ,testing and summarizing. It is more efficient to integrate new neural network into the GenNet rather than integrating components in GenNet such as dataloader and preprocessing methods into other network code structure which is made for classify normal two dimensional images. Therefore, the research questions for this project are: • What neural network can be integrated to the GenNet • What is the performance of this neural network backbone? • What parameters or components will influence the performance of this neural network? 2 STATE OF THE ART For different types of polymers, for example PEF and PET,the sur- face,shape color are quite similar which is hard for neural network to learn and train with. The Hyperspectral imaging can give more information of the material that can not be seen by human eyes and can be used to distinguish difference between different types of polymers. But the Hyperspectral cubes data for different polymers are too complex for analyzing manually cause it contains too much information for every spectrum band it captured. Neural network has the capacity to handle the large amount of data with the help of computer processing power[9]. Therefore, combine Neural Network
Transcript of Polymer Semantic Segmentation with Hyperspectral Imaging ...
Polymer Semantic Segmentation with Hyperspectral Imaging andArtificial Neural Networks
NHL Stenden Centre of Expertise in Computer Vision & Data Science
Tianyi LiuSupervisors: Klaas Dijkstra, Dijkstra Willem
Abstract—Since the 1950s, plastics have played an essential role in the world, and more than 8.3 billion tones of plastics have beenproduced. This number keeps increasing every year. Bio-polymers become a solution to the problem that non-degradable plasticsare still used to produce frequently-used plastics products. How to sort them becomes a problem. A sorting solution neural networkstructure called GenNet has already developed by combine hyperspectral images with a neural network. This project is focusing onintegrating a new neural network backbone to the GenNet which has already been able to learn and classify normal polymers suchas PET, PEF, PP, and PE. The neural network backbone decided to integrate, called HRNet+OCR and HRNet. The HRNet+OCRachieved the highest IOU value 84.5% on semantic segmentation of public dataset Cityscapes, and it’s a derivative network fromHRNet. Therefore, these two networks are decided to integrate into the GenNet and train and test on a dataset with polymers suchas PET, PEF, PP, PE, and bottle made in the same material. The result is that HRNet and HRNet+OCR can not provide betterperformance than Deep Res U-Net and U-Net++. And the performance of HRNet+OCR will be significantly influenced by choice ofthe optimizer. By changing optimizer to Adam, HRNet+OCR shows a 46.128% increase on Mean IOU value on the dataset whichincludes plastics flakes and same material bottles. The HRNet and HRNet+OCR can learn hyperspectral data but may not be thebest choice for it.
Index Terms—DeepLearning, Plastics Classification, Hyper Spectral Imagery
1 INTRODUCTION
Since the 1950s, plastics have played an essential role in the world,and more than 8.3 billion tones of plastics have been produced. Thisnumber keeps increasing every year. Currently, there are still morethan 350 million tones of plastics being produced every year, 6.3billion tones of plastics are plastics waste, and only 9.5% of plasticswaste has been recycled[1], but 79% of the waste plastics ended up inlandfills or environment. If the demands of plastics keep increasingor unchanged, by 2050, there will be more plastics than fish in theocean[2]. The reason why a large number of plastics were producedand discarded is that most of the one-time-use products are mainlymade from plastics such as packaging, toys, electronics, and bottles.The plastics ended up in the environment will bring significant healthrisk for the living organism[3], and this risk will finally come back tohuman due to the fact that micro-plastics has already been found in thehuman body[4].
Bioplastics become a solution to the problem that non-recyclableplastics are still used to produce frequently-used plastics prod-ucts. Bioplastics are defined as being made from renew-able resources(bio-based), biodegradable resources, or both ofthem. Examples of bio-based, non-bio-degradable plastics arebio-PE, bio-PP, and bio-PET[5]. Examples of plastics thatare both bio-based and bio-degradable are PLA(polylactic acid),PHA(polyhydroxyalkanoate), and PBS(polybutylene succinate). Butuntil these days, bioplastics are still only a tiny part of all plasticsproducts, which only take 0.02 percent of all the plastics products.[6]In 2019, 11 multinationals announced that they would work towardsusing only reusable, recyclable, or compostable packaging by 2025 or
Tianyi Liu is a Mecgatronic Engineering student at the HZ University ofApplied Sciences, E-mail: [email protected].
Klaas Dijkstra is a researcher at the NHL Stenden Centre of Expertise inComputer Vision & Data Science, E-mail: [email protected].
Willem Dijkstra is a researcher at the NHL Stenden Centre of Expertise inComputer Vision & Data Science, E-mail:[email protected].
earlier [7].Due to the increasing interest in bio-plastics, how to sort and recycledifferent kinds of polymers become important. Because the surfaceinformation such as color and shapes are similar for different typesof plastics, it is hard to learn and classify different normal polymersfor the neural network with only surface information.Therefore, anFX17 hyperspectral imaging camera is used to help with sorting andrecognizing the polymers.From previous research, a neural network code structure calledGenNet was developed to classify regular plastics by combining thehyperspectral imaging and artificial neural network (ANNs)[8]. TheGenNet is a modular which is integrated with four optimizers, twoloss functions, a specially made dataloader for hyperspectral data, fourpreprocessing methods and has a complete process of preporcessing,training, validation ,testing and summarizing. It is more efficient tointegrate new neural network into the GenNet rather than integratingcomponents in GenNet such as dataloader and preprocessing methodsinto other network code structure which is made for classify normaltwo dimensional images. Therefore, the research questions for thisproject are:
• What neural network can be integrated to the GenNet
• What is the performance of this neural network backbone?
• What parameters or components will influence the performanceof this neural network?
2 STATE OF THE ART
For different types of polymers, for example PEF and PET,the sur-face,shape color are quite similar which is hard for neural networkto learn and train with. The Hyperspectral imaging can give moreinformation of the material that can not be seen by human eyesand can be used to distinguish difference between different types ofpolymers. But the Hyperspectral cubes data for different polymersare too complex for analyzing manually cause it contains too muchinformation for every spectrum band it captured. Neural networkhas the capacity to handle the large amount of data with the help ofcomputer processing power[9]. Therefore, combine Neural Network
with Hyperspectral image become a solution. In this section,the stateof the art of artificial neural networks, hyperspectral imaging andplastic sorting will be discussed.
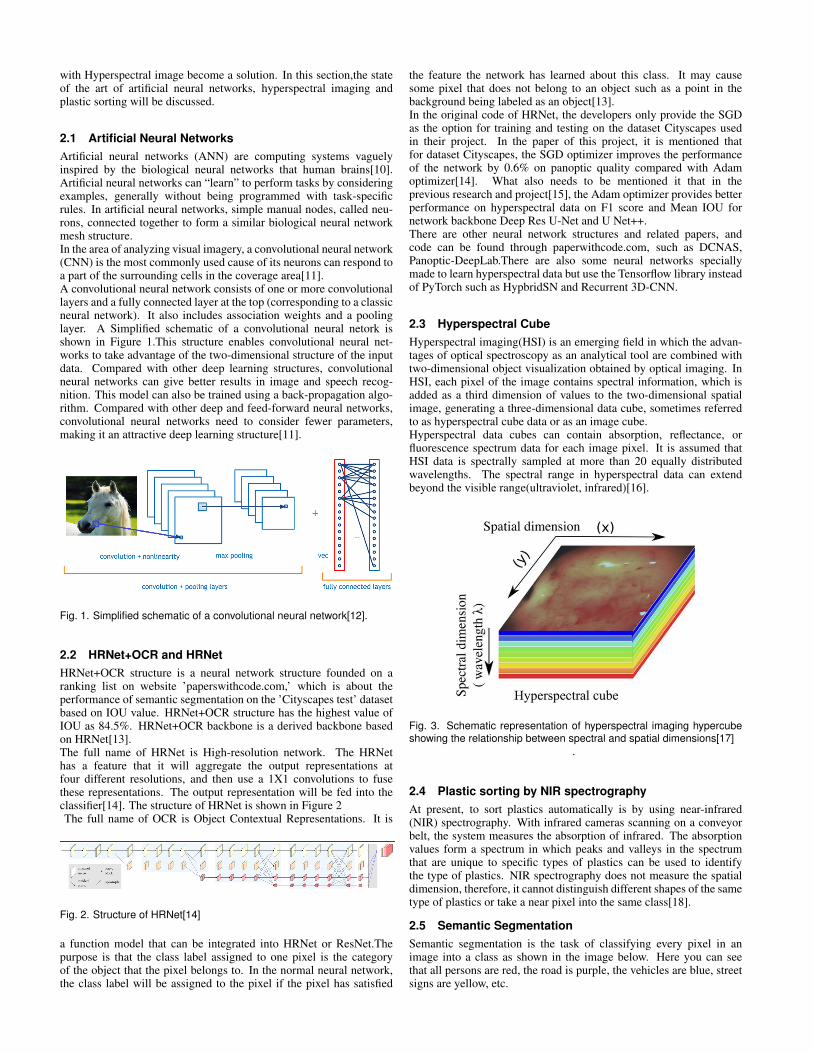
2.1 Artificial Neural NetworksArtificial neural networks (ANN) are computing systems vaguelyinspired by the biological neural networks that human brains[10].Artificial neural networks can “learn” to perform tasks by consideringexamples, generally without being programmed with task-specificrules. In artificial neural networks, simple manual nodes, called neu-rons, connected together to form a similar biological neural networkmesh structure.In the area of analyzing visual imagery, a convolutional neural network(CNN) is the most commonly used cause of its neurons can respond toa part of the surrounding cells in the coverage area[11].A convolutional neural network consists of one or more convolutionallayers and a fully connected layer at the top (corresponding to a classicneural network). It also includes association weights and a poolinglayer. A Simplified schematic of a convolutional neural netork isshown in Figure 1.This structure enables convolutional neural net-works to take advantage of the two-dimensional structure of the inputdata. Compared with other deep learning structures, convolutionalneural networks can give better results in image and speech recog-nition. This model can also be trained using a back-propagation algo-rithm. Compared with other deep and feed-forward neural networks,convolutional neural networks need to consider fewer parameters,making it an attractive deep learning structure[11].
Fig. 1. Simplified schematic of a convolutional neural network[12].
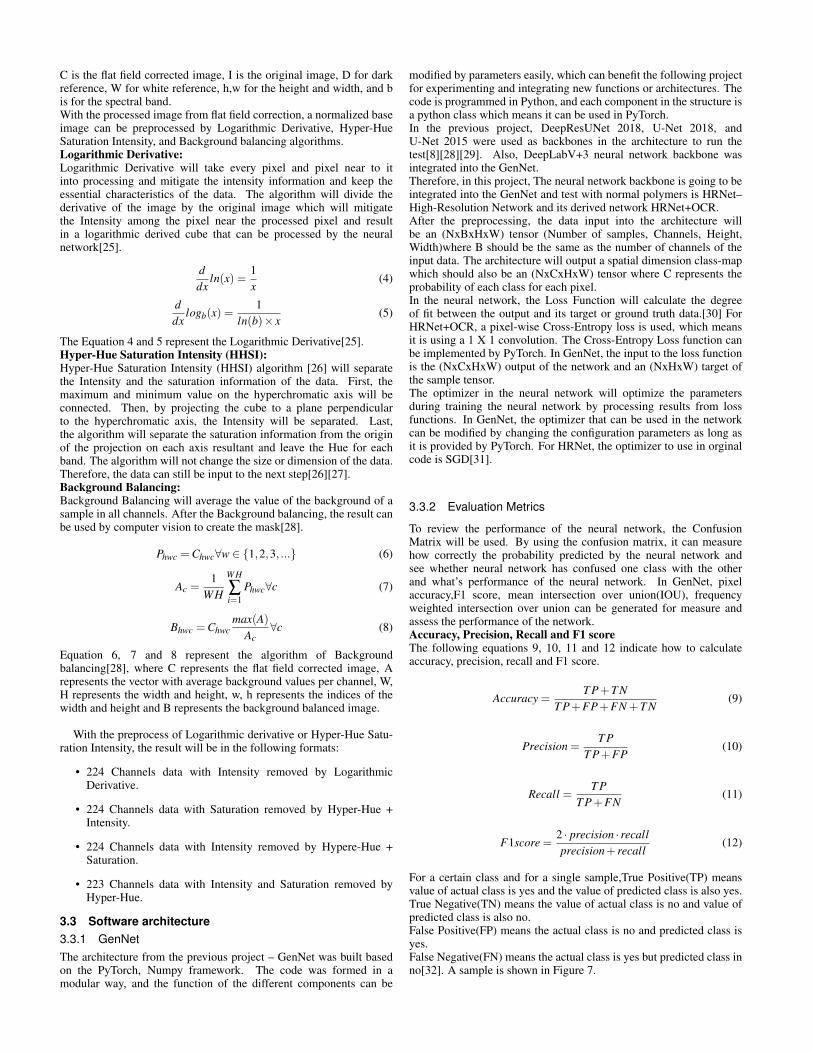
2.2 HRNet+OCR and HRNetHRNet+OCR structure is a neural network structure founded on aranking list on website ’paperswithcode.com,’ which is about theperformance of semantic segmentation on the ’Cityscapes test’ datasetbased on IOU value. HRNet+OCR structure has the highest value ofIOU as 84.5%. HRNet+OCR backbone is a derived backbone basedon HRNet[13].The full name of HRNet is High-resolution network. The HRNethas a feature that it will aggregate the output representations atfour different resolutions, and then use a 1X1 convolutions to fusethese representations. The output representation will be fed into theclassifier[14]. The structure of HRNet is shown in Figure 2The full name of OCR is Object Contextual Representations. It is
Fig. 2. Structure of HRNet[14]
a function model that can be integrated into HRNet or ResNet.Thepurpose is that the class label assigned to one pixel is the categoryof the object that the pixel belongs to. In the normal neural network,the class label will be assigned to the pixel if the pixel has satisfied
the feature the network has learned about this class. It may causesome pixel that does not belong to an object such as a point in thebackground being labeled as an object[13].In the original code of HRNet, the developers only provide the SGDas the option for training and testing on the dataset Cityscapes usedin their project. In the paper of this project, it is mentioned thatfor dataset Cityscapes, the SGD optimizer improves the performanceof the network by 0.6% on panoptic quality compared with Adamoptimizer[14]. What also needs to be mentioned it that in theprevious research and project[15], the Adam optimizer provides betterperformance on hyperspectral data on F1 score and Mean IOU fornetwork backbone Deep Res U-Net and U Net++.There are other neural network structures and related papers, andcode can be found through paperwithcode.com, such as DCNAS,Panoptic-DeepLab.There are also some neural networks speciallymade to learn hyperspectral data but use the Tensorflow library insteadof PyTorch such as HypbridSN and Recurrent 3D-CNN.
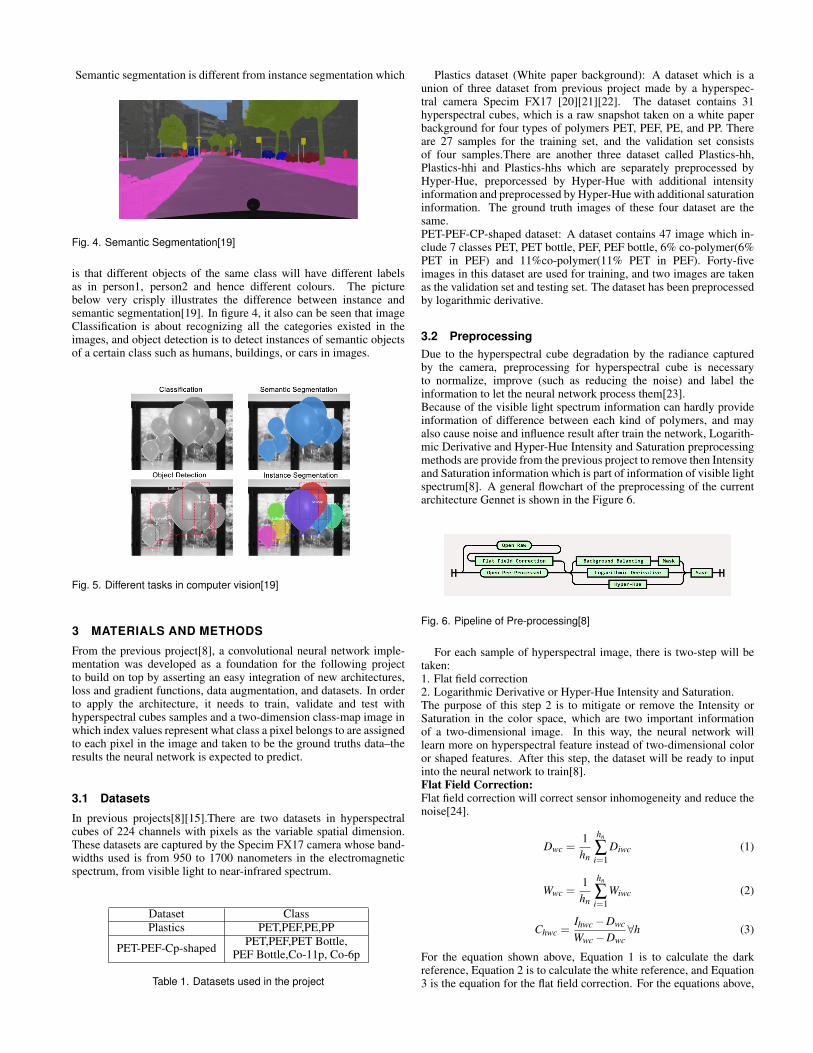
2.3 Hyperspectral CubeHyperspectral imaging(HSI) is an emerging field in which the advan-tages of optical spectroscopy as an analytical tool are combined withtwo-dimensional object visualization obtained by optical imaging. InHSI, each pixel of the image contains spectral information, which isadded as a third dimension of values to the two-dimensional spatialimage, generating a three-dimensional data cube, sometimes referredto as hyperspectral cube data or as an image cube.Hyperspectral data cubes can contain absorption, reflectance, orfluorescence spectrum data for each image pixel. It is assumed thatHSI data is spectrally sampled at more than 20 equally distributedwavelengths. The spectral range in hyperspectral data can extendbeyond the visible range(ultraviolet, infrared)[16].
Fig. 3. Schematic representation of hyperspectral imaging hypercubeshowing the relationship between spectral and spatial dimensions[17]
.
2.4 Plastic sorting by NIR spectrographyAt present, to sort plastics automatically is by using near-infrared(NIR) spectrography. With infrared cameras scanning on a conveyorbelt, the system measures the absorption of infrared. The absorptionvalues form a spectrum in which peaks and valleys in the spectrumthat are unique to specific types of plastics can be used to identifythe type of plastics. NIR spectrography does not measure the spatialdimension, therefore, it cannot distinguish different shapes of the sametype of plastics or take a near pixel into the same class[18].
2.5 Semantic SegmentationSemantic segmentation is the task of classifying every pixel in animage into a class as shown in the image below. Here you can seethat all persons are red, the road is purple, the vehicles are blue, streetsigns are yellow, etc.
Semantic segmentation is different from instance segmentation which
Fig. 4. Semantic Segmentation[19]
is that different objects of the same class will have different labelsas in person1, person2 and hence different colours. The picturebelow very crisply illustrates the difference between instance andsemantic segmentation[19]. In figure 4, it also can be seen that imageClassification is about recognizing all the categories existed in theimages, and object detection is to detect instances of semantic objectsof a certain class such as humans, buildings, or cars in images.
Fig. 5. Different tasks in computer vision[19]
3 MATERIALS AND METHODS
From the previous project[8], a convolutional neural network imple-mentation was developed as a foundation for the following projectto build on top by asserting an easy integration of new architectures,loss and gradient functions, data augmentation, and datasets. In orderto apply the architecture, it needs to train, validate and test withhyperspectral cubes samples and a two-dimension class-map image inwhich index values represent what class a pixel belongs to are assignedto each pixel in the image and taken to be the ground truths data–theresults the neural network is expected to predict.
3.1 Datasets
In previous projects[8][15].There are two datasets in hyperspectralcubes of 224 channels with pixels as the variable spatial dimension.These datasets are captured by the Specim FX17 camera whose band-widths used is from 950 to 1700 nanometers in the electromagneticspectrum, from visible light to near-infrared spectrum.
Dataset ClassPlastics PET,PEF,PE,PP
PET-PEF-Cp-shaped PET,PEF,PET Bottle,PEF Bottle,Co-11p, Co-6p
Table 1. Datasets used in the project
Plastics dataset (White paper background): A dataset which is aunion of three dataset from previous project made by a hyperspec-tral camera Specim FX17 [20][21][22]. The dataset contains 31hyperspectral cubes, which is a raw snapshot taken on a white paperbackground for four types of polymers PET, PEF, PE, and PP. Thereare 27 samples for the training set, and the validation set consistsof four samples.There are another three dataset called Plastics-hh,Plastics-hhi and Plastics-hhs which are separately preprocessed byHyper-Hue, preporcessed by Hyper-Hue with additional intensityinformation and preprocessed by Hyper-Hue with additional saturationinformation. The ground truth images of these four dataset are thesame.PET-PEF-CP-shaped dataset: A dataset contains 47 image which in-clude 7 classes PET, PET bottle, PEF, PEF bottle, 6% co-polymer(6%PET in PEF) and 11%co-polymer(11% PET in PEF). Forty-fiveimages in this dataset are used for training, and two images are takenas the validation set and testing set. The dataset has been preprocessedby logarithmic derivative.
3.2 PreprocessingDue to the hyperspectral cube degradation by the radiance capturedby the camera, preprocessing for hyperspectral cube is necessaryto normalize, improve (such as reducing the noise) and label theinformation to let the neural network process them[23].Because of the visible light spectrum information can hardly provideinformation of difference between each kind of polymers, and mayalso cause noise and influence result after train the network, Logarith-mic Derivative and Hyper-Hue Intensity and Saturation preprocessingmethods are provide from the previous project to remove then Intensityand Saturation information which is part of information of visible lightspectrum[8]. A general flowchart of the preprocessing of the currentarchitecture Gennet is shown in the Figure 6.
Fig. 6. Pipeline of Pre-processing[8]
For each sample of hyperspectral image, there is two-step will betaken:1. Flat field correction2. Logarithmic Derivative or Hyper-Hue Intensity and Saturation.The purpose of this step 2 is to mitigate or remove the Intensity orSaturation in the color space, which are two important informationof a two-dimensional image. In this way, the neural network willlearn more on hyperspectral feature instead of two-dimensional coloror shaped features. After this step, the dataset will be ready to inputinto the neural network to train[8].Flat Field Correction:Flat field correction will correct sensor inhomogeneity and reduce thenoise[24].
Dwc =1hn
hn
∑i=1
Diwc (1)
Wwc =1hn
hn
∑i=1
Wiwc (2)
Chwc =Ihwc−Dwc
Wwc−Dwc∀h (3)
For the equation shown above, Equation 1 is to calculate the darkreference, Equation 2 is to calculate the white reference, and Equation3 is the equation for the flat field correction. For the equations above,
C is the flat field corrected image, I is the original image, D for darkreference, W for white reference, h,w for the height and width, and bis for the spectral band.With the processed image from flat field correction, a normalized baseimage can be preprocessed by Logarithmic Derivative, Hyper-HueSaturation Intensity, and Background balancing algorithms.Logarithmic Derivative:Logarithmic Derivative will take every pixel and pixel near to itinto processing and mitigate the intensity information and keep theessential characteristics of the data. The algorithm will divide thederivative of the image by the original image which will mitigatethe Intensity among the pixel near the processed pixel and resultin a logarithmic derived cube that can be processed by the neuralnetwork[25].
ddx
ln(x) =1x
(4)
ddx
logb(x) =1
ln(b)× x(5)
The Equation 4 and 5 represent the Logarithmic Derivative[25].Hyper-Hue Saturation Intensity (HHSI):Hyper-Hue Saturation Intensity (HHSI) algorithm [26] will separatethe Intensity and the saturation information of the data. First, themaximum and minimum value on the hyperchromatic axis will beconnected. Then, by projecting the cube to a plane perpendicularto the hyperchromatic axis, the Intensity will be separated. Last,the algorithm will separate the saturation information from the originof the projection on each axis resultant and leave the Hue for eachband. The algorithm will not change the size or dimension of the data.Therefore, the data can still be input to the next step[26][27].Background Balancing:Background Balancing will average the value of the background of asample in all channels. After the Background balancing, the result canbe used by computer vision to create the mask[28].
Phwc =Chwc∀w ∈ {1,2,3, ...} (6)
Ac =1
WH
WH
∑i=1
Phwc∀c (7)
Bhwc =Chwcmax(A)
Ac∀c (8)
Equation 6, 7 and 8 represent the algorithm of Backgroundbalancing[28], where C represents the flat field corrected image, Arepresents the vector with average background values per channel, W,H represents the width and height, w, h represents the indices of thewidth and height and B represents the background balanced image.
With the preprocess of Logarithmic derivative or Hyper-Hue Satu-ration Intensity, the result will be in the following formats:
• 224 Channels data with Intensity removed by LogarithmicDerivative.
• 224 Channels data with Saturation removed by Hyper-Hue +Intensity.
• 224 Channels data with Intensity removed by Hypere-Hue +Saturation.
• 223 Channels data with Intensity and Saturation removed byHyper-Hue.
3.3 Software architecture3.3.1 GenNetThe architecture from the previous project – GenNet was built basedon the PyTorch, Numpy framework. The code was formed in amodular way, and the function of the different components can be
modified by parameters easily, which can benefit the following projectfor experimenting and integrating new functions or architectures. Thecode is programmed in Python, and each component in the structure isa python class which means it can be used in PyTorch.In the previous project, DeepResUNet 2018, U-Net 2018, andU-Net 2015 were used as backbones in the architecture to run thetest[8][28][29]. Also, DeepLabV+3 neural network backbone wasintegrated into the GenNet.Therefore, in this project, The neural network backbone is going to beintegrated into the GenNet and test with normal polymers is HRNet–High-Resolution Network and its derived network HRNet+OCR.After the preprocessing, the data input into the architecture willbe an (NxBxHxW) tensor (Number of samples, Channels, Height,Width)where B should be the same as the number of channels of theinput data. The architecture will output a spatial dimension class-mapwhich should also be an (NxCxHxW) tensor where C represents theprobability of each class for each pixel.In the neural network, the Loss Function will calculate the degreeof fit between the output and its target or ground truth data.[30] ForHRNet+OCR, a pixel-wise Cross-Entropy loss is used, which meansit is using a 1 X 1 convolution. The Cross-Entropy Loss function canbe implemented by PyTorch. In GenNet, the input to the loss functionis the (NxCxHxW) output of the network and an (NxHxW) target ofthe sample tensor.The optimizer in the neural network will optimize the parametersduring training the neural network by processing results from lossfunctions. In GenNet, the optimizer that can be used in the networkcan be modified by changing the configuration parameters as long asit is provided by PyTorch. For HRNet, the optimizer to use in orginalcode is SGD[31].
3.3.2 Evaluation Metrics
To review the performance of the neural network, the ConfusionMatrix will be used. By using the confusion matrix, it can measurehow correctly the probability predicted by the neural network andsee whether neural network has confused one class with the otherand what’s performance of the neural network. In GenNet, pixelaccuracy,F1 score, mean intersection over union(IOU), frequencyweighted intersection over union can be generated for measure andassess the performance of the network.Accuracy, Precision, Recall and F1 scoreThe following equations 9, 10, 11 and 12 indicate how to calculateaccuracy, precision, recall and F1 score.
Accuracy =T P+T N
T P+FP+FN +T N(9)
Precision =T P
T P+FP(10)
Recall =T P
T P+FN(11)
F1score =2 · precision · recallprecision+ recall
(12)
For a certain class and for a single sample,True Positive(TP) meansvalue of actual class is yes and the value of predicted class is also yes.True Negative(TN) means the value of actual class is no and value ofpredicted class is also no.False Positive(FP) means the actual class is no and predicted class isyes.False Negative(FN) means the actual class is yes but predicted class inno[32]. A sample is shown in Figure 7.
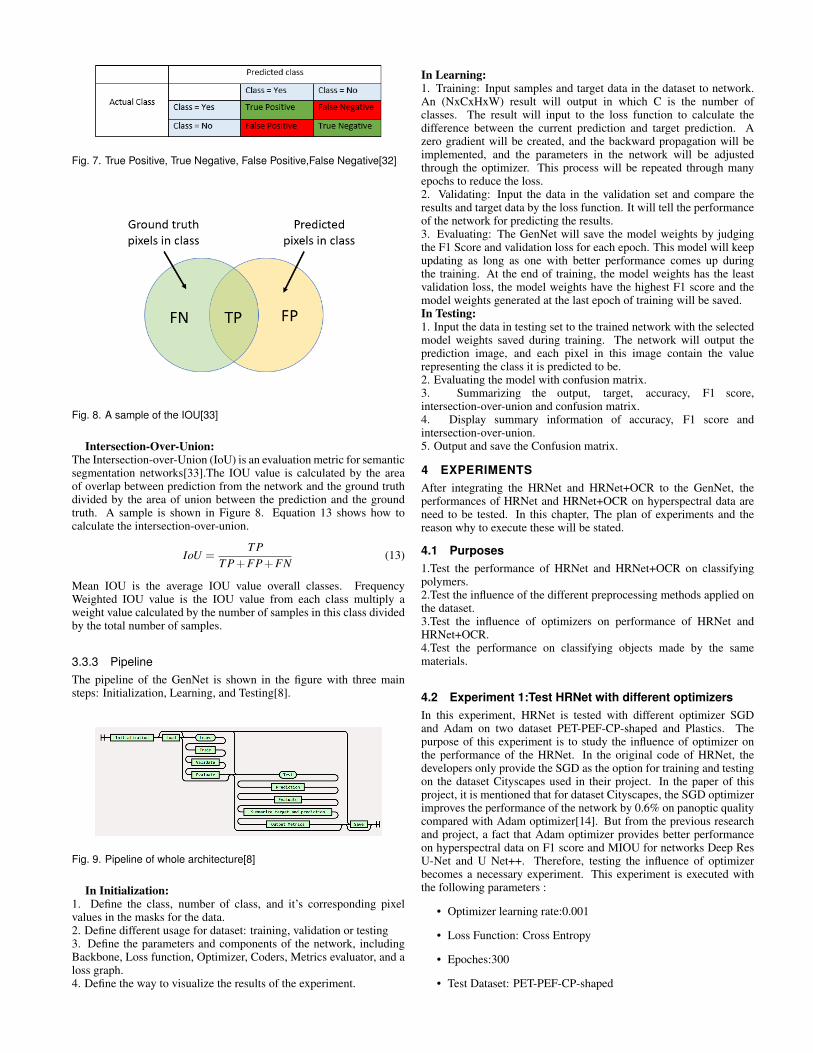
Fig. 7. True Positive, True Negative, False Positive,False Negative[32]
Fig. 8. A sample of the IOU[33]
Intersection-Over-Union:The Intersection-over-Union (IoU) is an evaluation metric for semanticsegmentation networks[33].The IOU value is calculated by the areaof overlap between prediction from the network and the ground truthdivided by the area of union between the prediction and the groundtruth. A sample is shown in Figure 8. Equation 13 shows how tocalculate the intersection-over-union.
IoU =T P
T P+FP+FN(13)
Mean IOU is the average IOU value overall classes. FrequencyWeighted IOU value is the IOU value from each class multiply aweight value calculated by the number of samples in this class dividedby the total number of samples.
3.3.3 PipelineThe pipeline of the GenNet is shown in the figure with three mainsteps: Initialization, Learning, and Testing[8].
Fig. 9. Pipeline of whole architecture[8]
In Initialization:1. Define the class, number of class, and it’s corresponding pixelvalues in the masks for the data.2. Define different usage for dataset: training, validation or testing3. Define the parameters and components of the network, includingBackbone, Loss function, Optimizer, Coders, Metrics evaluator, and aloss graph.4. Define the way to visualize the results of the experiment.
In Learning:1. Training: Input samples and target data in the dataset to network.An (NxCxHxW) result will output in which C is the number ofclasses. The result will input to the loss function to calculate thedifference between the current prediction and target prediction. Azero gradient will be created, and the backward propagation will beimplemented, and the parameters in the network will be adjustedthrough the optimizer. This process will be repeated through manyepochs to reduce the loss.2. Validating: Input the data in the validation set and compare theresults and target data by the loss function. It will tell the performanceof the network for predicting the results.3. Evaluating: The GenNet will save the model weights by judgingthe F1 Score and validation loss for each epoch. This model will keepupdating as long as one with better performance comes up duringthe training. At the end of training, the model weights has the leastvalidation loss, the model weights have the highest F1 score and themodel weights generated at the last epoch of training will be saved.In Testing:1. Input the data in testing set to the trained network with the selectedmodel weights saved during training. The network will output theprediction image, and each pixel in this image contain the valuerepresenting the class it is predicted to be.2. Evaluating the model with confusion matrix.3. Summarizing the output, target, accuracy, F1 score,intersection-over-union and confusion matrix.4. Display summary information of accuracy, F1 score andintersection-over-union.5. Output and save the Confusion matrix.
4 EXPERIMENTSAfter integrating the HRNet and HRNet+OCR to the GenNet, theperformances of HRNet and HRNet+OCR on hyperspectral data areneed to be tested. In this chapter, The plan of experiments and thereason why to execute these will be stated.
4.1 Purposes1.Test the performance of HRNet and HRNet+OCR on classifyingpolymers.2.Test the influence of the different preprocessing methods applied onthe dataset.3.Test the influence of optimizers on performance of HRNet andHRNet+OCR.4.Test the performance on classifying objects made by the samematerials.
4.2 Experiment 1:Test HRNet with different optimizersIn this experiment, HRNet is tested with different optimizer SGDand Adam on two dataset PET-PEF-CP-shaped and Plastics. Thepurpose of this experiment is to study the influence of optimizer onthe performance of the HRNet. In the original code of HRNet, thedevelopers only provide the SGD as the option for training and testingon the dataset Cityscapes used in their project. In the paper of thisproject, it is mentioned that for dataset Cityscapes, the SGD optimizerimproves the performance of the network by 0.6% on panoptic qualitycompared with Adam optimizer[14]. But from the previous researchand project, a fact that Adam optimizer provides better performanceon hyperspectral data on F1 score and MIOU for networks Deep ResU-Net and U Net++. Therefore, testing the influence of optimizerbecomes a necessary experiment. This experiment is executed withthe following parameters :
• Optimizer learning rate:0.001
• Loss Function: Cross Entropy
• Epoches:300
• Test Dataset: PET-PEF-CP-shaped
• Optimizer: SGD, Adam
4.3 Experiment 2:Test different neural networks perfor-mance
Reference networks are needed to test and compare with the HRNetto test the performance of the HRNet and whether it is suitable forsemantic segmentation on hyperspectral data. The reference networksused in this experiment are Deep Res U-Net and U Net++. Thisexperiment is executed with the following parameters :
• learning rate:0.001,
• Loss Function: Cross Entropy
• Scheduler: Inactivated
• Epoches:300
• Test Dataset: PET-PEF-CP-shaped,Plastics
• Optimizer: SGD
4.4 Experiment 3: Test the influence of different prepro-cessing methods for HRNet
In the previous project, two different preprocessing methods Loga-rithmic Derivative and Hyper-Hue [8]are provided and used on a basedataset Plastics. The results indicate that, in some cases, Hyper-Hueprovides U-Net and U-Net++ better predictions, and in most cases,the Logarithmic Derivative method provides good results. Therefore,by training the HRNet on the dataset used in the previous project, itcan also be found whether different preprocessing methods changethe performance of HRNet. This experiment is executed with thefollowing parameters :
• learning rate:0.001,
• Loss Function: Cross Entropy
• Epoches:300
• Test Dataset: Plastics, Plastics-hh, Plastics-hhi, Plastics-hhs
• Optimizer: SGD
4.5 Experiment 4: Test HRNet+OCR with different opti-mizer
HRNet+OCR is a derived network base on HRNet. The purpose of thisexperiment is to test the performance of HRNet+OCR to make a com-parison with HRNet and test the influence of different optimizers. Thereason why perform this experiment is that HRNet+OCR has a betterperformance on the public semantic segmentation dataset Cityscapes,but the best performance is with the SGD optimizer[14].According tothe previous projects, Adam optimizer can improve the performanceof Deep Res U-Net and U Net++. Therefore, it is necessary totest the influence of different optimizers and test the performanceof the HRNet+OCR. This experiment is executed with the followingparameters :
• learning rate:0.001,
• Loss Function: Cross Entropy
• Epoches:300
• Test Dataset: PET-PEF-CP-shaped
• Optimizer: SGD, Adam
The following dataset will be used to train the HRNet. :
• Plastics (including 5 types of polymers, preprocessed by FlatField Correction and Logarithmic Derivateive)
• Plastics-hh(including 5 types of polymers, preprocessed by FlatField Correction and Hyper-Hue with result of 223 channel data)
• Plastics-hhi(including 5 types of polymers, preprocessed by FlatField Correction, and Hyper-Hue + Intensity with result of 224channels data)
• Plastics-hhs(including 5 types of polymers, preprocessed by FlatField Correction, and Hyper-Hue + Saturation with result of 224channels data)
• PET-PEF-PP-shaped(5 types of polymer but included PET,PEFmade bottle as 2 additional classes to classify, removed severalchannels to reduce the influence of noise)
4.6 Experiment products
• Confusion matrixes
• Mean IOU value
• F1 score
• Prediction on testing set and ground truth image
5 RESULTS
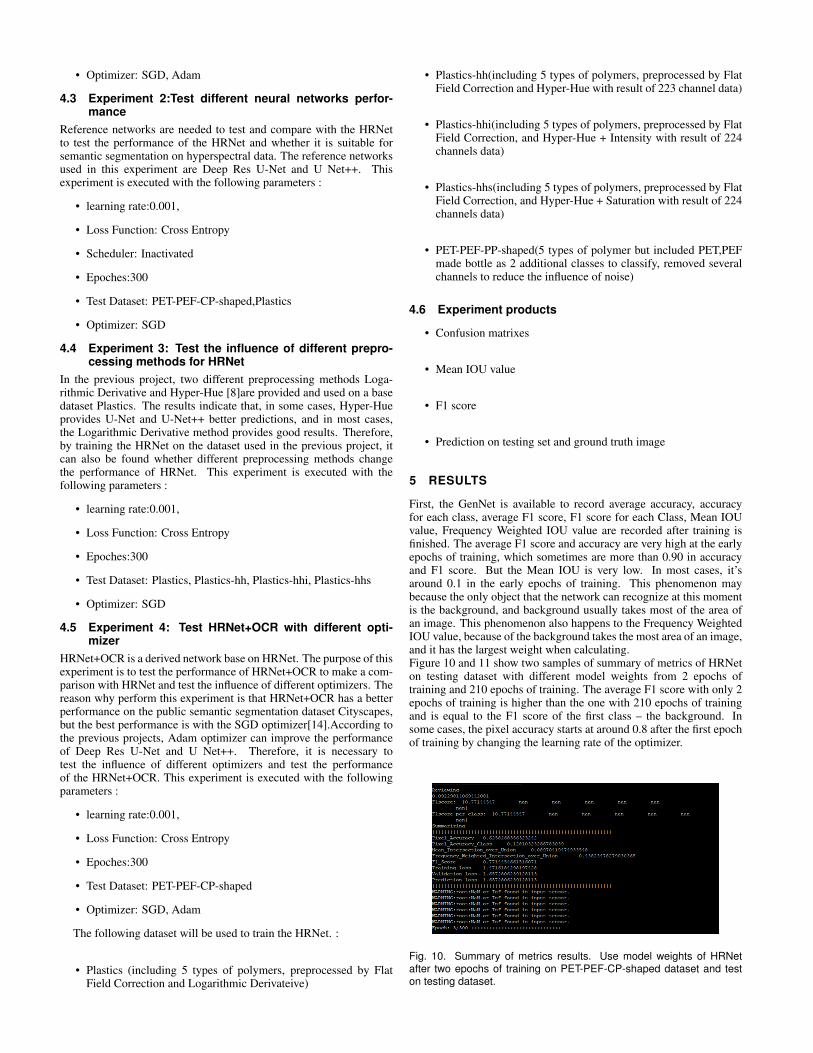
First, the GenNet is available to record average accuracy, accuracyfor each class, average F1 score, F1 score for each Class, Mean IOUvalue, Frequency Weighted IOU value are recorded after training isfinished. The average F1 score and accuracy are very high at the earlyepochs of training, which sometimes are more than 0.90 in accuracyand F1 score. But the Mean IOU is very low. In most cases, it’saround 0.1 in the early epochs of training. This phenomenon maybecause the only object that the network can recognize at this momentis the background, and background usually takes most of the area ofan image. This phenomenon also happens to the Frequency WeightedIOU value, because of the background takes the most area of an image,and it has the largest weight when calculating.Figure 10 and 11 show two samples of summary of metrics of HRNeton testing dataset with different model weights from 2 epochs oftraining and 210 epochs of training. The average F1 score with only 2epochs of training is higher than the one with 210 epochs of trainingand is equal to the F1 score of the first class – the background. Insome cases, the pixel accuracy starts at around 0.8 after the first epochof training by changing the learning rate of the optimizer.
Fig. 10. Summary of metrics results. Use model weights of HRNetafter two epochs of training on PET-PEF-CP-shaped dataset and teston testing dataset.
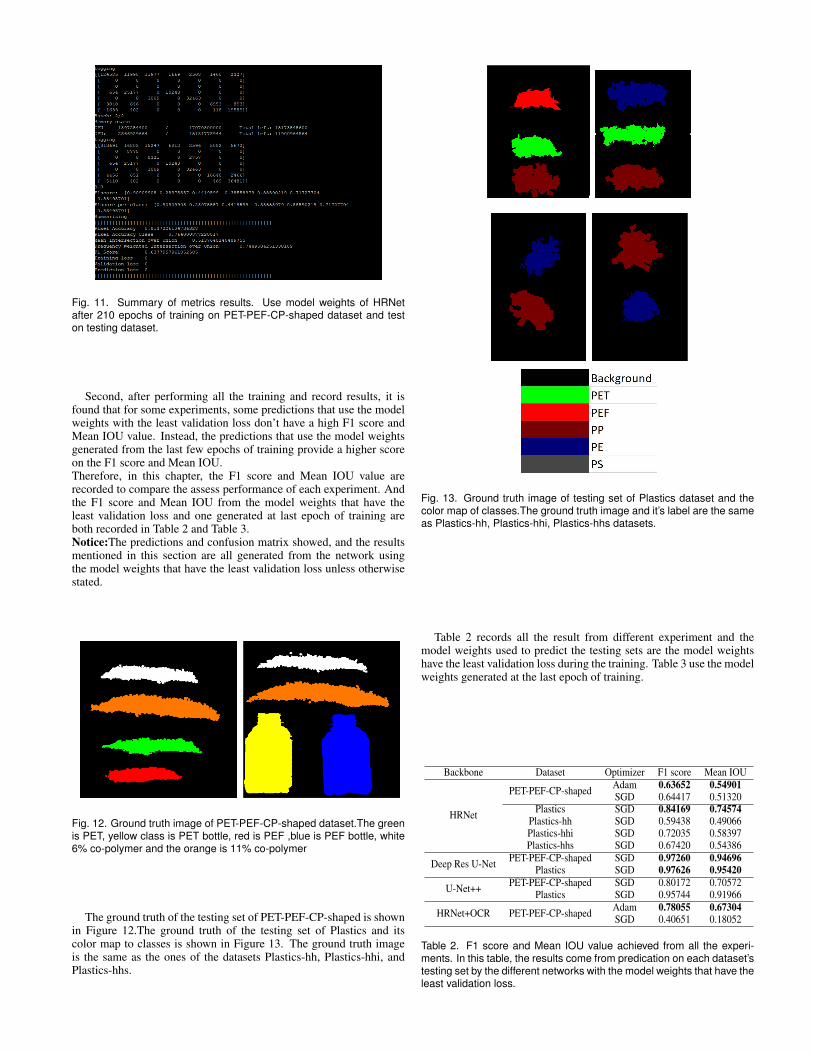
Fig. 11. Summary of metrics results. Use model weights of HRNetafter 210 epochs of training on PET-PEF-CP-shaped dataset and teston testing dataset.
Second, after performing all the training and record results, it isfound that for some experiments, some predictions that use the modelweights with the least validation loss don’t have a high F1 score andMean IOU value. Instead, the predictions that use the model weightsgenerated from the last few epochs of training provide a higher scoreon the F1 score and Mean IOU.Therefore, in this chapter, the F1 score and Mean IOU value arerecorded to compare the assess performance of each experiment. Andthe F1 score and Mean IOU from the model weights that have theleast validation loss and one generated at last epoch of training areboth recorded in Table 2 and Table 3.Notice:The predictions and confusion matrix showed, and the resultsmentioned in this section are all generated from the network usingthe model weights that have the least validation loss unless otherwisestated.
Fig. 12. Ground truth image of PET-PEF-CP-shaped dataset.The greenis PET, yellow class is PET bottle, red is PEF ,blue is PEF bottle, white6% co-polymer and the orange is 11% co-polymer
The ground truth of the testing set of PET-PEF-CP-shaped is shownin Figure 12.The ground truth of the testing set of Plastics and itscolor map to classes is shown in Figure 13. The ground truth imageis the same as the ones of the datasets Plastics-hh, Plastics-hhi, andPlastics-hhs.
Fig. 13. Ground truth image of testing set of Plastics dataset and thecolor map of classes.The ground truth image and it’s label are the sameas Plastics-hh, Plastics-hhi, Plastics-hhs datasets.
Table 2 records all the result from different experiment and themodel weights used to predict the testing sets are the model weightshave the least validation loss during the training. Table 3 use the modelweights generated at the last epoch of training.
Backbone Dataset Optimizer F1 score Mean IOU
HRNet
PET-PEF-CP-shaped Adam 0.63652 0.54901SGD 0.64417 0.51320
Plastics SGD 0.84169 0.74574Plastics-hh SGD 0.59438 0.49066Plastics-hhi SGD 0.72035 0.58397Plastics-hhs SGD 0.67420 0.54386
Deep Res U-Net PET-PEF-CP-shaped SGD 0.97260 0.94696Plastics SGD 0.97626 0.95420
U-Net++ PET-PEF-CP-shaped SGD 0.80172 0.70572Plastics SGD 0.95744 0.91966
HRNet+OCR PET-PEF-CP-shaped Adam 0.78055 0.67304SGD 0.40651 0.18052
Table 2. F1 score and Mean IOU value achieved from all the experi-ments. In this table, the results come from predication on each dataset’stesting set by the different networks with the model weights that have theleast validation loss.
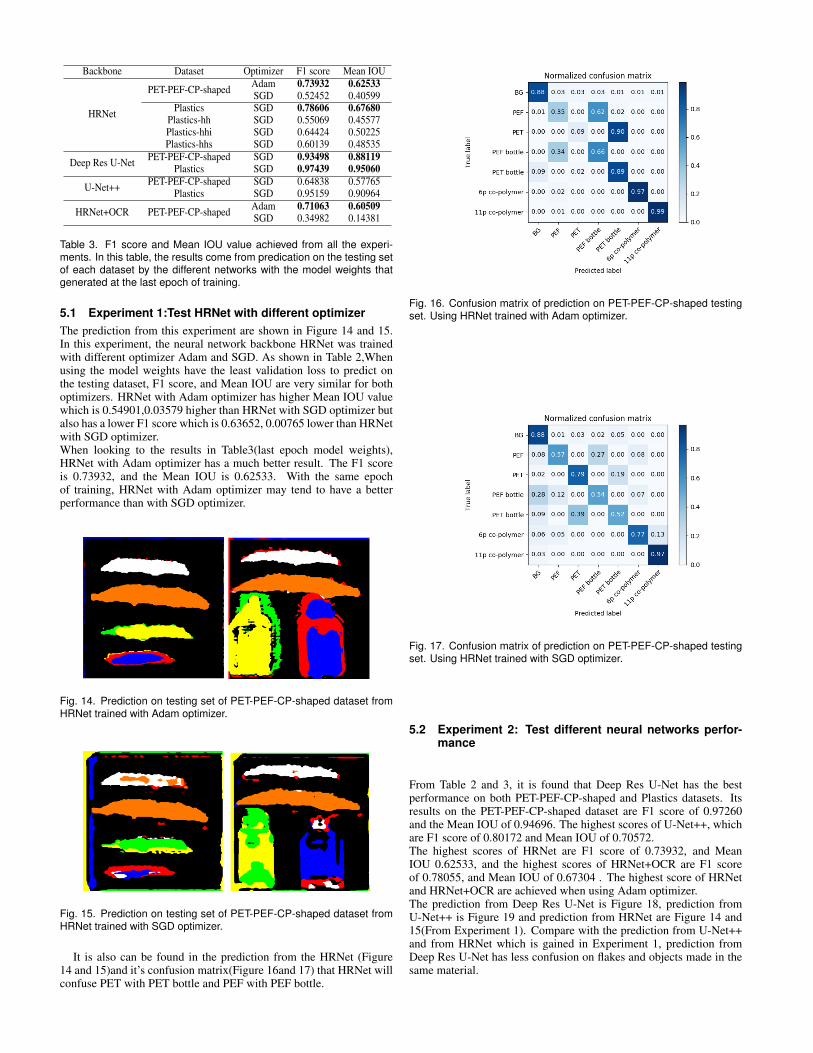
Backbone Dataset Optimizer F1 score Mean IOU
HRNet
PET-PEF-CP-shaped Adam 0.73932 0.62533SGD 0.52452 0.40599
Plastics SGD 0.78606 0.67680Plastics-hh SGD 0.55069 0.45577Plastics-hhi SGD 0.64424 0.50225Plastics-hhs SGD 0.60139 0.48535
Deep Res U-Net PET-PEF-CP-shaped SGD 0.93498 0.88119Plastics SGD 0.97439 0.95060
U-Net++ PET-PEF-CP-shaped SGD 0.64838 0.57765Plastics SGD 0.95159 0.90964
HRNet+OCR PET-PEF-CP-shaped Adam 0.71063 0.60509SGD 0.34982 0.14381
Table 3. F1 score and Mean IOU value achieved from all the experi-ments. In this table, the results come from predication on the testing setof each dataset by the different networks with the model weights thatgenerated at the last epoch of training.
5.1 Experiment 1:Test HRNet with different optimizerThe prediction from this experiment are shown in Figure 14 and 15.In this experiment, the neural network backbone HRNet was trainedwith different optimizer Adam and SGD. As shown in Table 2,Whenusing the model weights have the least validation loss to predict onthe testing dataset, F1 score, and Mean IOU are very similar for bothoptimizers. HRNet with Adam optimizer has higher Mean IOU valuewhich is 0.54901,0.03579 higher than HRNet with SGD optimizer butalso has a lower F1 score which is 0.63652, 0.00765 lower than HRNetwith SGD optimizer.When looking to the results in Table3(last epoch model weights),HRNet with Adam optimizer has a much better result. The F1 scoreis 0.73932, and the Mean IOU is 0.62533. With the same epochof training, HRNet with Adam optimizer may tend to have a betterperformance than with SGD optimizer.
Fig. 14. Prediction on testing set of PET-PEF-CP-shaped dataset fromHRNet trained with Adam optimizer.
Fig. 15. Prediction on testing set of PET-PEF-CP-shaped dataset fromHRNet trained with SGD optimizer.
It is also can be found in the prediction from the HRNet (Figure14 and 15)and it’s confusion matrix(Figure 16and 17) that HRNet willconfuse PET with PET bottle and PEF with PEF bottle.
Fig. 16. Confusion matrix of prediction on PET-PEF-CP-shaped testingset. Using HRNet trained with Adam optimizer.
Fig. 17. Confusion matrix of prediction on PET-PEF-CP-shaped testingset. Using HRNet trained with SGD optimizer.
5.2 Experiment 2: Test different neural networks perfor-mance
From Table 2 and 3, it is found that Deep Res U-Net has the bestperformance on both PET-PEF-CP-shaped and Plastics datasets. Itsresults on the PET-PEF-CP-shaped dataset are F1 score of 0.97260and the Mean IOU of 0.94696. The highest scores of U-Net++, whichare F1 score of 0.80172 and Mean IOU of 0.70572.The highest scores of HRNet are F1 score of 0.73932, and MeanIOU 0.62533, and the highest scores of HRNet+OCR are F1 scoreof 0.78055, and Mean IOU of 0.67304 . The highest score of HRNetand HRNet+OCR are achieved when using Adam optimizer.The prediction from Deep Res U-Net is Figure 18, prediction fromU-Net++ is Figure 19 and prediction from HRNet are Figure 14 and15(From Experiment 1). Compare with the prediction from U-Net++and from HRNet which is gained in Experiment 1, prediction fromDeep Res U-Net has less confusion on flakes and objects made in thesame material.
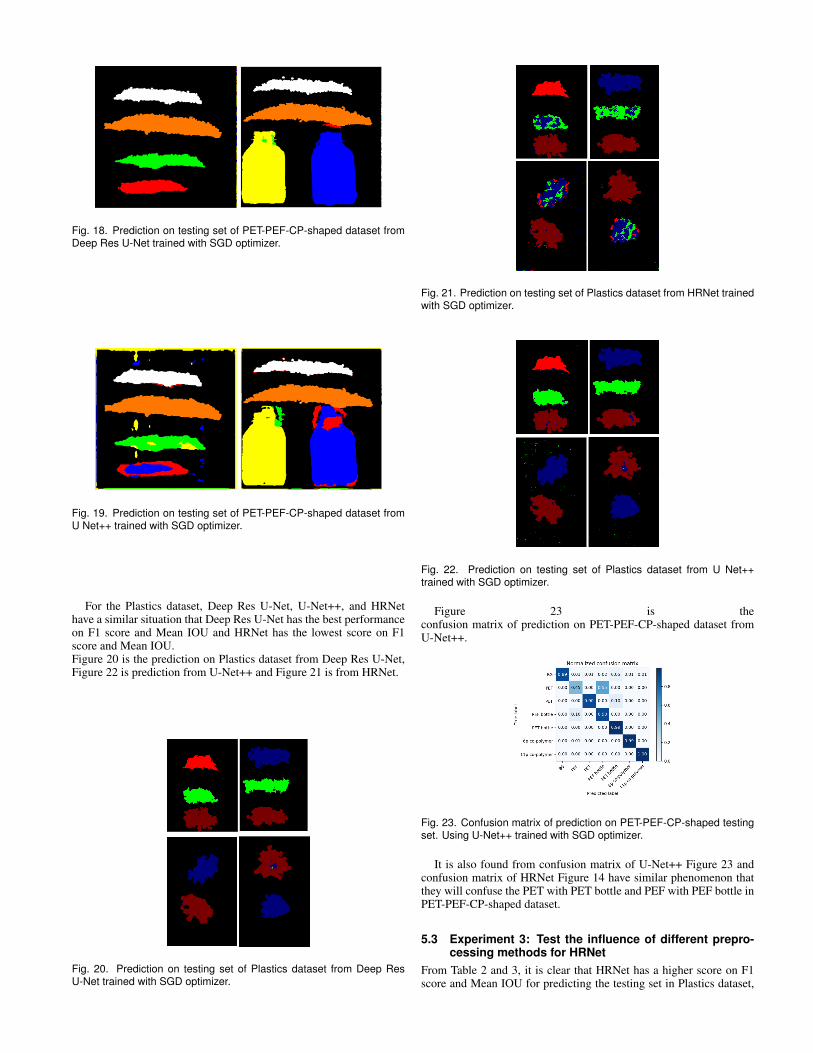
Fig. 18. Prediction on testing set of PET-PEF-CP-shaped dataset fromDeep Res U-Net trained with SGD optimizer.
Fig. 19. Prediction on testing set of PET-PEF-CP-shaped dataset fromU Net++ trained with SGD optimizer.
For the Plastics dataset, Deep Res U-Net, U-Net++, and HRNethave a similar situation that Deep Res U-Net has the best performanceon F1 score and Mean IOU and HRNet has the lowest score on F1score and Mean IOU.Figure 20 is the prediction on Plastics dataset from Deep Res U-Net,Figure 22 is prediction from U-Net++ and Figure 21 is from HRNet.
Fig. 20. Prediction on testing set of Plastics dataset from Deep ResU-Net trained with SGD optimizer.
Fig. 21. Prediction on testing set of Plastics dataset from HRNet trainedwith SGD optimizer.
Fig. 22. Prediction on testing set of Plastics dataset from U Net++trained with SGD optimizer.
Figure 23 is theconfusion matrix of prediction on PET-PEF-CP-shaped dataset fromU-Net++.
Fig. 23. Confusion matrix of prediction on PET-PEF-CP-shaped testingset. Using U-Net++ trained with SGD optimizer.
It is also found from confusion matrix of U-Net++ Figure 23 andconfusion matrix of HRNet Figure 14 have similar phenomenon thatthey will confuse the PET with PET bottle and PEF with PEF bottle inPET-PEF-CP-shaped dataset.
5.3 Experiment 3: Test the influence of different prepro-cessing methods for HRNet
From Table 2 and 3, it is clear that HRNet has a higher score on F1score and Mean IOU for predicting the testing set in Plastics dataset,
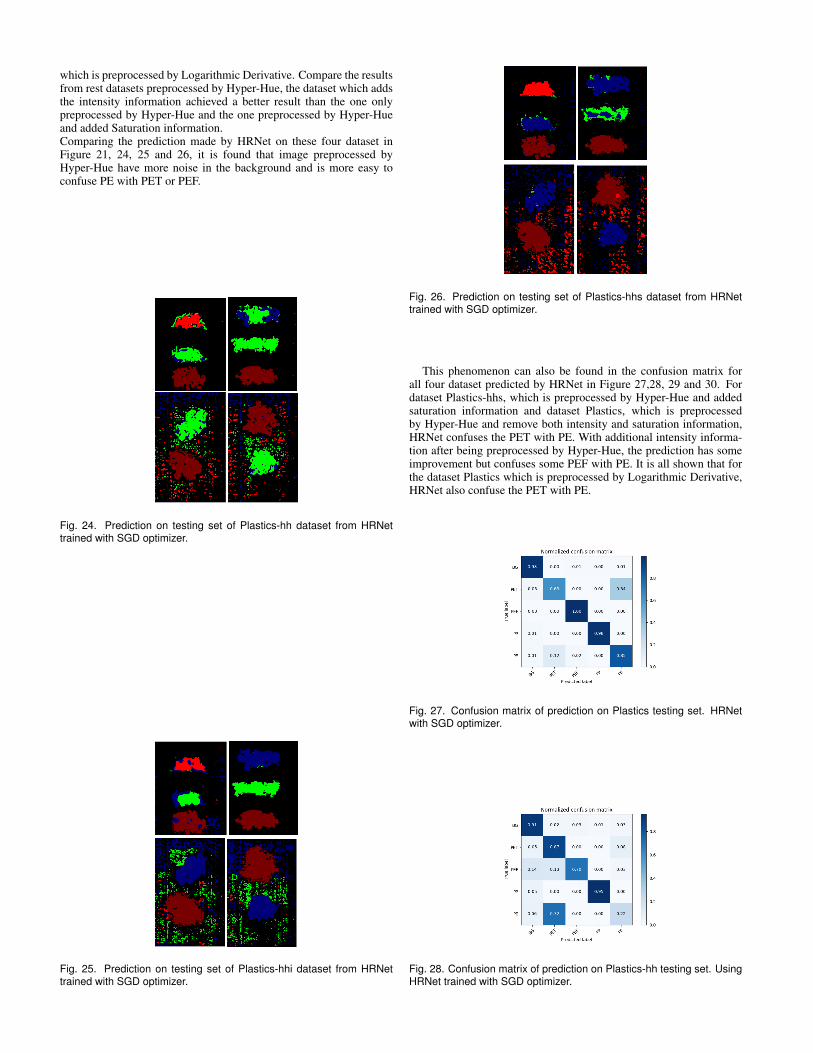
which is preprocessed by Logarithmic Derivative. Compare the resultsfrom rest datasets preprocessed by Hyper-Hue, the dataset which addsthe intensity information achieved a better result than the one onlypreprocessed by Hyper-Hue and the one preprocessed by Hyper-Hueand added Saturation information.Comparing the prediction made by HRNet on these four dataset inFigure 21, 24, 25 and 26, it is found that image preprocessed byHyper-Hue have more noise in the background and is more easy toconfuse PE with PET or PEF.
Fig. 24. Prediction on testing set of Plastics-hh dataset from HRNettrained with SGD optimizer.
Fig. 25. Prediction on testing set of Plastics-hhi dataset from HRNettrained with SGD optimizer.
Fig. 26. Prediction on testing set of Plastics-hhs dataset from HRNettrained with SGD optimizer.
This phenomenon can also be found in the confusion matrix forall four dataset predicted by HRNet in Figure 27,28, 29 and 30. Fordataset Plastics-hhs, which is preprocessed by Hyper-Hue and addedsaturation information and dataset Plastics, which is preprocessedby Hyper-Hue and remove both intensity and saturation information,HRNet confuses the PET with PE. With additional intensity informa-tion after being preprocessed by Hyper-Hue, the prediction has someimprovement but confuses some PEF with PE. It is all shown that forthe dataset Plastics which is preprocessed by Logarithmic Derivative,HRNet also confuse the PET with PE.
Fig. 27. Confusion matrix of prediction on Plastics testing set. HRNetwith SGD optimizer.
Fig. 28. Confusion matrix of prediction on Plastics-hh testing set. UsingHRNet trained with SGD optimizer.
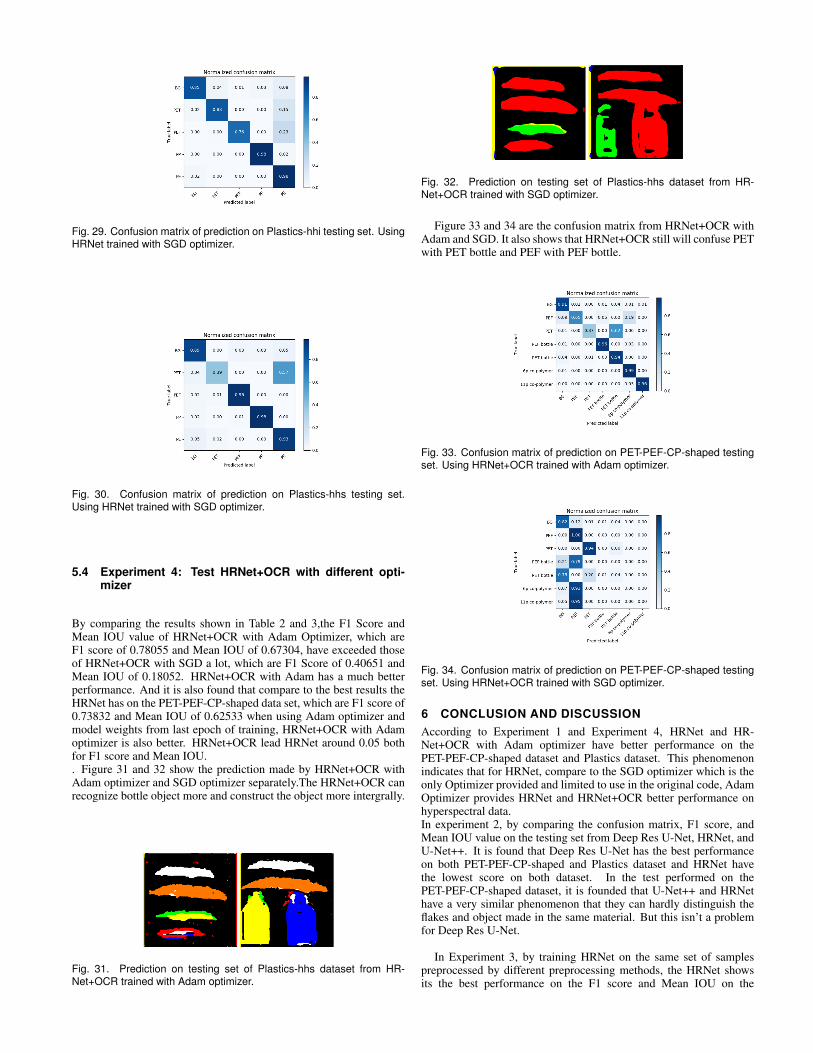
Fig. 29. Confusion matrix of prediction on Plastics-hhi testing set. UsingHRNet trained with SGD optimizer.
Fig. 30. Confusion matrix of prediction on Plastics-hhs testing set.Using HRNet trained with SGD optimizer.
5.4 Experiment 4: Test HRNet+OCR with different opti-mizer
By comparing the results shown in Table 2 and 3,the F1 Score andMean IOU value of HRNet+OCR with Adam Optimizer, which areF1 score of 0.78055 and Mean IOU of 0.67304, have exceeded thoseof HRNet+OCR with SGD a lot, which are F1 Score of 0.40651 andMean IOU of 0.18052. HRNet+OCR with Adam has a much betterperformance. And it is also found that compare to the best results theHRNet has on the PET-PEF-CP-shaped data set, which are F1 score of0.73832 and Mean IOU of 0.62533 when using Adam optimizer andmodel weights from last epoch of training, HRNet+OCR with Adamoptimizer is also better. HRNet+OCR lead HRNet around 0.05 bothfor F1 score and Mean IOU.. Figure 31 and 32 show the prediction made by HRNet+OCR withAdam optimizer and SGD optimizer separately.The HRNet+OCR canrecognize bottle object more and construct the object more intergrally.
Fig. 31. Prediction on testing set of Plastics-hhs dataset from HR-Net+OCR trained with Adam optimizer.
Fig. 32. Prediction on testing set of Plastics-hhs dataset from HR-Net+OCR trained with SGD optimizer.
Figure 33 and 34 are the confusion matrix from HRNet+OCR withAdam and SGD. It also shows that HRNet+OCR still will confuse PETwith PET bottle and PEF with PEF bottle.
Fig. 33. Confusion matrix of prediction on PET-PEF-CP-shaped testingset. Using HRNet+OCR trained with Adam optimizer.
Fig. 34. Confusion matrix of prediction on PET-PEF-CP-shaped testingset. Using HRNet+OCR trained with SGD optimizer.
6 CONCLUSION AND DISCUSSIONAccording to Experiment 1 and Experiment 4, HRNet and HR-Net+OCR with Adam optimizer have better performance on thePET-PEF-CP-shaped dataset and Plastics dataset. This phenomenonindicates that for HRNet, compare to the SGD optimizer which is theonly Optimizer provided and limited to use in the original code, AdamOptimizer provides HRNet and HRNet+OCR better performance onhyperspectral data.In experiment 2, by comparing the confusion matrix, F1 score, andMean IOU value on the testing set from Deep Res U-Net, HRNet, andU-Net++. It is found that Deep Res U-Net has the best performanceon both PET-PEF-CP-shaped and Plastics dataset and HRNet havethe lowest score on both dataset. In the test performed on thePET-PEF-CP-shaped dataset, it is founded that U-Net++ and HRNethave a very similar phenomenon that they can hardly distinguish theflakes and object made in the same material. But this isn’t a problemfor Deep Res U-Net.
In Experiment 3, by training HRNet on the same set of samplespreprocessed by different preprocessing methods, the HRNet showsits the best performance on the F1 score and Mean IOU on the
dataset preprocessed by Logarithmic Derivative instead of datasetpreprocessed by Hyper-Hue. Another thing that also is found that bycomparing the confusion matrixes from Plastics-hh and Plastics-hhs,it is found the HRNet is hard to distinguish PE and PET. But forPlastics-hhi dataset, this phenomenon has a little improvement whichindicates that intensity information may be important for HRNet tolearn the hyperspectral data.
In Experiment 4, HRNet+OCR is trainedon both PET-PEF-CP-shaped and Plastics datasets with two differentOptimizer SGD and Adam. The result is similar to Experiment 1,that Adam optimizer improves the performance of HRNet+OCR. Andthe performance of HRNet+OCR with Adam Optimizer is better thanHRNet with Adam Optimizer on PET-PEF-CP-shaped dataset.Therefore, answers to the research questions and the conclusion is asfollows:A neural network called HRNet and its derivative network backboneHRNet+OCR is available to integrate into the GenNet without muchchange on Dataloader, Loss function, or Optimizer in the currentstructure. The HRNet+OCR backbone has a good result on the originalproject[14], which is performed on a public dataset Cityscapes with84.5% IOU list at the top of the billboard for semantic segmentationjob on this dataset. But the HRNet and HRNet+OCR cannot providebetter performance on learning and predicting hyperspectral data thanDeep Res U-Net which is already integrated to the GenNet.Some reasons may cause this result:First, the structure of HRNet is by fuse four different predictions infour different resolutions into one final prediction by a 1x1 convolutionlayer. This operation may magnify the noise and error in eachprediction.Second, the HRNet and U-Net++ have a similar phenomenon thatthey confuse the objects made in the same materials. This indicatesthat HRNet can learn hyperspectral data, but from the confusionmatrixes come from the HRNet, it may prefer to classify plasticsflake as an object – a bottle made by the same material. Thismay mean that the structure of HRNet and U-Net++ takes moreweight on the two-dimensional information such as edges, angles, andchannel of image that contain the information of colors. Even thenetwork has learned the feature of plastic material through channelscontaining hyperspectral information. It seems that it cannot combinethe hyperspectral features with the two-dimensional features, and itprefers to use the two-dimensional features to predict the image.This may also explain that why prediction on dataset preprocessedby Hyper-Hue and add additional intensity information achieves littleimprovement in Table2 and 3.Also, the function of OCR is to assign the class label only to the pixelthat belongs to the object in the same category. This is to reduce thechance to label a pixel in the background or in other objects as a wrongclass. Therefore, this function enhances the two-dimensional featuresby judging whether a pixel is in an object.Another point is that the choice of Optimizer may influence a lots onhow a neural network learns hyperspectral data. This phenomenon isexceptionally distinct on HRNet+OCR backbone which has enhancedthe ability to learn both two-dimensional features and hyperspectralfeatures.For the future project, if another neural network backbone is needed,the network derives from or combines with the DeepLabV3 network,or the DeepLab series network could be a good way to search for.Because of the Deep Res U-Net has a much better performance thanU-Net++ and HRNet and it’s performance was also analyze in theprevious project[29]. And also the neural network made speciallyto learning hyperspectral data are another good way to look causeof currently the neural network specially made for hyperspectral dataare only a few and coded in Tensorflow instead of PyTorch such asHybirdSN which can also be found on paperwithcode.com.In this project, due to the situation, bio-polymers are not tested.Whether bio-polymer can also be classified is still an uncertain subjectneed to be studied.
REFERENCES
[1] J. R. Jambeck. K. L. Law R. Geyer. Production, use, and fate of allplastics ever made., 2017.
[2] WORLD ECONOMIC FORUM. The new plastics economy, rethinkingthe future of plastics., 2016.
[3] British Plastics Federation. Plastics additives., 2020.[4] Micro-plastics are entering the human body and are dangerous to human
health., 2019.[5] European Bioplastics e.V. What are bioplastics?, 2020.[6] Johannes Becker Lars B¨orger Jens Hamprecht Sebastian Koltzenburg
Robert Loos Michael Bernhard Schick Katharina Schlegel Carsten SinkelGabriel Skupin Andreas K¨unkel and Motonori Yamamoto. Polymers,biodegradable., 2016.
[7] Ellen Macarthur Foundation. Eleven companies take major step towardsa new plastics economy, 2018.
[8] Carlos Alejandro Guerrero Martinez. Polymer segmentation throughhyper-spectral imaging and convolutional neural networks, 2019.
[9] Neural networks:advantages and applications, April 18,2019.[10] Yu-Hsiu Lin. Chia-Ching Kung Ming-Han Chung I-Hsuan Yen
Yung-Yao Chen. Design and implementation of cloud analytics-assistedsmart power meters considering advanced artificial intelligence as edgeanalytics in demand-side management for smart homes., 2019.
[11] Nagornov N.N.-Lyakhov P.A. Valuev-G.V. Chervyakov N.I. Valueva,M.V. Application of the residue number system to reduce hardware costsof the convolutional neural network implementation. 2020.
[12] Ays¸egu¨l Uc¸ar O¨ zal Yıldırım Yakup demir Musab Cos¸kun. Facerecognition based on convolutional neural network, 2017.
[13] Jingdong Wang, Ke Sun, Tianheng Cheng, Borui Jiang, Chaorui Deng,Yang Zhao, Dong Liu, Yadong Mu, Mingkui Tan, Xinggang Wang,Wenyu Liu, and Bin Xiao. Deep high-resolution representation learningfor visual recognition. TPAMI, 2019.
[14] Ke Sun, Bin Xiao, Dong Liu, and Jingdong Wang. Deep high-resolutionrepresentation learning for human pose estimation. In CVPR, 2019.
[15] Bart Riesebos. Pet and pef classification using hyper-spectral imagingand semantic segmentation networks, 2019.
[16] N.MacKinnon. D.L.Farkas F.Vasefi. Hyperspectral and multispectralimaging in dermatology, 2016.
[17] Yijing Xie. Eli Nabavi Robert Bradford Shakeel R Saeed SebastienOurselin-Tom Vercauteren Jonathan Shapey. Intraoperative multispectraland hyperspectral label-free imaging: A systematic review of in vivoclinical studies., 2019.
[18] Jeffrey Gotro. Recycle and disposal of plastic food packaging waste 8:More about waste plastic sorting technologies., 2017.
[19] Semantic segmentation-popular architectures., 2019.[20] A. Jand. Identify plastics using deep learning and hyperspectral imaging,
2017.[21] A. Stellingwerf and J. Hu. Description of polymer classification by
applying hyperspectral imaging and deep learning techniques, 2017.[22] H. Kloosterman. Hyperspectral band selection, 2018.[23] P. Ghamisi G. Licciardi B. Rasti, P. Scheunders and J. Chanussot. Noise
reduction in hyperspectral imagery: Overview and application. 2018.[24] Leia explains: What is the effect of flat field correction and why is it
absolutely essential for the use of line scan cameras?, 2020.[25] Frederic Itthirad Mohamed Bouabdellah Brigitte Closs Michel Jourlin,
Josselin Breugnot. Logarithmic image processing for color images, 2014.[26] S.-H. Lee H. Liu and J. S. Chahl. Transformation of a high-dimensional
color space for material classification. 2017.[27] Armin Haeberle Sulaiman Vesal Vincent Christlein Andreas Maier Chris-
tian Riess AmirAbbas Davari, Nikolaos Sakaltras. Hyper-hue and emapon hyperspectral images for supervised layer decomposition of old masterdrawings, 2018.
[28] Helena Kloosterman. Hyperspectral band selection, 2019.[29] Bart Riesebos. Pet and pef classification using hyper-spectral imaging
and semantic segmentation networks, 2019.[30] Loss and loss functions for training deep learning neural networks, 2019.[31] Jingdong Wang Yuhui Yuan, Xilin Chen. Object-contextual representa-
tions for semantic segmentation, 2019.[32] Accuracy, precision, recall —& f1 score: Interpretation of performance
measures, 2016.[33] Intersection over union (iou) for object detection, 2016.
6.1 APPENDIX
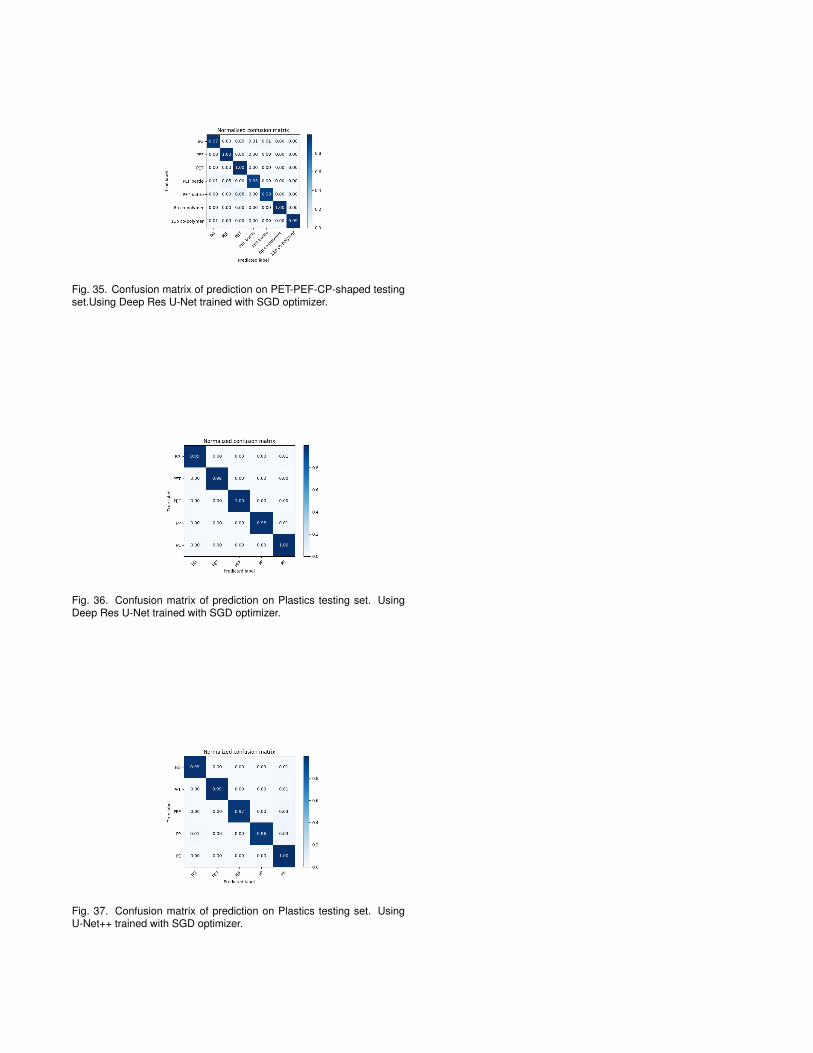
Fig. 35. Confusion matrix of prediction on PET-PEF-CP-shaped testingset.Using Deep Res U-Net trained with SGD optimizer.
Fig. 36. Confusion matrix of prediction on Plastics testing set. UsingDeep Res U-Net trained with SGD optimizer.
Fig. 37. Confusion matrix of prediction on Plastics testing set. UsingU-Net++ trained with SGD optimizer.


![arXiv:1701.06715v1 [cs.CV] 24 Jan 2017 · 2017-01-25 · Keywords: Tree segmentation, remote sensing, LiDAR, hyperspectral image, optical imagery, normalised Cut. 1. Introduction](https://static.fdocuments.net/doc/165x107/5f478ac916677841d5583bfc/arxiv170106715v1-cscv-24-jan-2017-2017-01-25-keywords-tree-segmentation.jpg)

