Bioactive Compounds From Marine Resources a Boon for Human Health

ISSN
034
4-9
629
GKSS 2009/7
Author:
L. Ahrens
Polyfluoroalkyl Compounds in the Marine Environment –Investigations on their Distribution in Surface Water andTemporal Trends in Harbor Seals (Phoca vitulina)
(Von der Fakultät III Umwelt und Technik der Leuphana Universität Lüneburg
als Dissertation angenommene Arbeit)


Polyfluoroalkyl Compounds in the Marine Environment –Investigations on their Distribution in Surface Water andTemporal Trends in Harbor Seals (Phoca vitulina)
(Von der Fakultät III Umwelt und Technik der Leuphana Universität Lüneburg
als Dissertation angenommene Arbeit)
GKSS-Forschungszentrum Geesthacht GmbH • Geesthacht • 2009
Author:
L. Ahrens(Institute for Coastal Research)
GKSS 2009/7

Die Berichte der GKSS werden kostenlos abgegeben.The delivery of the GKSS reports is free of charge.
Anforderungen/Requests:
GKSS-Forschungszentrum Geesthacht GmbHBibliothek/LibraryPostfach 11 6021494 GeesthachtGermanyFax.: +49 4152 87-1717
Als Manuskript vervielfältigt.Für diesen Bericht behalten wir uns alle Rechte vor.
ISSN 0344-9629
GKSS-Forschungszentrum Geesthacht GmbH · Telefon (04152) 87-0Max-Planck-Straße 1 · 21502 Geesthacht / Postfach 11 60 · 21494 Geesthacht
GKSS 2009/7
Polyfluoroalkyl Compounds in the Marine Environment – Investigations on theirDistribution in Surface Water and Temporal Trends in Harbor Seals (Phoca vitulina)
(Von der Fakultät III Umwelt und Technik der Leuphana Universität Lüneburg als Dissertation angenommene Arbeit)
Lutz Ahrens
176 pages with 39 figures and 40 tables
Abstract
Recently polyfluoroalkyl compounds (PFCs) were discovered as emerging persistent organic pollutants.Because of their unique physicochemical properties due to their combination of lipophilic and hydrophiliccharacteristics, PFCs have been widely used in many consumer products, such as polymerisation aids,stain repellents on carpets, textiles, and paper products for over 50 years. From the production and use ofthese products, PFCs can be released into the environment. Scientific concern about PFCs increased due totheir global distribution and ubiquitous detection in the environment, especially in marine mammals.An analytical protocol was developed for the analysis of PFCs in water samples and various biologicalmatrices. The samples were analysed for 40 PFCs plus 20 isotope-labelled internal standards using high performance liquid chromatography/negative electrospray ionisation-tandem mass spectrometry(HPLC/(-)ESI-MS/MS). Furthermore, the analytical quality of the laboratory has been approved in inter-laboratory studies. In the first part of this Ph.D. thesis was investigated the occurrence, distribution pattern and transportationmechanisms of PFCs in seawater. The rivers had a high influence on the distribution of PFCs in offshoresurface water in the German Bight, with decreasing concentrations with increasing distance from thecoast (see publication I). The research on the spatial distribution of PFCs in coastal area is very importantfor the understanding of the transportation and fate of PFCs in the marine environment. Furthermore, thelongitudinal and latitudinal distribution of PFCs in surface water of the Atlantic Ocean was investigated(see publication II). The results indicate that trans-Atlantic Ocean currents caused the decreasing concentration gradient from the Bay of Biscay to the South Atlantic Ocean and the concentration drop-offclose to the Labrador Sea. These data are very useful for global transportation models, in which industrialareas are considered as sources, and ocean waters as sinks of PFCs. The second part of this Ph.D. thesis examined the mechanisms and pathways of PFCs in harbor seals(Phoca vitulina) and their temporal trends in the German Bight. Firstly, the whole body burden of PFCsand their tissue distribution (i.e., liver, kidney, lung, heart, blood, brain, muscle, thyroid, thymus, andblubber) was investigated in harbor seals (see publication III). This study is relevant for calculation ofthe bioaccumulation potential of these compounds in marine mammals. Secondly, the temporal trendsover the last decade and associations between PFC concentration and the evidence of diseases, spatialdistribution, age and sex were evaluated in archived harbor seal livers (see publication IV). The resultsshow significant declining concentrations of many PFCs indicating the replacement of these PFCs byshorter chained and less bioaccumulative compounds. Several studies were performed besides the main issue of the Ph.D. work. Firstly, water samples were collected along the river Elbe into the North Sea to examine the distribution of PFCs in the dissolved andparticulate phase, their discharge into the North Sea, and the influence of waste water treatment planteffluents to the riverine mass flow. Furthermore, surface water samples were collected in the North Sea,Baltic Sea and Norwegian Sea, where the occurrence and spatial distribution between river estuaries,coastal waters, in brackish as well as salt water, and open sea water were compared. Finally, within theframe of a research stay at the National Institute of Advanced Industrial Science and Technology (AIST)in Japan, the partitioning behaviour of PFCs between pore water and sediment in two sediment coresfrom Tokyo Bay was investigated.

This Ph.D. thesis has improved our knowledge of the occurrence and distribution of PFCs in water andbiota highlighting association between PFCs and pathological conditions, potential sources and sinks,spatial distribution, and changes in their pattern and long-term perspective trends.
Polyfluorierte Alkylverbindungen in der marinen Umwelt – Untersuchung zur Verteilung im Wasser und zeitlichen Trends in Seehunden (Phoca vitulina)
Zusammenfassung
Polyfluorierte organische Substanzen (PFCs) gehören zu den neuartigen Problemstoffen in der Umwelt,die sich durch ihre Persistenz, Toxizität und ihr Potential zur Bioakkumulation auszeichnen. Aufgrundihrer einzigartigen Eigenschaften finden sie seit ca. 50 Jahren vielfältige Anwendung in industriellen undkommerziellen Produkten wie u.a. Beschichtungen für Lebensmittelverpackungen, Imprägniermittelnfür Textilien, Hilfsmittel in der Polymerchemie oder Bestandteil von Feuerlöschschäumen. PFCs wurdenbereits ubiquitär in der Umwelt gefunden, mit den höchsten Konzentrationen in marinen Säugetieren. Es konnte erfolgreich eine Methode zur Messung von PFCs in der Wasserphase und unterschiedlichenGewebematerialien etabliert werden. Die instrumentelle Analyse umfasst insgesamt 40 Zielsubstanzenplus 20 isotopenmarkierte Standards die mittels Flüssigkeits-chromatographie – negativ ElektrosprayIonisation – Tandem Massenspektrometrie (HPLC/(-)ESI-MS/MS) gemessen werden. In dem ersten Teil dieser Arbeit wird das Vorkommen, Verteilung und der Transportmechanismus vonPFCs in Seewasser untersucht. Hierbei zeigte sich, dass die Flusseinträge einen großen Einfluss auf dieVerteilung von PFCs in küstennahem Wasser in der Deutschen Bucht haben, wobei die Konzentrationenmit zunehmender Entfernung zur Küste abfallen (siehe Publikation I). Des Weiteren wurde die Verteilungvon PFCs im Atlantischen Ozean untersucht (siehe Publikation II). Die Ergebnisse zeigen, dass dieStrömungen des Atlantischen Ozeans im Wesentlichen für den fallenden Konzentrationsgradienten vomGolf von Biscaya zum südatlantischen Ozean und den Konzentrationsabfall in der Labrador-See verant-wortlich sind. Die beiden Studien liefern wichtige Daten für u.a. globale Schadstoff-Transportmodelle,wobei die industriellen Gebiete als Quellen und der Ozean als Senke identifiziert werden konnten.Der zweite Teil der Arbeit beschäftigt sich mit dem Aufnahmewegen und der Verteilung von PFCs in Seehunden (Phoca vitulina) und der Rekonstruktion ihrer zeitlichen Belastung in der deutschen Bucht.Es konnte eine gewebeabhängige Verteilung von PFCs in Seehunden gefunden werden, wobei auf Blutund Leber etwa drei Viertel der PFCs entfielen und der Rest in den anderen Organen (i.E., Muskel,Lunge, Niere, Fett, Herz, Gehirn, Thymus, Schilddrüse) verteilt waren (siehe Publikation III). Hiermitlassen sich das Bioakkumulationspotential und die Gesamtkörperbelastung für die einzelnen PFCs inmarinen Säugetieren abschätzen. Des Weiteren wurde der Zusammenhang zwischen den PFC Konzen-trationen und dem Auftreten von Krankheiten, räumlicher Verteilung, Alter und Geschlecht der Tiereuntersucht und die zeitliche Belastung in Seehunden über die letzten zehn Jahre rekonstruiert (siehePublikation IV). Die Ergebnisse zeigen signifikant fallende Konzentrationen für zahlreiche PFCs, wasauf die Verwendung von kürzerkettigen PFCs und weniger bioakkumulierenden Substanzen zurück-geführt werden kann.Zusätzlich wurden Wasserproben entlang der Elbe bis in die Deutsche Bucht genommen um die Verteilungzwischen der gelösten und partikelgebundenen Phase, ihren Masseneintrag in die Deutsche Bucht undden Einfluss von Kläranlagenausläufen zu untersuchen. Außerdem wurden weitere Oberflächenwasser-proben in der Nordsee, Ostsee und Norwegischen See genommen, um das Vorkommen und die Verteilungvon PFCs in den unterschiedlichen Gebieten zu vergleichen. Abschließend wurde im Rahmen einesForschungsaufenthaltes in Japan die Verteilung von PFCs in Porenwasser und Sediment in zwei Sediment-kernen aus der Bucht von Tokio untersucht. Die Promotionsarbeit verbessert das Verständnis des Verteilungsverhaltens von PFCs in der marinenUmwelt. Der Nachweis der Belastung der marinen Umwelt mit PFCs leistet einen wissenschaftlichenBeitrag zur Begründung und Erfolgskontrolle von politischen Maßnahmen und könnte einen Anstoß inDeutschland und auch auf europäischer Ebene geben, einen Handlungsplan für PFCs zu erstellen.
Manuscript received / Manuskripteingang in TFP: 7. September 2009

Table of contents
I
Table of contents
Table of contents........................................................................................................................I
Acknowledgements.................................................................................................................. II
List of publications ................................................................................................................ III
List of abbreviations...............................................................................................................IV
List of tables............................................................................................................................VI
List of figures .......................................................................................................................VIII
1. Introduction .......................................................................................................................... 1 1.1 Background .................................................................................................................................................. 1 1.2 Production and usage ................................................................................................................................... 3 1.3 Properties and environmental behaviour ...................................................................................................... 5 1.4 Analytical methods....................................................................................................................................... 7 1.5 Environmental concentrations.................................................................................................................... 11
1.5.1 PFC levels in air ................................................................................................................................. 11 1.5.2 PFC levels in solid samples ................................................................................................................ 13 1.5.3 PFC levels in aqueous samples ........................................................................................................... 16 1.5.4 PFC levels in wildlife ......................................................................................................................... 23 1.5.5 PFC levels in humans ......................................................................................................................... 29
1.6 Temporal trends.......................................................................................................................................... 32 1.7 Toxicology ................................................................................................................................................. 35
1.7.1 Bioaccumulation and biomagnification potential ............................................................................... 35 1.7.2 Human and ecotoxicology .................................................................................................................. 37 1.7.3 Human health risk assessment ............................................................................................................ 39
2. Aim and outline of the work.............................................................................................. 41
3. Publication I........................................................................................................................ 43
4. Publication II ...................................................................................................................... 54
5. Publication III..................................................................................................................... 67
6. Publication IV..................................................................................................................... 79
7. Additional studies............................................................................................................... 94 7.1 PFCs in water and suspended particulate matter in the river Elbe and North Sea...................................... 94 7.2 PFCs in effluents of waste water treatment plants and surface water along the river Elbe ........................ 98 7.3 Sources of PFCs in the North Sea, Baltic Sea and Norwegian Sea: Evidence from their spatial
distribution in surface water..................................................................................................................... 103 7.4 Partitioning behaviour of PFCs between pore water and sediment in two sediment cores from
Tokyo Bay................................................................................................................................................ 109
8. Summary and outlook...................................................................................................... 115
9. Bibliography ..................................................................................................................... 119
10. Supplementary material ................................................................................................ 139

Acknowledgements
II
Acknowledgements
I would like to thank Prof. Dr.-Ing. Ruck for giving me the opportunity to work on such a
challenging and exciting topic as polyfluoroalkyl compounds (PFCs). My special thanks go to
Prof. Dr. Ralf Ebinghaus for his enthusiasm, the intensive co-operation, and supervision of
this thesis.
This work would not have been possible without the excellent co-operation inside the
Department for Environment Chemistry. I want to thank gratefully Armando Caba for his
help with experimental setup and realisation of sampling campaigns. Furthermore, I would
like to thank Merle Plaßmann, Sebastian Felizeter, Johanna Kratzer, Axel Möller und Jan
Busch for their excellent work of their diploma thesis. I would like to acknowledge the help
of several interns: Vincent, Matthias, Till, Andreas, Constanze, Jan, Lena, Janne, etc.
I would like to thank Dr. Ursula Siebert, Dr. Norbert Theobald, Dr. Christian Temme, Dr.
Wolf Palm und Prof. Dr. Ralf Ebinghaus, who supported me in the advisory panel giving me
countless professional and personal dialogues throughout the years. Furthermore, special
thanks are given to Renate Sturm, Zhiyong Xie, Armando Caba and other colleagues for the
insightful discussions on the analysis of PFCs.
My sincere thanks are due to my colleagues for their enjoyable talks during lunch time and
the attending of lots of activities like BBQ, watching movies, jogging etc. after the exhausting
laboratory work.
I am grateful to Ursula Siebert from the Research and Technology Centre Westcoast
(FTZ) for her support of my work and to provide all the harbor seal samples for my Ph.D.
thesis. Furthermore, I would like to thank the crews for their help during the water sampling
campaigns with the research vessels Polarstern (Alfred-Wegener-Institute (AWI)), Maria S.
Merian (Leibniz Institute for Baltic Sea Research (IOW)), Atair (Federal Maritime and
Hydrographic Agency (BSH)) and Ludwig Prandtl (GKSS Research Centre
Geesthacht GmbH).
I am grateful to the German Federal Environmental Foundation (DBU) for their financial
support and interesting workshops. Especially, I want to thank Dr. Maximilian Hempel to
support my work over all the years.
The International Bureau from the Federal Ministry of Education and Research (BMBF) is
thanks for their financial support of my research stay at the National Institute of Advanced
Industrial Science and Technology (AIST) in Japan. My special gratitude is due to Dr.
Nobuyoshi Yamashita and his group for the grateful time in Japan.
Finally, I am forever indebted to my parents, my brother Ralf and especially Atsuko for
their understanding, support and encouragement when it was most required.

List of publications
III
List of publications
The cumulative Ph.D. thesis “Polyfluoroalkyl Compounds in the Marine Environment –
Investigation on their Distribution in Surface Water and Temporal Trends in Harbor Seals
(Phoca vitulina)” is based on the following scientific publications listed below. All of them
are published.
Publication I
Lutz Ahrens, Sebastian Felizeter, Ralf Ebinghaus. Spatial distribution of polyfluoroalkyl
compounds in seawater of the German Bight. Chemosphere 2009, 76, 179-184.
Reproduced with permission from Chemosphere © 2009 Elsevier.
Publication II
Lutz Ahrens, Jonathan L. Barber, Zhiyong Xie, Ralf Ebinghaus. Longitudinal and latitudinal
distribution of perfluoroalkyl compounds in the surface water of the Atlantic Ocean. Environ.
Sci. Technol. 2009, 43, 3122-3127.
Reproduced with permission from Environmental Science & Technology © 2009 American
Chemical Society.
Publication III
Lutz Ahrens, Ursula Siebert, Ralf Ebinghaus. Total body burden and tissue distribution of
polyfluorinated compounds in harbor seals (Phoca vitulina) from the German Bight. Marine
Poll. Bull. 2009, 58, 520-525.
Reproduced with permission from Marine Pollution Bulletin © 2009 Elsevier.
Publication IV
Lutz Ahrens, Ursula Siebert, Ralf Ebinghaus. Temporal trends of polyfluoroalkyl compounds
in harbor seals (Phoca vitulina) from the German Bight, 1999-2008. Chemosphere 2009, 76,
151-158.
Reproduced with permission from Chemosphere © 2009 Elsevier.

List of abbreviations
IV
List of abbreviations
AFFFs aqueous fire fighting foams APCI atmospheric pressure chemical ionisation APPI atmospheric pressure photo ionisation BAFs bioaccumulation factors BCFs bioconcentration factors BMFs biomagnification factors BSH Federal Maritime and Hydrographic Agency (Bundesamt für
Seeschifffahrt and Hydrographie) CFCs chlorofluorocarbons CI chemical ionisation CIC combustion ion chromatography dw dry weight DOC dissolved organic carbon ECD electron capture detector EI electron impact FASAAs perfluoroalkyl sulfonamidoacetic acids FASAs perfluoroalkyl sulfonamides FASEs perfluoroalkyl sulfonamidoethanols FBs field blanks FID flame ionisation detection fOC fraction organic carbon FTALs fluorotelomer aldehydes FTAs fluorotelomer acrylates FTCAs fluorotelomer carboxylates FTOHs fluorotelomer alcohols FTolefins fluorotelomer olefins FTS fluorotelomer sulfonates FTUCAs fluorotelomer unsaturated carboxylates GC-MS gas chromatography coupled with mass spectrometry GFFs glass-fibre filters GJIC gap junctional intercellular communication HPLC/(-)ESI-MS/MS high performance liquid chromatography coupled with a tandem mass
spectrometry operated in an electrospray negative mode IC50 inhibition concentration at which 50% of subjects will inhibited ICES International Council for the Exploration of the Sea IDLs instrument detection limits IF inorganic fluorine InjS injection standard (spiked before analysis) IPE ion pairing extraction IS isotope-labelled internal standards (spiked before extraction) ITCZ inner tropical convergence zone

List of abbreviations
V
LD50 lethal dose at which 50% of subjects will die LLE liquid-liquid extraction LODs limit of detection LOQs limits of quantitation m/z ion mass to charge ratio MCWG Marine Chemistry Working Group MDLs method detection limits MQLs method quantitation limits NCI negative chemical ionisation NMR nuclear magnetic resonance NOAEL no-observed-adverse effect levels NOECcommunity community no-observable-effect concentration OF organic fluorine ORP oxygen reaction potential PBSF perfluorobutanesulfonyl fluoride PCI positive chemical ionisation PFCAs perfluoroalkyl carboxylates PFCs polyfluoroalkyl compounds PFPAs perfluoroalkyl phosphonates PFSAs perfluroalkyl sulfonates PFSiAs perfluroalkyl sulfinates PLE pressurised liquid extraction POCF perfluorooctanecarbonyl fluoride POPs persistent organic pollutants POSF perfluorooctanesulfonyl fluoride PP polypropylene PTFE polytetrafluoroethylene PUF polyurethane foam disk RSD relative standard deviation S/N signal to noise SAX strong anion exchange SLE solid-liquid extraction SPE solid-phase extraction SPM suspended particulate matter TBA tetrabutylammonium TF total fluorine TN total nitrogen TOC total organic carbon TOF time-of-flight U.S. EPA U.S. Environmental Prodection Agency ww wet weight WAX weak anion exchange WWTPs waste water treatment plants
The names and acronyms of the 40 target analytes, 20 IS and 1 InS are listed in Table 14.

List of tables
VI
List of tables
Table 1. Environmentally relevant groups of the ionic and neutral PFCs .............................................................. 2
Table 2. Physicochemical properties of PFOS potassium salt (K+) and PFOA (free acid) .................................... 5
Table 3. Overview of ∑FTOHs and ∑FASAs/FASEs concentrations in air (pg/m3) a ......................................... 12
Table 4. Overview of PFOS and PFOA concentrations in solid samples (ng/g) a ................................................ 15
Table 5. Overview of PFOS and PFOA concentrations in aqueous samples and potential sources (ng/L).......... 20
Table 6. Tissue distribution of PFOS and PFOA in wildlife (ng/g tissues ww and ng/mL for blood and bile) ....................................................................................................................................................................... 28
Table 7. Overview of PFOS and PFOA concentrations in human blood, milk (ng/mL) and liver (ng/g ww).............................................................................................................................................................. 31
Table 8. Overview of the BCFs, BMFs and BAFs of PFOS and PFOA .............................................................. 36
Table 9. Instrument detection limits (IDLs), method quantification limits (MQLs) and field blank concentrations for the German Bight survey in August 2007 a ............................................................................. 47
Table 10. Global comparison of PFOA and PFOS concentrations in seawater from the German Bight with coastal water studies from other areas .......................................................................................................... 52
Table 11. MDLs and MQLs for the dissolved phase, and field blank concentrations (dissolved and particulate phase) for cruises onboard the research vessels Maria S. Merian (FBs 15° W-52° W, n = 4 + 4) and Polarstern (FBs 46° N-26° S, n = 6 + 6) in the Atlantic Ocean (pg/L) a ....................................... 59
Table 12. Comparison of minimum and maximum PFC concentrations in surface open-ocean water with literature data (pg/L) a ................................................................................................................................... 63
Table 13. General informations of the four analysed harbor seals from the German Bight including the organ and tissue weights (g).................................................................................................................................. 69
Table 14. Analytes, acronyms, formula, supplier, purity, precursor and product ions for the MS/MS detection................................................................................................................................................................ 71
Table 15. Average concentration (ng/g wet weight), standard deviation (SD) and ranges of PFCs in different organs and tissues of harbor seals from the German Bight (n = 4)......................................................... 74
Table 16. Mean whole body burden and standard deviation for individual PFC in harbor seals from the German Bight in µg absolute (n = 4) .................................................................................................................... 76
Table 17. Average concentrations (ranges) of PFCs in liver tissue of harbor seals from the German Bight in ng/g ww................................................................................................................................................... 84
Table 18. Doubling times, half-lives (years ± 95% confidence interval) and statistical parameters based on the linear regressions of PFCs in liver tissue of harbor seals (Phoca vitulina) from the German Bight, 1999-2008 (≥ 7 month old, n = 44) ....................................................................................................................... 90
Table 19. Total estimated flux of individual PFCs in the dissolved and particulate phases in the river Elbe towards the North Sea a................................................................................................................................. 97
Table 20. Sampling parameters of the waste water treatment plants.................................................................... 98
Table 21. Concentration range for individual PFCs and ∑PFCs in ng/L (dissolved phase/particulate phases) for the Norwegian Sea, Norwegian coast, open North Sea, German coast, river Elbe and Baltic Sea ............................................................................................................................................................ 105

List of tables
VII
Table S1. Locations, sampling time and standard parameters of sampling for the German Bight survey from 1st to 9th August in 2007 a ......................................................................................................................... 139
Table S2. Concentrations and standard deviation of PFCs in ng per litre surface water from sampling station 1 to 16 in the German Bight a .................................................................................................................. 140
Table S3. Concentrations and standard deviation of PFCs in ng per litre surface water from sampling station 17 to 32 in the German Bight a ................................................................................................................ 141
Table S4. Concentrations and standard deviation of PFCs in ng per litre surface water from sampling station 33 to 48 in the German Bight a ................................................................................................................ 142
Table S5. Correlation coefficient of Pearson analysis of PFCs in the German Bight ........................................ 143
Table S6. Locations, sampling time and water temperature of water sampling from cruises of the research vessels Maria S. Merian (15° W-52° W) and Polarstern (46° N-26° S) in the Atlantic Ocean ........... 144
Table S7. Matrix spike recovery values of the IS and relative standard deviation (RSD) (%) for the dissolved and particulate phase determined at two different spiking levels (5 ng/L and 20 ng/L) ..................... 145
Table S8. Individual PFC concentrations (pg/L) for cruises of the research vessels Maria S. Merian (15° W-52° W) and Polarstern (46° N-26° S) in the Atlantic Ocean a ............................................................... 146
Table S9. Method blanks (blanks, n = 6), method detection limit (MDL, n = 3) and method quantification limit (MQL, n = 3) in ng/g wet weight......................................................................................... 147
Table S10. Absolute (subtraction of background concentration) as well as relative (IS and subtraction of background concentration) recovery values (%) of a seal liver spiked with 10 ng absolute (100 µL of a 0.1 µg/mL solution, n = 3) and allocation of IS for individual PFCs ............................................................... 148
Table S11. Matrix effect of PFCs in liver, kidney, lung, heart, blood, brain and muscle of harbor seals determined by analysis of a fortified extract with a 10 ng absulute PFC-mix (100 µL of a 0.1 µg/mL standard solution) a.............................................................................................................................................. 149
Table S12. Sample collection year, identification number (ID), age, total weight, liver weight, sex, nutritional status, general health status and lesions in the liver of harbor seals collected from the German Bight...................................................................................................................................................... 150
Table S13. Quality assurance of the extraction of harbor seal livers: Instrument detection limits (IDL), method quantification limits (MQL), recoveries of spiked liver extracts, matrix effect and allocation of the IS ................................................................................................................................................................... 152
Table S14. Correlation coefficient of Pearson analysis of all detected PFCs in ≥ 7 month old harbor seals from 1988 to 2008 ...................................................................................................................................... 153
Table S15. Sampling locations, time, turbidity, oxygen content, pH-value, conductibility, water temperature, salinity, and river discharge at the sampling day ........................................................................... 154
Table S16. Locations, time and standard parameters of sampling for the river Elbe survey on 10th June 2007 .................................................................................................................................................................... 155
Table S17. Locations, sampling time, water temperature and salinity of water sampling in the German Bight (1-22), Baltic Sea (A-R) and North and Norwegian Sea (I-VI) in 2007.................................................... 156
Table S18. Sampling location, sampling date and basic parameters of sediment core A from Tokyo Bay, Japan ................................................................................................................................................................... 157
Table S19. Sampling location, sampling date and basic parameters of sediment core B from Tokyo Bay, Japan ................................................................................................................................................................... 158158

List of figures
VIII
List of figures
Figure 1. Electrochemical fluorination (ECF) and telomerisation ......................................................................... 3
Figure 2. The total global POSF production volume of the 3M Company (1970-2002) (green line) was compared to estimates from Paul et al. 2009 (red line), Prevedouros et al. 2006 (blue line), and Smithwick et al. 2006 (yellow line). Reproduced from Paul et al. 2009................................................................. 4
Figure 3. Environmental behaviour of PFCs from production/usage (red) to the plants (green) and organism (yellow). Note: The atmospheric pathway is not shown ......................................................................... 6
Figure 4. Concentrations (minimum, maximum, median (circles)) of PFOA and PFOS in seawater in the open-ocean and the coastal area in pg/L ((a) Wei et al. 2008, (b) Yamashita et al. 2005, (c) Theobald et al. 2007b, (d) publication II, (e) Caliebe et al. 2004, (f) publication I, (g) So et al. 2004, (h) Ju et al. 2008 and (i) Taniyasu et al. 2003). Note: Concentrations below the method quantitation limit are given as 0.5 of the method detection limit ...................................................................................................................... 23
Figure 5. Hepatic concentrations (minimum, maximum, mean (circles)) of PFOS in mammals from (a) Tomy et al. 2004a, (b) Leonel et al. 2008, (c) Kannan et al. 2001b, (d) Kannan et al. 2002b, (e) Van de Vijver et al. 2004, (f) Van de Vijver et al. 2003b, (g) Giesy and Kannan 2001, (h) Van de Vijver et al. 2005, (i) Van de Vijver et al. 2007, (j) Martin et al. 2004a, (k) Dorneles et al. 2008, (l) Nakata et al. 2006, (m) Law et al. 2008, (n) Kannan et al. 2002c, and (o) publication III (ng/g ww). Note: Concentrations below the method quantitation limit are given as 0.5 of the method detection limit.................... 24
Figure 6. Overview of temporal trends of PFOS and PFOA in wildlife from (a) Dietz et al. 2008, (b) publication IV, (c) Holmström et al. 2005, (d) Martin et al. 2004b, (e) Furdui et al. 2008, (f) Bossi et al. 2005a, (g) Verreault et al. 2007, (h) Hart et al. 2008a, (i) Butt et al. 2007b, (j) Ishibashi et al. 2008a, and (k) Butt et al. 2007a (ng/g ww) ............................................................................................................................. 34
Figure 7. Overview of temporal trends of PFOS and PFOA in humans from (a) USA (Olsen et al. 2005; Olsen et al. 2008), (b) Japan (Harada et al. 2007), (c) Norway (Haug et al. 2009), (d) USA (Spliethoff et al. 2008) and (e) Sweden (Kärrman et al. 2007) (ng/mL).......................................................................................... 35
Figure 8. Map showing the sampling locations in the German Bight .................................................................. 45
Figure 9. Spatial distribution of ΣPFCs and individual PFC concentrations in the German Bight in ng/L. Note: The different circle sizes at the sampling stations are in proportion to the concentration which is shown on the right side of each map ..................................................................................................................... 49
Figure 10. Relationship between concentrations of ΣPFCs, PFOS, PFOA and dissolved organic carbon (DOC) in surface water in the German Bight........................................................................................................ 50
Figure 11. Map showing the sampling stations of the Maria S. Merian (15° W-52° W, A-R) and Polarstern (46° N-26° S, 1-42) cruise in 2007. The yellow arrows display the main surface currents in the Atlantic Ocean................................................................................................................................................. 57
Figure 12. Individual PFC concentrations (pg/L) and ambient temperature are given from the Polarstern cruise (46° N-26° S, 1-42) in 2007...................................................................................................... 61
Figure 13. Individual PFC concentrations (pg/L) and ambient temperature are given from the Maria S. Merian cruise (15° W-52° W, A-R) in 2007......................................................................................................... 62
Figure 14. Correlations between PFNA and PFOA concentrations in surface water in the Atlantic Ocean ........ 66
Figure 15. PFC whole body burden distribution in percent and µg per tissue in brackets for harbor seals from the German Bight ......................................................................................................................................... 76
Figure 16. Tissue distribution of PFC burdens in harbor seals from the German Bight ...................................... 77
Figure 17. Composition profile of individual PFSAs, PFOSi and FOSA (A) and PFCAs (B) in habor seals (≥ 7 month old, n = 44)................................................................................................................................. 85
Figure 18. Comparison of individual PFCs in <7 month old (blue, n = 8) and ≥ 7 month old (red, n = 13) habor seals (Phoca vitulina) from 2006 and 2007 .......................................................................................... 87
Figure 19. Box-whisker plots showing ∑PFCs concentration (ng/g ww) in livers of ≥ 7 month old harbor seals classified in (A) ‘poor’ (n = 22), ‘moderate’ (n = 8) and ‘good’ (n = 9) general health status and

List of figures
IX
(B) ‘emaciated’ (n = 8), ‘moderate’ (n = 23) and ‘good’ (n = 13) nutritional status. Mean concentrations are indicated as a black circle, while the boxes show 25% and 75% percentiles and medians............................. 88
Figure 20. Temporal trends of eight PFCs in habor seals from the German Bight from 1999 to 2008. The plots display the geometric means (circles) and the median (squares) together with the individual analysis (small dots) and the 95% confidence intervals of the geometric means (≥ 7 month old, n = 44). Note: The linear regression of PFBS was calculated from 2000 to 2008.............................................................. 89
Figure 21. Temporal trends of PFOA and PFOS in harbor seal livers (this study), polar bear livers (Dietz et al. 2008), guillemot eggs (Holmström et al. 2005), lake trout homogenates (Martin et al. 2004b), melon-headed whale livers (Hart et al. 2008a), human serum (Olsen et al. 2005), thick-billed murre and northern fulmar livers (Butt et al. 2007a), and ringed seal livers from East Greenland (Bossi et al. 2005a) and Resolute Bay, Canada (Butt et al. 2007b).................................................................................. 91
Figure 22. Map showing the sampling locations in the river Elbe and the North Sea (a dam is located between sampling stations 21 and 22)................................................................................................................... 94
Figure 23. Sampling locations for surface water samples (white dots with numbers) and at the effluents of waste water treatment plants (red dots with letters) along the river Elbe, Germany......................................... 98
Figure 24. A: Discharge of ∑PFCs in g per day by the waste water treatment plant effluents (note: Logarithmic scale). B: Percentage composition of individual PFCs in the waste water treatment plant effluents .............................................................................................................................................................. 100
Figure 25. Estimated mass flow of ∑PFCs in g per day in surface water and waste water treatment plant effluents (A to I) along the river Elbe, Germany ................................................................................................ 102
Figure 26. Geographic locations of the water sampling sites in the North Sea, Norwegian Sea and Baltic Sea....................................................................................................................................................................... 103
Figure 27. Comparison of PFCA and PFOS concentrations determined by GKSS, Geesthacht and BSH, Hamburg in the North Sea using two different PFCs analysis techniques in the dissolved water phase (details are given in the text)............................................................................................................................... 104
Figure 28. Relationship between concentrations of PFBS and salinity in surface water in the Baltic Sea ........ 107
Figure 29. Relative composition of individual PFCs in surface water from selected sampling locations in the Norwegian Sea (I), North Sea (V, 1, 10), river Elbe (21) and Baltic Sea (C, O). Note: PFCs were distributed in the dissolved phase in the selected sampling locations, only PFOS was found in the dissolved (diss.) and particulate phase (part.). ‘Other PFCs’ include PFPS, PFHxS, PFPA, PFHxA, PFHpA, PFNA, PFDA, PFTeDA and NEtFOSE................................................................................................ 108
Figure 30. Map showing the sampling locations A and B in Tokyo Bay, Japan................................................ 109
Figure 31. Vertical profile of PFSAs, FOSA/ N-EtFOSAA and PFCAs in pore water and sediment in pg/cm3 from two sediment cores (A and B) collected from Tokyo Bay ............................................................. 111
Figure 32. Temporal trends of PFOS, FOSA, N-EtFOSAA, PFNA and PFUnDA in sediment core A from Tokyo Bay.................................................................................................................................................. 113
Figure 33. Dependence of PFOS, FOSA and PFUnDA concentrations in sediment on sediment fraction organic carbon (fOC) ............................................................................................................................................ 114
Figure S1. Relationship between concentrations of individual PFCs and dissolved organic carbon (DOC) in surface water in the German Bight...................................................................................................... 159
Figure S2. Relationship between concentrations of individual PFCs and suspended particulate matter (SPM) in surface water in the German Bight ...................................................................................................... 160
Figure S3. Chromatograms of PFBS, PFOS, PFHxA, PFHpA, PFOA, PFNA and FOSA in the dissolved phase for sampling location 12 and a typical blank sample from the cruise of the research vessel Polarstern (46° N-26° S) in the Atlantic Ocean....................................................................................... 161
Figure S4. Correlations between PFC concentrations in surface water in the Atlantic Ocean........................... 162
Figure S5. Sample locations of the collected habor seals in the German Bight, n = 63..................................... 163
Figure S6. Temporal trends of PFPS in ≥ 7 month old habor seals from the German Bight from 1999 to 2008. The plots display the geometric means (circles) and the median (squares) together with the individual analysis (small dots) and the 95% confidence intervals of the geometric means............................... 163


Introduction
1
1. Introduction
In this chapter is given an overview of polyfluoroalkyl compounds (PFCs). Firstly, the
background (1.1), production and usage (1.2) and properties and environmental
behaviour (1.3) of PFCs are described. Furthermore, an overview of the analytical methods for
PFC analysis is given (1.4). Special emphasis is placed on the environmental
concentrations (1.5) and temporal trends in biota (1.6), which represents the focus of this
Ph.D. thesis. Finally, the bioaccumulation and biomagnification potential, and the toxicology
of PFCs are described (1.7).
1.1 Background
The occurrence of PFCs has been reported the first time in human blood in 1968 by Taves
1968. Improvements of the analytical techniques during the 1990s, resulting in a
characterisation of the groups of PFCs in environmental samples, and made it possible, that
those PFCs were found around the globe in animals and humans (Giesy and Kannan 2001;
Olsen et al. 1999). These findings had the consequence that, in 2000, the 3M Company
voluntarily phased out the production of perfluorooctanesulfonyl fluoride (POSF), which is a
major precursor in the synthesis of several PFCs. Due to their high persistence (P),
bioaccumulation (B) and toxicity (T), perfluorooctanesulfonate (PFOS), can be classified as
PBT compounds (Brooke et al. 2004). In addition, PFOS is a candidate for persistent organic
pollutants (POPs) under the Stockholm Convention, caused by fulfilling the criteria persistent,
toxic, bioaccumulative and their potential for long-range transportation (UNEP 2009).
PFCs comprise a wide range of different substances, consisting of a hydrophilic functional
group and a hydrophobic fluorinated chain which can vary in chain length. The hydrophobic
part is fully or partially fluorinated and can be linear or branched. The most investigated
compounds are PFOS and perfluorooctanoic acid (PFOA). But there are several hundreds of
PFCs, which can divide into the ionic and neutral PFCs (Table 1). The ionic PFCs include the
perfluoroalkyl sulfonates (PFSAs), perfluroalkyl sulfinates (PFSiAs), fluorotelomer
sulfonates (FTS), perfluoroalkyl carboxylates (PFCAs), perfluoroalkyl phosphonates
(PFPAs), fluorotelomer carboxylates (FTCAs) and fluorotelomer unsaturated carboxylates
(FTUCAs).

Introduction
2
Table 1. Environmentally relevant groups of the ionic and neutral PFCs
Compound groups Acronym Chemical structure Typical PFCs
Ionic PFCs Perfluroalkyl sulfonates PFSAs
n = 3-9
Perfluroalkyl sulfinates PFSiAs
n = 5, 7, 9
x:2 Fluorotelomer sulfonates x:2 FTS
n = 5, 7, 9
Perfluoroalkyl carboxylates PFCAs
n = 1-17
Perfluoroalkyl phosphonates PFPAs
n = 5, 7, 9
Fluorotelomer carboxylates x:2 FTCA
n = 5, 7, 9
Fluorotelomer unsaturated carboxylates
x:2 FTUCA
n = 4, 6, 8
Neutral PFCs x:2 Fluorotelomer olefins x:2 FTolefin
n = 5, 7, 9, 11
x:2 Fluorotelomer alkohols x:2 FTOH
n = 3, 5, 7, 9, 11
x:2 Fluorotelomer acrylates x:2 FTA
n = 5, 7, 9
x:2 Fluorotelomer aldehydes x:2 FTAL
n = 7
Perfluoroalkyl sulfonamides FASAs
n = 7, R = H n = 7, R = CH3 n = 7, R = C2H5 n = 3, R = CH3
Perfluoroalkyl sulfonamidoethanols
FASEs
n = 7, R = CH3 n = 7, R = C2H5 n = 3, R = CH3
Perfluoroalkyl sulfonamidoacetic acids
FASAAs
n = 7, R = H n = 7, R = CH3 n = 7, R = C2H5

Introduction
3
Furthermore, the neutral PFCs comprise the fluorotelomer olefins (FTolefins),
fluorotelomer alcohols (FTOHs), fluorotelomer acrylates (FTAs), fluorotelomer aldehydes
(FTALs), perfluoroalkyl sulfonamides (FASAs), perfluoroalkyl sulfonamidoethanols (FASEs)
and perfluoroalkyl sulfonamidoacetic acids (FASAAs), which are currently discussed as
precursors of the ionic PFSAs and PFCAs (D'eon et al. 2006; Ellis et al. 2004; Martin et al.
2006).
1.2 Production and usage
PFCs are manufactured basically by two synthesis routes, which are illustrated in
Figure 1. The first production process, the electrochemical fluorination (ECF), was invented
in the early 1940s by Joseph Simons of the 3M Company (Simons 1950). The ECF is a free-
radical process and yields a product mixture of linear and up to 30% branched isomers with
even and odd numbers of carbon atoms in the chain (Giesy and Kannan 2002). The basic units
of this process, perfluorooctanecarbonyl fluoride (POCF) and POSF, can convert in various of
polymeric sale products (Kissa 2001). The second manufacturing process, the telomerisation,
is used since the 1950s and produced exclusively linear and even-chained homologues like
the FTOHs (Schultz et al. 2003). The longer-chained PFCs (C ≥ 3) are exclusively man-made
chemicals, whereas trifluoroacetic acid (TFA) has also natural sources (Frank et al. 2002).
Figure 1. Electrochemical fluorination (ECF) and telomerisation manufacturing processes for PFCs
It exist only a few data about the production volume of PFCs. The 3M Company, the
major producer of POSF, increased their production volume from around 300 tonnes in 1970
to over 3600 tonnes in 2000. In 2000, the 3M Company started to phase out the production of
POSF. Because of the production stop by the 3M Company, Prevedouros et al. 2006 and
Smithwick et al. 2006 suggested that the total global POSF production volume will decrease
to zero after 2003. Conversely, Paul et al. 2009 assumed a production volume of 1000 tonnes

Introduction
4
after 2003, because of the continuously production of POSF in Southeast Asia (Figure 2; Paul
et al. 2009; Prevedouros et al. 2006; Smithwick et al. 2006). In 2003, the 3M Company
substituted their POSF-based products by perfluorobutanesulfonyl fluoride (PBSF) (Newsted
et al. 2008), because of the lower bioaccumulation potential (Martin et al. 2003b). But the
production volume of the short chain PFBS is unknown. The European Union (EU) formed a
directive in October 2006, which prohibits the general use of PFOS and their derivates from
June 2008 (European Parliament and Council 2006).
The global historical production of PFCAs were estimated to be 4400-8000 tonnes (1951-
2004) (Prevedouros et al. 2006), which was lower than the POSF-based production. The
annual production of FTOHs, using the telomerisation manufacturing process, was estimated
to be 5000 tonnes between 2000-2002 (Betts 2003), and increased to 11000-14000 tonnes per
year after 2002 (Dinglasan-Panlilio and Mabury 2006). In 2006, the U.S. Environmental
Protection Agency (U.S. EPA) launched a voluntary stewardship program to reduce PFOA
and related chemicals from facility emissions and product content by 95% by 2010, and to
work toward elimination of emissions and content by 2015 (U.S. EPA 2006).
Figure 2. The total global POSF production volume of the 3M Company (1970-2002) (green line) was compared to estimates from Paul et al. 2009 (red line), Prevedouros et al. 2006 (blue
line), and Smithwick et al. 2006 (yellow line). Reproduced from Paul et al. 2009
Because of their unique physicochemical properties due to their combination of lipophilic
and hydrophilic characteristics, PFCs have been widely used in lots of consumer products for

Introduction
5
over 50 years (Kissa 2001). Their surfactant properties make them suitable for aqueous fire
fighting foams (AFFFs) while their lipid-and-water-repellent properties serve as stain
repellents on carpets, textiles, leather, home furnishing, paper products, non-stick cookware
and any kind of cleaning products. In addition, PFCs are also applied by metal plating,
photographic, lubricants, varnishers, gasoline, and hydraulic fluids (Paul et al. 2009). In 2000,
3M reported that POSF-based products were used for coatings on paper and packing products
(USA: 41%, EU: 33%), impregnation of textiles, leather and carpets (USA: 37%, EU: 49%),
ingredients in industrial surfactants, additives and coatings (USA: 10%, EU: 15%), and
AFFFs (USA: 3%, EU: 3%) (Schultz et al. 2003).
1.3 Properties and environmental behaviour
The physicochemical properties of PFCs are very limited, which makes the prediction of
their environmental behaviour by modelling difficult. PFCs are very persistent, because of the
strong bonding between the carbon and fluorine atom (> 450 kJ/mol) and the shielding of the
carbon by the fluorine atoms. As a result PFSAs and PFCAs are resisted against degradations
by acids, bases, oxidants, reductants, photolytic processes, microbes, and metabolic processes
(Kissa 2001). In addition, PFCs are both lipophilic and hydrophilic, whereby they are surface
active and can reduce the surface tension. These properties are very useful for the industry,
but the persistency is also the reason for their global distribution in the environment (Key et
al. 1997).
PFCAs and PFSAs have high water solubility, low pKa values and therefore dissociated at
environmental relevant pH values. Because of the low vapour pressure of the ions, they will
be primarily found in water or bound to particles, sediment and soil (Brooke et al. 2004; Kissa
2001; Prevedouros et al. 2006). The physicochemical properties of the potassium salt of
PFOS and PFOA are listed in Table 2.
Table 2. Physicochemical properties of PFOS potassium salt (K+) and PFOA (free acid)
Property PFOS K+ PFOA Reference
Molecular weight 538 g/mol 414.1 g/mol Vapour pressure 3.31 x 10⁻⁴ Pa (20 °C) 4.2 Pa (25 °C) Brooke et al. 2004; Kaiser et al. 2005Water solubility 519 mg/L (20 °C) 4.1 g/L (22 °C) Brooke et al. 2004; U.S. EPA 2005Melting point > 400 °C 45-50 °C Brooke et al. 2004; U.S. EPA 2005Boiling point n.a. 189-192 °C U.S. EPA 2005 Log KOC 2.57 2.06 Higgins and Luthy 2006 pKa -3.27 2.8 Kissa 2001; Brooke et al. 2004
n.a. = not available.

Introduction
6
The neutral PFCs are less persistent than the PFSAs and PFCAs and can be transformed
by hydrolysis, photolysis and biodegradation (Smart 2001). A biotransformation of FASAs
and FASEs to PFOS was observed in rainbow trout (Onchorhynchus mykiss) liver
microsomes (Tomy et al. 2004b) and activated sludge experiments (Boulanger et al. 2005b;
Rhoads et al. 2008). In addition, the neutral PFCs have a higher vapour pressure and lower
water solubility in comparison to the PFSAs and PFCAs, which make a long-range
atmospheric transport for volatile neutral PFCs possible (Lei et al. 2004; Stock et al. 2004a).
Smog chamber experiments have shown that FTOHs can degrade by OH-initiated oxidation
pathway, with the intermediates FTALs, FTCAs and FTUCAs, to PFCAs in the atmosphere
(Ellis et al. 2004), while a lifetime of approximately 20 days for the FTOHs was estimated
(Ellis et al. 2003). Furthermore, in laboratory studies was found that FASEs and FASAs can
degrade to PFSAs and PFCAs in the atmosphere (D'eon et al. 2006; Martin et al. 2006). A
lifetime of approximately 2 days for n-methylperfluorobutane sulfonamidoethanol (MeFBSE)
and > 20 days for n-methylperfluorobutane sulfonamide (MeFBSA) was supposed (D'eon et
al. 2006).
Different pathways of PFCs in the environment are possible. Volatile PFCs can be
transported by the atmosphere (see above), while ionic PFCs can be enter the environment
directly. From the product manufacturing processes, supply chains, product use, and disposal,
PFCs can be released into the aquatic environment. Sources are supposed to be dry and wet
deposition, industrial and domestic waste water treatment plants (WWTPs), landfill sites, and
runoff from contaminated sites (Boulanger et al. 2005a; Ellis et al. 2004; Kallenborn et al.
2004; Kim and Kannan 2007; Loewen et al. 2005; Moody and Field 1999; Stock et al. 2007).
The proposed pathway of PFCs from the production and usage to the aquatic and land animals
are shown in Figure 3.
Figure 3. Environmental behaviour of PFCs from production/usage (red) to the plants (green) and organism (yellow). Note: The atmospheric pathway is not shown

Introduction
7
The transportation pathways of individual PFCs to remote regions have not been
conclusively characterised to date. Two main hypothesis were proposed for the global
transportation of PFCs. Firstly, neutral, volatile precursor compounds could undergo long-
range atmospheric transport and be degraded in remote regions (Ellis et al. 2004) or secondly
ionic PFCs could be transported directly by oceanic currents or by means of sea-spray
(McMurdo et al. 2008; Prevedouros et al. 2006).
1.4 Analytical methods
Historical analytical methods for the determination of PFCs are based on combustion and
mineralisation methods. One of the first method is the “Wickbold method” which convert
organic fluorine (OF) to soluble fluorine by combustion (Wickbold 1954). This method is
non-specific and OF can not be detected separately. Another non-specific method for human
serum determined the presence of CF2 and CF3 using the 19F nuclear magnetic resonance
(NMR) method (Taves 1968). Ellis et al. 2000 developed a 19F NMR method including a gas
chromatography coupled with mass spectrometry (GC-MS) confirmation for the analyses of
short-chain PFCs in precipitation. The advantages of the 19F NMR method are well resolved
peaks, low maintenance expense and lack of matrix interferences (Kissa 2001).
The GC method is suitable for volatile PFCs using GC-MS with chemical ionisation (CI)
(Martin et al. 2002). In addition, ionic PFCs can be analysed via GC by derivatisation of the
compounds before measuring (Belisle and Hagen 1980; Henderson et al. 2007). Belisle and
Hagen 1980 analysed PFOA in biological samples after derivatisation with diazomethane
using GC coupled to an electron capture detector (ECD). Moody and Field 1999 determined
PFCAs in groundwater after derivatisation with methyl iodide using GC/MS with an electron
impact (EI) ionisation.
Hansen et al. 2001 developed a compound-specific method for PFCs in biological
matrices using high performance liquid chromatography coupled with a tandem mass
spectrometry operated in a negative electrospray mode (HPLC/(-)ESI-MS/MS). In addition, a
confirmation of the exact mass was achieved by a high resolution time-of-flight (TOF)-MS.
Berger et al. 2004 compared three different detection possibilities, i.e., ion trap MS, TOF-MS
and triple-quadrupole MS. The TOF-MS had the best selectivity and sensitivity, but it lacked
the possibilities of a triple-quadrupole MS. Alternatively, an atmospheric pressure photo
ionisation (APPI) source was used by Takino et al. 2003. The application of an atmospheric
pressure chemical ionisation (APCI) is not described for PFCs.
Recently a method for the determination of the total fluorine (TF), followed by
fractionation of the samples to determine inorganic fluorine (IF) and OF separately, was

Introduction
8
developed (Miyake et al. 2007a; Miyake et al. 2007b). The method based on the combustion
ion chromatography (CIC) with the further development to analysed TF in low µg/L levels in
aqueous and biological matrices by reducing the high background levels. This studies showed
that the major contribution of the OF fraction is unknown (60-90%) indicating the presence of
other PFCs in addition to the known PFCs.
In general, the most frequently instrumental method for volatile PFCs is the GC/CI-MS,
while for ionic and neutral PFCs the HPLC/(-)ESI-MS/MS is mostly used (Jahnke and Berger
2009; Villagrasa et al. 2006). Over the years the detection limits, trueness, precision, and
robustness for the analysis of PFCs in different matrices have been improved (Van Leeuwen
and De Boer 2007; Van Leeuwen et al. 2006; Van Leeuwen et al. 2009). However, isotope-
labelled internal standards (IS) should be used to check any signal enhancement/suppression
or losses during sample preparation and analysis. The current sample preparation techniques
for air, biological, aqueous and solid matrices are described in the following.
Air
The original method for the determination of FTOHs, FASAs and FASEs were described
by Martin et al. 2002 using GC/CI-MS and HPLC/(-)ESI-MS/MS. The air samples were
collected by high-volume air samplers enriched on glass-fibre filters (GFFs, particle phase)
and polyurethane foam disk (PUF)/XAD-2 cartridges (gas phase). The extraction was done by
shaking of the GFFs for the particle phase and by elution of the cartridges at room
temperature for the gas phase. The analytical method was further optimised and validated
including a larger number of target analytes and IS (Dreyer et al. 2008; Jahnke et al. 2007a).
Moreover, Sasaki et al. 2003 described firstly the analysis of PFOS in airborne particulate
matter.
Shoeib et al. 2005 determined neutral PFCs in indoor and outdoor air using passive air
samplers with PUF disks. The method was further optimised for more volatile PFCs like
FTOHs using sorbent-impregnated PUF disks (Shoeib et al. 2008). The advantage of passive
air samplers in comparison to active air samplers is that they are inexpensive, simple and do
not require electricity or skilled labour for operation. However, the results of passive air
samplers should be checked against active air sampler.
Biological matrices
Ylinen et al. 1985 developed an ion pairing extraction (IPE) method with
tetrabutylammonium (TBA) for plasma and urine samples using GC/flame ionisation
detection (FID) or GC/EI-MS. This method was further optimised for environmental
concentrations in biological matrices by Hansen et al. 2001 using HPLC/(-)ESI-MS/MS.

Introduction
9
Since then, several extraction and clean-up techniques were developed for biological matrices
which are described in the following.
Taniyasu et al. 2005 applied a solid-phase extraction (SPE) method using weak anion
exchange (WAX) cartridges. Prior SPE the tissues were digested in potassium hydroxide and
diluted in water. Flaherty et al. 2005 developed a protein precipitation sample preparation in
acetonitrile using 96-well plates. Powley et al. 2005 developed a matrix-effect free extraction
method for PFCAs using solid-liquid extraction (SLE) with methanol and a clean-up of the
extract using bulk Envi-Carb® sorbent (purchased from Supelco). De Silva and Mabury 2006
described a method to analyse volatile derivates of PFCAs in human blood using GC/MS via
negative chemical ionisation (NCI).
Berger and Haukas 2005 described a screening method for PFCs in liver samples.
Basically, the compounds were extracted from homogenised samples by SLE and were
injected directly into a HPLC/(-)ESI-TOF-MS system. The limit of detection (LODs) are
similar to the IPE method but longer-chained PFCs and perfluorooctane sulfonamide (FOSA)
can not covered by the screening method.
Comparable results for the IS of PFOS, PFOA and perfluorononanoic acid (PFNA) were
obtained from three different extraction techniques (i.e., IPE, SPE, and protein precipitation
sample preparation) in blood samples when matrix-matched calibration was used in
quantification (Reagen et al. 2008). In contrast, quantification of IPE data using solvent based
calibration curve resulted in significant analytical errors for all target analytes.
Aqueous matrices
Moody and Field 1999 described the first method for PFCAs in contaminated groundwater
samples using SPE with strong anion exchange (SAX) disks. After the SPE the extracts were
derivatised and analysed by GC/EI-MS. The sensitivity was further improved for the
determination of PFCAs and PFSAs in surface water by using HPLC/(-)ESI-TOF-MS and 19F-NMR (Moody et al. 2001).
Yamashita et al. 2004 described the problematic of background levels due to procedural
and instrumental blank contaminations. The sources of contamination were identified and
eliminated which made it possible to detect low pg/L levels in ocean waters. Taniyasu et al.
2005 further optimised the SPE method using Oasis® WAX cartridges and determined a wide
range of PFCs including short and long-chained PFCs.
González-Barreiro et al. 2006 developed a liquid-liquid extraction (LLE) method using
methyl tert-butyl ether (MTBE) for aqueous samples. But the LLE is limited for longer-
chained PFCs (C ≥ 8), but usually the shorter-chained PFC dominated in water samples.
However, the extraction is generally done by SPE using C18 or anion exchange materials for

Introduction
10
the enrichment. Scott et al. 2006a analysed PFOA by high-volume extraction on XAD-7 resin
using 20-50 L water samples and subsequent derivatisation and GC/MS analysis. Another
high-volume extraction method was described by Theobald et al. 2007a using HR-P resin and
HPLC/(-)ESI-MS/MS analysis. On the other hand, Schultz et al. 2006a analysed waste water
samples by large-volume injection (500 µL) using HPLC/(-)ESI-MS/MS. In general, the
MDLs for the direct injection method are higher than for SPE, but further improvements of
the instrument sensitivity will make this method applicable for routine analysis.
Solid matrices
Different methods have been developed for solid matrices like sediment, soil, sludge, dust,
food and consumer products using mostly HPLC/(-)ESI-MS/MS. Schröder 2003 described
three different extraction methods (i.e., soxhlet extraction, hot steam extraction, and
pressurised liquid extraction (PLE)) for PFCs in sewage sludge. The PLE method resulted in
the most efficient extraction method, however, no PFCs were detected in the 80 analysed
sewage samples. Powley et al. 2005 developed a matrix-effect free extraction method for
PFCAs in sediment, soil and sludge (see above), resulting in limits of quantitation (LOQ) of
1 ng/g dry weight. The method is characterised by their simplicity, robustness and selectivity,
and therefore the method is widely used. Higgins et al. 2005 determined PFCs in sediment
and sludge samples by sonication with a solvent mixture of 90:10 (v/v) methanol and 1%
acetic acid in water and subsequently clean-up with C18 SPE cartridges. Washington et al.
2007, 2008 compared eight combinations of sample extraction pretreatments, extractions and
clean-up steps on three test soils. The final method included alkaline pre-treatment, extraction
with acetonitrile and water, and an IPE cleanup step.
Moriwaki et al. 2003 published an analytical method for PFOS and PFOA in vacuum
cleaner dust. The extraction was done by ultrasonic extraction with methanol. Another
method for vacuum cleaner dust was described by Shoeib et al. 2005 using soxhlet extraction
with dichloromethane.
Tittlemier et al. 2005 described a SLE method for different food samples using hexane and
acetone (2:1, v/v), followed by a silica gel column clean-up and analyses by GC/MS via
positive chemical ionisation (PCI). Gulkowska et al. 2006 determined PFCs in food by using
a modified IPE method from Hansen et al. 2001. Fromme et al. 2007b used for the analysis of
PFCs in several food samples a combination of an ultrasonic extraction method and
subsequent SPE clean-up described by Taniyasu et al. 2005.
Several methods are described for the determination of PFCs in different consumer
products (i.e., textile, carpets, cookware, food packaging, and other polymeric and surfactant
materials) (Larsen et al. 2006; Mawn et al. 2005; Sinclair et al. 2007; Stadalius et al. 2006).

Introduction
11
An inventive method determined FTOHs and n-methyl perfluorooctane sulfonamidoethanol
(MeFOSE) in industrially applied polymeric and surfactant materials by purging of these
materials using a constant flow and trapping them on XAD resin (Dinglasan-Panlilio and
Mabury 2006). The XAD resin was extracted with ethyl acetate and analysed using
GC/PCI-MS.
1.5 Environmental concentrations
1.5.1 PFC levels in air
The first concentration levels of neutral PFCs in air were reported from Martin et al. 2002
in Canada using high-volume air samplers. ∑FTOHs and ∑FASAs/FASEs concentrations
were higher at an urbanised site (Toronto, 171 and 320 pg/m3, respectively), in comparison to
a rural site (Long Point, 78 and 111 pg/m3, respectively). Another study in six North
American cities found a specific distribution pattern of the detected PFCs depending on the
sampling sites, which indicates the importance of point sources for the spatial distribution of
these compounds (Stock et al. 2004b). The concentrations of FTOHs and FASAs/FASEs in
air around the globe is summarised in Table 3.
Shoeib et al. 2004a investigated PFCs in indoor and outdoor air. Concentrations of FASEs
in indoor air were 10 to 100 times higher in comparison to outdoor air, which indicates the
indoor air as a source to the outside environment. Passive air samplers consisting of PUF were
effective to conduct indoor and outdoor surveys (Shoeib et al. 2005).
In the particulate phase both ionic and neutral PFCs were detected (Boulanger et al.
2005a; Jahnke et al. 2007c). Jahnke et al. 2007b described a significant correlation between
the ambient temperature and the partitioning of FASEs in the gaseous and particulate phase,
while FTOHs and FASAs were almost exclusively found in the gaseous phase. Ionic PFCs
were found at several locations in European (Barber et al. 2007) and Atlantic Ocean air
(Jahnke et al. 2007c). These findings suppose a direct atmospheric transportation of ionic
PFCs on particles.
Jahnke et al. 2007c published airborne PFC concentrations in a latitudinal transect
between Bremerhaven, Germany (53° N) and Cape Town, Republic of South Africa (33° S).
The maximum concentration was found for 8:2 FTOH (290 pg/m3) in the channel between
France and UK, while towards South Africa the concentration of 8:2 FTOH decreased to
2.0 and 2.8_pg/m3, respectively. These decreasing latitudinal gradient from the European
continent towards South Africa indicate the industrial regions as potential sources for PFCs
and transportation of PFCs through the inner tropical convergence zone (ITCZ). An
altitudinal transect from 1300 m to 2740 m above sea level was reported from Loewen et al.

Introduction
12
2008. The increasing concentrations of FTOHs and FASAs with the altitude were explained
with the increasing uptake capacity of the resign at lower temperatures.
Table 3. Overview of ∑FTOHs and ∑FASAs/FASEs concentrations in air (pg/m3) a
Location Inhabitants∑FTOHs ∑FASAs/FASEs Reference
Toronto, ON (n=4) 2 480 000 171 b 320 b Martin et al. 2002Long Point, ON (n=2) 500 78 b 111 b Griffin, GA (n=5) 23 500 148 (49-224) 403 (57-1549) Stock et al. 2004bCleves, GA (n=3) 2 200 132 (103-181) 69 (<MDL-134) Long Point (n=3) 500 26 (<MDL-52) 48 (29-65) Toronto, ON (n=3) 2 480 000 165 (113-213) 95 (31-211) Reno, NV (n=3) 180 500 76 (51-93) 291 (157-491) Winnipeg, MB (n=3) 685 900 11 (<MDL-18) 22 (15-32) Toronto, ON (n=2) 2 480 000 n.a. 33 (24-41) Shoeib et al. 2004bOttawa, ON (n=7) 780 000 n.a. 171 (156-205) Shoeib et al. 2005Lake Erie (n=5) - n.a. 2.0 (n.d.-3.2) Lake Ontario (n=3) - n.a. 1.3 (n.d.-1.9)
Boulanger et al. 2005a
Arctic atmosphere (n=20) - 25 b 15 b Shoeib et al. 2006Toronto, ON (n=3) 2 480 000 81 b 15 b Hamburg, Germany (n=7) 1 740 000 288 (150-546) 68 (29-151) Jahnke et al. 2007bWaldhof, Germany (n=4) 20 181 (64-311) 34 (12-54) North Sea (n=1) - 379 c 34 c Jahnke et al. 2007cNorth Atlantic Ocean (n=4) - 46 (28-49) c 6.4 (2.7-11) c South Atlantic Ocean (n=3) - 7.8 (3.3-16) c 0.8 (0.5-1.2) c Hazelrigg, UK (n=2+10) - 269, 110 57 b, 73 b Barber et al. 2007Manchester, UK (n=2+2) 458 000 535 b, 381 69, <MQL Kjeller (Oslo), Norway (n=1) 573 000 63 89 Mace Head, Ireland (n=4) - 19 <MQL Sakyo (Kyoto), Japan (n=10) 1 465 000 644 (68-1959) n.a. Oono et al. 2008 Higashiyodogawa (Osaka) (n=10) 2 636 000 818 (270-1183) n.a. Morinomiya (Osaka) (n=4) 2 636 000 2316 (364-5006) n.a. German Bight (n=5) - 38 (53-17) 30 (16-60) Hamburg, harbour, Germany (n=1) 1 740 000 180 18 Hamburg, Barsbüttel, Germany (n=3) 1 740 000 117 (81-204) 16 (12-22) Geesthacht, Germany (n=5) 29 000 116 (32-192) 18 (4.9-32)
Dreyer and Ebinghaus 2009
a Sum of gas phase and particle air concentrations; minimum and maximum concentrations are given in brackets; n.d. = not detected; n.a. = not analysed; <MDL = below method detection limit; <MQL = below method quantitation limit; b sum of mean values; c mean values of duplicate samples.

Introduction
13
1.5.2 PFC levels in solid samples
An overview of PFCs in solid samples including consumer products, food, dust, sediment
and WWTP sludge is given in Table 4 and is described in the following.
Consumer products
PFCs are used for various consumer products but only a little is known about their content
and composition profile. The Danish Product Registry identified 92 different PFCs in
consumer product, of which 11 were registered with a amount of over 100 kg in use in
Denmark (Poulsen et al. 2008). Washburn et al. 2005 investigated the exposure of PFOA in
selected consumer articles, including upholstery, textiles, sealants, garments, waxes, paints
and cleaners. The maximum concentration of PFOA was found in treated apparel and home
textiles (1.4 mg/kg article). Dinglasan-Panlilio and Mabury 2006 found that 0.04-3.8% (dry
mass basis) of residual FASEs can left the manufacturing process of fluorinated polymers and
can be potentially released into the environment.
Food
The analysis of PFCs in various food samples from Canada was carried out from
Tittlemier et al. 2005, 2006. FASAs were detected in pg/g wet weight (ww) to low ng/g ww
range, whereas highest concentration was found in fish, fast food and food prepared in
packaging. These results were considered to indicate food as a potential exposure route of
PFCs to humans (see chapter 1.7.3). Other studies investigated PFCAs and PFSAs in food
samples and found PFOS and PFOA most frequently (Ericson et al. 2008; Tittlemier et al.
2007).
PFCs in seafood was investigated in different species in Europe (Hoff et al. 2003a;
Kallenborn et al. 2004; Van de Vijver et al. 2003b), Asia (Nakata et al. 2006; Taniyasu et al.
2003) and North America (Furdui et al. 2007; Martin et al. 2004b) (for details see
chapter 1.5.4). Del Gobbo et al. 2008 analysed PFCAs and PFSAs in raw and cooked fish
samples. Interestingly, they found reduced PFC concentrations after cooking, however, it is
possible that the extraction efficiency is lower for cooked fish and/or PFCs were lost by
cooking residues.
Dust
Moriwaki et al. 2003 determined PFOS and PFOA in vacuum cleaner dust samples from
homes in Japan in a range of 11 to 2500 ng/g dry weight (dw) and 69 to 3700 ng/g dw,
respectively. Kubwabo et al. 2005 observed a positive correlation between the PFC
concentration levels in dust and the using of carpeting from homes in Canada. Concentrations
Introduction
14
of neutral PFCs (i.e., MeFOSE and n-ethyl perfluorooctane sulfonamidoethanol (EtFOSE))
were found in high concentrations of up to 8860 ng/g dw for MeFOSE and 75440 ng/g dw for
EtFOSE in indoor dust samples from homes in Canada (Shoeib et al. 2005). Another study
investigated FTOHs, PFCAs and PFSAs in indoor dust samples from homes in USA (Strynar
and Lindstrom 2008). Maximum concentrations were found from perfluorohexane sulfonate
(PFHxS) (35700 ng/g dw) and PFOS (12100 ng/g dw), while FTOHs and PFCAs were
determined in a similar concentration range of tens to hundreds ng/g dw. The high
concentrations of PFCs in indoor dust suggest that dust could be an important pathway for
human exposure (see chapter 1.7.3).
Murakami and Takada 2008 investigated PFCs in fine (<63 µm) and coarse (63-2000 µm)
street dust in residential areas and heavily trafficked areas in Tokyo, Japan. Significantly
higher concentrations were observed in heavily trafficked areas in comparison to residential
areas in the fine fraction. In addition, in heavily trafficked areas the PFC concentrations were
significantly higher in the fine fraction in comparison to the coarse fraction. The street dust
could be possibly the origin of the contamination of the street runoff, which could enter the
water.
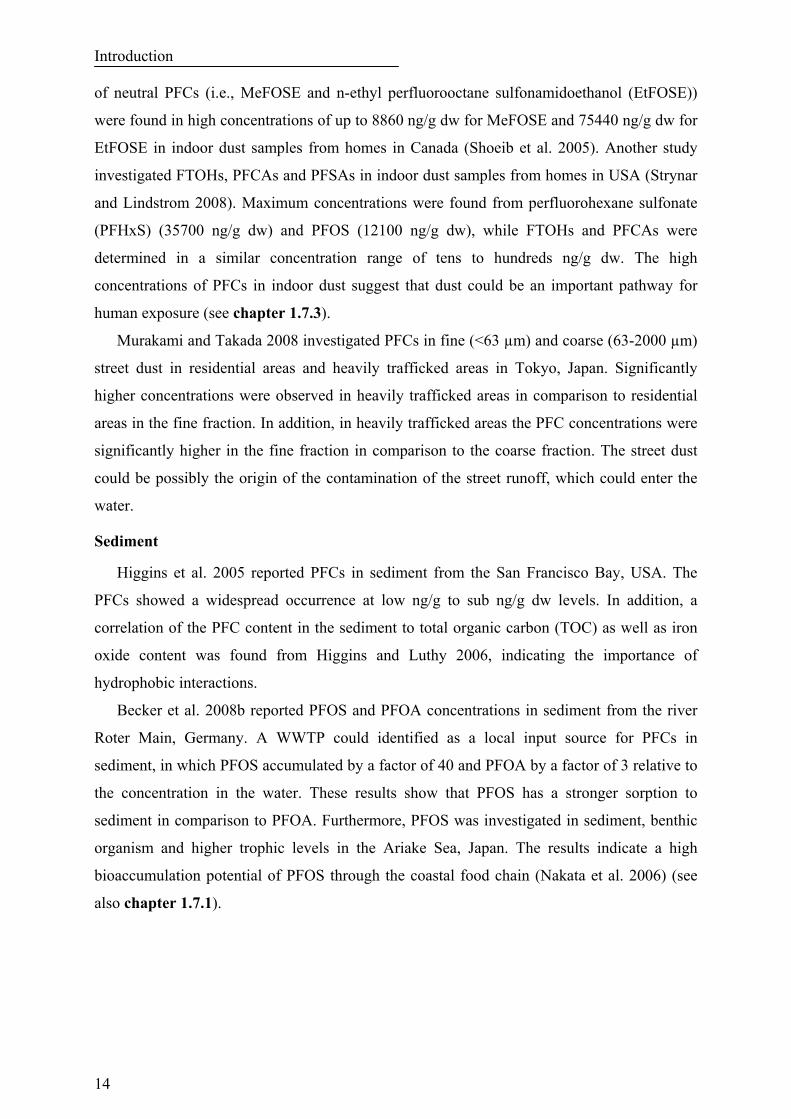
Sediment
Higgins et al. 2005 reported PFCs in sediment from the San Francisco Bay, USA. The
PFCs showed a widespread occurrence at low ng/g to sub ng/g dw levels. In addition, a
correlation of the PFC content in the sediment to total organic carbon (TOC) as well as iron
oxide content was found from Higgins and Luthy 2006, indicating the importance of
hydrophobic interactions.
Becker et al. 2008b reported PFOS and PFOA concentrations in sediment from the river
Roter Main, Germany. A WWTP could identified as a local input source for PFCs in
sediment, in which PFOS accumulated by a factor of 40 and PFOA by a factor of 3 relative to
the concentration in the water. These results show that PFOS has a stronger sorption to
sediment in comparison to PFOA. Furthermore, PFOS was investigated in sediment, benthic
organism and higher trophic levels in the Ariake Sea, Japan. The results indicate a high
bioaccumulation potential of PFOS through the coastal food chain (Nakata et al. 2006) (see
also chapter 1.7.1).

Introduction
15
Table 4. Overview of PFOS and PFOA concentrations in solid samples (ng/g) a
Country PFOS PFOA Other PFCs Remarks Reference
Consumer products USA n.a. n.d.-1.4 n.a. mg/kg article,
various products Washburn et al. 2005
Food China 0.33-14 n.d.-1.67 PFHxS; C6, C7, C9-
C11 PFCA ww, seafood
Gulkowska et al. 2006
Canada <MQL-2.7 <MQL-2.6 PFNA ww, beef, fish Tittlemier et al. 2007 <MQL 3.6 PFHpA ww, popcorn Germany 0.03-1.0 0.03-118 PFHxS; PFHxA ww, total diet Fromme et al. 2007b Spain <MQL-0.65 <MQL-0.06 PFHpA ww, various
food Ericson et al. 2008
Canada <MQL-1.68 <MQL-1.59 C9-C12, C14 PFCA ww, raw/ cooked seafood
Del Gobbo et al. 2008
Dust Japan 11-2500 69-3700 n.a. dw, vacuum
cleaner dust Moriwaki et al. 2003
Canada n.d.-5065 n.d.-1234 PFHxS dw, vacuum cleaner dust
Kubwabo et al. 2005
Japan <MQL-8.1 1.2-11 PFNA; PFDA; PFUnDA
dw, fine/ coarse street dust
Murakami and Takada 2008
USA <MQL-12100 <MQL-1960 6:2, 8:2, 10:2 FTOH; PFBS; PFHxS; C6, C7, C9-C12 PFCA
dw, vacuum cleaner dust
Strynar and Lindstrom 2008
Sediment USA n.d.-3.76 n.d.-0.25 PFHxS; PFDS; C9-C12,
C14 PFCA; FOSAA; Me-, EtFOSAA
dw Higgins et al. 2005
Japan 0.09-0.14 0.84-1.1 PFHxS ww Nakata et al. 2006 Japan <MQL-11 <MQL-3.9 FOSA; PFDoA dw Senthilkumar et al. 2007Germany <MQL-175 <MQL-506 n.a. dw, WWTP site Becker et al. 2008b
WWTP sludge USA 14.4-2610 <MQL-29.4 PFHxS; PFDS; C9-C12,
C14 PFCA; FOSAA; Me-, EtFOSAA
dw Higgins et al. 2005
USA 18-160 <MQL-12 PFHxS; PFDS; C9-C12, C14 PFCA; Me-, EtFOSAA
dw Schultz et al. 2006b
USA <MQL-65 18-241 PFDA; PFUnDA dw Sinclair and Kannan 2006USA 8.2-993 8.3-178 C9-C12 PFCA;
FOSA dw Loganathan et al. 2007
Germany n.d.-120 n.d.-23 n.a. dw Becker et al. 2008a
n.d. = not detected; n.a. = not analysed; <MQL = below method quantitation limit.

Introduction
16
WWTP sludge
Higgins et al. 2005 found approximately 3 orders higher concentration in WWTP sludge
as in sediment, which indicates the high contamination of the sewage with PFCs.
Furthermore, the two PFOS precursor compounds 2-n-methylperfluorooctanesulfonamido
acetic acid (MeFOSAA) and n-ethylperfluorooctanesulfonamido acetic acid (EtFOSAA) were
observed at high concentration levels, which can further biodegrade to PFOS (Rhoads et al.
2008). In addition, concentrations of PFCAs were 1 to 2 orders lower than PFSAs, showing
the stronger adsorption of the PFSAs to the particles (Higgins et al. 2005). Another study
found a preferred partitioning of perfluorodecanoic acid (PFDA) and perfluoroundecanoic
acid (PFUnDA) to sludge in comparison to the shorter-chain PFOA (Sinclair and Kannan
2006).
Becker et al. 2008a reported that in WWTPs about a tenth of PFOA and the half of PFOS
was removed by the sludge. However, similar or higher concentrations were observed in the
effluent in comparison to the influent, indicating that the conventional WWTPs are not
effective for removal of PFCs from the waste water (Schultz et al. 2006b). The increasing
mass flow in WWTPs could be due to biodegradation of precursor compounds such as
FASAs, FASEs and FTOHs (Schultz et al. 2006b; Sinclair and Kannan 2006).
1.5.3 PFC levels in aqueous samples
PFCs were ubiquitously found in aqueous samples. An overview of the PFC levels in
snow, precipitation, tap water, groundwater, surface runoff, river water, lake water and waste
water effluent is given in Table 5. In addition, the PFOA and PFOS concentrations in
seawater in the open-ocean and the coastal area are illustrated in Figure 4.
Snow
Kim and Kannan 2007 determined PFCs in snow from Albany, USA. Snowfall was
identified as a significant pathway into the lakes. PFCs was investigated in ice caps from the
Canadian Arctic to study seasonal cycles, temporal trends and atmospheric fluxes (Young et
al. 2007). The concentrations ranged from low to mid pg/L, with maximum concentrations in
spring to summer. The concentration of PFOS decreased significantly between 1996 and
2005, while no trend was observed for the PFCAs. The presence of ionic PFCs in Arctic snow
suggests atmospheric oxidation of volatile precursors as a source.

Introduction
17
Precipitation
TFA was investigated in precipitation in several studies (Römpp et al. 2001; Wujcik et al.
1999). The sources of this short-chain PFC are photochemical degradation of
chlorofluorocarbons (CFCs) and direct anthropogenic and natural emissions.
Taniyasu et al. 2008 described the analysis of 29 PFCs (including PFSAs, PFCAs, FASAs,
FASAAs, FTCAs and PFUCAs) in precipitation at two locations in Japan. Dominated
compounds were the short-chain TFA and perfluoropropanoic acid (PFPrA) with maximum
concentrations of 75.9 ng/L (TFA) and 10.3 ng/L (PFPrA). Scott et al. 2006b determined
PFCs in precipitation from nine sampling sites in North America. The short to long-chained
PFCAs (C2 to C12) were detected as well as their potential precursor compounds FTCAs and
FTUCAs. Interestingly, high PFOA concentration correlates with air masses coming from
urban areas. Potential precursor compounds of PFCAs were detected in precipitation from
Kyoto, Japan (Mahmoud et al. 2009) and Winnipeg, Canada (Loewen et al. 2005). These
results suggest that neutral PFCs can remove through oxidation and wet deposition from the
atmosphere.
Tap water
PFOS and PFOA was investigated in drinking water from Japan (Harada et al. 2003; Saito
et al. 2004). Harada et al. 2003 detected PFOS concentrations usually less than 4 ng/L, except
of one sampling site with maximum concentrations of 50.9 ng/L. The origin of the
contamination was possibly the Tama River, which was contaminated with PFOS. Loos et al.
2007 found that the concentration in drinking water correlate with concentrations in the lake
Maggiore, Italy, indicating an insufficient performance of the waterworks for PFCs in this
region. Skutlarek et al. 2006 determined PFCs in drinking water in the Ruhr area, Germany.
The maximum concentration was 598 ng/L for the ∑PFCs, with PFOA as the dominant
compound. The high concentration originated from with soil improver contaminated
agriculture land, which PFC contamination reached the drinking water.
Groundwater
Moody and Field 1999 determined PFCAs at two fire-training locations in USA, which is
the first study of PFCAs in aqueous samples. C6 to C8 PFCA were detected ranging from 125
to 7090 µg/L. These extremely high concentrations can be explained by the using of AFFFs,
which contains high levels of PFCs. But the still high concentrations even after 7 to 10 years
inactivity indicate the high persistency of PFCs in the aqueous environment. Furthermore,
Moody et al. 2003 investigated PFCs in groundwater at Wurtsmith Air Force Base, Canada.

Introduction
18
In this respect, AFFFs were also identified as a source for PFCs, resulting in concentrations of
low to high µg/L for PFHxS, PFOS and PFOA, respectively.
Plumlee et al. 2008 described PFCs in groundwater in California, USA. The ∑PFC
concentration ranged from 20 to 150 ng/L with PFOS and PFOA as the dominated
compounds. The overlying urban stream possibly contaminated the groundwater by
infiltration.
Surface runoff
Kim and Kannan 2007 investigated PFCs in surface runoff in Albany, USA, to identify
potential sources into lake water. ∑PFCs ranged from 1.11 to 81.8 ng/L in surface runoff, but
the mass balance analysis in an urban lake suggests that the surface runoff is not the dominant
input pathway into the lake and an unknown source must exist. Another study identified street
runoff as a potential source of PFCAs into the aqueous environment (Murakami et al. 2009).
River water
PFC concentrations in river surface water were reported in several studies. Saito et al.
2004 investigated PFOS and PFOA in river samples all over Japan. The concentration of
PFOA was higher than of PFOS, especially at contaminated sampling sites. McLachlan et al.
2007 determined PFCAs in 14 major rivers in Europe. Highest concentration was detected for
PFOA in the river Po (200 ng/L), which is in agreement with the detected concentrations in
another survey in the river Po watershed (Loos et al. 2008). The total discharge of PFOA from
the European rivers was estimated to be 14 tonnes/year (McLachlan et al. 2007). Another
study analysed PFCAs and PFOS in over 100 European rivers (Loos et al. 2009). Highest
concentrations of PFOA was detected in the rivers Danube in Austria (25 ng/L), Scheldt in
Belgium (88 ng/L) and Netherlands (73 ng/L), Rhone in France (116 ng/L), and Wyre in the
UK (100 ng/L), while PFOS showed the highest concentration in the rivers Scheldt in
Belgium (154 ng/L) and the Netherlands (110 ng/L), Seine in France (97 ng/L), Krka in
Slovenia (1371 ng/L), Severn in the UK (238 ng/L), and Rhine in Germany (32 ng/L). In
general, these studies show the widespread occurrence of PFCs in Japanese and European
rivers and the large geographical differences in their levels.
Moody et al. 2001 found very high ∑PFCs concentration (11 to 2,270,000 ng/L). PFOS
was the predominant compound in surface water collected from Toronto in Canada released
from an AFFF spill. Hansen et al. 2002 determined PFOS and PFOA in the Tennessee River,
USA. The effluent of a fluorochemical manufacturing facility could identify as a source for
PFCs into the river. Skutlarek et al. 2006 found maximum ∑PFCs concentrations of
4385 ng/L in the Ruhr area, Germany. The origin of this contamination was contaminated soil

Introduction
19
improver which was applied on agriculture land and released into the river by surface and
subsurface runoff. So et al. 2007 investigated 14 PFCs in the Pearl and Yangtze River in
China. Both rivers had a different composition profile which indicates dissimilar origins of
the sources. WWTPs were identified as local sources for PFCs in the Cape Fear River Basin
in North Carolina, USA (Nakayama et al. 2007), in the Glatt Valley Watershed in Switzerland
(Huset et al. 2008), and in several rivers in Japan (Murakami et al. 2008). Ahrens et al. 2009c
determined 20 PFCs in the river Elbe in Germany. Highest concentrations were found in the
urban area in Hamburg, which indicates domestic and industrial waste water as a potential
source for PFCs (for details see chapter 7.1)
In summary, different sources were responsible for the ubiquitous distribution of PFCs in
surface water in rivers. Sources for PFCs into the rivers could be AFFF spill, fluorochemical
manufacturing effluents, WWTP effluents and runoff, while the spatial distribution and the
composition profile of individual PFCs can be used to identify the origin of the
contamination.
Lake water
Boulanger et al. 2004 investigated PFCs in Great Lakes water. The dominated compounds
were PFOS (21-70 ng/L) and PFOA (27-50 ng/L). In addition, some precursor compounds
like EtFOSAA, FOSA and perfluorooctane sulfinate (PFOSi) were detected. Stock et al. 2007
determined PFCs in lakes in the Canadian Arctic, where airport waste water was identified as
a local source into the lakes. PFC concentrations in lake water from two other studies ranged
from mid pg/L to mid ng/L in Sri Lanka (Guruge et al. 2007) and Lake Victoria, Kenya,
respectively (Orata et al. 2009). In general, the presence of PFCs in remote lakes indicates the
ubiquitous distribution of PFCs in the aqueous environment.

Introduction
20
Table 5. Overview of PFOS and PFOA concentrations in aqueous samples and potential sources (ng/L)
Country PFOS PFOA Other PFCs Source of PFCs Reference
Snow USA <MQL-1.93 <MQL-20 PFHxS; C7, C9-C12 PFCA;
FOSA; 6:2, 8:2 FTS atmospheric deposition Kim and Kannan
2007 Canada 0.002-0.09 a 0.01-0.15 a C9-C11 PFCA atmospheric deposition Young et al. 2007 Precipitation Canada 0.59 a n.d. PFHxS; 8:2, 10:2 FTCA;
8:2, 10:2 FTUCA degradation from volatile precursors
Loewen et al. 2005
North America
n.a. <MQL-89 C2-C7, C9-C12 PFCA; 8:2, 10:2 FTCA; 8:2, 10:2 FTUCA
degradation from volatile FTOHs
Scott et al. 2006b
Japan 0.13-1.0 1.0-3.8 C2-C7, C9-C12 PFCA; 8:2 FTCA; 6:2, 8:2, 10:2 FTUCA; FOSA, EtFOSAA
degradation from volatile precursors
Taniyasu et al. 2008
Tap water Japan 0.1-50.9 n.a. n.a. Tama river Harada et al. 2003 Japan n.d.-12a 0.12-40 n.a. river water Saito et al. 2004 Germany n.d.-22 n.d.-519 PFBS; C4-C7 PFCA runoff from
contaminated soil Skutlarek et al. 2006
Italy 6.2-9.7 1.0-2.9 C7, C9-C12 PFCA Lake Maggiore Loos et al. 2007 Groundwater USA n.a. n.d.-
6570000 PFHxA; PFHpA AFFFs Moody and Field
1999 USA 19-87 n.d.-18 PFHxS; PFDS; C6, C7, C10
PFCA; FOSA; EtFOSAA infiltration from overlying urban stream
Plumlee et al. 2008
Surface runoff USA <MQL-15 0.51-29 PFHxS; C7, C9-C12 PFCA;
FOSA; 6:2, 8:2 FTS surface, rain Kim and Kannan,
2007 Japan 2.9-12 n.d.-174 C7, C9-C12, C14 PFCA;
FOSA atmospheric deposition, dust
Murakami et al. 2009
River water USA 17-144 <MQL-598 n.a. fluorochemical
manufacturing facility Hansen et al. 2002
Japan 0.24-37 0.1-456 n.a. various sources Saito et al. 2004 Germany n.d.-193 n.d.-3640 PFBS; C4-C7 PFCA runoff from
contaminated soil Skutlarek et al., 2006
China 0.15-99 0.85-260 PFBS; PFHxS; C6, C7, C9-C11 PFCA; FOSA
industrial/ municipal wastewater effluent
So et al. 2007
Europe n.a. <MQL-200 C6, C7, C9 PFCA various sources McLachlan et al. 2007Germany 0.18-8.2 2.9-12.5 18 other PFCs various sources Ahrens et al. 2009cLake water Canadian Arctic
0.9-57 0.5-16 PFHxS; PFDS; C7, C9-C12 PFCA; 8:2, 10:2 FTUCA
atmosphere, airport waste water
Stock et al. 2007
Lake Victoria
<MQL-2.5 0.4-12 n.a. industrial/ municipal wastewater effluent
Orata et al. 2009
Waste water effluent USA 3-68 58-1050 PFHxS, C9-C11 PFCA,
8:2 FTCA, 8:2 FTUCAwaste water Sinclair and
Kannan 2006 Landfill effluent Finland, Norway
30-187 91-516 PFBS; PFHxS; C6, C9 PFCA; FOSA
landfill Kallenborn et al. 2004
Denmark <MQL-3.8 <MQL-5.8 PFHxS landfill Bossi et al. 2008
n.d. = not detected; n.a. = not analysed; <MQL = below method quantitation limit; a mean values.

Introduction
21
Waste water influent and effluent
Several studies investigated the mass flow of PFCs in WWTPs (Becker et al. 2008a;
Loganathan et al. 2007; Schultz et al. 2006b; Sinclair and Kannan 2006). All studies found
similar or higher concentrations of PFCs in the effluent in comparison to the influent
concentration. These results indicate that conventional WWTPs are not effective for removal
of PFCs and biodegradation of precursor compounds could lead to increasing concentrations
of PFCAs and PFSAs.
Schultz et al. 2006b observed increasing concentrations of PFOS and perfluorodecane
sulfonate (PFDS) in ten WWTPs in the USA occurred from trickling filtration and activated
sludge treatment. Similarly, Sinclair and Kannan 2006 and Loganathan et al. 2007 determined
an increase in the mass flow of PFCs in effluent waters, relative to the influent concentration
in the USA. In addition, Loganathan et al. 2007 found no significant seasonal variation in the
mass flow of PFCs in a WWTP. Furthermore, Becker et al. 2008a determined a 20-fold higher
PFOA concentration and a 3-fold higher PFOS concentration in WWTP effluents as in the
influents of these plants.
In general, effluents of WWTPs are potential point sources of PFCs into the aqueous
environment. The per capita discharge was estimated to be 57 µg/day/person for PFOS and
12 µg/day/person for PFOA (Huset et al. 2008).
Landfill effluent
Only a few data exist about PFCs in effluent water from landfill sites (Bossi et al. 2008;
Kallenborn et al. 2004). Bossi et al. 2008 found low concentrations of PFCs in two landfill
effluents in Denmark. The individual PFC concentration was in general lower than 5.8 ng/L
(PFOA), which indicate them not as an important source into the aqueous environment.
Conversely, Kallenborn et al. 2004 found very high PFC contamination in landfill effluents in
Finland and Norway with ∑PFC concentrations of 199 to 1537 ng/L. However, consumer
product can contain high levels of PFCs (Dinglasan-Panlilio and Mabury 2006; Washburn et
al. 2005) and landfill were indicated as a significant sink for PFCs (Paul et al. 2009). Further
systematic studies of different landfill sites are necessary to characterise landfill sites as a
significant or insignificant source for PFCs into the environment.
Sea water
Only a few data exist about seawater measurements. An overview about open-ocean and
coastal seawater concentrations is shown in Figure 4. Detected concentrations are usually
around some tens pg/L to few ng/L, depending on the location and the compound.

Introduction
22
Approximately two orders higher concentrations were found in the coastal area in comparison
to the open-ocean.
Taniyasu et al. 2003 investigated PFSAs in coastal seawater around Japan. Maximum
PFOS concentration was found in the Tokyo Bay with 59 ng/L, while the other PFSAs were
below the method detection limit (MDL). So et al. 2004 determined PFCs in seawater in the
Pearl River Delta (China), coastal area of Hong Kong and Korea. The concentrations ranged
in low ng/L range except of one sampling location close to the urbanised and industrial city
Seoul with a maximum concentration of 730 ng/L for PFOS. Similar concentration levels
were observed for PFOS and PFOA in the coastal area of Dalian (China) (Ju et al. 2008).
Caliebe et al. 2004 determined 8 PFCs in the North Sea, with highest concentrations of PFOA
(~13 ng/L). The occurrence and composition profile of 15 PFCs was investigated in surface
water in the North Sea, Baltic Sea and Norwegian Sea. The composition profile was
influenced from local sources caused by human activities, whereas atmospheric depositions
were negligible, but it could have possibly an influence on low contaminated sites like the
open North Sea or Norwegian Sea. (for further details see chapter 7.3). Furthermore, the
spatial distribution of 18 PFCs was investigated in surface water in the German Bight. The
∑PFC concentration decreased with increasing distance from the coast, indicating the rivers
and coastal area as a potential source for PFCs (for further details see publication I).
The global occurrence of PFCs in open-ocean water was described firstly from Yamashita
et al. 2005. Yamashita et al. 2005 collected samples from the North and Mid Atlantic Ocean
in 2002 to 2004, and found concentration levels of several tens pg/L for PFHxS, PFOS and
PFNA to a few hundreds pg/L for PFOA. A similar study from Theobald et al. 2007b was
carried out from 53° N to 30° S in the Atlantic Ocean in 2005. The concentration of PFOA
and PFOS were in a range of a few tens pg/L with a maximum concentration of 170 pg/L for
PFOS. Overall, the ocean currents have a high influence on the occurrence of PFCs in the
Atlantic Ocean (for further details see publication II). Concentrations of PFOS and PFOA
reported in the Mid to South Pacific Ocean and the Indian Ocean were about one magnitude
lower than in the North Atlantic Ocean (Wei et al. 2008). Furthermore, Yamashita et al. 2008
have studied vertical profiles of several PFCs in the Labrador Sea, Mid Atlantic Ocean, South
Pacific Ocean and Japan Sea. It was hypothesised that PFCs could be transported globally
with the thermohaline circulation system, and the open-ocean water is acting as a final sink
for PFOS and PFOA.
In general, the concentration of PFOA is usually higher than of PFOS, which suggest that
similar sources come from the urbanised/industrial coastal area. In addition, the higher level
of PFOA in seawater could be explained with its higher water solubility (Brooke et al. 2004;

Introduction
23
U.S. EPA 2005), lower bioaccumulation potential (Martin et al. 2003a) and lower sorption
potential to sediment (Higgins and Luthy 2006). On the other hand, the PFOS concentration
in the Antarctic coastal water was higher than of PFOA. These findings suggest that PFOS
and its precursor compounds are mainly transported via the atmosphere or sea-spray, while
PFOA is mainly transported by the ocean currents.
Figure 4. Concentrations (minimum, maximum, median (circles)) of PFOA and PFOS in seawater in the open-ocean and the coastal area in pg/L ((a) Wei et al. 2008, (b) Yamashita et al.
2005, (c) Theobald et al. 2007b, (d) publication II, (e) Caliebe et al. 2004, (f) publication I, (g) So et al. 2004, (h) Ju et al. 2008 and (i) Taniyasu et al. 2003). Note: Concentrations below
the method quantitation limit are given as 0.5 of the method detection limit
1.5.4 PFC levels in wildlife
Global distribution
The global distribution of PFOS in wildlife was described firstly from Giesy and
Kannan 2001. In general, concentrations of PFOS in animals from industrialised regions like
North America and Europe are greater than from remote regions such as the Arctic. In
addition, fish-eating animals have higher concentration levels than their diets, indicating the
bioaccumulation of PFCs to higher trophic levels. Numerous studies showed the ubiquitous
occurrence of PFCs along the food chain, whereas highest concentrations were found in
mammals. An overview of the global distribution of PFOS in mammal is given in Figure 5.

Introduction
24
Figure 5. Hepatic concentrations (minimum, maximum, mean (circles)) of PFOS in mammals from (a) Tomy et al. 2004a, (b) Leonel et al. 2008, (c) Kannan et al. 2001b, (d) Kannan et al. 2002b, (e) Van de Vijver et al. 2004, (f) Van de Vijver et al. 2003b, (g) Giesy and Kannan
2001, (h) Van de Vijver et al. 2005, (i) Van de Vijver et al. 2007, (j) Martin et al. 2004a, (k) Dorneles et al. 2008, (l) Nakata et al. 2006, (m) Law et al. 2008, (n) Kannan et al. 2002c, and (o) publication III (ng/g ww). Note: Concentrations below the method quantitation limit are
given as 0.5 of the method detection limit
Kannan et al. 2001a investigated PFOS in water birds from USA and central Nord Pacific
Ocean. High PFOS concentrations were found in bald eagle (Haliaeetus leucocephalus) blood
plasma with 13 to 2200 ng/mL from the USA, while concentrations in black-footed and laysan
albatross sera (i.e., Diomedea nigripes, Diomedea immutabilis, respectively) ranging from 3 to
34 ng/mL. Furthermore, PFHxS, PFOS, PFOA and FOSA were analysed in bird liver samples
from several species from Japan and Korea with highest PFOS concentrations in common
cormorants (Phalacrocorax carbo) (650 ng/g ww) (Kannan et al. 2002a). In addition,
extremely high PFOS concentrations were found in American mink (Mustela vison) livers
from the USA (maximum concentration of 5140 ng/g ww) (Kannan et al. 2002c).
PFC concentrations were investigated in various species in the Arctic region. Martin et al.
2004a determined PFCs in the food web (mammals, birds, and fishes) in the Canadian Arctic.
PFOS was the major contaminant with over 4000 ng/g ww in polar bears (Ursus maritimus).
For the first time longer-chained PFCAs (C8-C15) were determined in biota, whereas PFNA

Introduction
25
was the dominated compound. Furthermore, Tomy et al. 2004a analysed PFOS, PFOA, and
the precursors EtFOSA, FOSA in the eastern Arctic marine food web (marine mammals,
birds, fishes, shrimps, clams, and zooplankton). PFOS was detected in all analysed species
ranging from 0.08 ng/g ww (two different clam species) to 33.2 ng/g ww (glaucous gulls
(Larus hyperboreus)). Bossi et al. 2005b reported PFC concentrations in fish, birds and
marine mammals from Greenland and the Faroe Islands. PFOS was the predominant
compound in all species. Finally, Smithwick et al. 2005a determined PFCs in liver tissues and
blood of polar bears from five locations in the North American Arctic. In this respect, the
South Hudson Bay and East Greenland had significantly higher PFOS concentrations than
western populations such as the Chukchi Sea, suggesting sources from Europe and Eastern
North America.
Further data from remote regions are given by Tao et al. 2006. It was determined PFC
concentrations in nine albatross species, elephant seals (Mirounga leonine), Adelie penguins
(Pygoscelis adeliae) and polar skuas (Stercorarius maccormicki) from the Southern Ocean
and North Pacific Ocean. In Adelie penguins no PFCs were detected, while in the other
animals PFOS was the major contaminant. This study shows detectable levels in the Southern
Hemisphere fauna, however, the concentration in this area are 10 to 100-fold lower than
e.g. in seals and birds from the Arctic region.
Recently, an increasing number of publications of PFCs in wildlife from China were
published. Dai et al. 2006 reported concentrations of PFOS and PFOA in red panda (Ailurus
fulgens) and giant panda (Ailuropoda melanoleuca) blood samples from 7 different locations
in China. The concentrations ranged from 0.76 to 73.80 ng/mL for PFOS and 0.32 to
8.20 ng/mL for PFOA for both species. Concentrations of PFCs in serum samples of Amur
tigers (Panthera tigris altaica) was nearly one order of magnitude lower than of red and giant
pandas (Li et al. 2008a). Another study from China investigated PFCs in eggs of three bird
species from south China (Wang et al. 2008). 11 PFCs were detected with PFOS as the
predominant compound (14.4-343 ng/g ww). PFOS concentrations were in the same range as
in guillemot (Uria aalge) eggs from the Norwegian coast, Iceland and the Faroe Islands,
whereas the concentrations in the Baltic Sea were higher (Löfstrand et al. 2008).
Van de Vijver et al. 2003b analysed PFOS in invertebrates (starfishes (Asterias rubens),
crabs (Carcinus maenas), and shrimps (Crangon crangon)) from the Western Scheldt estuary
and the southern North Sea. An increasing concentration gradient of PFOS was found along
the Western Scheldt estuary to the harbour of Antwerp, indicating the industrial area of
Antwerp as a source of PFCs. Another study from invertebrates were published from Cunha et

Introduction
26
al. 2005, who reported PFOS concentrations in mussels (Mytilus galloprovincialis) from
10 Portuguese estuaries ranging from 36.8 to 117.8 ng/g ww.
Hepatic concentrations of PFCs were investigated in harbor porpoises (Phocoena
phocoena) from different locations in Europe and Black Sea coast (Van de Vijver et al. 2007;
Van de Vijver et al. 2004). A decreasing geographical trend from south to north was observed.
Highest concentrations of PFOS were found in the Black Sea, German Baltic Sea and coastal
areas near Denmark, while lower concentrations were observed in animals from remote areas
like Iceland and Norway.
Keller et al. 2005 described PFC concentrations in plasma of loggerhead sea turtles
(Caretta caretta) and kemp’s ridley sea turtles (Lepidochelys kempii) from southeastern coast
of the USA. PFOS and PFOA were the dominant compounds with mean concentrations of
11.0 ng/mL and 3.20 ng/mL for loggerhead turtles and 39.4 ng/mL and 3.57 ng/mL for
Kemp’s ridley turtles, respectively. The ∑PFC concentration was significantly higher in
Kemp’s ridley turtles than loggerhead turtles, higher in larger turtles and higher in turtles
captured toward the north, which suggest an influence of the bioaccumulation by species, age,
and habitat.
Hart et al. 2008b determined PFCs in livers of skipjack tuna (Katsuwonus pelamis)
collected from Pacific offshore waters and the open-ocean along the Sea of Japan, East China
Sea, Indian Ocean, and Western North Pacific Ocean. PFOS and PFUnDA were the
predominant compounds in tuna at concentrations of <1-58.9 and <1-31.6 ng/g ww,
respectively. 10 to 20-fold higher mean concentrations of PFOS was found in skipjack tuna
from offshore sites (i.e., Japan, Taiwan, and Indonesia) as from open-ocean waters (i.e., the
mid Pacific Ocean and the Indian Ocean), which reflected the concentrations previously
reported in seawater samples from these areas (Wei et al. 2008; Yamashita et al. 2005). These
findings suggest that tuna are good bioindicators of the contamination by PFOS in the marine
environment (Hart et al. 2008b). The concentration of PFOS and PFOA in Mediterranean
swordfish (Xiphias gladius) liver were below the LOD of 1.5 and 3 ng/g ww, respectively
(Corsolini et al. 2008).
Leonel et al. 2008 investigated PFC concentrations in Franciscana dolphins (Pontoporia
blainvillei) and Subantarctic fur seals (Arctocephalus tropicalis) from southern Brazil.
Maximum concentrations were found for PFOS with 42 ng/g ww and 21.6 ng/g ww for
Franciscana dolphins and Subantarctic fur seal, respectively. Moreover, higher PFOS
concentrations were observed in marine tucuxi dolphins (Sotalia guianensis) from the
Brazilian coast ranging between 43 and 2431 ng/g ww (Dorneles et al. 2008).
Introduction
27
Tissue distribution
Relatively little is known about the tissue distribution of PFCs in organisms. For the
calculation of the total body burden the concentration in the liver and plasma are often used.
These estimations are often potential sources of errors because little is known about the
distribution of PFCs in the whole body (Houde et al. 2006c). In addition, bioaccumulation
evaluations may be overestimated when using liver and plasma concentrations. In Table 6 is
given an overview of the tissue distribution of PFOS and PFOA in wildlife.
Martin et al. 2003a determined the compound-specific tissue distribution of rainbow trout
(Oncorhynchus mykiss) in a laboratory flow-through system exposed with PFCs. Highest PFC
concentrations were found in blood > kidney > liver > gall bladder, while lowest in gonads
> adipose > muscle tissue. Similarly, van de Vijver and co-workers observed decreasing
PFOS concentrations in the order kidney > liver > blubber > skeletal muscle for harbor seals
(Phoca vitulina) from the Dutch Wadden Sea (Van de Vijver et al. 2005) and liver > kidney
> muscle > brain ≈ blubber for harbor porpoises from the Black Sea, respectively (Van de
Vijver et al. 2007). Verreault et al. 2005 investigated the occurrence of PFCs in different
tissues in glaucous gulls (Larus hyperboreus) from the Norwegian Arctic. PFOS was the
predominant compound with highest concentrations in plasma (48.1-349 ng/g ww), followed
by liver ≈ egg > brain. Olivero-Verbel et al. 2006 analysed different tissues of pelicans
(Pelecanus occidentalis) from North Columbia. Interestingly, highest PFOS concentrations
were detected in spleen, followed by liver > lung > kidney > brain > heart > muscle. This
could be important in term of the effects, because the immune system and physiological
functions were controlled by the spleen. Holmström and Berger 2008 showed different tissue
distribution of PFOS and the ∑PFCAs in guillemots from the Baltic Sea. The highest
concentration of PFOS was observed in egg tissue followed by liver tissue, while highest
concentrations of ∑PFCAs were found in the liver, suggesting a compound specific
accumulation mechanism.
The total body burden and tissue distribution was investigated in harbor seals from the
German Bight. PFOS was the predominant compound in all measured seal tissues with a
composition of over 90% compared to the ∑PFCs. The dominant PFCAs were PFNA and
PFDA. The mean whole body burden in harbor seals of all detected PFCs was estimated to be
2665 ± 1207 µg absolute. The major amount of the total PFCs burden in the bodies was in
blood (38%) and liver (36%), followed by muscle (13%), lung (8%), kidney (2%), blubber
(2%), heart (1%), brain (1%), thymus (<0.01%) and thyroid (<0.01%) (for further details see
publication III).

Introduction
28
Table 6. Tissue distribution of PFOS and PFOA in wildlife (ng/g tissues ww and ng/mL for blood and bile)
Species Location PFOS PFOA Other PFCs Reference
Egg Glaucous gull Norwegian Arctic 52-196 <0.7 C10-C13 PFCA Verreault et al. 2005 Guillemot Baltic Sea 243-432 n.d. PFHxS; PFDS; C9-
C15 PFCA; FOSA Holmström and Berger 2008
Blood Glaucous gull Norwegian Arctic 48-349 <0.7-0.74 PFHxS; C8-C15 PFCA Verreault et al. 2005 Harbor seal German Bight 48-887 n.d.-1.1 16 other PFCs publication III Liver Harbor porpoise Black Sea 33-1790 n.d. C9-C12 PFCA Van de Vijver et al. 2007Harbor seal Dutch Wadden Sea 46-488 <MQL C9-C11 PFCA Van de Vijver et al. 2005 Guillemot Baltic Sea 91-322 n.d. PFDS; C9-C15
PFCA; FOSA Holmström and Berger, 2008
Pelican Columbia 4.0-56 n.d. PFHxS Olivero-Verbel et al., 2006Harbor seal German Bight 559-1665 n.d.-1.4 16 other PFCs publication III Kidney Harbor seal Dutch Wadden Sea 47-1036 <MQL-12 C9-C12 PFCA Van de Vijver et al. 2005 Pelican Columbia 1.2-17 n.d. FOSA Olivero-Verbel et al., 2006Harbor porpoise Black Sea 2.6-1371 n.d. n.d. Van de Vijver et al. 2007Guillemot Baltic Sea 92-183 n.d. PFHxS; PFDS; C9-
C15 PFCA; FOSA Holmström and Berger, 2008
Harbor seal German Bight 118-383 n.d.-0.93 16 other PFCs publication III Heart Pelican Columbia 1.7-6.9 n.d. FOSA Olivero-Verbel et al., 2006Harbor seal German Bight 87-181 n.d.-0.99 16 other PFCs publication III Lung Pelican Columbia 2.9-11 n.d. PFHxS; FOSA Olivero-Verbel et al., 2006Harbor seal German Bight 228-755 0.28-1.2 16 other PFCs publication III Brain Pelican Columbia 1.3-11 n.d. FOSA Olivero-Verbel et al., 2006Harbor porpoise Black Sea 3.5-100 n.d. n.d. Van de Vijver et al. 2007Harbor seal German Bight 38-153 n.d.-0.20 16 other PFCs publication III Thymus Harbor seal German Bight 159-416 0.43-0.93 16 other PFCs publication III Thyroid Harbor seal German Bight n.d.-121 n.d.-0.22 16 other PFCs publication III Spleen Harbor seal Dutch Wadden Sea 152-439 <MQL PFBS; C9-C11 PFCA Van de Vijver et al. 2005Pelican Columbia 6.2-132 <MQL-182FOSA Olivero-Verbel et al., 2006Bile Mugil incilis (Fish) Columbia 3673a <50-1116 PFHxS; FOSA Pelican Columbia 17-100 n.d. n.d. Olivero-Verbel et al. 2006
Blubber Harbor seal Dutch Wadden Sea 19-297 <MQL n.d. Van de Vijver et al. 2005Harbor porpoise Black Sea 18a n.d. n.d. Van de Vijver et al. 2007Harbor seal German Bight n.d.-23 n.d.-0.08 16 other PFCs publication III Muscle Harbor seal Dutch Wadden Sea 8.9-2725 <MQL C9-C11 PFCA Van de Vijver et al. 2005Pelican Columbia 0.7-2.7 n.d. FOSA Olivero-Verbel et al., 2006Harbor porpoise Black Sea 41a n.d. n.d. Van de Vijver et al. 2007Guillemot Baltic Sea 9.8-17 n.d. C9-C14 PFCA Holmström and Berger, 2008Harbor seal German Bight 7.7-132 n.d.-0.24 16 other PFCs publication III
n.d. = not detected; <MQL = below method quantitation limit; a mean values.

Introduction
29
In general, highest concentrations were found in blood, kidney and liver which confirms
the findings that PFCs bind to blood proteins instead of fatty tissue (Jones et al. 2003). But the
tissue distribution is compound-specific and varies between the different species. Further
investigations on the accumulation potential and whole body burden in marine wildlife are
necessary to assess potential adverse effects of PFCs.
1.5.5 PFC levels in humans
The presence of OF has been reported the first time in human blood by Taves (1968) in
1968. But until the end of 1990s little attention was paid to the occurrence of these
compounds. The public attention increased due to the observation of high PFOS
concentrations in serum in occupationally exposed workers of 1750 to 2190 ng/mL, whereas
serum levels of the general population were about 100 times lower (Hansen et al. 2001; Olsen
et al. 1999). Since then PFCs were detected worldwide in human blood, milk and liver. An
overview of the PFOS and PFOA concentrations in humans is given in Table 7.
Olsen et al. 2003a analysed PFCs in a total of 645 adult donor serum samples from
American Red Cross blood, USA. The mean concentration of PFOS was higher in males
(37.8 ng/mL) than in females (31.3 ng/mL). The other detected PFCs were approximately an
order of magnitude lower than PFOS. In another study from the USA, the mean PFOS
concentration in serum of elderly humans (age of 65–96) was 31.0 ng/mL, whereas the PFOS
concentration in most elderly was slightly lower (Olsen et al. 2004).
Kannan et al. 2004 investigated PFOS, PFHxS, PFOA and FOSA in 473 human blood,
serum and plasma samples collected from several countries (i.e., USA, Colombia, Brazil,
Belgium, Italy, Poland, India, Malaysia, and Korea). PFOS was the predominant compound
with highest concentrations in the samples collected from the USA and Poland (> 30 ng/mL),
while the concentration was moderate in Korea, Belgium, Malaysia, Brazil, Italy, and
Colombia (3 to 29 ng/mL) and the lowest concentration was found in India (<3 ng/mL).
Kubwabo et al. 2004 reported concentrations of PFOS in 56 human serum samples from
Canada in the same range as from the USA and Poland. Kärrman et al. 2006a determined
12 PFCs in 40 pooled serum samples from 3802 Australian residents. Interestingly, it was
observed increasing concentrations of PFOS with increasing age. The PFOS concentration in
Australia was similar to the concentration in Korea, Belgium, Malaysia, Brazil, Italy, and
Colombia which suggests that the exposure from local sources is more important than
emissions from the Northern Hemisphere. Yeung et al. 2006 observed PFOS concentrations in
whole blood from nine cities in China which was comparable with the concentration level in
USA and Poland. Fromme et al. 2007a found a lower PFC exposure in adult German people
than in USA and Canadian people. Ultimately, different composition profiles of PFCs indicate

Introduction
30
specific exposure sources and pathways of PFCs to humans in different countries (Yeung et
al. 2008).
Calafat et al. 2006 investigated the PFC concentration level in three different ethnicities
(non-Hispanic blacks, non-Hispanic whites, and Mexican Americans) in the USA. The results
indicate different patterns of human exposure to PFCs between the ethnic groups.
Interestingly, higher education was associated with higher contamination with PFOS and
PFOA. A similar study showed, that serum samples from children from USA showed lower
PFC concentrations for Mexican Americans than for the other two ethnic groups (Kato et al.
2009)
Tao et al. 2008a investigated PFCs in 45 human breast milk samples collected from the
USA. PFOS and PFOA were the predominant compounds. It was found a higher partitioning
of PFOA to milk than for PFOS. In addition, PFOA was significantly higher in milk of
mothers nursing for the first time than in the milk of mothers who have previously nursed.
These results suggest that PFOA can be excreted in breast milk and therefore the
concentrations of PFCs in women decreased with increasing period of breastfeeding. In
another study, Tao et al. 2008b determined PFCs in human breast milk from several Asian
countries. The concentration of PFOS varied from different Asian countries significantly,
whereas the lowest median concentration was found in India (39.4 pg/mL), and the highest in
Japan (196 pg/mL). Another possible pathway of PFCs in the human foetus could be the
maternal transfer via the umbilical cord (Inoue et al. 2004).
In summary, PFCs were detected in whole blood, serum, plasma, liver and milk all over
the world. In the USA and Canada were detected generally higher concentrations than in other
parts of the world. But no differences between urban and rural regions were observed
(Kärrman et al. 2006a). However, the comparison of PFC levels in different tissues should be
made with caution because of the compound specific ratio between whole blood, serum,
plasma and liver (Kärrman et al. 2006b; Olsen et al. 2003b). Furthermore, no clearly trend
between the concentration level and age was found. In addition, different studies showed that
males are higher contaminated with PFCs than females (Harada et al. 2004; Midasch et al.
2006; Olsen et al. 2003a). The reasons for the gender differences are possibly different dietary
habits or different elimination rates after the uptake. However, the extractable total OF in
blood samples from China ranged between > 70% for Beijing, to 30% for Jintan, indicating
that it exist a substantial amount of unidentified PFCs in human blood samples (Yeung et al.
2008).

Introduction
31
Table 7. Overview of PFOS and PFOA concentrations in human blood, milk (ng/mL) and liver (ng/g ww)
Country n Year Age Sample type PFOS PFOA Other PFCs Reference
USA 65 - - serum 6.7-82 <5-35 PFHxS; FOSA Hansen et al. 2001USA 645 2000-
2001 20-69 serum <4.3-1656 <1.9-52 PFHxS; FOSAA;
MeFOSAA Olsen et al. 2003a
USA 24 5-74 serum <6.1-58 <3.0-7.0 Olsen et al. 2003b 30 - 5-74 liver <4.5-57 <MQL-47 PFHxS; FOSA USA 238 - 65-96 serum 3.4-175 1.4-17 PFHxS; FOSAA;
MeFOSAA Olsen et al. 2004
USA 175 17-72 serum, whole blood, plasma
<1.3-164 <3.0-88
Columbia 56 20-29 whole blood 4.6-14 3.7-12 Brazil 29 18-74 whole blood 4.3-35 <20 Italy 50 20-59 serum <1-10 <3 Poland 25 35-58 whole blood 16-116 9.7-40 Belgium 20 19-63 plasma 4.5-27 <1-13 India 45 17-48 serum <1-3.1 <3-3.5 Malaysia 23 21-26 whole blood 6.2-19 <10 Korea 50 15-95 whole blood 3.0-92 <15-256 Japan 38
1998- 2004
23-66 serum 4.1-40 <6.8-12
PFHxS; FOSA
Kannan et al. 2004
Japan 15 maternal blood 4.9-18 <0.5-2.3 15 2003 17-37 cord blood 1.6-5.3 <0.5 n.a. Inoue et al. 2004
Canada 56 2002 > 20 serum 3.7-65 <1.2-7.2 n.a. Kubwabo et al. 2004Sweden 66 1997-
2000 19-75 whole blood 1.7-37 0.5-12 PFHxS; PFDS;
C6, C9-C11 PFCA; FOSA
Kärrman et al. 2006b
Australia 40 2002-2003
5 age groups
pooled serum samples
13-30 5.0-9.9 PFHxS; FOSA; PFNA
Kärrman et al. 2006a
Germany 105 2003-2004
5-84 plasma 6.2-131 1.7-39 n.a. Midasch et al. 2006
USA 54 2001-2002
4 age groups
pooled serum samples
10-40 a 2.1-6.0 a PFHxS; PFNA; MeFOSAA; EtFOSAA; FOSA
Calafat et al. 2006
China 85 2004 7-66 whole blood 1.7-155 0.1-3.5 PFHxS; C9-C11 PFCA; FOSA
Yeung et al. 2006
Germany 356 2005 14-67 plasma 2.1-56 0.5-19 n.a. Fromme et al. 2007aUSA 1562 1999-
2000 4 age groups
pooled serum samples
30 a 5.2 a PFHxS; C9-C12 PFCA; MeFOSAA; EtFOSAA; FOSA;
Calafat et al. 2007
12 2004 22-33 serum 8.2-48 2.4-5.3 Sweden 21 1996-
2004 19-40 pooled milk
samples 0.06-0.47 <0.21-0.49
PFHxS; PFDS; C9-C11 PFCA; FOSA
Kärrman et al. 2007
Germany 691 2006 5-69 plasma 1.0-93 0.7-100 PFBS; PFHxS; Hölzer et al. 2008 Germany, Hungary
70 1996-2006
- milk 0.10-0.64 <0.20-0.46 n.a. Völkel et al. 2008
USA 45 2004 22-43 milk <0.03-0.62 <0.03-0.16 PFBS; PFHxS; C7, C9-C12 PFCA
Tao et al. 2008a
Asia, USA 184 1999-2005
17-40 milk <0.01-0.52 <0.04-0.34 PFBS; PFHxS; C7, C9 PFCA
Tao et al. 2008b
n.a. = not analysed; <MQL = below method quantitation limit; a mean values.
Introduction
32
1.6 Temporal trends
The first temporal trend study was reported from Kannan et al. 2002b in white-tailed sea
eagle (Haliaeetus albicilla) livers from Germany and Poland. The PFOS concentration
increased significantly over the time, however, no statistical method was described. Since
then several temporal trend studies were performed in different tissues in wildlife (i.e., eggs,
livers, and whole fish homogenates) and humans (i.e., whole blood, plasma, serum, and milk).
An overview of temporal trends of PFOS and PFOA in wildlife and humans is given in
Figure 6 and Figure 7, respectively.
Temporal trends in wildlife
Martin et al. 2004b described significant increasing PFOS concentrations by a factor of
4.2 in lake trout (Salvelinus namaycush) whole body homogenates from the Lake Ontario
between 1980 and 2001. But the increasing trend was not linear due to an influence of the
food web by the invasion of zebra mussels (Dreissena polymorpha). Another study in lake
trout whole body homogenates observed significant increasing PFOS concentrations between
1979 and 1993 (Furdui et al. 2008). But the PFDS and FOSA concentration decreased from
1993 to 2004 while the PFCA concentration firstly increased (1979 to 1988), and thereafter
decreased.
A long-term assessment (1968-2003) in guillemot eggs from the Baltic Sea was published
from Holmström et al. 2005. The results have shown an almost 30-fold increase of the PFOS
concentration with a decrease after 2002. Interestingly, even in the oldest samples could
detect PFOS which indicate an input of PFOS in the marine environment before 1968.
In the following several temporal trend studies of different species from the Arctic region
were described. Bossi et al. 2005a found for PFOS, PFDA, and PFUnDA significant
increasing concentrations in ringed seal (Phoca hispida) livers between 1986 and 2003 in East
Greenland and between 1982 and 2003 in West Greenland, respectively. In addition,
significantly higher PFOS concentrations were observed in ringed seals from East Greenland.
Smithwick et al. 2006 described exponential increasing concentrations for PFOS and PFCAs
(C9-C11) in polar bear livers from the North American Arctic between 1972 and 2002. In
contrast, the FOSA concentration decreased over this period. Two publications from Butt et
al. 2007a,b showed temporal trends in ringed seals from the Arviat and Resolute Bay, and two
seabird species (i.e., thick-billed murres (Uria lomvia) and northern fulmars (Fulmaris
glacialis)) from Prince Leopold Island in the Canadian Arctic. The PFCA (C9-C15)
concentration in ringed seal livers increased significantly between 1972 and 2005, whereas
the concentrations of PFOS and FOSA showed a maximum between 1998 and 2000, and

Introduction
33
afterwards significant decreasing concentrations from 2000 to 2005 (Butt et al. 2007b). In the
two seabird species the PFC concentration increased overall between 1975 and 2003/2004,
while the PFCA concentration appeared to remain steady between 1993 and 2004 (Butt et al.
2007a). Finally, Dietz et al. 2008 reported significant increasing concentrations of PFOS and
PFCAs (C8-C13) in polar bear livers from East Greenland between 1984 and 2006.
Kannan et al. 2006 described significant increasing concentrations of PFOA in sea otter
(Enhydra lutris) livers between 1992 and 2002 collected from the California coast, USA. The
PFOS concentration increased from 1992 to 1998 and then decreased after 2000. Verreault et
al. 2007 observed overall increasing concentrations of PFSAs (C6, C8, and C10) and PFCAs
(C8-C11) in herring gull (Larus argentatus) eggs from two geographically isolated colonies in
northern Norway between 1983 and 2003. However, the concentration of PFHxS and PFOS
were relatively constant between 1993 and 2003. Hart et al. 2008a investigated the temporal
trends in melon-headed whale (Peponocephala electra) livers collected along the coast of
Japan from 1982 to 2006. The ΣPFC concentrations increased by a factor of ~10 from 1982 to
2001/2002, while after 2001/2002 the ΣPFC concentrations did not decline further. Ishibashi
et al. 2008a found significant increasing concentrations of PFOS, PFNA and PFDA in Baikal
seal (Pusa sibirica) livers collected in 1992 and 2005. Decreasing concentrations were
reported for C5-C7 PFSAs, PFOSi, FOSA and PFOA in harbor seal livers collected from the
German Bight between 1999 and 2008 (publication IV). This study showed for the first time
generally decreasing concentrations for these compounds in an industrial area.
In general, high variations in the concentration levels were observed depending on the
species and sampling locations. Previous temporal trend studies indicated mostly increasing
concentrations of PFCs before around the year 2000 (see Figure 6). Thereafter a few studies
have shown significant decreasing concentrations, which indicate that source inputs of PFCs
to the environment have changed or have been reduced.

Introduction
34
Figure 6. Overview of temporal trends of PFOS and PFOA in wildlife from (a) Dietz et al. 2008, (b) publication IV, (c) Holmström et al. 2005, (d) Martin et al. 2004b, (e) Furdui et al.
2008, (f) Bossi et al. 2005a, (g) Verreault et al. 2007, (h) Hart et al. 2008a, (i) Butt et al. 2007b, (j) Ishibashi et al. 2008a, and (k) Butt et al. 2007a (ng/g ww)
Temporal trends in humans
Harada et al. 2004 found increasing concentrations of PFOS and PFOA in human serum
samples by a factor 3 and 14, respectively, at two locations in Japan between 1977 and 2003.
However, at one location only the PFOA concentration increased significantly between 1991
and 2003. Olsen et al. 2005, 2008 assessed the temporal trend of PFCs in human serum and
plasma from the USA between 1974 and 2006. The PFC concentrations increased from 1974
to 1989 significantly, and thereafter declined from 2000/2001 to 2006. Kärrman et al. 2007
found no significant temporal trends of PFOS and PFHxS in milk samples from Sweden
between 1996 and 2004. However, some samples were collected from different regions,
whereby regional differences in the concentration level could be important. Harada et al. 2007
analysed human serum from Japan between 1983 and 1999. While the PFOA concentration
increased over the sixteen years, the PFOS concentration reached a plateau in the late 1980s.
Spliethoff et al. 2008 investigated the temporal trends of PFCs in whole blood samples from
the New York State, USA. The concentration level of PFOS, FOSA, PFHxS, and PFOA
declined exponential significantly after the year 2000. Recently, Haug et al. 2009 described
the temporal trends of PFCs in pooled serum samples from Norway between 1976 and 2007.
The concentrations of PFSAs (C6-C8) and PFCAs (C8-C11) increased from 1976 to the mid
1990s where the concentrations reached a plateau. After around the year 2000 the
concentrations of the compounds PFHpS, PFOS and PFOA started to decrease.

Introduction
35
Figure 7. Overview of temporal trends of PFOS and PFOA in humans from (a) USA (Olsen et al. 2005; Olsen et al. 2008), (b) Japan (Harada et al. 2007), (c) Norway (Haug et al. 2009),
(d) USA (Spliethoff et al. 2008) and (e) Sweden (Kärrman et al. 2007) (ng/mL)
In summary, the temporal trend studies in wildlife and humans showed overall increasing
concentration in the past (the oldest samples come from guillemot eggs from 1968), where
after a plateau was reached in the mid 1990s to 2000, and finally the concentration levels
decreased after around 2000 (see Figure 6 and Figure 7). The reason could be, probably, that
this is the effect of the phase-out in POSF production by the 3M Company (see Figure 2), the
reduction of PFOA emissions by the stewardship program from the U.S. EPA and
replacement of PFOS and their derivates by less bioaccumulative compounds because of the
formed directive from the EU (Prevedouros et al. 2006; European Parliament and Council
2006; U.S. EPA 2006). However, the still high contamination of PFCs in wildlife and humans
indicates that further works on the reduction of environmental emissions of PFCs are
necessary.
1.7 Toxicology
PFCs are very persistent and have the potential to bioaccumulate in the food web. The
human and ecotoxicological effects were investigated in various studies. However, most
studies focussed only on the compounds PFOS and PFOA. Additional toxicity information
are needed for other PFCs and more exposed species. This chapter gives an overview on the
bioaccumulation and biomagnification potential of PFCs (1.7.1), their human and
ecotoxicology (1.7.2) and their current assumed risk to human health (1.7.3).
1.7.1 Bioaccumulation and biomagnification potential
The term “bioaccumulation” describes the potential of contaminants to travel through the
various trophic levels of the ecosystem, whereby it will takes into account that PFCs
accumulate through multiple exposure routes and that the total accumulation depends upon

Introduction
36
the rate of intake versus elimination. A difference can be made between bioconcentration
factors (BCFs), biomagnification factors (BMFs) and bioaccumulation factors (BAFs). The
BCFs describe the direct uptake of a substance by living organisms from the medium (e.g.,
water), whereas the BMFs result from dietary uptake. The BAFs are the sum of these two
processes. An overview of the three different bioaccumulation factors is given in
Table 8.
Table 8. Overview of the BCFs, BMFs and BAFs of PFOS and PFOA
Species PFOS PFOA Other PFCs Remarks Reference
Bioconcentration factors (BCFs) Rainbow trout 1100-5400 4.0-27 C10-C12, C14
PFCA, PFHxS laboratory-based Martin et al. 2003a
Benthic invertebrates 1000 n.a. n.a. Great Lakes Kannan et al. 2005 Biomagnification factors (BMFs) Mink 11-23 n.a. n.a. laboratory-based Kannan et al. 2002cFood web 2.9 0.41 C9-C14 PFCA,
FOSA Lake Ontario Martin et al. 2004b
Food web 0.4-9 0.04-2.7 FOSA, EtFOSA Eastern Arctic Tomy et al. 2004a Food web 5-20 n.a. n.a. Great Lakes Kannan et al. 2005 Bottlenose dolphins food web
0.8-35 1.8-13 C9-C12 PFCA, PFHxS, FOSA,
South Carolina, and Florida, USA
Houde et al. 2006b
Food web 0.32-38.7 n.a. PFHxS, PFNA Barent Sea Haukas et al. 2007 Food web 7.0-8.7 n.a. C10-C12 PFCA Western Arctic Powley et al. 2008 Bioaccumulation factors (BAFs) Rainbow trout 6300-125000 n.a. n.a. field-based,
contaminated site Moody et al. 2002
23 fish species 274-41600 n.a. n.a. field-based, Japan Taniyasu et al. 2003
n.a. = not analysed
Martin et al. 2003a investigated the accumulation potential of PFCs in a laboratory flow-
through system, where rainbow trouts were exposed with PFCs. The BCFs ranged between
4 (PFOA) and 23000 (PFTeDA) in rainbow trout carcasses. The PFSAs had higher BCFs than
the PFCAs relatively to their perfluoro carbon chain length. In addition, the BCFs of PFCAs
increased by a factor of 8 for each additional perfluoro carbon chain between C8 and
C12 PFCAs. However, PFOA and shorter-chain PFCAs can not be classified as
“bioaccumulative” (Conder et al. 2008). Kannan et al. 2005 calculated a BCF of
approximately 1000 in various organisms in the benthic food web.
Martin et al. 2003b found no dietary accumulation for PFCs in rainbow trouts in a
laboratory study. Another study investigated the BMFs in the food web of the Lake Ontario
(Martin et al. 2004b). It was reported a high contamination of the benthic organisms possibly
caused by contaminated sediment, which led to a underestimation of the BMFs. Tomy et al.

Introduction
37
2004a found that PFOS biomagnify in the Arctic marine food web. The BMFs of the other
PFCs (i.e., EtFOSA, FOSA, and PFOA) were often above 1, however no significant
relationship with the trophic level was observed. Houde et al. 2006b described the
biomagnification of PFCs in the food web of bottlenose dolphin at two locations in the USA
(i.e., South Carolina, and Florida). The BMFs ranged between <1 and 156 based on the PFC
concentration in the bottlenose dolphin plasma and liver. It was suggested that the calculation
of the BMFs are possibly overestimated because only the plasma and liver concentration was
used for the calculation of the whole body burden, while the tissue distribution of PFCs in this
marine top predator was not known. Haukas et al. 2007 reported the biomagnification
potential of PFCs in the Barent Sea food web. The BAFs were over 1 for PFHxS, PFNA and
PFOS. Several further dietary studies exist in the food web, which show all that PFCs can
potential biomagnify in the marine food web (Powley et al. 2008; Bossi et al. 2005b; Li et al.
2008b).
Moody et al. 2002 described the bioaccumulation of PFOS at an airport in Toronto,
Canada, which was contaminated with AFFF spill. The BAF for PFOS ranged between
6300 and 125000 based on the concentration in the rainbow trout liver and surface water. A
similar study found BAFs of 274-41600 for PFOS in surface water and liver of 23 fish species
in Japan (Taniyasu et al. 2003).
1.7.2 Human and ecotoxicology
PFCs do not accumulate in fatty tissues due to their combination of lipophilic and
hydrophilic characteristics. Instead they bind to the blood protein serum albumin (Austin et al.
2003; Han et al. 2003) and are therefore primarily distributed in blood, liver, kidney and other
organs (Seacat et al. 2003; Seacat et al. 2002; publication III). Several studies investigated
the half-life of PFCs in different species (Lau et al. 2007; Brooke et al. 2004). The half-life of
PFOA ranged between a few days to 100 days in rats (Johnson et al. 1984). Similar half-lifes
were calculated in chickens (Gallus gallus) with 4.6 days for PFOA and 125 days for PFOS
(Yoo et al. 2009). Longest half-lifes were estimated in humans with 8.7 (2.3-21.3) years for
PFOS and 4.4 (1.5-13.5) years for PFOA (Burris et al. 2002).
The mechanism of toxicity of individual PFCs is not well understood. The exposure of
animals to PFOS leads to reduced body weight, increased liver weight, hepatoxicity,
peroxisome proliferation, reduction of serum cholesterol, fatty acid transport and metabolism,
inhibit of the gap junctional intercellular communication (GJIC), mitochondrial biogenesis,
alteration of hepatic lipid metabolism, and neuroendocrine effects (Austin et al. 2003;
Berthiaume and Wallace 2002; Hu et al. 2002; Ikeda et al. 1985; Luebker et al. 2002a). The
toxicity of PFOA is based on peroxisome proliferation, and influences on mitochondrial,

Introduction
38
microsomal, cytosolic enzymes, and the fatty acid transport and metabolism (Luebker et al.
2002; Berthiaume and Wallace 2002; Goecke-Flora and Reo 1996; Intrasuksri et al. 1998;
Stevenson et al. 2006). Several other PFCs are expected to be peroxisome proliferators
(Goecke-Flora and Reo 1996; Luebker et al. 2002). In addition, Maras et al. 2006 found up-
regulation of the estrogen receptor as a consequence of the exposure with 6:2 FTOH or
8:2 FTOH in in vitro assays. Recently, Joensen et al. 2009 investigated the influence of the
serum PFC levels on the semen quality. Interestingly, they found a positive correlation with
high PFOS and PFOA concentrations and low semen quality.
The acute, subchronic and chronic toxicity of PFCs were investigated in several studies
(Hekster et al. 2003; Nakayama et al. 2005). The acute toxicity of single injections was
evaluated in rats (Olson and Andersen 1983). The LD50 (a lethal dose at which 50% of
subjects will die) was 189 mg/kg for PFOA and 41 mg/kg for PFDA. Similar LD50 was found
for PFOS elsewhere (Nakayama et al. 2005). In general, a greater toxicity of FTCAs and
FTUCAs were described than for the PFCAs (Phillips et al. 2007). In addition, a dependence
of the toxicity with the chain length was observed for PFCAs, however, the PFCAs have a
relatively low acute toxicity (Mulkiewicz et al. 2007). The subchronic toxicity was
investigated in a 6 month study of male cynomolgus monkeys (Macaca fascicularis)
(Butenhoff et al. 2002). Mortalities were observed in monkeys treated with 20-30 mg
PFOA/kg/day. Seacat et al. 2002 reported decreasing body and liver weights, and lowered
serum total cholesterol, triiodothyronine, and estradiol levels in a 6 month study of
cynomolgus monkeys feeding with 0.75 mg PFOS/kg/day. Chronic toxicity studies are very
limited. Biegel et al. 2001 reported a carcinogenic potential to liver and pancreas of PFOA in
rats.
The toxicity of PFCs in the aquatic environment was tested in laboratory microcosms and
in the natural environment. Sanderson et al. 2002 investigated the community no-observable-
effect concentration (NOECcommunity) for freshwater zooplanktons. A reduction of 90-100%
after an exposure of 30 mg/L PFOS over one week or 10 mg/L PFOS after two weeks was
observed. In another study was found that an increasing concentration of PFOS and PFOA
have an influence on the species contribution in the zooplankton community (Sanderson et al.
2004). Boudreau et al. 2003 investigated for PFOS the NOECcommunity for zooplankton in a
35 day study and the inhibition concentration (IC50) for Lemna gibba in outdoor microcosms.
The NOECcommunity and IC50 were determined to be 3.0 mg/L and 19.1 mg/L, respectively. The
investigation of the toxicity of PFCs in different fish species indicates hepatic damage in bib
(Trisopterus luscus) (Hoff et al. 2003a), influence on the membrane structure in common carp
(Cyprinus carpio) (Hoff et al. 2003b), and impact on the reproductivity of fathead minnow

Introduction
39
(Pimephales promelas) (Oakes et al. 2004).
Kannan et al. 2006 found a significant association between infectious diseases and PFOS
and PFOA concentrations in sea otter livers. Another study observed physiological changes in
Baikal seals depending on the PFCA concentration levels (Ishibashi et al. 2008b). However,
no correlation was found between the PFC concentration and health status of harbor seals
(publication IV), indicating the dependence of toxic effects on the species. Further research
is necessary to evaluate long-term consequences of exposure for individual and ∑PFCs.
1.7.3 Human health risk assessment
Human exposure to PFCs based on several environmental and product-related sources. In
addition, age and gender-specific pathways to humans are possible. The exposure of PFCs
could cause by food, drinking water, hand-to-mouth intake, food contact, dust, and inhalation.
In addition, the maternal transfer via the umbilical cord and milk is possible. The precursor
compounds of PFCAs and PFSAs should be included in the risk assessment, because of their
degradation potential. The contribution of PFOS and PFOA precursor compounds on the
intake dosis was estimated to be 2–8% in an intermediate scenario and 28–80% in a high-
exposure scenario (Vestergren et al. 2008). Trudel et al. 2008 expected a mainly intake by
contaminated food and drinking water in a modelling based assessment, while consumer
products had a minor contribution. However, further studies on the pathways of exposure are
necessary.
Kärrman et al. 2007 investigated the PFC concentrations in human milk and serum in
12 primiparous women in Sweden. The PFOS milk concentration was on average 1% of the
corresponding serum level which indicates an elimination of PFCs through lactation. The
maternal transfer to the infant was calculated to be 200 ng PFCs per day. Tao et al. 2008b
estimated the daily intake of PFOS by infants via breastfeeding from seven Asian countries.
The daily intake was calculated to be 11.8 ng/kg body weight per day, which was 7-12 times
higher than the estimated adult dietary intakes previously reported from Germany, Canada,
and Spain.
The placental transfer via the cord blood was investigated by Inoue et al. 2004. The
concentrations of PFOS in maternal samples ranged from 4.9 to 17.6 ng/mL, whereas those in
foetal samples ranged from 1.6 to 5.3 ng/mL. Furthermore, a high correlation between PFOS
concentrations in maternal and cord blood was found, suggesting that PFOS may be able to
cross the placental barrier to enter foetal circulation.
Falandysz et al. 2006 described the exposure of PFCs by fish consumption. A positive
correlation was found between the PFC concentration in fish and the concentration in Polish
people, who have a high fish intake in their diet. This indicates that fish is a possible source
Introduction
40
for PFCs in humans. Moreover, paper food packing material (e.g., microwave popcorn bag)
could be an exposure source for food (D'eon and Mabury 2007; Sinclair et al. 2007;
Washburn et al. 2005).
Harada et al. 2003 reported the influence of the tap water on the human serum
concentration. The tap water was contaminated with 0.1 to 50.9 ng/L PFOS estimating a
25-50% rise in the serum PFOS concentration in those people who drink the tap water from
the contaminated waterworks. Another study examined the human exposure with PFCs in
drinking water in Arnsberg, Germany (Hölzer et al. 2008). The drinking water was highly
contaminated with PFCs from contaminated agriculture sites (Skutlarek et al. 2006). An
increase by a factor of 4 to 8 was found in blood plasma of children and adults exposed to
PFC contaminated drinking water compared to control samples from another area. These
findings indicate that drinking water is a potential source for human exposure.
Moriwaki et al. 2003 investigated PFOS and PFOA in dust from Japanese homes. Because
of the high contamination of the dust with 11–2500 ng/g for PFOS and 69–3700 ng/g for
PFOA, it was suggested that dust could be an important exposure pathways to humans.
Shoeib et al. 2005 estimated a human exposure through inhalation and dust ingestion of
~40 and ~20 ng per day, respectively. However, higher exposure intakes were assumed for
children because they spend more time on floors and carpets than adults.

Aim and outline of the work
41
2. Aim and outline of the work
Recently PFCs were discovered as emerging POPs. Because of their unique
physicochemical properties due to their combination of lipophilic and hydrophilic
characteristics, PFCs have been widely used in lots of consumer products such as
polymerization aids, stain repellents on carpets, textiles, leather, and paper products for over
50 years (Kissa 2001). From the production and use of these products, PFCs can be released
into the environment. Scientific concern about PFCs increased due to their persistence, high
bioaccumulation potential for longer-chained PFCs in the marine food web (Martin et al.
2003a; Giesy and Kannan 2001) and possible adverse effects on humans and wildlife (Austin
et al. 2003; Goecke-Flora and Reo 1996). As a result the general use of some PFCs are
restricted, however, a variety of related PFCs are still being produced by other manufacturers
(U.S. EPA 2006; European Parliament and Council 2006; Prevedouros et al. 2006).
The transportation pathways of individual PFCs to remote regions have not been
conclusively characterised to date. Two main hypothesis were proposed for the global
transportation of PFCs. Firstly, neutral, volatile precursor compounds could undergo long-
range atmospheric transport and be degraded in remote regions (Ellis et al. 2004) or secondly
ionic PFCs could be transported directly by oceanic currents or by means of sea-spray
(McMurdo et al. 2008; Yamashita et al. 2005). However, ocean measurements are very
limited and essential for the validation of models as well as quantifying fluxes of PFCs to
remote regions like the Arctic. In addition, seawater measurements of PFCs are very useful
for the identification of the dominant transportation pathway, either oceanic currents or
atmospheric transport of precursors.
Previous temporal trend studies indicated mostly increasing concentrations of PFCs in
biota from the Arctic (Bossi et al. 2005a; Dietz et al. 2008; Smithwick et al. 2006). Recently,
a few temporal trend studies observed a significant decreasing trend of FOSA (Butt et al.
2007b; Furdui et al. 2008; Hart et al. 2008a), and one study found additionally a significant
decreasing trend of PFOS in Arctic ringed seals (Butt et al. 2007b). These decreasing levels
could be caused by restrictions and bans of production and/or use of POSF. However, recent
temporal trend data on PFCs in biota tissue close to urbanised/industrialised regions with
potential high PFC emissions are lacking in the published literature. This information is
needed to examine effects of the reductions in overall emissions of PFCs on the concentration
levels in marine mammals. Furthermore, such information is useful for any future strategies
for the marine ecosystem to reduce PFC contaminations.

Aim and outline of the work
42
In this study, the analytical protocols from Taniyasu et al. 2005 and Powley et al. 2005 for
water and biota samples, respectively, were further optimised and validated. The water
samples were filtrated and the dissolved and particulate phases were extracted separately
using SPE with Oasis® WAX or Strata® XAW cartridges for the dissolved phase and
sonication with methanol for the particulate phase (see publication I; Ahrens et al. 2009c).
The biota samples were extracted using sonication with acetonitrile and subsequent clean-up
using ENVI-Carb® cartridges. This method was applied on a wide range of biological
matrices (i.e., liver, kidney, lung, heart, blood, brain, muscle, thyroid, thymus, and blubber)
(see publication III). All samples were analysed simultaneously for 40 target compounds
(i.e., PFCAs, PFSAs, PFSiAs, FTCAs, FTUCAs, FASAs, FASEs, and 6:2 FTS) plus 20 IS
using HPLC/(-)ESI-MS/MS. The optimised analytical protocol for the analysis of PFCs in
biological matrices was integrated in the report of the Marine Chemistry Working Group
(MCWG) (ICES 2008). In addition, it was participated in an international interlaboratory
study to verify the accuracy, precision, robustness and matrix effects of the analysis of PFCs
in water and biota samples (Van Leeuwen et al. 2009).
The first aim of this Ph.D. thesis was to investigate the transportation mechanisms of
PFCs in offshore surface water. Samples were taken in the German Bight, where the
occurrence and distribution pattern of PFCs was investigated to identify potential sources in
the sampling area (see publication I). In addition, the distribution of PFCs in surface water in
the Atlantic Ocean along the longitudinal gradient from Las Palmas (Spain) to St. Johns
(Canada) (15° W to 52° W) and the latitudinal gradient from the Bay of Biscay to the South
Atlantic Ocean (46° N to 26° S) was discovered. The observed spatial distribution,
characterised by increasing and decreasing concentration gradients of PFCs, can be explained
by the pattern of ocean water currents (see publication II).
The second aim of this Ph.D. thesis was to examine the mechanisms and pathways of
PFCs in harbor seals and their temporal trend in the German Bight. Firstly, concentrations and
whole body burden of PFCs in various tissues of harbor seals were determined. Furthermore,
the compound-specific distribution in liver, kidney, lung, heart, blood, brain, muscle, thyroid,
thymus and blubber of harbor seals was investigated (see publication III). Secondly, the
temporal trends and composition profiles of PFCs in archived harbor seal livers collected
from the German Bight were examined over the last decade. Finally, the association between
PFC concentrations in livers of harbor seals and the evidence of diseases, spatial distribution,
age and sex were evaluated (see publication IV).

Publication I
43Ahrens et al. / Chemosphere 2009, 76, 179−184
3. Publication I
Spatial Distribution of Polyfluoroalkyl Compounds in Seawater of the
German Bight
Lutz Ahrens a,b,*, Sebastian Felizeter a,c, Ralf Ebinghaus a
a GKSS Research Centre Geesthacht, Department for Environmental Chemistry, Institute for Coastal Research,
Max-Planck-Str. 1, DE-21502 Geesthacht, Germany b Leuphana University of Lüneburg, Institute for Ecology and Environmental Chemistry, Faculty of Environment
and Technique, DE-21335 Lüneburg, Germany c Carl-von-Ossietzky-University of Oldenburg, Institute for Chemistry and Biology of the Marine Environment,
D-26129 Oldenburg, Germany
* Corresponding author phone: +49 4152 87 2353; fax: +49 4152 87 2366; e-mail address: [email protected]
Abstract
The spatial distribution of polyfluoroalkyl compounds (PFCs) and their composition
profile was investigated in 48 water samples collected from the German Bight. All samples
were prepared by solid-phase extraction with Strata® XAW cartridges and analysed using
high performance liquid chromatography/negative electrospray ionisation-tandem mass
spectrometry (HPLC/(-)ESI-MS/MS). Concentrations of various PFCs, including
perfluorinated sulfonates (PFSAs), perfluorinated carboxylic acids (PFCAs), unsaturated
fluorotelomercarboxylic acids, perfluoroalkyl sulfonamide and sulfonamidoethanol, were
quantified. The ∑PFC concentration ranges from 9.36 ng/L to 31.2 ng/L, while
perfluorobutane sulfonate (PFBS, 3.38-17.7 ng/L) and perfluorooctanoic acid (PFOA,
2.67-7.83 ng/L) dominated. The rivers Elbe, Weser and Ems had a high influence on the
distribution of most PFCs in the German Bight, with maximum PFC concentrations found in
their estuaries, and concentrations decreasing with increasing distance from the coast.
Conversely, PFBS had its maximum concentration not in the estuaries but in the western
German Bight, which suggest an additional source, where PFBS was transported into the
German Bight with the westerly current.

Publication I
44
3.1. Introduction
Polyfluoroalkyl compounds (PFCs) are persistent against typical environmental
degradation processes and are ubiquitous distributed in the environment, having been found in
water (Yamashita et al. 2005), air (Jahnke et al. 2007c) and organisms (Giesy and Kannan
2001) around the globe. Because of their unique physicochemical properties due to their
combination of lipophilic and hydrophilic characteristics, PFCs have been widely used in
many consumer products, such as polymerisation aids, stain repellents on carpets, textiles,
leather, and paper products for over 50 years (Kissa 2001). From the production and use of
these products, PFCs can be released into the environment. In general, neutral PFCs like
perfluoroalkyl sulfonamides and fluorotelomer alcohols are less water-soluble and more
volatile than perfluorinated acids. In the atmosphere as well as under aerobic conditions, e.g.
in activated sludge, they can be degraded to perfluorinated carboxylic acids (PFCAs) and
perfluorinated sulfonates (PFSAs) (Ellis et al. 2004; Martin et al. 2006; Rhoads et al. 2008).
Previous studies examined the release of PFCs into the aqueous environment by runoff
from contaminated soil or waste water treatment plants (WWTPs) (Schultz et al. 2006b;
Skutlarek et al. 2006) and their riverine transportation (McLachlan et al. 2007). The longer-
chained PFCs are known to be bioaccumulative (Martin et al. 2003a) and have toxic effects in
biota (Austin et al. 2003; Oakes et al. 2004). As a result, the 3M Company, major producer of
perfluorooctyl sulfonyl fluoride (POSF, which is a major precursor for several PFCs),
voluntarily phased out the production in 2002, but a variety of related PFCs are still being
produced by other manufacturers (Prevedouros et al. 2006). In addition the European Union
(EU) formed a directive in October 2006, which prohibits the general use of perfluorooctane
sulfonate (PFOS) and their derivates from June 2008 (European Parliament and Council
2006). The former POSF-based products are now substituted by perfluorobutyl sulfonyl
fluoride (PBSF)-based products. Highest PFC concentrations are found in top predators
(Kannan et al. 2001b). Only a little is known about how PFCs reach the marine environment
and about their spatial distribution in the coastal area.
In this study 48 surface water samples were collected in coastal water from the German
Bight for the determination of PFCs in the water phase. We investigated the spatial
distribution of 18 PFCs in coastal water and their composition profiles to identify sources in
the urbanised/industrial sampling area. Furthermore, the relationship between concentrations
of PFCs, and dissolved organic carbon (DOC) as well as suspended particulate matter (SPM)
were examined.
Ahrens et al. / Chemosphere 2009, 76, 179−184

Publication I
45Ahrens et al. / Chemosphere 2009, 76, 179−184
3.2. Material and methods
3.2.1 Chemicals and standards
The standards used in this study are described elsewhere (Ahrens et al. 2009e). Methanol
(SupraSolv), acetonitrile (LiChrosolv), ammonium hydroxide (25% for analysis), formic acid
(98-100% suprapure) and ammonium acetate were purchased from Merck (Darmstadt,
Germany).
3.2.2 Sample collection and sample pretreatment
Surface water samples were taken onboard the research vessel Ludwig Prandtl at 48
sampling stations in the German Bight in August 2007 (see Figure 8). Details of the sampling
and the physicochemical parameters of the water samples are presented in Table S1 in the
Supplementary material. Sampling sites were chosen to show the influence of the rivers Elbe,
Weser and Ems in comparison to the westerly current along the coast of the German Bight.
Five litre water samples were collected in brown glass bottles via a metal ships’ intake system
at approximately one metre below the surface. In addition, at sampling stations 7, 29, 35 and
43 duplicate samples were collected for quality control.
Figure 8. Map showing the sampling locations in the German Bight
The samples were filtered directly after sampling onboard using glass fibre filters (GFFs,
GC/C, Whatman, ø 47 mm, > 1.2 µm). The filtrated samples were stored at 4 °C prior to solid-
phase extraction (SPE) on board ship on the same or following days. Five field blanks (FBs)
were taken to test for possible blank contamination. For the FB, 100 mL Millipore water
(Millipore, Elix 5 and Millipore Milli Q Plus) was added to a 5 L brown glass bottle and then

Publication I
46
put through SPE extraction. The FBs were then stored and extracted in the same manner as
“real” samples.
3.2.3 Solid-phase extraction
The filtrate was extracted by SPE with Strata® XAW cartridges (Phenomenex, 500 mg, 12
cc, 33 µ), similar as described elsewhere (Taniyasu et al. 2005). Prior to the extraction, the
samples were spiked with 10 ng absolute of an internal standard (IS) mix (i.e., [13C2]-PFHxA,
[13C4]-PFOA, [13C4]-PFNA, [13C4]-PFDA, [13C2]-PFUnDA, [13C2]-PFDoDA, [18O2]-PFHxS,
[13C4]-PFOS, [13C4]-PFOSi, d3-MeFOSA, d5-EtFOSA, d7-MeFOSE, d9-EtFOSE,
[13C2]-FHEA, [13C2]-FOEA, [13C2]-FDEA, [13C2]-FHUEA, [13C2]-FOUEA, [13C2]-FDUEA,
100 µL of a 0.1 µg/mL solution). Briefly, after preconditioning with 10 mL methanol and
Millipore water, the cartridge was loaded with the five litres sample at approximately 5 drops
per sec. The cartridge was then washed with 10 mL 0.1% formic acid in Millipore water and
dried for 30 min under vacuum. The elution was divided into two parts: The sulfonamides
were eluted with 20 mL acetonitrile; thereafter the acids were eluted with 15 mL 0.1%
ammonium hydroxide in methanol. Both extracts were collected separately in brown glass
vials and closed with a phenolic resin/ aluminium caps. The samples were stored in a freezer
at -20 °C after the elution steps on board ship. After the end of the sampling cruise, both
extracts were concentrated in a clean lab (class 10,000) to ~2 mL using rotary evaporator
within a few days of arrival at the lab. Finally, both extracts were combined and reduced to
150 µL under a nitrogen stream and spiked with 20 ng absolute of the injection standard
d5-EtFOSAA (InjS, 50 µL of a 0.4 µg/mL solution).
3.2.4 Instrument analysis
An HP 1100 HPLC-system (Agilent Technologies) was used with a Synergi Hydro RP
80A column (150 x 2 mm, 4 micron) by Phenomenex, combined with a suitable guard
column: Synergi 2 µ Hydro RP Mercury (20 x 2 mm, 2 micron). Modifications of the HPLC
system were made as described elsewhere (Yamashita et al. 2004) to eliminate instrumental
blank contamination. The triple-quadrupole mass spectrometer, supplied by Applied
Biosystems/MDS SCIEX (API 3000), used an electrospray ionisation (ESI) interface in
negative ionisation mode (for details see Ahrens et al. 2009e).
3.2.5 Data analysis
Quantification was performed by the internal standard method with an external
calibration. A ten-point calibration curve (1, 5, 10, 25, 50, 100, 500, 1000, 2000 and 3000 pg
injected) was used for calculation. For the compounds PFPS, PFNS, PFPeDA and PFHpDA
no standards were available, thus these PFCs were calculated from the calibrations of
Ahrens et al. / Chemosphere 2009, 76, 179−184

Publication I
47Ahrens et al. / Chemosphere 2009, 76, 179−184
corresponding substances with plus and minus one carbon atom in the carbon chain. For peak
integration only the main peak of a compound was used. The isomers were not included in the
peak integration, because of the lack of standards.
3.2.6 Quality assurance
The analytical quality of the laboratory has been approved in interlaboratory studies (Van
Leeuwen et al. 2009). As standard procedure, instrument detection limits (IDLs), method
quantification limits (MQLs), FBs (see Table 9), recoveries and duplicate samples were
examined.
Table 9. Instrument detection limits (IDLs), method quantification limits (MQLs) and field blank concentrations for the German Bight survey in August 2007 a
IDL [pg absolute] b MQL [ng/L] c Field blanks [ng/L]
PFBS 0.50 0.367 n.d. PFPS d − 0.080 n.d. PFHxS 0.31 0.097 n.d. PFOS 0.48 0.120 n.d. PFNS 0.17 0.072 n.d. 6:2 FTS 1.36 0.120 n.d. PFPA 0.51 0.158 n.d. PFHxA 0.27 0.084 n.d. PFHpA 0.36 0.077 n.d. PFOA 0.36 0.067 n.d.-(0.022) PFNA 0.35 0.039 n.d. PFDA 0.40 0.047 n.d. PFUnDA 0.29 0.019 n.d.-(0.006) PFDoDA 0.37 0.008 n.d.-(0.004) FOSA 0.33 0.004 n.d. MeFBSA 1.25 0.180 n.d. MeFBSE 1.09 0.241 n.d. FDUEA 0.58 0.016 n.d. a n.d. = not detected; blank levels were calculated from a sample volume of 100 mL Millipore water; details are given in the text; values in brackets were below the respective MQL; b IDL [ng absolute] at 3 times of the signal to noise in the calibration standards (n = 4); c MQL [ng/L] at 10 times of the signal to noise in natural samples (n = 4); d have to be considered as estimates, because no standards were available for this compound.
After the removal of all Teflon parts from the HPLC system, no instrument blank was
detected. In some FBs were found contamination levels of PFOA, PFUnDA and PFDoDA,
but all the concentrations were below the MQL. IDLs and MQLs were calculated for
substances that were found in real samples using the signal to noise ratios of 3 and 10,
respectively. The IDLs were usually lower than 1 pg absolute, while the MQLs were in low

Publication I
48
ppq level for the five litre water samples. These MQLs were approximately 3 times lower in
comparison of using only one litre sample volume. Conversely to a previous study
(Yamashita et al. 2004), for this method the background noise increase was negligible in
comparison to the increasing target peak response. The mean recoveries of the IS ranged from
23% (d3-MeFOSA) to 102% ([13C2]-FHUEA). The low recoveries of the perfluoroalkyl
sulfonamides could possibly due to a breakthrough because of the high water volume of five
litres. However, 19 IS were used to correct matrix effects as well as losses during sampling,
sample extraction, concentration, and analysis. Duplicate samples showed a good agreement
with a relative standard deviation of lower than 20% for each compound.
3.3. Results and discussion
3.3.1 Concentrations of PFCs in the German Bight
Overall 18 of the 39 examined analytes were found at the 48 sampling stations. The PFCs
quantified included C4-C6, C8 and C9 PFSAs, 6:2 FTS, C5-C12 PFCAs, MeFBSA, FOSA,
MeFBSE and FDUEA (Table S2, Table S3, and Table S4 in the Supplementary material).
The spatial distribution of ∑PFC and individual PFC concentrations in the German Bight is
shown in Figure 9. The ∑PFC concentration ranges from 9.36 ng/L (sampling station 26) to
31.2 ng/L (sampling station 13). The highest ∑PFC concentrations were found in the western
sampling station 24 and the estuary mouths of the rivers Elbe, Weser and Ems. The ∑PFC
concentrations decreased by a factor of 2-3 towards the offshore stations.
The dominant compound of the PFSAs was PFBS with concentrations ranging from
3.38 to 17.7 ng/L, while PFOS was detected in concentrations ranging from 0.69 to 3.95 ng/L.
The PFCA concentrations were dominated by PFOA (2.67 to 7.83 ng/L) and PFHxA (0.47 to
9.56 ng/L), whereas the longer-chained PFCAs (C9-C12) had usually a contribution of under
3% of the ∑PFCs. Four precursor compounds of the PFCAs and PFSAs were detected
(i.e., MeFBSA, FOSA, MeFBSE and FDUEA), with a concentration level of lower than
0.75 ng/L. Overall, PFBS was the predominated PFC in the German Bight with a composition
of ~40%, followed by PFOA (~26%), PFOS (~9%) and PFHxA (~8%). Interestingly, the
compounds PFOS and FOSA contained a contribution of ~60% branched isomers, while the
PFCAs had a contribution of <10% and for the other PFCs no branched isomers were
observed. It was previously hypothesized that the presence of branched isomers may indicate
exposure from historical releases of electrochemical fluorination (ECF) manufacturing
process (De Silva and Mabury 2006) or may be a sign of local ECF production. However, the
specific distribution and composition profile of PFCs indicates an input from the rivers and
western current and additionally an atmospheric deposition is possible.
Ahrens et al. / Chemosphere 2009, 76, 179−184

Publication I
49Ahrens et al. / Chemosphere 2009, 76, 179−184
Figure 9. Spatial distribution of ΣPFCs and individual PFC concentrations in the German Bight in ng/L. Note: The different circle sizes at the sampling stations are in proportion to the
concentration which is shown on the right side of each map
Significant correlation between DOC and ∑PFC, PFOS and PFOA concentration
(p < 0.0001, see Figure 10) and PFHxS, C6-C10 PFCA and FOSA concentration (p < 0.0001,
see Figure S1 in the Supplementary material), respectively, was found, while no correlation
had the DOC with PFBS, PFPA and PFUnDA. This correlation corresponds with the positive
relationship between sorption of PFCs to sediment and total organic carbon (TOC) amount
(Higgins and Luthy 2006). Furthermore, significant correlation between SPM and PFPS,
PFHxS, PFHpA, PFOA, PFNA (p < 0.0001), PFOS (p < 0.001), PFHxA (p < 0.012), PFDA
(p < 0.007) and FOSA (p < 0.024) was observed (see Figure S2 in the Supplementary
material). This indicates that sedimentation could be an effective removal mechanism for
PFCs in the water phase. However, the DOC and SPM concentrations decreased with
increasing distance from the coast, which suggests that the distance from the coast has a high

Publication I
50
influence on the distribution and concentration level of PFCs in the aquatic environment.
Further investigations of their physical state are necessary.
Figure 10. Relationship between concentrations of ΣPFCs, PFOS, PFOA and dissolved organic carbon (DOC) in surface water in the German Bight
3.3.2 Identification of sources of individual PFCs
Most PFCs had their highest concentrations in the river estuary and decreased with
increasing distance from the coast. But the composition pattern in the three estuaries Ems,
Weser and Elbe were not the same (Figure 9). PFOA and PFNA had a similar distribution in
all estuaries, whereas PFHpA and PFDA were mainly distributed in the rivers Weser and
Elbe. Interestingly, PFHxA was mainly found in the river Weser and not in the other both
rivers. PFHxS and PFOS were distributed in all river estuaries with highest concentrations in
the estuary of the river Ems. Investigations by Caliebe et al. 2004 determined mean
concentrations of PFCs in the river Elbe in 2003 of about 20 ng/L for PFOA and PFOS, and
1 ng/L to 3 ng/L for other PFCs like PFHxA, PFNA, PFDA, PFHxS, and FOSA. Another
study in the river Elbe reported PFHxA, PFHpA, PFOA and PFNA concentrations of
15.4 ng/L, 2.7 ng/L, 7.6 ng/L and 0.27 ng/L, respectively, in 2005 (McLachlan et al. 2007).
These concentrations were 2 to 5 times higher than measured in the estuaries in this study.
Potential sources for PFCs into the rivers Ems, Weser, and Elbe could be caused by effluents
from domestic and industrial WWTPs and/or diffuse sources. The two big cities Bremen and
Hamburg, located at the rivers Weser and Elbe, respectively, could be an additionally source
Ahrens et al. / Chemosphere 2009, 76, 179−184

Publication I
51Ahrens et al. / Chemosphere 2009, 76, 179−184
for PFCs because of their several industries like petroleum, textile, paper and polymer
industries. Furthermore, the rivers transported the PFCs from the source regions into the
German Bight, while their discharge (the mean discharge for the rivers Ems, Weser and Elbe
was 80 m3/s, 327 m3/s, and 711 m3/s, respectively, for the year 2007) could have a high
influence on the distribution pattern of PFCs in the German Bight. Finally, McLachlan et al.
2007 estimated a total flux of 0.26 (PFNA) to 14.3 (PFOA) tonnes per year for 14 major
rivers in Europe indicating the rivers as the major input pathway into the marine environment.
The occurrence of PFPS and PFNS at low concentration levels (0.06-0.86 ng/L and
0.11-028 ng/L, respectively) could be due to the POSF-based and PBSF-based production,
where uneven carbon chained PFSAs can be produced as by-products (Giesy and Kannan
2002). In contrast to the other PFCs, PFBS composition decreased from 40-60% in the
offshore area to 15-20% in the river estuary and its highest composition was found at the
western sampling stations 20 (58%) and 24 (61%). This is probably the result of an additional
source, where PFBS was transported into the German Bight with the westerly current. It is
possible that this contamination of PFBS was originating from the river Rhine, where
concentrations of up to 46 ng/L were found (Skutlarek et al. 2006).
Positive correlations between C6-C10 PFCAs and C5, C6 and C8 PFSAs (Table S5 in the
Supplementary material) suggest a common pollution source of these compounds into the
marine environment. Possible sources could be the effluents of WWTPs (Schultz et al. 2006b)
and rain or surface runoff (Kim and Kannan 2007). In addition, the usage of aqueous film-
forming foams (AFFF) could be a source of PFCs, which correspond with the detection of
6:2 FTS in this study (Schultz et al. 2004). On the other hand, the detection of the
perfluoroalkyl sulfonamide (i.e., MeFBSA, FOSA, and MeFBSE) and FDUEA indicates
atmospheric deposition and/or incomplete biodegradation (Loewen et al. 2005; Martin et al.
2006; Rhoads et al. 2008).
So et al. 2004 found differences in the distribution patterns due to a seasonal shift of the
water currents. The circulation in the North Sea is stable throughout the year in contrast to the
situation at the Pearl River Delta, China, and thus it is unlikely that the distribution pattern in
the North Sea will change dramatically. Nevertheless, unusual weather conditions like east
wind might change the pattern on a smaller scale.
3.3.3 Comparison of PFC concentrations in the German Bight with other coastal water
studies
Minimum and maximum PFOS and PFOA concentrations in coastal water are shown in
Table 10. The concentration of PFOS and PFOA in previous studies in the German Bight,
Pearl River Delta (China), coastal area of Hong Kong, coastal area of Korea, coastal area of

Publication I
52
Dalian (China) were in the same range as in this study (Caliebe et al. 2004; Ju et al. 2008; So
et al. 2004; Theobald et al. 2007a; Yamashita et al. 2005). Lower concentrations of PFOS and
PFOA were only found in the South China Sea and West Baltic Sea (Theobald et al. 2007a;
Yamashita et al. 2005). Highest concentrations of PFOA (320 ng/L) and PFOS (720 ng/L)
were found at a contaminated coastal area of South Korea (So et al. 2004). In general, except
for the coastal area of South Korea, the concentration of PFOA was higher than of PFOS,
which suggests that similar sources exist in the urbanised/industrial coastal areas at the
different locations. This corresponds with decreased contamination levels of PFOS and PFOA
with increasing distance from the coast.
Table 10. Global comparison of PFOA and PFOS concentrations in seawater from the German Bight with coastal water studies from other areas
Location Concentration [ng/L] References PFOS PFOA
Coastal area of Japan <2.5-59 n.a. Taniyasu et al. 2003
German Bight, Germany 0.25-7.0 3-13 Caliebe et al. 2004
Coastal area of South Korea 0.04-730 0.24-320 So et al. 2004
Perl River Delta, China 0.02-12 0.24-16
Hong Kong, China 0.09–3.1 0.73-5.5
Tokyo Bay, Japan 0.34-58 1.8-192 Yamashita et al. 2005
Coastal area of Hong Kong 0.07-2.6 0.67-5.5
Coastal area of Korea 0.04-2.5 0.24-11
South China Sea 0.008-0.11 0.16-0.42
German Bight, Germany 0.28 - 3.1 0.54 - 5.9 Theobald et al. 2007a
West Baltic Sea 0.33-0.90 0.47-1.1
Coastal area of Dalian, China <0.10-2.3 0.17-38 Ju et al. 2008
German Bight, Germany 0.69 - 3.95 2.67 - 7.83 This study
n.a. = not available.
3.4. Conclusion
Only a few studies exist about the spatial distribution of PFCs in coastal waters. It is very
important to identify the sources for individual PFCs and their distribution mechanism. High
concentrations (> 1 ng/L) of shorter-chained PFCAs (C5-C8), PFBS, PFHxS and PFOS in
coastal water of the German Bight suggests that these compounds are entering the marine
environment from rivers and can potentially undergo long-range transportation via the ocean
currents (Yamashita et al. 2005). Dilution processes and/or adsorption to suspended particle
matter could be responsible for the decreasing concentrations, however, PFCs are very
Ahrens et al. / Chemosphere 2009, 76, 179−184

Publication I
53Ahrens et al. / Chemosphere 2009, 76, 179−184
persistent and only the longer-chained PFCs (≥ C8) have a high affinity to the sediment
(Higgins and Luthy 2006; Theobald et al. 2007a). In addition, long-range transportation could
also be possible by the atmosphere, which is in agreement with the detection of the precursor
compounds MeFBSA, FOSA, MeFBSE and FDUEA.
Most PFCs had their highest concentrations in the river estuaries, but in contrast, PFBS
had its maximum concentration in the western German Bight. This study suggests that PFBS
has a significant source outside the study region, which makes research on the short-chained
PFCs even more important. However, most studies have usually focused on PFOA and PFOS
and future studies should be expanded to include the shorter-chained PFCAs and PFSAs.
The occurrence of high concentrations of PFCs in coastal water could possibly be
problematic, because they are bioavailable and can accumulate in the marine food chain.
Chemical ‘fingerprints’ may help to identify specific sources of PFC contamination into the
aqueous environment. This research, the spatial distribution of PFCs in coastal area, is very
important for the understanding of the transportation and fate of PFCs in the marine
environment.
Acknowledgement
We kindly acknowledge the German Federal Environmental Foundation for sponsoring
this project.

Publication II
54
4. Publication II
Longitudinal and Latitudinal Distribution of Perfluoroalkyl
Compounds in the Surface Water of the Atlantic Ocean
Lutz Ahrens a,b,*, Jonathan L. Barber c,d, Zhiyong Xie a, Ralf Ebinghaus a
a GKSS Research Centre Geesthacht, Department for Environmental Chemistry, Institute for Coastal Research,
Max-Planck-Str. 1, DE-21502 Geesthacht, Germany b Leuphana University of Lüneburg, Institute for Ecology and Environmental Chemistry, Faculty of Environment
and Technique, DE-21335 Lüneburg, Germany c Lancaster University Centre for Chemicals Management, Lancaster Environment Centre, Lancaster LA1 4YQ,
United Kingdom d Current address: Cefas Lowestoft Laboratory, Centre for Environment, Fisheries and Aquaculture Science,
Pakefield Road, Lowestoft, Suffolk NR33 0HT, United Kingdom
* Corresponding author phone: +49 4152 87 2353; fax: +49 4152 87 2366; e-mail address: [email protected]
Abstract
Perfluoroalkyl compounds (PFCs) were determined in 2 L surface water samples collected
in the Atlantic Ocean onboard the research vessels Maria S. Merian along the longitudinal
gradient from Las Palmas (Spain) to St. Johns (Canada) (15° W to 52° W) and Polarstern
along the latitudinal gradient from the Bay of Biscay to the South Atlantic Ocean (46° N to
26° S) in spring and fall 2007, respectively. After filtration the dissolved and particulate
phases were extracted separately, and PFC concentrations were determined using high-
performance liquid chromatography interfaced to tandem mass spectrometry. No PFCs were
detected in the particulate phase. This study provides the first concentration data of
perfluorooctanesulfonamide (FOSA), perfluorohexanoic acid, and perfluoroheptanoic acid
from the Atlantic Ocean. Results indicate that trans-Atlantic Ocean currents caused the
decreasing concentration gradient from the Bay of Biscay to the South Atlantic Ocean and the
concentration drop-off close to the Labrador Sea. Maximum concentrations were found for
FOSA, perfluorooctanesulfonate, and perfluorooctanoic acid at 302, 291, and 229 pg/L,
respectively. However, the concentration of each single compound was usually in the tens of
picograms per litre range. South of the equator only FOSA and below 4° S no PFCs could be
detected.
Ahrens et al. / Environ. Sci. Technol. 2009, 43, 3122−3127
Publication II
55
Introduction
Perfluoroalkyl compounds (PFCs) are persistent against the typical environmental
degradation processes and have been found in water, wildlife, and human tissues around the
globe (Giesy and Kannan 2001; Hansen et al. 2001; Yamashita et al. 2005). Because of their
unique physicochemical properties due to their combination of lipophilic and hydrophilic
characteristics, PFCs have been widely used in a lot of consumer products such as
polymerization aids and stain repellents on carpets, textiles, leather, and paper products for
over 50 years (Kissa 2001). From the production and use of these products, PFCs can be
released into the environment. PFCs could be bioaccumulative (Martin et al. 2003a) and have
toxic effects in biota (Austin et al. 2003; Oakes et al. 2004). The transportation pathways of
PFCs to remote regions have not been conclusively characterized to date. Two main
hypotheses were proposed for the global transportation of PFCs. First, neutral, volatile
precursor compounds could undergo long-range atmospheric transport and be degraded in
remote regions (Ellis et al. 2004), or second, ionic PFCs could be transported directly by
oceanic currents or by means of sea spray (Armitage et al. 2006; McMurdo et al. 2008).
The first hypothesis is supported by the determination of precursor compounds, such as
fluorotelomer alcohols (FTOHs), perfluoalkanesulfonamidoethanols, in the Arctic atmosphere
(Shoeib et al. 2006). The second hypothesis is supported by the fact that ionic PFCs such as
the perfluorinated carboxylic acids (PFCAs) and perfluorinated sulfonates (PFSAs) have high
water solubilities and low pKa values and are therefore dissociated at environmentally
relevant pH values (Kissa 2001). The ocean currents were calculated by Prevedouros and
co-workers to be the major transportation pathway for PFCAs in comparison to atmospheric
transportation (Prevedouros et al. 2006). However, irrespective of the transportation pathway
involved, high concentrations of PFCs have been found in biota from the Canadian Arctic,
especially in marine mammals which are top predators in the marine ecosystem (Martin et al.
2004a).
The global occurrence of PFCs in open-ocean water was described first by Yamashita et
al. 2005. Further investigations of PFCs in the Indian Ocean and close to Antarctica were
described subsequently (Wei et al. 2008). Detected concentrations are usually around some
tens to hundreds of picograms per litre, depending on the location and the compound. It was
hypothesized that PFCs could be transported globally with the thermohaline circulation
system (Yamashita et al. 2008), with the open-ocean water acting as a final sink for
perfluorooctanesulfonate (PFOS) and perfluorooctanoic acid (PFOA) (Yamashita et al. 2005).
However, ocean measurements are very limited and essential for the validation of models as
well as quantifying inputs of PFCs to remote environments such as the Arctic. Further,
Ahrens et al. / Environ. Sci. Technol. 2009, 43, 3122−3127
Publication II
56
seawater measurements of PFCs are very useful for determining the dominant transportation
pathway, either oceanic currents or atmospheric transport of precursors.
The aim of this study was to investigate the longitudinal and latitudinal gradient of PFCs
in surface water in the Atlantic Ocean. Sixty water samples were collected during cruises on
the research vessels Maria S. Merian, from Las Palmas (Spain) to St. Johns (Canada) (15° W
to 52° W), and Polarstern, from the Bay of Biscay to the South Atlantic Ocean (46° N to
26° S), in spring and fall 2007, respectively. Concentrations of various PFCs, including
perfluorobutanesulfonate (PFBS), PFOS, perfluorooctanesulfonamide (FOSA),
perfluorohexanoic acid (PFHxA), perfluoroheptanoic acid (PFHpA), PFOA, and
perfluorononanoic acid (PFNA), were quantified in open-ocean water samples. The observed
distribution, characterized by increasing and decreasing concentration gradients of PFCs, can
be explained by the pattern of ocean water currents. A comparison with open-ocean water
PFC data from Yamashita et al. 2005, 2008 and Wei et al. 2008 is given. This study provides
the first evidence for the presence of FOSA, PFHxA, and PFHpA in the Atlantic Ocean.
Experimental Section
Chemicals. The target analytes include 33 ionic PFCs (PFCAs, PFSAs, perfluorinated
sulfinates (PFSiAs), fluorotelomer carboxylic acids (FTCAs), and unsaturated fluorotelomer
carboxylic acids (FTUCAs)) as well as 7 neutral PFC precursor compounds
(perfluoroalkanesulfonamides, perfluoroalkanesulfonamidoethanols) (for details, see Ahrens
et al. 2009e). Methanol (SupraSolv), acetonitrile (LiChrosolv), ammoniumhydroxide
(25% for analysis), formic acid (98-100% suprapure), and ammonium acetate were purchased
from Merck (Darmstadt, Germany).
Sampling Campaign. Surface water samples were collected with the research vessels Maria
S. Merian (Leibniz Institute for Baltic Sea Research (IOW), Warnemünde) and Polarstern
(Alfred-Wegener-Institute (AWI), Bremerhaven) from April 14 to April 30 (cruise
“MSM05”) and Oct 29 to Nov 22 (cruise “ANT XXIV-1”), 2007, respectively. The first
cruise with the R/V Maria S. Merian was performed along the longitudinal gradient from 15°
W to 52° W, and the second cruise with the R/V Polarstern was performed along the
latitudinal gradient from 46° N to 26° S (Figure 11, Table S6 in the Supplementary material).
60 water samples (2 L) were collected in brown glass bottles via the ships’ intake systems at
approximately 11 m below the surface at sampling stations 1-42 (46° N to 26° S) and A-R
(15° W to 52° W). In addition, at sampling stations J, K, L, O, and R water samples were
collected at 2 m depth and directly at the water surface by an external sampler in a brown
glass bottle, and at sampling station L two deep-water samples were taken at depths of 200
and 3800 m with a rosette-type sampler (Seabird SBE-32 carousel water sampler equipped
Ahrens et al. / Environ. Sci. Technol. 2009, 43, 3122−3127
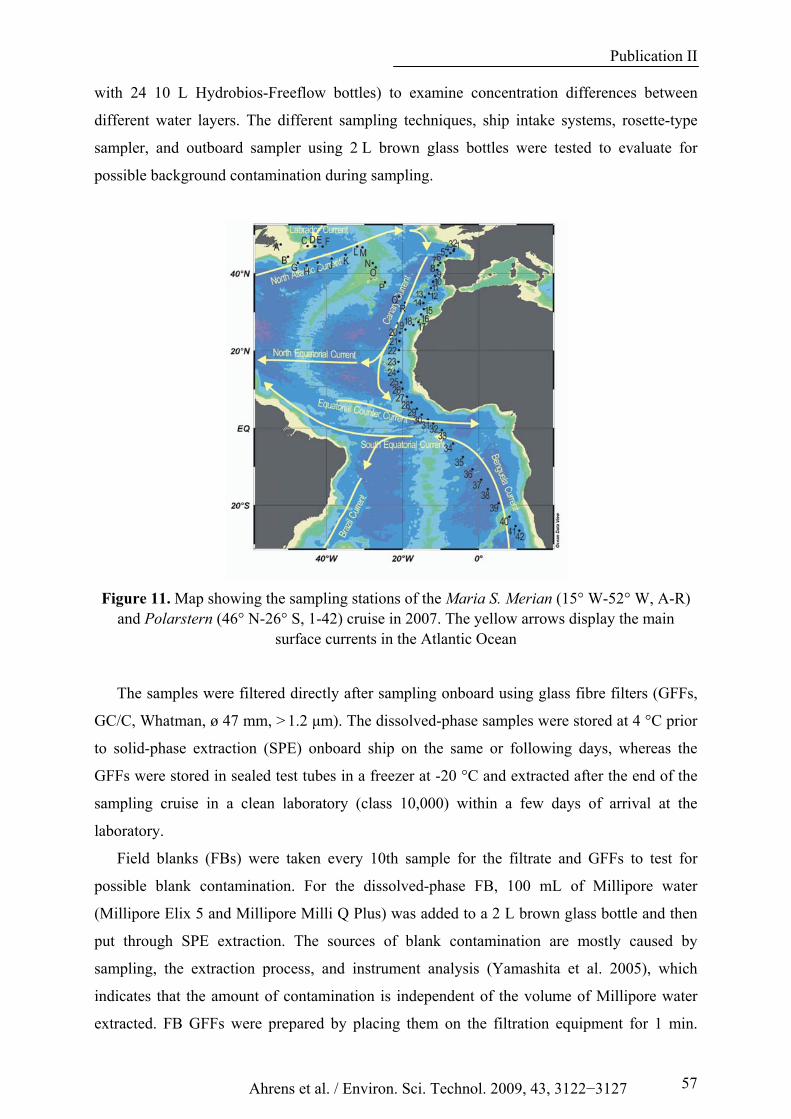
Publication II
57
with 24 10 L Hydrobios-Freeflow bottles) to examine concentration differences between
different water layers. The different sampling techniques, ship intake systems, rosette-type
sampler, and outboard sampler using 2 L brown glass bottles were tested to evaluate for
possible background contamination during sampling.
Figure 11. Map showing the sampling stations of the Maria S. Merian (15° W-52° W, A-R) and Polarstern (46° N-26° S, 1-42) cruise in 2007. The yellow arrows display the main
surface currents in the Atlantic Ocean
The samples were filtered directly after sampling onboard using glass fibre filters (GFFs,
GC/C, Whatman, ø 47 mm, > 1.2 μm). The dissolved-phase samples were stored at 4 °C prior
to solid-phase extraction (SPE) onboard ship on the same or following days, whereas the
GFFs were stored in sealed test tubes in a freezer at -20 °C and extracted after the end of the
sampling cruise in a clean laboratory (class 10,000) within a few days of arrival at the
laboratory.
Field blanks (FBs) were taken every 10th sample for the filtrate and GFFs to test for
possible blank contamination. For the dissolved-phase FB, 100 mL of Millipore water
(Millipore Elix 5 and Millipore Milli Q Plus) was added to a 2 L brown glass bottle and then
put through SPE extraction. The sources of blank contamination are mostly caused by
sampling, the extraction process, and instrument analysis (Yamashita et al. 2005), which
indicates that the amount of contamination is independent of the volume of Millipore water
extracted. FB GFFs were prepared by placing them on the filtration equipment for 1 min.
Ahrens et al. / Environ. Sci. Technol. 2009, 43, 3122−3127

Publication II
58
Both types of field blanks were then stored and extracted in the same manner as “real”
samples.
Sample Extraction and Instrumental Analysis. The filtrate and the GFFs were separately
spiked with 10 ng absolute of an internal standard (IS) mix (i.e., [13C2]PFHxA, [13C4]PFOA,
[13C4]PFNA, [13C4]PFDA, [13C2]PFUnDA, [13C2]PFDoDA, [18O2]PFHxS, [13C4]PFOS,
[13C4]PFOSi, d3-MeFOSA, d5-EtFOSA, d7-MeFOSE, d9-EtFOSE, [13C2]FHEA, [13C2]FOEA,
[13C2]FDEA, [13C2]FHUEA, [13C2]FOUEA, [13C2]FDUEA, 100 μL of a 0.1 μg/mL solution).
The filtrate was spiked with the IS mix and extracted by SPE with Oasis® WAX cartridges
(Waters, 150 mg, 6 cm3, 30 μm), as described elsewhere (Taniyasu et al. 2005) with some
modifications. Briefly, after being preconditioned with 5 mL of methanol and Millipore
water, the cartridge was loaded with the 2 L sample at approximately 4 drops/s
(~0.1 mL/min). The cartridge was then washed with 5 mL of 0.1% formic acid in Millipore
water and dried for 30 min under vacuum. After the loading and drying steps onboard the
ships, the cartridges were stored in a freezer at -20 °C. The cartridges were eluted after the
end of the sampling cruise in a clean laboratory (class 10,000) within a few days of arrival at
the laboratory. The elution was divided into two parts: The sulfonamides were eluted with
14 mL of acetonitrile; thereafter the acids were eluted with 5 mL of 0.1% ammonium
hydroxide in methanol. The combined extract was reduced to 150 μL under a nitrogen stream
and spiked with 20 ng absolute of the injection standard d5-EtFOSAA (InjS, 50 μL of a
0.4 μg/mL solution).
The particulate matter (> 1.2 μm) was analyzed by sonication as described elsewhere
(Higgins and Luthy 2006) with some modifications. The GFF was spiked with the same IS
mix as the filtrate and sonicated with 100 mL of methanol for 1 h. This extraction was
performed twice, and the two fractions were combined, evaporated by rotary evaporation, and
filtered. The extract was reduced to 150 μL under a nitrogen stream and spiked with 20 ng of
the InjS (see above). Finally, the extracts from the dissolved- and particulate-phase samples
were analyzed using high-performance liquid chromatography coupled with tandem mass
spectrometry (HPLC-MS/MS). An HP 1100 HPLC system (Agilent Technologies) was used
with a Synergi Hydro RP 80A column (150 × 2 mm, 4 μm) by Phenomenex, combined with a
suitable guard column: Synergi 2 μ Hydro RP Mercury (20 × 2 mm, 2 μm). The triple-
quadrupole mass spectrometer, supplied by Applied Biosystems/MDS SCIEX (API 3000),
used an electrospray ionization (ESI) interface in negative ionization mode (for details see
Ahrens et al. 2009e).
Ahrens et al. / Environ. Sci. Technol. 2009, 43, 3122−3127
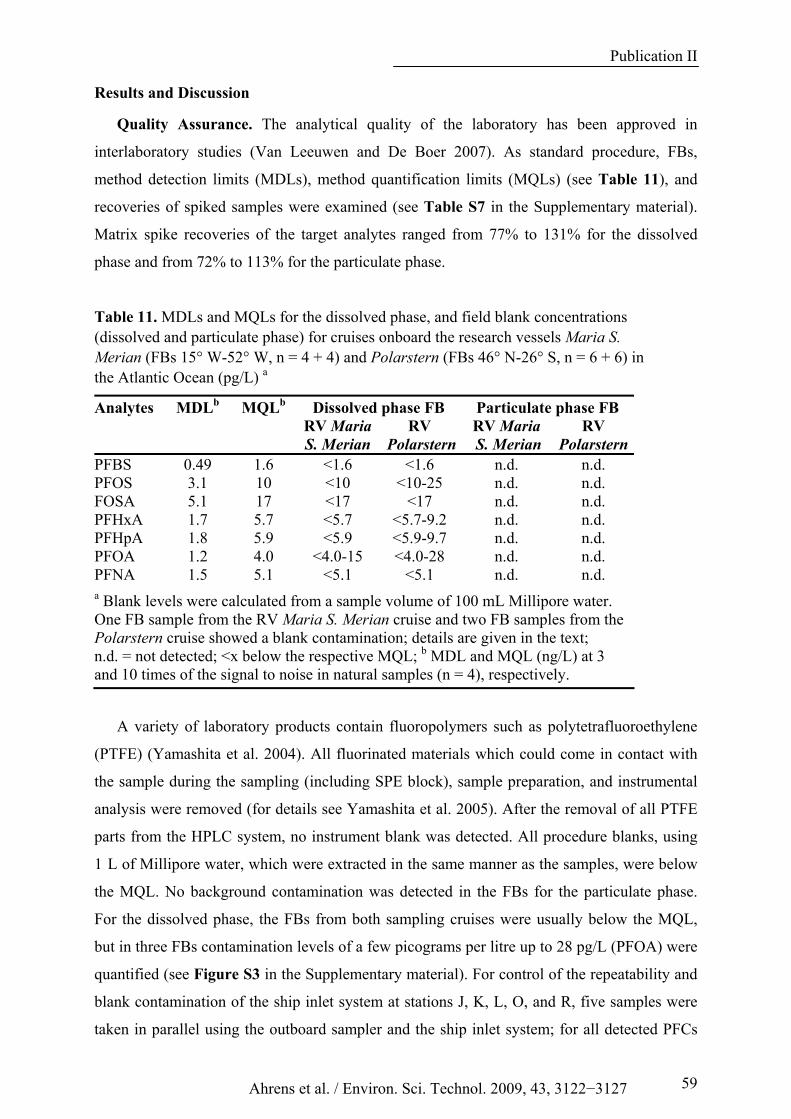
Publication II
59
Results and Discussion
Quality Assurance. The analytical quality of the laboratory has been approved in
interlaboratory studies (Van Leeuwen and De Boer 2007). As standard procedure, FBs,
method detection limits (MDLs), method quantification limits (MQLs) (see Table 11), and
recoveries of spiked samples were examined (see Table S7 in the Supplementary material).
Matrix spike recoveries of the target analytes ranged from 77% to 131% for the dissolved
phase and from 72% to 113% for the particulate phase.
Table 11. MDLs and MQLs for the dissolved phase, and field blank concentrations (dissolved and particulate phase) for cruises onboard the research vessels Maria S. Merian (FBs 15° W-52° W, n = 4 + 4) and Polarstern (FBs 46° N-26° S, n = 6 + 6) in the Atlantic Ocean (pg/L) a
Analytes MDLb MQLb Dissolved phase FB Particulate phase FB RV Maria
S. Merian RV
PolarsternRV Maria S. Merian
RV Polarstern
PFBS 0.49 1.6 <1.6 <1.6 n.d. n.d. PFOS 3.1 10 <10 <10-25 n.d. n.d. FOSA 5.1 17 <17 <17 n.d. n.d. PFHxA 1.7 5.7 <5.7 <5.7-9.2 n.d. n.d. PFHpA 1.8 5.9 <5.9 <5.9-9.7 n.d. n.d. PFOA 1.2 4.0 <4.0-15 <4.0-28 n.d. n.d. PFNA 1.5 5.1 <5.1 <5.1 n.d. n.d. a Blank levels were calculated from a sample volume of 100 mL Millipore water. One FB sample from the RV Maria S. Merian cruise and two FB samples from the Polarstern cruise showed a blank contamination; details are given in the text; n.d. = not detected; <x below the respective MQL; b MDL and MQL (ng/L) at 3 and 10 times of the signal to noise in natural samples (n = 4), respectively.
A variety of laboratory products contain fluoropolymers such as polytetrafluoroethylene
(PTFE) (Yamashita et al. 2004). All fluorinated materials which could come in contact with
the sample during the sampling (including SPE block), sample preparation, and instrumental
analysis were removed (for details see Yamashita et al. 2005). After the removal of all PTFE
parts from the HPLC system, no instrument blank was detected. All procedure blanks, using
1_L of Millipore water, which were extracted in the same manner as the samples, were below
the MQL. No background contamination was detected in the FBs for the particulate phase.
For the dissolved phase, the FBs from both sampling cruises were usually below the MQL,
but in three FBs contamination levels of a few picograms per litre up to 28 pg/L (PFOA) were
quantified (see Figure S3 in the Supplementary material). For control of the repeatability and
blank contamination of the ship inlet system at stations J, K, L, O, and R, five samples were
taken in parallel using the outboard sampler and the ship inlet system; for all detected PFCs
Ahrens et al. / Environ. Sci. Technol. 2009, 43, 3122−3127

Publication II
60
no significant differences were observed (Mann-Whitney U-test [p < 0.01]). MDLs and
MQLs were calculated for substances that were found in real samples using signal-to-noise
ratios of 3 and 10, respectively. The MDLs were in the low pictogram per litre range for the
2 L water samples. Matrix spike recoveries of the IS at two different spike levels (5 and
20 ng/L) ranged from 23% (d3-MeFOSA) to 90% ([13C2]FHUEA) for the dissolved phase and
from 50% (d3-MeFOSA) to 124% ([13C2]PFHxA) for the particulate phase.
Concentrations of PFCs in the Atlantic Ocean. In this study, 40 PFCs were measured in the
water samples. PFBS, PFOS, FOSA, PFHxA, PFHpA, PFOA, and PFNA could be quantified
in the dissolved phase of the marine water samples in a concentration range of <MQL to
1115 pg/L; all other PFCs were below the corresponding MDLs. PFCs were not detectable in
the particulate phase. The low particle mass in the 2 L water samples could be responsible for
the not detectable PFC concentration in the particulate phase in the Atlantic Ocean; however,
the partitioning behaviour of PFCs is an important future research field to evaluate their
physical state and bioavailability. To the authors’ knowledge, this is the first report of
quantifiable concentrations of PFHxA, PFHpA, and FOSA in surface water in the Atlantic
Ocean. At five sampling locations, water samples were taken in parallel at 11 and 2 m depths
and directly at the surface. No correlation between sampling depth and concentration levels
was observed, which indicates that there is a well-mixed zone between the surface and 11 m
water depth in open-ocean waters. Ju et al. 2008 found at three near-shore sites that the
surface microlayer (50 μL thickness) had by a factor of 24-109 higher PFOS concentration
than the subsurface water (> 30 cm depth); however, the results are not comparable because of
the different sampling techniques. Concentrations of PFCs at location L in the two deep-water
samples at 200 and 3800 m were below the MDL. Yamashita et al. investigated vertical
profiles in the Labrador Sea, Middle Atlantic Ocean, South Pacific Ocean, and Japan Sea,
where they detected relatively constant concentration levels of PFOS, PFOA, and PFBS down
to 2000 m in the Labrador Sea and a decreasing concentration gradient with water depth in the
other areas. They suggested that the global circulation system has an influence on the
occurrence of PFCs in deep water (Yamashita et al. 2008). Our deep-water samples were
taken far away from downwelling currents, which explains why no PFCs were detected.
Ahrens et al. / Environ. Sci. Technol. 2009, 43, 3122−3127

Publication II
61
Figure 12. Individual PFC concentrations (pg/L) and ambient temperature are given from the Polarstern cruise (46° N-26° S, 1-42) in 2007
The longitudinal and latitudinal distribution of ΣPFC concentrations in the Atlantic Ocean
is shown in Figure 12 and Figure 13, and Table S8 in the Supplementary material. The
highest ΣPFC concentration (1115 pg/L) was found in the Bay of Biscay close to the
European source area. A decreasing north to south latitudinal gradient was observed toward
the Canary Islands where the mean ΣPFC concentration declined by a factor of 6 to
142-191 pg/L (sampling stations 16 and 17). The ΣPFC concentrations remained relatively
constant toward the south from the Canary Islands down to 10° N. In the equator area, the
ΣPFC concentrations decreased by a factor of 4, relative to those of the Canary Islands down
to 10° N, with only FOSA quantifiable at 37-53 pg/L (sampling stations 31-34). South of
4° S, no PFCs were detected. The west to east transect in the North Atlantic showed a
different pattern of concentrations. The ΣPFC concentrations east of 25° W (sampling stations
G-R) and at sampling points A and B at the coast from Canada ranged from 52 to 117 pg/L
and were on average a factor of 2 higher than those of samples C-F, clustered north of the
main transect close to the Labrador Sea (n.d. to 40 pg/L). The increasing concentrations,
observed from sampling station L to sampling station R, could be influenced by latitudinal as
well as longitudinal trends. Two-thirds of the water samples contained quantifiable
concentrations of PFOA, which was the most abundant compound in the water samples from
the Atlantic Ocean, with a mean contribution of 37% to the ΣPFCs and a concentration range
from <4.0 to 229 pg/L. PFNA was detected in 52% of the water samples at concentrations
Ahrens et al. / Environ. Sci. Technol. 2009, 43, 3122−3127

Publication II
62
greater than the LOQ, but the concentrations from <5.1 to 107 pg/L were less than those of
PFOA. Concentrations of the other PFCs ranged from <17 to 307 pg/L for FOSA, from
<10 to 291 pg/L for PFOS, from <5.7 to 127 pg/L for PFHxA, from <5.9 to 104 pg/L for
PFHpA, and from <1.6 to 60 pg/L for PFBS; however, the concentrations were below the
MQL in more than half of the samples.
Figure 13. Individual PFC concentrations (pg/L) and ambient temperature are given from the Maria S. Merian cruise (15° W-52° W, A-R) in 2007
Comparison with Other Ocean Water PFC Measurements. Minimum and maximum PFC
concentrations in surface open-ocean water from the Atlantic, Pacific, and Indian Oceans are
shown in Table 12. In previous studies, the highest concentrations of PFOA and PFOS were
found in the North and Mid Atlantic Ocean and the Western Pacific Ocean, while the lowest
concentrations were observed in the Central and Southern Pacific and the Indian Ocean
(Theobald et al. 2007b; Wei et al. 2008; Yamashita et al. 2005; Yamashita et al. 2008). The
results presented here can be compared with open-ocean water samples presented from
Yamashita et al. 2005. They collected samples from the North and Middle Atlantic Ocean in
2002-2004 and found concentration levels of several tens of picograms per litre for
perfluorohexanesulfonate (PFHxS), PFOS, and PFNA to a few hundreds of picograms per
litre for PFOA. A similar study from Theobald et al. 2007b was carried out from 53° N to
30° S in the Atlantic Ocean in 2005. The concentrations of PFOA and PFOS were in a range
of a few tens of picograms per litre with a maximum concentration of 170 pg/L for PFOS.
Both studies (Theobald et al. 2007b; Yamashita et al. 2005) reported concentrations in the
same range as in this study, except for PFHxS, which was found in the first study, but could
not be detected by us.
Concentrations of PFOS and PFOA reported in the West Pacific Ocean are in the same
range as found in the Atlantic in this study, with concentrations of PFOS and PFOA in the
Central and South Pacific and Indian Oceans about 1 magnitude lower than in the North
Ahrens et al. / Environ. Sci. Technol. 2009, 43, 3122−3127

Publication II
63
Atlantic Ocean. PFBS and PFNA were also found in the Central to East Pacific Ocean and the
Antarctic region, respectively, but the concentrations were less than those found in the
Atlantic Ocean. The global distribution of PFBS might originate from the increasing
production of n-methyl perfluorobutane sulfonamidoethanol (MeFBSE) and related products
with four perfluorinated carbons, which was introduced after the voluntary phase-out of
perfluorooctanesulfonyl fluoride (POSF) by the 3M Co. in 2000 (3M 2000; D'eon et al. 2006).
In comparison to this study, FOSA, PFHxA, and PFHpA could not be detected or were not
analyzed in the Pacific and Indian Oceans, respectively. Conversely, PFHxS and PFDoDA
were detected in the Indian Ocean and Arctic region in the few picograms per litre range,
whereas both compounds could not be detected in this study.
Table 12. Comparison of minimum and maximum PFC concentrations in surface open-ocean water with literature data (pg/L) a
Location PFBS PFHxS PFOS FOSA PFHxA PFHpA PFOA PFNA PFDoDA
North Atlantic Ocean (n=9)
n.a. 4.1-6.1 8.6-36 n.a. n.a. n.a. 160-338 15-36 n.a.
Mid Atlantic Ocean (n=7)
n.a. 2.6-12 37-73 n.a. n.a. n.a. 100-439 n.a. n.a.
Western Pacific Ocean (n=2)
n.a. 2.2-2.8 54-78 n.a. n.a. n.a. 136-142 n.a. n.a.
Yamashita et al. 2005
Central to Eastern Pacific Ocean (n=12)
n.a. 0.1-1.6 1.1-20 n.a. n.a. n.a. 15-62 1.0-16 n.a.
Theobald et al. 2007b
North to South Atlantic Ocean (n=22)
n.a. n.a. <14-170 n.a. n.a. n.a. <17-90 n.a. n.a.
Yamashita et al. 2008
South Pacific Ocean (n=5)
n.a. n.a. <5-11 n.a. n.a. n.a. <5-11 n.a. n.a.
Central and Southern Pacific Ocean (n=9)
<25 <5 <5-21 <5 <5 <5 <5-7.0 <5 <1
Indian Ocean (n=7)
<5 <5 <5-8.6 n.a. <5 <5 <5-11 <5 <1-1.4
Wei et al. 2008
Antarctic region (n=5)
<1(5)-2.9 <1(5) 5.1-22.6 n.a. <5 <5 <5 <5 <1-1.1
North Atlantic Ocean (n=40)
<1.6-60 n.d. <10-291 <17-307 <5.7-127 <5.9-104 <4.0-229 <5.1-107 n.d.
Mid Atlantic Ocean (n=10)
<1.6 n.d. <10-60 <17-60 <5.7 <5.9-9.7 <4.0-87 <5.1-35 n.d.
This study
South Atlantic Ocean (n=10)
<1.6 n.d. <10 <17-53 <5.7 <5.9 <4.0 <5.1 n.d.
a n.d. = not detected; n.a. = not analysed; <x below the respective MQL.
Yamashita et al. have studied vertical profiles of several PFCs in the Labrador Sea,
Middle Atlantic Ocean, South Pacific Ocean, and Japan Sea in 2004 and 2005 (Yamashita et
al. 2008). The surface water concentrations of PFOA and PFOS in the Northwest Atlantic
Ahrens et al. / Environ. Sci. Technol. 2009, 43, 3122−3127

Publication II
64
Ocean were comparable with those from this study, but in addition in this study, PFHpA and
PFNA were detected and PFBS was not detected in this area.
Impact of the Ocean Currents on the PFC Pattern and Concentration Level. The
occurrence of elevated PFC levels in the Arctic ecosystem (Dietz et al. 2008) raises the
question about the global transportation and fate of PFCs. In addition to the atmosphere, the
ocean currents could be an important global transport pathway for transport of PFCs from
industrial to remote areas (Yamashita et al. 2005). This study examined the impact of
environmental factors, such as ocean currents, on the distribution of PFCs in the Atlantic
Ocean. The PFC concentration distribution along the latitudinal gradient will be influenced by
the Canary, Equatorial Counter, and Benguela Currents (see Figure 11 and Figure 12). The
Canary Current comes from the north from the European Continent source region and crosses
the Equatorial Counter Current and the Benguela Current in the equator area. The Benguela
Current has for its origin Antarctic water with low PFC loading (Wei et al. 2008), and the
influence of this water body resulted in a rapid decrease of ΣPFC concentrations to below the
MDLs. The presence of cold surface water from the Benguela Current was confirmed by the
drop-off of the water temperature from the equator region to the south. Furthermore, the West
African coast seemed to have no impact on the concentration level, which suggests lack of
sources (e.g., river discharge) from this area in contrast to the industrial European area. It is
probable that PFC-laden water from the Canary Current was transported to the west and
northwest by the North and South Equatorial Currents and possibly further south along the
coast of Brazil by the Brazil Current. The decreasing latitudinal gradient is consistent with the
decreasing gradient of PFOA and PFOS on airborne particles described by Jahnke et al.
2007c. What it is not known, however, is whether the airborne particle-bound fraction
originated from sea spray or atmospheric degradation of volatile precursor compounds,
i.e., whether the ocean was the source or sink for this airborne contamination. It is noteworthy
that the pattern of importance of individual PFCs changed depending on the sampling area. In
the northeast of the Atlantic Ocean in the Bay of Biscay, all PFCs, except for PFHpA, were
detected, with the latter detected for the first time at 37° N. The concentration ranged from
several tens of picograms per litre (PFBS, PFHxA, and PFNA) to a few hundreds of
picograms per litre (PFOS, PFOA, and FOSA). The concentration of PFSAs, PFOS, and
PFBS dropped below the MDLs south of 32° N and 25° N, respectively. The occurrence of
PFCAs toward the south depended on their chain length, with the longer the chain length of
the PFCAs (C6 to C9), the further southward they were detected. The reason for this behaviour
could be different physicochemical characteristics (e.g., vapour pressure, partition coefficient)
and/or input from atmospheric sources (Ellis et al. 2004; Higgins and Luthy 2006). The
Ahrens et al. / Environ. Sci. Technol. 2009, 43, 3122−3127

Publication II
65
increasing ΣPFC concentration at sampling stations 24-28, attended by an increasing water
temperature, could be caused by higher rainfall in this area, leading to increased deposition of
PFCAs from the atmosphere (Scott et al. 2006b). Of all detected PFCs, FOSA was found
furthest south, down to 4° S, possibly as a result of its higher vapour pressure increasing the
importance of atmospheric transport.
The location of the Labrador, North Atlantic, and Canary Currents will similarly affect the
distribution of PFCs along the longitudinal transect (see Figure 11 and Figure 13). PFC
concentrations dropped off in sampling stations C-F. These results imply that the northeastern
samples were influenced by the Labrador Current, whose origin is the Arctic Ocean and is
relatively “clean” (Yamashita et al. 2008), and the low ocean temperatures in this area support
this hypothesis. In contrast, sampling stations A and B had elevated concentrations and were
probably influenced by inputs from the Canadian coast and North Atlantic Current,
respectively. In the area of the North Atlantic Current, PFOS, PFHpA, and PFOA dominated,
with sum concentrations of 52-117 pg/L (sampling stations G-O). This is twice the
concentration found at sampling stations C-F influenced by the Labrador Current. The warm
temperature of the North Atlantic Current became noticeable at sampling stations L and M,
which were at latitudes similar to those of stations C-F, but with surface water temperatures
much higher than those close to the Labrador Sea. The highest concentrations where found at
sampling stations P-R, which could be induced by the Canary Current carrying PFCs from the
European Continent source region.
The concentrations of PFNA and PFOA were positively correlated (r2 = 0.52; see
Figure 14), which indicates that the sources of both compounds are related (Young et al.
2007). Young et al. 2007 found a positive correlation with a gradient of ~1 in snow on remote
ice caps that were contaminated atmospherically by precursors, in this case 8:2 FTOH. The
gradient in the Atlantic Ocean is ~0.4, and it is possible that the degradation of
perfluoalkanesulfonamides could lead to a higher amount of PFOA relative to PFNA (Martin
et al. 2006). Plots of PFHxA, PFOA, and PFNA concentrations versus PFOS concentrations
are also correlated for the Atlantic Ocean, but the significance is lower because the
calculations are based on only a few data points (Figure S4 in the Supplementary material).
Young et al. found no correlation among PFHxA, PFNA, and PFOS on the ice cap, which
further supported the source there being the atmospheric pathway (Young et al. 2007).
Concentrations of PFHpA and PFOA were negatively correlated in the Atlantic Ocean
(r2 = 0.32, see Figure S4), probably as a consequence of the patchy distribution of PFHpA.
Simcik and Dorweiler 2005 found that the ratio of PFHpA to PFOA increased with increasing
distance from nonatmospheric sources and suggested that a high ratio would be a good tracer
Ahrens et al. / Environ. Sci. Technol. 2009, 43, 3122−3127

Publication II
66
of atmospheric deposition. In this study, only a few stations (15, 20, M, and N) had
PFHpA/PFOA ratios greater than 1, which suggests that direct releases are important
determinants of open Atlantic Ocean surface water concentrations.
Figure 14. Correlations between PFNA and PFOA concentrations in surface water in the Atlantic Ocean
Several reasons for the distribution pattern of PFCs in the Atlantic Ocean have been
suggested, but for each location several factors could be responsible for the occurrence of the
PFCs. Ocean currents and related dilution effects have a crucial influence on PFC distribution
(Yamashita et al. 2008). The spatial distribution data obtained in this study are useful for
global transportation models (Wania and Mackay 1995), in which industrial areas are
considered as source of PFCs, and ocean waters and the atmosphere are important as sinks
and for transportation of these compounds. This transportation to remote regions could have
adverse effects in top predators here, because of the high bioaccumulation potential for PFOS
and longer-chained PFCAs in the marine food web (Houde et al. 2006c). Further
investigations of the biochemical cycle of PFCs in ocean waters are necessary for
understanding the transportation and fate of PFCs in the marine environment.
Acknowledgments
We kindly acknowledge the German Federal Environmental Foundation for sponsoring
the project. We kindly acknowledge the Alfred Wegener Institute for Polar and Marine
Research (AWI), Bremerhaven, for the possibility of taking part in expedition ANTXXIV-1.
We thank Armando Caba for performing sampling onboard the R/V Maria S. Merian and
Clare Benskin, Claudia Moeckel, and Jasmin Shuster for help with sampling onboard the R/V
Polarstern.
Ahrens et al. / Environ. Sci. Technol. 2009, 43, 3122−3127

Publication III
67Ahrens et al. / Marine Poll. Bull. 2009, 58, 520–525
5. Publication III
Total Body Burden and Tissue Distribution of Polyfluorinated
Compounds in Harbor Seals (Phoca vitulina) from the German Bight
Lutz Ahrens a,b,*, Ursula Siebert c, Ralf Ebinghaus a
a GKSS Research Centre Geesthacht, Department for Environmental Chemistry, Institute for Coastal Research,
Max-Planck-Str. 1, DE-21502 Geesthacht, Germany b Leuphana University of Lüneburg, Institute for Ecology and Environmental Chemistry, Faculty of Environment
and Technique, DE-21335 Lüneburg, Germany c Research and Technology Centre Westcoast (FTZ), University of Kiel, DE-25761 Büsum, Germany
* Corresponding author phone: +49 4152 87 2353; fax: +49 4152 87 2366; e-mail address: [email protected]
Abstract
Total body burden and tissue distribution of polyfluorinated compounds (PFCs) were
investigated in harbor seals (Phoca vitulina) from the German Bight in 2007. A total number
of 18 individual PFCs from the following groups could be quantified in the different tissues:
perfluorinated carboxylic acids (PFCAs) and perfluorinated sulfonates (PFSAs) and their
precursors perfluorinated sulfinates (PFSiAs), perfluorinated sulfonamides, and sulfonamido
ethanols. Perfluorooctanesulfonate (PFOS) was the predominant compound in all measured
seal tissues (up to 1665 ng/g wet weight in liver tissue). The dominant PFCAs were
perfluorononanoic acid (PFNA) and perfluorodecanoic acid (PFDA), but their concentrations
were much lower compared to PFOS. The mean whole body burden in harbor seals of all
detected PFCs was estimated to be 2665 ± 1207 µg absolute. The major amount of the total
PFCs burden in the bodies was in blood (38%) and liver (36%), followed by muscle (13%),
lung (8%), kidney (2%), blubber (2%), heart (1%), brain (1%), thymus (<0.01%) and thyroid
(<0.01%). These data suggest large differences in body burden and accumulation pattern of
PFCs in marine mammals.
Keywords: Total body burden; tissue distribution; harbor seal; PFCs; PFOS; PFOA

Publication III
68
5.1. Introduction
Recently polyfluorinated compounds (PFCs) were discovered as emerging persistent
organic pollutants. PFCs are widely used as processing additives during fluoropolymer
production and as surfactants in consumer applications, including surface coatings for carpets,
furniture and paper products over the past 50 years (Kissa 2001). From the production and use
of these products, PFCs can be released into the environment. Scientific concern about PFCs
increased due to their global distribution and ubiquitous detection in the environment,
especially in marine mammals (Giesy and Kannan 2001). PFCs in general bind to blood
proteins (Jones et al. 2003) and the longer-chained PFCs are known to bioaccumulate (Martin
et al. 2004a). Toxic effects in biota like neuroendocrine effects (Austin et al. 2003) and
peroxisome proliferation (Goecke-Flora and Reo 1996) were demonstrated. In addition,
positive correlation between infection diseases of river otters and diet of high concentration of
PFCs was observed (Kannan et al. 2006).
Relatively little is known about the total body burden of PFCs in organisms. For the
calculation of the total body burden the concentration in liver tissue and plasma are often
used. These estimations are often potential sources of errors because little is known about the
distribution of PFCs in the whole body. In addition, bioaccumulation evaluations may be
overestimated when using liver and plasma concentrations.
The bioconcentration factors (BCF), half-lives and uptake rates increased with increasing
perfluoroalkyl chain length in all tissues of rainbow trouts (Oncorhynchus mykiss) exposed
with perfluorinated carboxylic acids (PFCAs) and perfluorinated sulfonates (PFSAs) in a
flow-through system (Martin et al. 2003a). Longer-chained PFCAs, perfluorobutanesulfonate
(PFBS) and perfluorooctanesulfonate (PFOS) were quantified in kidney, liver, blubber,
muscle, tracheo-branchial muscle and spleen in harbor seals (Phoca vitulina) from the Dutch
Wadden Sea (Van de Vijver et al. 2005). Another study determined PFCs in different tissues
from ringed seals (Phoca hispida), where the highest whole body distribution was observed in
blood, muscle and liver with PFOS as the predominant compound (Sturman et al. 2007).
The object of this study was to determine concentrations and burden of PFCs in various
tissues of harbor seals (P. vitulina) from the German Bight. To better understand the
mechanisms and pathways of PFCs in marine wildlife, we examined the compound-specific
distribution in liver, kidney, lung, heart, blood, brain, muscle, thyroid, thymus and blubber of
harbor seals.
Ahrens et al. / Marine Poll. Bull. 2009, 58, 520–525
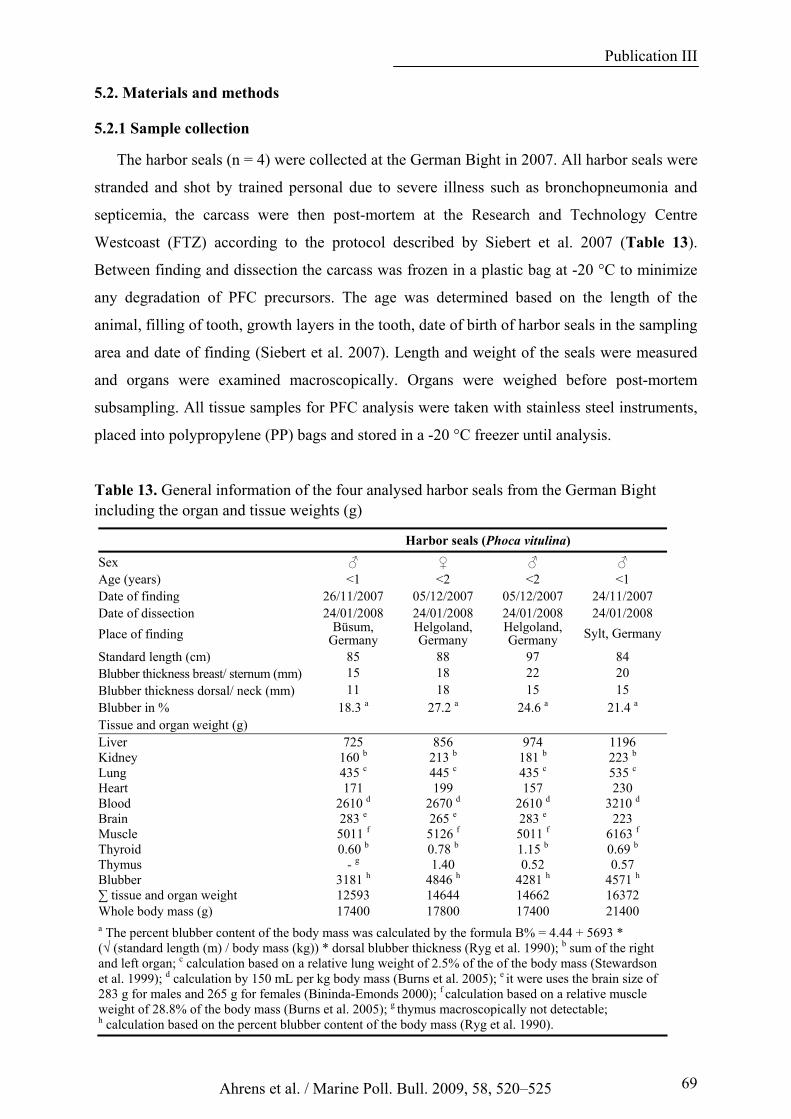
Publication III
69Ahrens et al. / Marine Poll. Bull. 2009, 58, 520–525
5.2. Materials and methods
5.2.1 Sample collection
The harbor seals (n = 4) were collected at the German Bight in 2007. All harbor seals were
stranded and shot by trained personal due to severe illness such as bronchopneumonia and
septicemia, the carcass were then post-mortem at the Research and Technology Centre
Westcoast (FTZ) according to the protocol described by Siebert et al. 2007 (Table 13).
Between finding and dissection the carcass was frozen in a plastic bag at -20 °C to minimize
any degradation of PFC precursors. The age was determined based on the length of the
animal, filling of tooth, growth layers in the tooth, date of birth of harbor seals in the sampling
area and date of finding (Siebert et al. 2007). Length and weight of the seals were measured
and organs were examined macroscopically. Organs were weighed before post-mortem
subsampling. All tissue samples for PFC analysis were taken with stainless steel instruments,
placed into polypropylene (PP) bags and stored in a -20 °C freezer until analysis.
Table 13. General information of the four analysed harbor seals from the German Bight including the organ and tissue weights (g)
Harbor seals (Phoca vitulina)
Sex ♂ ♀ ♂ ♂ Age (years) <1 <2 <2 <1 Date of finding 26/11/2007 05/12/2007 05/12/2007 24/11/2007 Date of dissection 24/01/2008 24/01/2008 24/01/2008 24/01/2008
Place of finding Büsum, Germany
Helgoland, Germany
Helgoland, Germany Sylt, Germany
Standard length (cm) 85 88 97 84 Blubber thickness breast/ sternum (mm) 15 18 22 20 Blubber thickness dorsal/ neck (mm) 11 18 15 15 Blubber in % 18.3 a 27.2 a 24.6 a 21.4 a Tissue and organ weight (g) Liver 725 856 974 1196 Kidney 160 b 213 b 181 b 223 b Lung 435 c 445 c 435 c 535 c Heart 171 199 157 230 Blood 2610 d 2670 d 2610 d 3210 d Brain 283 e 265 e 283 e 223 Muscle 5011 f 5126 f 5011 f 6163 f Thyroid 0.60 b 0.78 b 1.15 b 0.69 b Thymus - g 1.40 0.52 0.57 Blubber 3181 h 4846 h 4281 h 4571 h ∑ tissue and organ weight 12593 14644 14662 16372 Whole body mass (g) 17400 17800 17400 21400 a The percent blubber content of the body mass was calculated by the formula B% = 4.44 + 5693 * (√ (standard length (m) / body mass (kg)) * dorsal blubber thickness (Ryg et al. 1990); b sum of the right and left organ; c calculation based on a relative lung weight of 2.5% of the of the body mass (Stewardson et al. 1999); d calculation by 150 mL per kg body mass (Burns et al. 2005); e it were uses the brain size of 283 g for males and 265 g for females (Bininda-Emonds 2000); f calculation based on a relative muscle weight of 28.8% of the body mass (Burns et al. 2005); g thymus macroscopically not detectable; h calculation based on the percent blubber content of the body mass (Ryg et al. 1990).

Publication III
70
5.2.2 PFC analysis
A list of the native and mass-labelled standards including their acronyms, formula,
supplier and purity are presented in Table 14. Methanol (SupraSolv), acetonitrile
(LiChrosolv) and acetic acid (glacial, > 99%) were purchased from Merck.
PFCs in liver, kidney, lung, heart, blood, brain, muscle, thyroid, thymus and blubber of
harbor seals were analysed described by Powley et al. 2005 with some modifications. Shortly,
tissue subsample were homogenised in a ice bath using an Ultraturrax® disperser (T 25 basic
Ultraturrax, IKA, Germany) with plastic dispersing (made of polycarbonate and polysulfone).
1 to 2 g tissue and 2 mL blood sample respectively were weighed in a PP tube and spiked
with 10 ng of an internal standard (IS) mix (i.e., [13C4]-PFBA, [13C2]-PFHxA, [13C4]-PFOA,
[13C4]-PFNA, [13C4]-PFDA, [13C2]-PFUnDA, [13C2]-PFDoA, [18O2]-PFHxS, [13C4]-PFOS,
[13C4]-PFOSi, [13C2]-FHEA, [13C2]-FOEA, [13C2]-FDEA, [13C2]-FHUEA, [13C2]-FOUEA,
[13C2]-FDUEA, d3-MeFOSA, d5-EtFOSA, d7-MeFOSE, d9-EtFOSE, 100 µL of a 0.1 µg/mL
solution, see Table 14) to correct matrix effects as well as for losses sample extraction,
concentration, and analysis. Tissues were extracted with 5 mL acetonitrile three times for
30 min in an ultrasonic bath at 30 °C. The combined extract was reduced to 2 mL using rotary
evaporation and acidulated with 50 µL acetic acid. For clean-up Supelclean ENVI-Carb®
cartridges (100 mg, 1 mL, 100-400 mesh, Supelco, USA) were used. The conditioning of the
cartridge was carried out with 2 mL acetonitrile and 1 mL 20% acetic acid in acetonitrile.
Afterwards, the sample extract and three times 1 mL methanol was given onto the cartridge
and directly collected into another vial. The extracts were reduced to 150 µL under a nitrogen
stream and 20 ng of an injection standard (InjS, d5-EtFOSAA, 50 µL of a 0.4 µg/mL solution,
see Table 14) was spiked to the final extract for corrections of instrumental drift and
differences of the injection volume for instrumental analysis.
Concentrations of PFCs in samples were determined by high performance liquid
chromatography with tandem mass spectrometer interfaced with an electrospray ionisation
source in a negative-ion mode (HPLC-(-)ESI-MS/MS) as previously described (Yamashita et
al. 2005). A detailed list of the precursor and product ions for the MS/MS can be found in
Table 14. Quantification was done using response factors calculated by a ten-point calibration
curve from 0.1 to 300 ng/mL. For quantification the linear range of 0.1 to 50 ng/mL and 50 to
300 ng/mL was used. Some PFSAs and sulfonamides showed more than one peak in the
chromatogram, which is due to the presence of branched isomers resulting from the
production process (Giesy and Kannan 2002). These branched isomers could not be
quantified precisely because of the lack of calibration standards.
Ahrens et al. / Marine Poll. Bull. 2009, 58, 520–525
Ahrens et al. / Marine Poll. Bull. 2009, 58, 520–525

Publication III
71Ahrens et al. / Marine Poll. Bull. 2009, 58, 520–525
Table 14. Analytes, acronyms, formula, supplier, purity, precursor and product ions for the MS/MS detection
Analyte Acronym Formula Supplier (purity) Precursor/ product ion [m/z]
Perfluorobutane sulfonate PFBS C4F9SO2O- Fluka (97%) 298.877/ 79.8
Perfluoropentane sulfonate PFPS C5F11SO2O- n.a. 348.939/ 79.8
Perfluorohexane sulfonate PFHxS C6F13SO2O- Fluka (98%) 398.894/ 79.8
Perfluoroheptane sulfonate PFHpS C7F15SO2O- Well. Lab.a (>98%) 449.034/ 79.3
Perfluorooctane sulfonate PFOS C8F17SO2O- Well. Lab.a (>98%) 498.971/ 79.7
Perfluorononane sulfonate PFNS C9F19SO2O- n.a. 548.926/ 79.8
Perfluorodecane sulfonate PFDS C10F21SO2O- Well. Lab.a (>98%) 598.896/ 79.5
6:2 fluorotelomer sulfonate 6:2 FTS C6F13C2H4SO3- ABCR (98%) 426.925/ 406.7
Perfluoro-1-hexane sulfinate PFHxSi C6F13SO2- Well. Lab.a (>98%) 382.865/ 319.0
Perfluoro-1-octane sulfinate PFOSi C8F17SO2- Well. Lab.a (>98%) 482.824/ 418.9
Perfluoro-1-decane sulfinate PFDSi C10F21SO2- Well. Lab.a (>98%) 582.934/ 518.9
Perfluorobutanoic acid PFBA C3F7COOH ABCR (99%) 112.900/ 168.7 Perfluoropentanoic acid PFPA C4F9COOH Alfa Aesar (98%) 262.825/ 218.9 Perfluorohexanoic acid PFHxA C5F11COOH Fluka (97%) 312.934/ 268.8 Perfluoroheptanoic acid PFHpA C6F13COOH Lanc. Syn.b (98%) 362.950/ 318.9 Perfluorooctanoic acid PFOA C7F15COOH Lanc. Syn.b (95%) 412.987/ 368.9 Perfluorononanoic acid PFNA C8F17COOH Lanc. Syn.b (97%) 462.908/ 418.9 Perfluorodecanoic acid PFDA C9F19COOH Lanc. Syn.b (97%) 512.876/ 469.0 Perfluoroundecanoic acid PFUnDA C10F21COOH ABCR (96%) 562.865/ 519.0 Perfluorododecanoic acid PFDoDA C11F23COOH Alfa Aesar (96%) 612.991/ 568.9 Perfluorotridecanoic acid PFTriDA C12F25COOH Well. Lab.a (>98%) 663.094/ 618.9 Perfluorotetradecanoic acid PFTeDA C13F27COOH Alfa Aesar (96%) 713.036/ 669.0 Perfluorotridecanoic acid PFPDA C14F29COOH n.a. 762.980/ 718.9 Perfluorohexadecanoic acid PFHxDA C15F31COOH Alfa Aesar (95%) 812.840/ 769.1 Perfluoroheptadecanoic acid PFHpDA C16F33COOH n.a. 862.980/ 818.9 Perfluorooctadecanoic acid PFOcDA C17F35COOH Alfa Aesar (97%) 912.870/ 869.0 3,7-dimethylperfluorooctanoic acid 3,7m2-PFOA C9F19COOH Alfa Aesar (97%) 512.885/ 468.9 N-methylperfluorobutane sulfonamide MeFBSA C4F9SO2NH(CH3) 3M (n.a.) 311.914/ 218.8 Perfluorooctane sulfonamide FOSA C8F17SO2NH2 ABCR (97%) 497.896/ 77.9 N-methyl perfluoroctane sulfonamide MeFOSA C8F17SO2NH(CH3) 3M (n.a.) 511.849/ 168.9 N-ethyl perfluoroctane sulfonamide EtFOSA C8F17SO2NH(C2H5) ABCR (95%) 526.008/ 169.0 N-methylperfluorobutane sulfonamidoethanol MeFBSE C4F9SO2N(CH3)C2H4OH 3M (n.a.) 416.047/ 59.0 N-methyl perfluoroctane sulfonamidoethanol MeFOSE C8F17SO2N(CH3)C2H4OH 3M (n.a.) 616.004/ 58.9 N-ethyl perfluroctane sulfonamidoethanol EtFOSE C8F17SO2N(C2H5)C2H4OH 3M (n.a.) 630.109/ 58.8 2-Perfluorohexyl ethanoic acid FHEA C6F13CH2COOH Well. Lab.a (>98%) 376.945/ 292.8 2-Perfluorooctyl ethanoic acid FOEA C8F17CH2COOH Well. Lab.a (>98%) 476.909/ 392.9 2-Perfluorodecyl ethanoic acid FDEA C10F21CH2COOH Well. Lab.a (>98%) 577.011/ 493.0 2H-Perfluoro-2-octenoic acid FHUEA C6F12CHCOOH Well. Lab.a (>98%) 356.885/ 293.0 2H-Perfluoro-2-decenoic acid FOUEA C8F16CHCOOH Well. Lab.a (>98%) 456.803/ 292.8 2H-Perfluoro-2-dodecenoic acid FDUEA C10F20CHCOOH Well. Lab.a (>98%) 556.937/ 493.1 Perfluoro-1-hexane[18O2]sulfonate [18O2]-PFHxS C6F13S[18O2]O
- Well. Lab.a (>98%) 402.981/ 83.9 Perfluoro-1-[1,2,3,4-13C]octanesulfonate [13C4]-PFOS C4F9[1,2,3,4-13C4]F8SO2O
- Well. Lab.a (>98%) 502.899/ 79.5 Perfluoro-1-[1,2,3,4-13C]octanesulfinate [13C4]-PFOSi C4F9[1,2,3,4-13C4]F8SO2
- Well. Lab.a (>90%) 486.859/ 422.9 Perfluoro-n-(1,2,3,4-13C4)butanoic acid [13C4]-PFBA 2,3,4-13C3F7
13COOH Well. Lab.a (>98%) 216.823/ 171.8 Perfluoro-n-(1,2-13C2)hexanoic acid [13C2]-PFHxA C4F9[2-13C]F2
13COOH Well. Lab.a (>98%) 314.891/ 269.9 Perfluoro-n-[1,2,3,4-13C4]octanoic acid [13C4]-PFOA C4F9[2,3,4-13C3]F6
13COOH Well. Lab.a (>98%) 416.978/ 371.8 Perfluoro-n-[1,2,3,4,5-13C5]nonanoic acid [13C5]-PFNA C4F9[2,3,4,5-3C4]F8
13COOH Well. Lab.a (>98%) 467.907/ 423.0 Perfluoro-n-[1,2-13C2]decanoic acid [13C2]-PFDA C8F17
13CF213COOH Well. Lab.a (>98%) 514.944/ 469.8
Perfluoro-n-[1,2-13C2]undecanoic acid [13C2]-PFUnDA C9F1913CF2
13COOH Well. Lab.a (>98%) 564.959/ 519.8 Perfluoro-n-[1,2-13C2]dodecanoic acid [13C2]-PFDoDA C10F21
13CF213COOH Well. Lab.a (>98%) 614.913/ 569.9
N-methyl-d3-perfluoro-1-octanesulfonamide d3-N-MeFOSA C9D3HF17NO2S Well. Lab.a (>98%) 514.920/ 168.8 N-ethyl-d5-perfluoro-1-octanesulfonamide d5-N-EtFOSA C10D5HF17NO2S Well. Lab.a (>98%) 530.984/ 168.8 2-(N-deuteriomethylperfluoro-1-octane-sulfoneamido)-1,1,2,2-tetradeuterioethanol d7-N-MeFOSE C8F17SO2N(CD3)C2D4OH Well. Lab.a (>98%) 623.058/ 58.9 2-(N-deuterioethylperfluoro-1-octane-sulfoneamido)-1,1,2,2-tetradeuterioethanol d9-N-EtFOSE C8F17SO2N(C2D5)C2D4OH Well. Lab.a (>98%) 639.054/ 58.9 2-Perfluorohexyl-[1,2-13C2]ethanoic acid [13C2]-FHEA C6F13
13CH213COOH Well. Lab.a (>98%) 378.912/ 294.0
2-Perfluorooctyl-[1,2-13C2]ethanoic acid [13C2]-FOEA C8F1713CH2
13COOH Well. Lab.a (>98%) 478.911/ 393.8 2-Perfluorodecyl-[1,2-13C2]ethanoic acid [13C2]-FDEA C10F21
13CH213COOH Well. Lab.a (>98%) 579.017/ 494.1
2H-Perfluoro-[1,2-13C2]-2-octenoic acid [13C2]-FHUEA C6F1213CH13COOH Well. Lab.a (>98%) 358.907/ 294.0
2H-Perfluoro-[1,2-13C2]-2-decenoic acid [13C2]-FOUEA C8F1613CH13COOH Well. Lab.a (>98%) 458.903/ 393.8
2H-Perfluoro-[1,2-13C2]-2-dodecenoic acid [13C2]-FDUEA C10F2013CH13COOH Well. Lab.a (>98%) 558.955/ 494.0
N-deuterioethylperfluoro-1-octanesulfonamidoacetic acid d5-EtFOSAA
C8F17SO2N(C2D2 C2D3)C2H2CO2H Well. Lab.a (>98%) 589.015/ 418.7
a Well. Lab. = Wellington Laboratories; b Lanc. Syn. = Lancaster Synthesis; n.a. = not available.

Publication III
72
As the analytical standards are not available for perfluorinated pentane- and
nonanesulfonate (PFPS, PFNS) and perfluorinated pentadecanoic and heptadecanoic acid
(PFPDA, PFHpDA), they were integrated into the method taking the MS/MS parameters of
the compound having one carbon atom less in the carbon chain and their calibration was used
for the quantification. Hence, the results given for PFPS, PFNS, PFPDA and PFHpDA should
be considered only as an estimation.
5.2.3 Quality control
Data quality assurance and quality control included method blanks, method detection
limits (MDLs), method quantification limits (MQLs), matrix spike recovery rates, matrix
effect and continuing calibration verification. For the method blank one mL of acetonitrile
was extracted in the same way as the natural samples. The MDLs and MQLs were calculated
for substances which were found in real samples at a signal to noise (S/N) of 3 and 10,
respectively. PFC recoveries were tested for liver tissues based on triplicate analysis of matrix
spiked and extracted with the same analytical procedure.
All method blanks were under the MQL. The MQLs ranged from a few pg/g ww
(e.g., perfluorooctanoic acid (PFOA)) to a few ng/g ww (PFOS), depending on the extracted
tissue (Table S9 in the Supplementary material). Relative recoveries of the 36 analytes, which
were corrected for IS recovery and background concentration, ranged between
56% (perfluorohexadecanoic acid (PFHxDA)) and 135% (n-ethylperfluorooctane
sulfonamidoethanol (EtFOSE)) (Table S10 in the Supplementary material). The matrix
effects of individual PFCs were determined in liver, kidney, lung, heart, blood, brain and
muscle by analysis of a fortified extract (100 µL of a 0.1 µg/mL PFC standard solution), non-
fortified extract and solvent based standard solution (matrix effect = (responsefortified extract –
responsenon-fortified extract)/responsesolvent based standard) (Table S11 in the Supplementary material).
Most PFCs showed similar matrix effects in different tissues and a low mean signal
suppression of 0.88 to 0.98 except of 3,7-dimethylperfluorooctanoic acid (3,7m2-PFOA) with
a low signal enhancement of 1.01. Only PFHxDA and perfluorooctadecanoic acid (PFOcDA)
have a stronger signal suppression in some tissues with a maximum of 0.24 (kidney) and
0.11 (lung), respectively.
5.3. Results and discussion
5.3.1 Tissue distribution
Levels of PFCs in liver, kidney, lung, heart, blood, brain, muscle, thyroid, thymus and
blubber in harbor seals are shown in Table 15. 18 of 40 target analytes were found in the
tissues (i.e., C4 to C10 PFSAs, perfluorooctanesulfinate (PFOSi), C8 to C15 PFCAs,
Ahrens et al. / Marine Poll. Bull. 2009, 58, 520–525

Publication III
73Ahrens et al. / Marine Poll. Bull. 2009, 58, 520–525
perfluorosulfonamide (FOSA) and n methylperfluorobutane sulfonamidoethanol (MeFBSE)).
To our knowledge, this is the first report of PFPS, PFNS, PFOSi and MeFBSE in detectable
concentrations in biota samples from the German Bight. Among to all detected PFCs the
predominated compound in all tissues was PFOS with an average of over 90%, followed by
perfluorohexanesulfonate (PFHxS) (2.7%), perfluorononanoic acid (PFNA) (1.8%) and
perfluorodecanoic acid (PFDA) (1.6%). The highest PFC sum concentrations were detected in
liver (1071 ng/g ww), lung (462 ng/g ww) and blood (381 ng/g ww). The lowest PFC sum
concentration was found in blubber with an average of 11.4 ng/g ww. This confirms with the
findings that PFCs bind to blood proteins instead of fatty tissue (Jones et al. 2003).
All PFSAs with a chain length of C4-C10 could be detected in the analysed tissues.
Although 3M, the major producer of perfluorooctyl sulfonyl fluoride (POSF), which is a
major precursor for several PFCs, voluntarily phased out the production in 2002, PFOS was
still the dominated compound in biota samples. The former POSF-based products are now
substituted by perfluorobutyl sulfonyl fluoride (PBSF)-based products (U.S. EPA 2000). In
the present study PFBS could be detected with a maximum concentration of 17 ng/g ww in
blood, but usually the concentration was less than 0.5 ng/g ww. The production shift to the
shorter-chained PFBS could not be observed because of the lower accumulation potential of
the C4 in comparison to the C8 PFSA (Martin et al. 2003b). In contrast to the PFSAs the
PFCAs could only be detected from a chain length grater than C8, this suggest a higher
accumulation potential of PFSAs compared to PFCAs (Martin et al. 2003b). PFNA and PFDA
were the dominated PFCAs, with increasing chain length up to C15 concentration levels
decreased. Two sulfonamides, which are precursors of PFSAs and PFCAs (Martin et al.
2006), were also detected. FOSA was detected in all tissues with a maximum of 6.9 ng/g ww
in blood and MeFBSE was only observed in thyroid tissue and blubber with up to
2.0 ng/g ww.
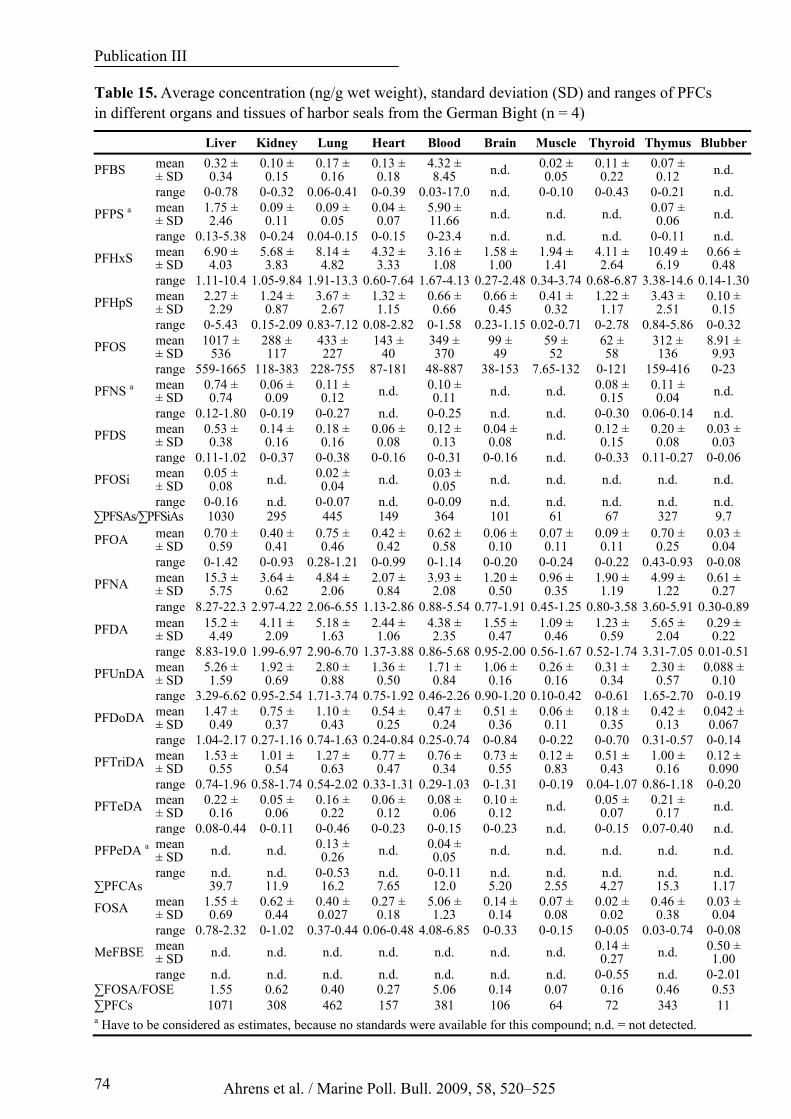
Publication III
74
Table 15. Average concentration (ng/g wet weight), standard deviation (SD) and ranges of PFCs in different organs and tissues of harbor seals from the German Bight (n = 4)
Liver Kidney Lung Heart Blood Brain Muscle Thyroid Thymus Blubber
PFBS mean ± SD
0.32 ± 0.34
0.10 ± 0.15
0.17 ± 0.16
0.13 ± 0.18
4.32 ± 8.45 n.d. 0.02 ±
0.05 0.11 ± 0.22
0.07 ± 0.12 n.d.
range 0-0.78 0-0.32 0.06-0.41 0-0.39 0.03-17.0 n.d. 0-0.10 0-0.43 0-0.21 n.d.
PFPS a mean ± SD
1.75 ± 2.46
0.09 ± 0.11
0.09 ± 0.05
0.04 ± 0.07
5.90 ± 11.66 n.d. n.d. n.d. 0.07 ±
0.06 n.d.
range 0.13-5.38 0-0.24 0.04-0.15 0-0.15 0-23.4 n.d. n.d. n.d. 0-0.11 n.d.
PFHxS mean ± SD
6.90 ± 4.03
5.68 ± 3.83
8.14 ± 4.82
4.32 ± 3.33
3.16 ± 1.08
1.58 ± 1.00
1.94 ± 1.41
4.11 ± 2.64
10.49 ± 6.19
0.66 ± 0.48
range 1.11-10.4 1.05-9.84 1.91-13.3 0.60-7.64 1.67-4.13 0.27-2.48 0.34-3.74 0.68-6.87 3.38-14.6 0.14-1.30
PFHpS mean ± SD
2.27 ± 2.29
1.24 ± 0.87
3.67 ± 2.67
1.32 ± 1.15
0.66 ± 0.66
0.66 ± 0.45
0.41 ± 0.32
1.22 ± 1.17
3.43 ± 2.51
0.10 ± 0.15
range 0-5.43 0.15-2.09 0.83-7.12 0.08-2.82 0-1.58 0.23-1.15 0.02-0.71 0-2.78 0.84-5.86 0-0.32
PFOS mean ± SD
1017 ± 536
288 ± 117
433 ± 227
143 ± 40
349 ± 370
99 ± 49
59 ± 52
62 ± 58
312 ± 136
8.91 ± 9.93
range 559-1665 118-383 228-755 87-181 48-887 38-153 7.65-132 0-121 159-416 0-23
PFNS a mean ± SD
0.74 ± 0.74
0.06 ± 0.09
0.11 ± 0.12 n.d. 0.10 ±
0.11 n.d. n.d. 0.08 ± 0.15
0.11 ± 0.04 n.d.
range 0.12-1.80 0-0.19 0-0.27 n.d. 0-0.25 n.d. n.d. 0-0.30 0.06-0.14 n.d.
PFDS mean ± SD
0.53 ± 0.38
0.14 ± 0.16
0.18 ± 0.16
0.06 ± 0.08
0.12 ± 0.13
0.04 ± 0.08 n.d. 0.12 ±
0.15 0.20 ± 0.08
0.03 ± 0.03
range 0.11-1.02 0-0.37 0-0.38 0-0.16 0-0.31 0-0.16 n.d. 0-0.33 0.11-0.27 0-0.06
PFOSi mean ± SD
0.05 ± 0.08 n.d. 0.02 ±
0.04 n.d. 0.03 ± 0.05 n.d. n.d. n.d. n.d. n.d.
range 0-0.16 n.d. 0-0.07 n.d. 0-0.09 n.d. n.d. n.d. n.d. n.d. ∑PFSAs/∑PFSiAs 1030 295 445 149 364 101 61 67 327 9.7
PFOA mean ± SD
0.70 ± 0.59
0.40 ± 0.41
0.75 ± 0.46
0.42 ± 0.42
0.62 ± 0.58
0.06 ± 0.10
0.07 ± 0.11
0.09 ± 0.11
0.70 ± 0.25
0.03 ± 0.04
range 0-1.42 0-0.93 0.28-1.21 0-0.99 0-1.14 0-0.20 0-0.24 0-0.22 0.43-0.93 0-0.08
PFNA mean ± SD
15.3 ± 5.75
3.64 ± 0.62
4.84 ± 2.06
2.07 ± 0.84
3.93 ± 2.08
1.20 ± 0.50
0.96 ± 0.35
1.90 ± 1.19
4.99 ± 1.22
0.61 ± 0.27
range 8.27-22.3 2.97-4.22 2.06-6.55 1.13-2.86 0.88-5.54 0.77-1.91 0.45-1.25 0.80-3.58 3.60-5.91 0.30-0.89
PFDA mean ± SD
15.2 ± 4.49
4.11 ± 2.09
5.18 ± 1.63
2.44 ± 1.06
4.38 ± 2.35
1.55 ± 0.47
1.09 ± 0.46
1.23 ± 0.59
5.65 ± 2.04
0.29 ± 0.22
range 8.83-19.0 1.99-6.97 2.90-6.70 1.37-3.88 0.86-5.68 0.95-2.00 0.56-1.67 0.52-1.74 3.31-7.05 0.01-0.51
PFUnDA mean ± SD
5.26 ± 1.59
1.92 ± 0.69
2.80 ± 0.88
1.36 ± 0.50
1.71 ± 0.84
1.06 ± 0.16
0.26 ± 0.16
0.31 ± 0.34
2.30 ± 0.57
0.088 ± 0.10
range 3.29-6.62 0.95-2.54 1.71-3.74 0.75-1.92 0.46-2.26 0.90-1.20 0.10-0.42 0-0.61 1.65-2.70 0-0.19
PFDoDA mean ± SD
1.47 ± 0.49
0.75 ± 0.37
1.10 ± 0.43
0.54 ± 0.25
0.47 ± 0.24
0.51 ± 0.36
0.06 ± 0.11
0.18 ± 0.35
0.42 ± 0.13
0.042 ± 0.067
range 1.04-2.17 0.27-1.16 0.74-1.63 0.24-0.84 0.25-0.74 0-0.84 0-0.22 0-0.70 0.31-0.57 0-0.14
PFTriDA mean ± SD
1.53 ± 0.55
1.01 ± 0.54
1.27 ± 0.63
0.77 ± 0.47
0.76 ± 0.34
0.73 ± 0.55
0.12 ± 0.83
0.51 ± 0.43
1.00 ± 0.16
0.12 ± 0.090
range 0.74-1.96 0.58-1.74 0.54-2.02 0.33-1.31 0.29-1.03 0-1.31 0-0.19 0.04-1.07 0.86-1.18 0-0.20
PFTeDA mean ± SD
0.22 ± 0.16
0.05 ± 0.06
0.16 ± 0.22
0.06 ± 0.12
0.08 ± 0.06
0.10 ± 0.12 n.d. 0.05 ±
0.07 0.21 ± 0.17 n.d.
range 0.08-0.44 0-0.11 0-0.46 0-0.23 0-0.15 0-0.23 n.d. 0-0.15 0.07-0.40 n.d.
PFPeDA a mean ± SD n.d. n.d. 0.13 ±
0.26 n.d. 0.04 ± 0.05 n.d. n.d. n.d. n.d. n.d.
range n.d. n.d. 0-0.53 n.d. 0-0.11 n.d. n.d. n.d. n.d. n.d. ∑PFCAs 39.7 11.9 16.2 7.65 12.0 5.20 2.55 4.27 15.3 1.17
FOSA mean ± SD
1.55 ± 0.69
0.62 ± 0.44
0.40 ± 0.027
0.27 ± 0.18
5.06 ± 1.23
0.14 ± 0.14
0.07 ± 0.08
0.02 ± 0.02
0.46 ± 0.38
0.03 ± 0.04
range 0.78-2.32 0-1.02 0.37-0.44 0.06-0.48 4.08-6.85 0-0.33 0-0.15 0-0.05 0.03-0.74 0-0.08
MeFBSE mean ± SD n.d. n.d. n.d. n.d. n.d. n.d. n.d. 0.14 ±
0.27 n.d. 0.50 ± 1.00
range n.d. n.d. n.d. n.d. n.d. n.d. n.d. 0-0.55 n.d. 0-2.01 ∑FOSA/FOSE 1.55 0.62 0.40 0.27 5.06 0.14 0.07 0.16 0.46 0.53 ∑PFCs 1071 308 462 157 381 106 64 72 343 11 a Have to be considered as estimates, because no standards were available for this compound; n.d. = not detected.
Ahrens et al. / Marine Poll. Bull. 2009, 58, 520–525

Publication III
75Ahrens et al. / Marine Poll. Bull. 2009, 58, 520–525
PFCs are distributed on a global scale, with highest concentrations found close to
urbanised/industrialised regions like Europe and USA (e.g., 970-3680 ng/g ww PFOS in Mink
livers from Midwestern U.S.), while the Southern Hemisphere was less contaminated with
PFCs (e.g., <0.08-3.52 ng/g ww for PFOS in elephant seal livers from the Antarctic) (Giesy
and Kannan 2001; Tao et al. 2006). In most studies PFOS was the dominating PFC in marine
animals (Houde et al. 2006c). PFCAs were detected in seal liver in the Canadian Arctic in the
same range than those in this study, except of PFOS, which was found one magnitude lower
(Butt et al. 2007b; Sturman et al. 2007). A similar trend was observed in pelicans (Pelecanus
occidentalis) from Columbia where the concentration of PFOS in liver, kidney, lung, heart,
brain and muscle from harbor seals were, on average, one to two magnitudes lower than in
this study (Olivero-Verbel et al. 2006). This may be the result of the higher pollutant area
around the North Sea in comparison to the Arctic and Columbia. The tendency of increasing
PFOS concentration in the different tissues was comparable to this study in harbor seals
(Phoca vitulina) (kidney > liver > blubber), ringed seals (Phoca hispida) (liver > lung > heart
and liver > spleen > kidney, respectively) (Sturman et al. 2007) and rainbow trouts
(Oncorhynchus mykiss) (blood > kidney > liver) (Martin et al. 2003a).
5.3.2 Total body burden
The calculation of the whole body burden distribution based on the individual tissue
masses of the whole organs (concentration in the sub-sample x tissue weight) (see Table 13).
The organs from thymus, thyroid, liver, kidney, heart and one brain were tared directly. The
content of blood, not directly tared brains, lung and muscle was calculated based on the mass
information found in the literature (Bininda-Emonds 2000; Burns et al. 2005; Stewardson et
al. 1999). The blubber content was estimated with the dorsal blubber thickness, standard
length and body mass as described by Ryg et al. 1990. The calculation included all examined
tissues, which was around 75% of the whole body weight. Among others the skeleton and the
pelt was unaccounted for the calculation because the extraction would be too difficult and the
expected PFC concentrations very low. The mean whole body burden in harbor seals of all
detected ∑PFCs was estimated to be 2665 ± 1207 µg absolute (Table 16, n = 4). The greatest
proportion had PFOS (2477 ± 1122 µg absolute) which could be have potential
developmental, reproductive, systemic and neuroendocrine effects to mammals (Austin et al.
2003). The high PFCs body burden which was found in this study could also have effects on
the immune system and physiological functions (Kannan et al. 2006). The four seals
investigated in the present study were all in moderate nutritional status. The main pathological
findings were bronchopneumonia caused by parasitic and bacterial infection partly with final

Publication III
76
septicemia (personal communication with Ursula Siebert). Therefore an effect of PFCs on the
health status can not be routed out.
Table 16. Mean whole body burden and standard deviation for individual PFC in harbor seals from the German Bight in µg absolute (n = 4)
Analyte Whole body burden [µg]
PFBS 12 ± 22 PFPS 17 ± 35 PFHxS 33 ± 9.1 PFHpS 8.6 ± 3.2 PFOS 2477 ± 1122 PFNS 1.0 ± 0.71 PFDS 1.0 ± 0.49 PFOSi 0.12 ± 0.17 PFOA 3.3 ± 1.6 PFNA 35 ± 7.8 PFDA 36 ± 7.8 PFUnDA 13 ± 2.8 PFDoDA 3.9 ± 1.1 PFTriDA 5.6 ± 1.1 PFTeDA 0.52 ± 0.21 PFPeDA 0.15 ± 0.14 FOSA 16 ± 3.3 MeFBSE 1.9 ± 0.01 ∑PFCs 2665 ± 1207
Distribution of individual PFC in different tissues of harbor seals is presented in
Figure 16. The whole body burden was related as follows: Blood ≈ liver > muscle > lung
> kidney ≈ blubber > Heart ≈ brain >> thymus > thyroid (Figure 15).
Figure 15. PFC whole body burden distribution in percent and µg per tissue in brackets for harbor seals from the German Bight
Blood and liver contributed three-fourths of the whole body burden for PFCs, but the
Ahrens et al. / Marine Poll. Bull. 2009, 58, 520–525

Publication III
77Ahrens et al. / Marine Poll. Bull. 2009, 58, 520–525
composition differed from compound to compound. For monitoring of PFCs in marine
mammals in the North Sea it would be meaningful to collect liver or blood samples, because
there were found an effectively accumulation of these compounds resulting in the highest
concentrations of all examined tissues. Muscle and blubber tissue corresponded
approximately to two-thirds of sum weight of all analysed tissues, but the PFC body burden of
this both tissues was only 13% and 2%, respectively. However, the pattern of PFCs varied
depending on the functional group and fluorinated chain length. It is noticeable that the
proportion of the PFSAs in liver increased with increasing chain length, whereas the short-
chained PFBS and PFPS were found with over 90% in blood. Otherwise, the PFCAs showed
no obvious differences in the pattern between the different tissues. FOSA was mostly
distributed in blood and MeFOSE in blubber. These different patterns indicated a compound-
specific persistence of PFCs in different tissues of harbor seals.
Figure 16. Tissue distribution of PFC burdens in harbor seals from the German Bight
5.4. Conclusion
In comparison to this study, PFC concentrations in ringed seals from the Canadian Arctic
and elephant seals from the Antarctic were by a factor of ~100 and ~1000-10000 lower,
respectively (Giesy and Kannan 2001; Tao et al. 2006). The occurrence of high concentrations
of PFCs in harbor seals in the German Bight suggests that these compounds should also be
found at several levels in the marine food chain. This could possibly be problematic, because
the North Sea is an important source for the fishery and shrimp industry of the countries

Publication III
78
bordering to the North Sea. A recent study has shown high concentrations of PFCs were
found in plasma and whole blood of the Swedish population, which were usually much higher
than other detected persistent organic pollutants (Kärrman et al. 2006b). Little information is
available on the exposure of PFCs in the marine environment, further investigations about the
accumulation potential and whole body burden in marine wildlife are necessary to assess
potential adverse effects of PFCs. This study provides advice on the analysis of the whole
body burden in harbor seals for individual PFCs, which is relevant for calculation of the
bioaccumulation potential of these compounds in marine mammals.
Acknowledgements
We kindly acknowledge the German Federal Environmental Foundation for sponsoring
the project. The pathological investigations on the seals were funded by the Ministry of
Agriculture, Environment and Rural Development of Schleswig-Holstein, Germany.
Ahrens et al. / Marine Poll. Bull. 2009, 58, 520–525

Publication IV
79Ahrens et al. / Chemosphere 2009, 76, 151−158
6. Publication IV
Temporal Trends of Polyfluoroalkyl Compounds in Harbor Seals
(Phoca vitulina) from the German Bight, 1999-2008
Lutz Ahrens a,b,*, Ursula Siebert c, Ralf Ebinghaus a
a GKSS Research Centre Geesthacht, Department for Environmental Chemistry, Institute for Coastal Research,
Max-Planck-Str. 1, DE-21502 Geesthacht, Germany b Leuphana University of Lüneburg, Institute for Ecology and Environmental Chemistry, Faculty of Environment
and Technique, DE-21335 Lüneburg, Germany c Research and Technology Centre Westcoast (FTZ), University of Kiel, DE-25761 Büsum, Germany
* Corresponding author phone: +49 4152 87 2353; fax: +49 4152 87 2366; e-mail address: [email protected]
Abstract
Temporal trends of polyfluoroalkyl compounds (PFCs) were examined in liver samples
from harbor seals (Phoca vitulina) collected from the German Bight (1999-2008).
Concentrations of various PFCs, including C4-C10 perfluoroalkyl sulfonates (PFSAs),
perfluorooctane sulfinate (PFOSi), perfluorooctane sulfonamide (FOSA) and
C8-C15 perfluoroalkyl carboxylic acids (PFCAs) were quantified. PFOS was the predominant
compound with a maximum concentration of 3676 ng/g ww (1996), making up on average
94% of the measured PFCs. Significantly higher concentrations were found in <7 month old
in comparison to ≥ 7 month old harbor seals for C6-C8 PFSAs, perfluorododecanoic acid
(PFDoDA) and FOSA, whereas perfluorodecanoic acid (PFDA) showed significantly lower
concentrations in the younger harbor seals (p < 0.05). These results suggest a transplacental
transfer of PFCs to the foetus and/or consumption of different contaminated food. Regression
analysis of logarithmic transformed PFC mean concentrations indicated a significant temporal
trend with decreasing concentrations for C5-C7 PFSAs (p < 0.001), PFOSi (p = 0.028), FOSA
(p < 0.001) and perfluorooctanoic acid (PFOA) (p = 0.031) between 1999 and 2008.
Furthermore, perfluorooctane sulfonate (PFOS) decreased by 49% between 1999 and 2008,
which correspond with decreasing concentration levels of its metabolic precursors PFOSi and
FOSA of 83% and 95% in the same time period. However, the decreasing trend of PFOS is
not significant (p = 0.067). The reason for the decline during the past 10 years could be an
effect of the replacement of these PFCs by shorter-chained and less bioaccumulative

Publication IV
80
compounds. But the observations of increasing perfluorodecane sulfonate (PFDS) levels
(p = 0.070), the high concentrations of PFOS and constant levels of C9-C13 PFCAs indicates
that further work on the reduction of environmental emissions of PFCs are necessary.
6.1. Introduction
Polyfluoroalkyl compounds (PFCs) received increasing public attention due to their
persistence, bioaccumulative potential (Martin et al. 2003a) and possible adverse effects on
human and wildlife (Austin et al. 2003; Oakes et al. 2004). PFCs are widely used as
processing additives during fluoropolymer production and as surfactants in consumer
applications, including surface coatings for carpets, furniture and paper products over the past
50 years (Kissa 2001). From the production and use of these products, PFCs can be
potentially released into the environment. PFCs were found ubiquitously in water (Yamashita
et al. 2005), sediment (Higgins and Luthy 2006), wildlife (Giesy and Kannan 2001) and
humans (Yeung et al. 2006), highest concentrations were found in marine top predators
(Houde et al. 2006c). As a result, the 3M Company, the major producer of perfluorooctyl
sulfonyl fluoride (POSF, which is a major precursor for several PFCs) voluntarily phased out
the production in 2000, but a variety of related PFCs are still being produced by other
manufacturers (Prevedouros et al. 2006). Furthermore, in 2006, the U.S. Environmental
Protection Agency (U.S. EPA) launched a voluntary stewardship program to reduce
perfluorooctanoic acid (PFOA) and related chemicals from facility emissions and product
content by 95% by 2010, and to work toward elimination of emissions and content by 2015
(U.S. EPA 2006). In addition the European Union (EU) formed a directive in October 2006,
which prohibits the general use of perfluorooctane sulfonate (PFOS) and their derivates from
June 2008 (European Parliament and Council 2006).
Previous temporal trend studies indicated mostly increasing concentrations of PFCs in
biota from the Arctic (Bossi et al. 2005a; Butt et al. 2007a; Dietz et al. 2008; Smithwick et al.
2006). A temporal trend study on polar bears (Ursus maritimus) showed increasing
concentrations of perfluorooctane sulfonate (PFOS) and longer-chained perfluoroalkyl
carboxylic acids (PFCAs) between 1972 and 2002, and between 1984 and 2006, respectively
(Smithwick et al. 2006; Dietz et al. 2008). An increase in PFOS and PFCAs was also
observed in two seabird species (i.e., thick-billed murres (Uria lomvia) and northern fulmars
(Fulmaris glacialis)) between 1987 and 1993, whereas the concentration in northern fulmars
were relatively constant between 1993 and 2003 (Butt et al. 2007a). Results of a long-term
assessment (1968-2003) in guillemot (Uria aalge) eggs from the Baltic Sea have shown an
almost 30-fold increase in PFOS concentrations with a decrease after 2002 (Holmström et al.
2005). Recently, a few temporal trend studies observed a significant decreasing trend of
Ahrens et al. / Chemosphere 2009, 76, 151−158

Publication IV
81Ahrens et al. / Chemosphere 2009, 76, 151−158
perfluorooctane sulfonamide (FOSA) (Butt et al. 2007b; Furdui et al. 2008; Hart et al. 2008a),
and one study found additionally a significant decreasing trend of PFOS in Arctic ringed seals
(Phoca hispida) (Butt et al. 2007b). These decreasing levels could be caused by restrictions
and bans of production and/or use of POSF. However, recent temporal trend data on PFCs in
biota tissue close to urbanised/industrialised regions with potential high PFC emissions are
lacking in the published literature. This information is needed to examine effects of the
reductions in overall emissions of PFCs on the contamination levels in marine mammals.
Such information is useful for any future strategies for the marine ecosystem to reduce PFC
contaminations.
The aim of this study was to examine temporal trends (1999-2008) and composition
profiles of archived harbor seal livers (Phoca vitulina) collected from the German Bight. In
addition, the association between PFC concentrations in livers of harbor seals and the
evidence of diseases, spatial distribution, age and sex were evaluated. Seals were selected
because they are top predators in the marine ecosystem and accumulate various pollutants
(Braune et al. 2005). Another advantage is that harbor seals are relatively sedentary in their
habitat of around 400 km2 so that local contaminations can be identified (Reijnders et al.
2005). Concentrations of various PFCs, including C4-C10 perfluoroalkyl sulfonates (PFSAs),
perfluorooctane sulfinate (PFOSi), FOSA and C8-C15 PFCAs were quantified. These results
show for the first time significant decreasing concentration of C5-C7 PFSAs, PFOSi and
PFOA in marine mammals.
6.2. Materials and methods
6.2.1. Sample collection
Harbor seal liver samples were collected in the German Bight during 1988 to 2008
(Table S12 in the Supplementary material). All harbor seals were stranded or shot by trained
personnel due to severe illness. Necropsies were conducted on the carcasses at the Research
and Technology Centre Westcoast (FTZ) according to the protocol described by Siebert et al.
2007. Sex and weight of the animals and their livers were measured (see Table S12 in the
Supplementary material). Based on the date when the individuals were found and the length
of the animals the seals were grouped into <7 month (category 1) and ≥ 7 month (category 2)
age classes. 19 of category 1 and 44 harbor seals of category 2 were examined, whereas the
number of samples varied from 1 (2004) to 13 (2007), except for 1989 to 1995 and 1997 to
1998 when no samples were collected. The nutritional status of the animals was judged based
on the weight, blubber thickness and state of muscles and categorized in ‘good’, ‘moderate’
and ‘emaciated’. The general health status was evaluated based on macroscopical,
Publication IV
82
histological, microbiological and virological findings and divided into the three categories
‘good’, ‘moderate’ and ‘poor’. Histological lesions of the liver were judged based on the
severeness into mild, moderate and severe. All liver samples for PFC analysis were taken with
stainless steel instruments, placed into polypropylene (PP) bags and stored in a -20 °C freezer
until analysis.
6.2.2. Extraction and analysis
The target analytes include 33 ionic PFCs (PFCAs, PFSAs, perfluoroalkyl sulfinates
(PFSiAs), fluorotelomercarboxylic acids (FTCAs) and unsaturated fluorotelomercarboxylic
acids (FTUCAs)) as well as 7 neutral PFC precursor compounds (perfluoroalkyl
sulfonamides, perfluoroalkyl sulfonamidoethanols). A list of the native and mass-labelled
standards including their acronyms, formula, supplier and purity are presented in Table 14.
Methanol (SupraSolv), acetonitrile (LiChrosolv) and acetic acid (glacial, > 99%) were
purchased from Merck.
Liver samples were extracted based on the solid-liquid extraction method described by
Powley et al. 2005 with a modified cleanup step (Ahrens et al. 2009e). The separation and
detection of PFCs were performed by liquid chromatography with tandem mass spectrometer
interfaced with an electrospray ionisation source in a negative-ion mode (LC-(-)ESI-MS/MS)
as previously described (Ahrens et al. 2009e; Yamashita et al. 2005).
6.2.3. Quality assurance
The analytical quality of the laboratory has been approved in interlaboratory studies (Van
Leeuwen et al. 2009). As standard procedure, blanks, instrument detection limits (IDLs),
method quantification limits (MQLs), matrix effects and recoveries of spiked samples were
examined (see Table S13 in the Supplementary material). For the method blank 1 mL of
acetonitrile was extracted in the same way as the real samples. The IDLs were determined
using the calibration standards at a signal to noise (S/N) of 3, while MQLs were calculated for
substances which were found in real samples at a S/N of 10. The matrix effects of individual
PFCs were determined in liver tissue by analysis of a fortified extract (100 µL of a 0.1 µg/mL
PFC standard solution), non-fortified extract and solvent based standard solution (matrix
effect = (responsefortified extract – responsenon-fortified extract)/responsesolvent based standard). PFC
recoveries were tested for liver tissues based on triplicate analysis of matrix spiked samples
and extracted with the same analytical procedure.
All method blanks were under the MQL. The MQLs ranged from a few tens of pg/g wet
weight (ww) (e.g. perfluorooctanoic acid (PFOA)) to a few ng/g ww (PFOS), depending on
the compound. Only PFHxDA and PFOcDA showed relevant signal suppression in liver
Ahrens et al. / Chemosphere 2009, 76, 151−158

Publication IV
83Ahrens et al. / Chemosphere 2009, 76, 151−158
tissue of 0.50 and 0.38, respectively. The matrix effect of the other PFCs ranged from
0.83 (PFOSi) to 1.05 (FOSA). Matrix spike recoveries for all analytes ranged from 56%
(PFHxDA) to 135% (EtFOSE) (mean ± standard deviation; 95% ± 22).
6.2.4. Statistical methods
Statistical analyses was performed using SPSS for Windows (version 16) and Microsoft
Excel at a significance level of α = 0.05. PFCs, which were detected in over 50% of the
analysed samples, were used for the statistical comparison of means and temporal trends.
Data were natural-logarithm transformed prior to statistical analysis to meet assumption of
normality and homogeneity of variances. Significant differences were observed between the
two age classes (<7 month old and ≥ 7 month old, respectively) within 2006 and 2007 (Mann-
Whitney U test), for this reason the remaining statistical analyses were performed for only the
harbor seals ≥ 7 month old, because of their greater sample number (n = 44). Pearson analysis
was used for correlations between individual compounds concentrations. The t-test was used
to assess differences between sexes and the varied nutritional and general health status.
Temporal trends were depicted by linear regression analysis of logarithmic transformed mean
concentrations using ANOVA tests for each analyte separately. Any measured sample
reported lower as the MDL was calculated to be 0.5 of the MDL for statistical analysis. The
year 1988 was not included in the ANOVA tests, because of the small sample number (n = 2).
Doubling times were calculated with t1/2 = ln(2)/m, where m represents the slope of the
natural logarithm transformed liver concentration versus time.
6.3. Results and discussion
6.3.1. Contaminant concentrations and composition profiles
Concentrations of individual PFC in livers of harbor seals stranded along the German
Bight in 1988, 1996 and 1999 to 2008 are shown in Table 17. In this study, 17 of 40 target
analytes were found (i.e., C4-C10 PFSAs, PFOSi, FOSA and C8-C15 PFCAs). The geometric
mean ∑PFSA concentrations were 1988 ng/g ww (207-3743 ng/g ww) and 907 ng/g ww
(7.8-2451 ng/g ww) for <7 month old and ≥ 7 month old harbor seals, respectively. PFOS was
the predominant compound with a maximum concentration of 3676 for <7 month old harbor
seals (1996), making up on average 94% of the measured PFCs. The high mean
concentrations of PFPS, PFOS and PFDS in 2003 and 2004 could be due to the small sample
size in these years.

Publication IV
84
Table 17. Average concentrations (ranges) of PFCs in liver tissue of harbor seals from the German Bight in ng/g ww
Analyte Age
(month) 1988
(n=2/0) a 1996
(n=0/2) a 1999
(n=4/1) a 2000
(n=5/1) a 2001
(n=5/2) a 2002
(n=5/1) a 2003
(n=2/3) a 2004
(n=1/0)a2005
(n=4/1) a 2006
(n=3/5) a 2007
(n=10/3) a 2008
(n=3/0) a
≥ 7 0.1 (n.d.-0.3) - 0.2 (n.d.-0.4) 0.4 (n.d.-1.9) 0.8 (n.d.-3.1) n.d. n.d. 0.5 0.3 (0.1-0.4) 0.2 (n.d.-0.5) 0.2 (0.1-0.4) 0.2 (0.2-0.3)PFBS <7 - 1.2 (0.8-1.6) 0.44 0.2 0.5 (0.3-0.7) 0.5 0.6 (0.2-1.2) - n.d. 0.6 (n.d.-1.4) 0.3 (0.3-0.4) - ≥ 7 2.6 (0.9-4.2) - 2.6 (2.1-3.7) 2.1 (1.0-3.4) 2.1 (0.7-6.2) 2.3 (1.3-3.4) 4.2 (2.0-6.4) 5.2 1.6 (1.0-2.4) 1.2 (0.6-2.2) 0.6 (n.d.-1.3) 0.5 (0.3-0.6)PFPS b <7 - 2.3 (1.2-3.4) 3.8 1.8 4.1 (3.2-5.1) 5.0 2.5 (1.0-3.4) - 2.7 0.4 (n.d.-1.1) 0.3 (n.d.-0.7) - ≥ 7 13 (8.9-17) - 10 (5.0-21) 11 (2.6-32) 11 (3.0-21) 10 (3.0-20) 6.9 (3.9-10) 9.8 5.8 (2.2-10) 2.4 (n.d.-4.7) 4.0 (1.3-7.9) 1.2 (0.6-1.7)PFHxS <7 - 16 (13-19) 31 26 27 (19-35) 32 24 (21-29) - 3.3 16 (2.7-33) 7.8 (1.4-17) - ≥ 7 2.6 (1.7-3.4) - 4.6 (1.3-9.5) 7.8 (1.9-22) 7.2 (1.7-16) 5.9 (1.2-13) 6.4 (3.7-9.1) 6.8 3.1 (1.0-5.1) 2.1 (n.d.-4.2) 3.8 (0.8-10) 0.2 (0.1-0.3)PFHpS <7 - 47 (41-53) 28 49 16 (7.8-24) 13 25 (13-40) - 3.8 5.4 (n.d.-23) 14 (1.3-39) -
≥ 7 1327 (1224-1429)
- 1111
(576-1470) 932
(292-2080)1130
(313-2407) 902
(455-1396) 1436
(645-2227)1632
785 (402-1023)
472 (7.2-806)
597 (277-951)
480 (367-577)
PFOS <7 -
3520 (3363-3676)
3067 3662 2415
(1564-3265)1143
2408 (1541-3451)
- 772 1198
(439-1983) 1077
(204-2723)-
≥ 7 n.d. - 0.3 (n.d.-0.5) 0.2 (n.d.-0.5) 0.6 (0.1-1.8) 0.7 (n.d.-1.5) 1.8 (0.8-2.8) 2.0 0.9 (0.5-1.2) 0.8 (n.d.-1.2) 1.4 (0.6-2.6) 0.1 (n.d.-0.2)PFNS b <7 - 2.7 (1.0-4.4) 1.9 2.9 1.8 (0.8-2.8) 0.59 2.6 (1.3-4.4) - 0.49 0.6 (n.d.-1.3) 2.0 (0.5-4.5) - ≥ 7 n.d. - 0.1 (n.d.-0.3) 0.2 (n.d.-0.4) 0.2 (n.d.-0.8) 0.3 (n.d.-0.6) 0.5 (n.d.-1.1) 1.5 0.3 (n.d.-0.5) 0.3 (n.d.-0.5) 0.6 (n.d.-1.1) 0.1 (n.d.-0.2)PFDS <7 - 1.2 (1.0-1.4) 1.4 1.8 1.0 (0.4-1.6) 0.5 2.1 (1.3-3.0) - 0.38 0.3 (0.1-0.9) 1.4 (n.d.-4.1) - ≥ 7 n.d. - 0.6 (0.1-1.7) 0.2 (n.d.-0.8) 0.1 (n.d.-0.3) n.d. 0.2 (0.1-0.2) n.d. 0.3 (0.2-0.4) 0.1 (0.1-0.2) 0.2 (n.d.-0.5) 0.04 (n.d.-0.1)PFOSi <7 - 0.1 (n.d.-0.1) 0.5 0.4 0.6 (0.5-0.6) 0.1 0.4 (0.1-1.0) - 0.18 0.1 (n.d.-0.2) 0.9 (0.2-2.3) - ≥ 7 1.0 (n.d.-2.1) - 1.4 (n.d.-2.6) 2.4 (n.d.-8.4) 3.3 (n.d.-7.1) 0.6 (n.d.-1.8) 0.8 (n.d.-1.6) n.d. 0.9 (0.3-1.2) 0.8 (n.d.-1.3) 1.0 (n.d.-1.7) 0.3 (n.d.-0.8)PFOA <7 - 3.9 (2.2-5.7) n.d. 13 1.8 (1.1-2.4) 3.6 2.6 (1.5-4.6) - 0.30 1.3 (n.d.-3.9) 2.0 (0.4-3.9) - ≥ 7 4.7 (4.1-5.2) - 11 (5.2-23) 13 (2.5-27) 16 (1.0-27) 9.3 (3.2-17) 13 (11-15) 9.3 15 (7.8-18) 11 (0.3-19) 14 (9.2-21) 8.0 (6.2-9.7)PFNA <7 - 8.6 (4.8-12) 1.0 19 4.6 (3.9-5.3) 6.3 11 (1.6-19) - 2.6 7.4 (0.9-17) 6.1 (5.1-8.1) - ≥ 7 4.2 (4.0-4.4) - 9.4 (4.7-15) 14 (2.5-30) 12 (2.5-25) 17 (6.5-36) 16 (12-20) 13 14 (7.6-18) 14 (0.2-23) 18 (9.7-23) 8.0 (5.9-10)PFDA <7 - 4.5 (2.9-6.0) 3.4 14 4.4 (3.6-5.2) 4.4 10 (2.8-15) - 1.8 7.0 (0.4-16) 11 (7.5-15) - ≥ 7 0.8 (0.5-1.2) - 3.9 (2.2-5.4) 4.3 (1.0-8.3) 3.8 (1.3-7.9) 5.6 (1.5-12) 5.6 (4.0-7.3) 7.3 5.8 (3.7-7.2) 5.2 (0.7-7.5) 5.5 (3.8-7.0) 3.0 (2.5-3.8)PFUnDA <7 - 2.6 (2.3-3.0) 4.8 7.4 3.6 (3.2-3.9) 3.2 7.0 (3.8-11) - 3.7 3.5 (3.0-4.5) 4.7 (2.7-7.4) - ≥ 7 n.d. - 0.8 (0.6-1.1) 1.0 (0.3-2.0) 0.8 (0.3-1.7) 0.9 (n.d.-1.8) 0.9 (0.5-1.2) 2.3 1.7 (1.4-2.1) 1.1 (0.2-1.7) 1.2 (0.9-1.6) 0.9 (0.8-1.0)
PFDoDA <7 - 1.4 (1.2-1.6) 2.7 2.9 1.9 (1.5-2.3) 1.1 2.4 (1.7-3.6) - 1.1 1.8 (0.9-3.2) 2.6 (0.5-4.9) - ≥ 7 n.d. - 1.3 (0.8-1.7) 1.4 (0.4-3.1) 1.3 (0.5-2.2) 1.5 (n.d.-2.3) 1.8 (1.5-2.1) 4.8 3.0 (2.4-3.6) 2.0 (1.4-2.6) 1.9 (1.5-2.7) 1.2 (1.0-1.4)PFTriDA <7 - 2.3 (2.1-1.6) 4.5 2.8 4.1 (3.7-4.5) 1.9 3.6 (1.0-6.0) - 3.4 2.6 (1.2-5.9) 3.7 (1.1-6.1) - ≥ 7 n.d. - n.d. n.d. n.d. 0.1 (n.d.-0.2) n.d. n.d. n.d. n.d. 0.1 (n.d.-0.2) n.d. PFTeDA <7 - n.d. 0.56 0.39 0.5 (0.5-0.6) n.d. 0.2 (n.d.-0.4) - 0.24 0.2 (n.d.-0.4) 0.24 (n.d.-0.4) - ≥ 7 n.d. - 0.02 (n.d.-0.1) n.d. 0.1 (n.d.-0.6) 0.04 (n.d.-0.2) n.d. n.d. n.d. n.d. n.d. n.d. PFPeDA b <7 - n.d. 0.4 0.2 0.8 (0.4-1.2) 0.13 n.d. - n.d. 0.1 (n.d.-0.4) n.d. - ≥ 7 4.8 (3.3-6.3) - 33 (3.4-81) 7.9 (2.5-20) 8.0 (1.3-16) 6.7 (n.d.-17) 8.2 (6.1-10) 6.1 6.2 (5.0-8.0) 7.0 (2.2-16) 2.3 (0.9-4.6) 0.9 (0.5-1.2)FOSA <7 - 16 (11-20) 202 7.9 45 (30-61) 9.1 41 (15-72) - 11 3.9 (1.0-6.6) 7.0 (1.3-18) -
≥ 7 1361 (1264-1458)
- 1190
(614-536) 997
(319-2226)1198
(332-2537) 962
(476-1501) 1502
(701-2303)1701
844 (437-1090)
520 (13-873)
653 (325-1018)
504 (387-606)
∑PFCs <7 - 3629
(3498-3761) 3353 3810
2533 (1649-3417)
1225 2542
(1669-3591)- 807
1249 (474-2069)
1140 (237-2844)
-
a n.d. = not detected; n = number of ≥ 7 month old harbor seals/ <7 month old harbor seals; b To be considered as estimated, because no standard was available.
In general, the concentrations in all investigated years were much higher than measured in
Arctic ringed seal samples. Hence, mean PFOS concentrations were by about a factor of 10 to
50 lower from the two locations (Grise Fjord and Holman) in the Canadian Arctic (1998 and
2001, respectively) and the two locations (Ittoqqortoormiit and Qeqertarsuaq) in Greenland
(1986-2003 and 1982-2003, respectively) (Bossi et al. 2005a; Martin et al. 2004a). Van de
Vijver et al. 2005 found mean PFOS concentrations of 175 ± 105 ng/g ww in liver of harbor
seals from the Dutch Wadden Sea, which was still about a factor of 5 lower than in this study.
However, in most studies PFOS was the dominating PFC in marine mammals (Houde et al.
2006c). FOSA was found in almost all measured samples in a range of 1.0 to 202 and 0.5 to
80.7 ng/g ww in <7 month old and ≥ 7 month old harbor seals, respectively. Lower
concentrations were found for PFOSi with up to 2.3 and 1.7 ng/g ww in <7 month old and
≥ 7 month old harbor seals, respectively. The presence of FOSA and PFOSi at high
concentrations may indicate incomplete biotransformation of EtFOSE to PFOS, since FOSA
and PFOSi were proposed to be intermediates of this biotransformation pathway (Rhoads et
Ahrens et al. / Chemosphere 2009, 76, 151−158

Publication IV
85Ahrens et al. / Chemosphere 2009, 76, 151−158
al. 2008). This is consistent with the high positive correlation of FOSA and PFOSi with each
other (p < 0.01, see Table S14 in the Supplementary material). The other PFSAs made only a
small contribution to the ∑PFSAs (see Figure 17), but they were detected frequently in
55-100% of all analysed samples. The dominance of PFOS and the presence of the longer-
and shorter-chained PFSA in biota tissue suggests that the source were POSF–derived
products from electrochemical fluorination (ECF) manufacturing process, which contain
homologous series of even- and odd-number PFSAs (Giesy and Kannan 2002).
Figure 17. Composition profile of individual PFSAs, PFOSi and FOSA (A) and PFCAs (B) in habor seals (≥ 7 month old, n = 44)
In contrast to the PFSAs, only the longer-chained PFCAs (C8-C15) could be detected in
harbor seals, which suggest a higher accumulation potential of PFSAs compared to PFCAs
(Martin et al. 2003b). ∑PFCAs concentrations ranged between 13-58 ng/g ww and
2.4-79 ng/g ww for <7 month old and ≥ 7 month old harbor seals, respectively. PFNA, PFDA
and PFUnDA dominated with an average contribution of 27%, 26% and 16% in <7 month old
and 34%, 37% and 14% in ≥ 7 month old harbor seals to ∑PFCAs, respectively (see
Figure 17). These results correspond with the observations of Smithwick et al. 2005a and
Martin et al. 2004a in polar bears from the Arctic, whereas C8-C15 PFCAs were detected with
C9-C11 PFCA as the dominant PFCAs. In the present study, concentrations of PFOA were
relatively low (<0.087-13 and <0.087-8.4 ng/g ww in <7 month old and ≥ 7 month old harbor
seals), which confirms the relatively low bioaccumulation potential of shorter-chained PFCAs
(≤ C8) (Martin et al. 2003a). On the other hand, with increasing PFCA chain length (≥ C11) the

Publication IV
86
concentration decreased, with concentrations of PFTeDA and PFPeDA below of 1.3 ng/g ww.
Biomagnification of PFCs were reported in the marine food web from Lake Ontario and in the
Eastern Arctic (Martin et al. 2004b; Tomy et al. 2004a). Interestingly, in Arctic ringed seals
the PFCA concentrations were about a factor of 2 lower (Butt et al. 2007b), while the PFOS
concentrations were about a factor of 10-50 lower than in this study (see discussion above).
These results suggest that PFOS is mainly found near source regions, against what the
distribution of PFCAs are more uniform due to their long-range transportation via volatile
precursors by the atmosphere and/or directly by the ocean currents.
Fluorinated telomer acids were suggested as atmospheric and/or microbial degradation
products of fluorinated telomer alcohols (FTOHs), which could finally degrade to PFCAs
(Ellis et al. 2004; Wang et al. 2005). In contrast to Arctic ringed seals (Butt et al. 2007b),
FTCAs and FTUCA were not detected in any samples of this study. Therefore, these
degradation pathways may play a minor role of the PFCAs contamination in harbor seals from
the German Bight, which confirm the hypothesis that the main transport pathways in this
urbanised areas is directly via the water phase (Prevedouros et al. 2006). However, the
pathways of PFCs from production and/or products to the marine food web are not fully
understood.
C9-C13 PFCAs were significantly correlated with each other and with PFOS and PFNS
(see in Table S14 the Supplementary material). This corresponds with reported positive
correlation between the C6-C10 PFCAs in water samples (So et al. 2007). In addition, C4 and
C6-C8 PFSAs were significantly correlated with each other and also with the shorter-chained
PFCAs (C8-C10). These results suggest that these PFCs had a common source as reported by
Smithwick et al. 2005b. PFC concentrations in harbor seal livers collected in the same year
showed a high mean standard deviation of 33% (PFTeDA) to 73% (PFHpS), which indicated
influences from other variables such as differences in diet or different metabolisms may also
play an important role. However, the composition profile is relatively constant over the time
period (see Figure 17). In addition, no interannual variations in the relative compounds ratio
were found in harbor seals, which is in agreement with the observation of an equal exposure
of PFCs in bottlenose dolphins over the whole year (Houde et al. 2006a). Overall, the pattern
and generally high PFC contamination suggest distinctive sources from high
urbanised/industrialised regions at the German Bight.
Ahrens et al. / Chemosphere 2009, 76, 151−158

Publication IV
87Ahrens et al. / Chemosphere 2009, 76, 151−158
6.3.2. Comparison of PFC concentrations in harbor seals with age, sex, location and
health status
Significantly higher concentrations were found in <7 month old in comparison to
≥ 7 month old harbor seals for PFHxS (p < 0.001), PFHpS (p < 0.001), PFOS (p < 0.01),
PFDoDA (p < 0.01) and FOSA (p < 0.05) (Figure 18), whereas PFDA showed significantly
lower concentrations in <7 month old harbor seals (p < 0.05). This is consistent with the
observation that higher concentrations of PFOS were found in juvenile harbor porpoises (Van
de Vijver et al. 2003a). Conversely, significant increase in PFOS and PFCAs concentrations
with age has been previously reported by Smithwick et al. 2005b for juvenile male polar bears
from East Greenland. One explanation could be transplacental transfer of PFC contaminants
to the foetus (Hart et al. 2008a). On the other hand, younger harbor seals have a different diet
and they are going foraging close to the coast in comparison to the older harbor seals
(Reijnders et al. 2005), so that they are possibly exposed to higher contaminated food.
However, information on the influence of the age on the PFC concentrations in marine
mammals is very sparse (Houde et al. 2006c; Kannan et al. 2002c).
Figure 18. Comparison of individual PFCs in <7 month old (blue, n = 8) and ≥ 7 month old (red, n = 13) habor seals (Phoca vitulina) from 2006 and 2007
No significant correlation was identified between PFC concentrations and spatial
distribution and sex, respectively for any analyte (p > 0.05). Mean concentrations of ‘good’
‘moderate’ and ‘poor’ general health status (1204 ± 772, 969 ± 532 and 890 ± 505 ng/g ww,
respectively) and ‘good’, ‘moderate’ and ‘emaciated’ nutritional status (992 ± 718, 940 ± 588
and 916 ± 366 ng/g ww, respectively) were not statistical significant different (p > 0.05;
Figure 19). However, PFOS and PFOA have several possible adverse effects in biota, such as
neuroendocrine effects (Austin et al. 2003) and peroxisome proliferation, have been shown to

Publication IV
88
occur (Oakes et al. 2004). Significantly positive correlations between high concentrations of
PFOA and PFOS and infectious diseases in sea otters (Enhydra lutris nereis) were found from
Kannan et al. 2006. In this study, the lack of significance could be caused by the low
contamination level and the dependence on the species of the toxic effects. The lowest no-
observed-adverse effect levels (NOAEL) of PFOS in the liver of rats (358 to 370 µg/g ww),
and cynomolgus monkeys (Macaca fasicularis) (59 to 70 µg/g ww) were much higher than
the concentration level measured in harbor seals from this study (Seacat et al. 2003; Seacat et
al. 2002). However, physiological changes were observed in Baikal seals (Pusa sibirica) with
similar concentrations of PFCA and lower concentrations of PFOS compared to this study
(Ishibashi et al. 2008b).
Figure 19. Box-whisker plots showing ∑PFCs concentration (ng/g ww) in livers of ≥ 7 month old harbor seals classified in (A) ‘poor’ (n = 22), ‘moderate’ (n = 8) and ‘good’ (n = 9)
general health status and (B) ‘emaciated’ (n = 8), ‘moderate’ (n = 23) and ‘good’ (n = 13) nutritional status. Mean concentrations are indicated as a black circle, while the boxes show
25% and 75% percentiles and medians
6.3.3. Temporal Trends of PFSAs, PFOSi and FOSA
Harbor seal liver samples from the German Bight showed significantly decreasing
temporal trends of C5-C7 PFSAs, PFOSi and FOSA between 1999 and 2008 (Figure 20 and
Figure S6 in the Supplementary material). Overall, the C5-C7 PFSAs have decreased by 58%
for PFPS, 80% for PFHxS and 79% for PFHpS between 1999 and 2008, conversely,
concentrations of PFDS increased by 47%. However, the increasing trend of PFDS is not
significant (p = 0.070). PFOS decreased by 49% between 1999 and 2008 (p = 0.067), which
corresponds with decreasing concentration levels of its metabolic precursors PFOSi and
FOSA of 83% and 95% in the same time period. However, the results of PFOSi must be
considered carefully, because this compound can be decomposed very fast in the presence of
oxygen to PFSAs and PFCAs. PFBS and PFNS concentrations were detected in 55% and 76%
of the samples, respectively, but no significant temporal trend could observed (p = 0.185 and
Ahrens et al. / Chemosphere 2009, 76, 151−158

Publication IV
89Ahrens et al. / Chemosphere 2009, 76, 151−158
p = 0.561, respectively). But if the year 1999 was excluded in the ANOVA tests, the PFBS
concentration decreased statistically significant by 59% between 2000 and 2008 (p = 0.017,
r2 = 0.762) (Figure 20). The decreasing concentration of PFBS is in contradiction to the
conversion of the production from POSF to the shorter-chained PFBS after the production
termination of POSF in 2000 (Prevedouros et al. 2006). An explanation for this declining
trend could be that the PFBS contamination, detected in this area, is the result of the POSF
production, which yields a product mixture of linear and up to 30% branched isomers (Giesy
and Kannan 2002). This possibility is supported by similar decreases in PFPS, PFHxS and
PFHpS.
Figure 20. Temporal trends of eight PFCs in habor seals from the German Bight from 1999 to 2008. The plots display the geometric means (circles) and the median (squares) together with the individual analysis (small dots) and the 95% confidence intervals of the geometric means
(≥ 7 month old, n = 44). Note: The linear regression of PFBS was calculated from 2000 to 2008
Opposite to other reports (Butt et al. 2007b; Smithwick et al. 2006) the concentrations of
PFPS, PFHxS, PFHpS and PFOSi showed a statistically significant decrease in this study
resulting in half-lives of 4.2 ± 0.9, 4.0 ± 0.9, 2.9 ± 0.5 and 4.7 ± 3.6 years, respectively
(Table 18). The decreasing temporal trend of FOSA were confirmed in other reports for

Publication IV
90
example in melon-headed whales (2001/2002 to 2006), lake trouts (1993-2004) and Arctic
ringed seals (1998-2005) (Butt et al. 2007b; Furdui et al. 2008; Hart et al. 2008a). The half-
life (1999-2008) for FOSA was calculated here with 2.8 ± 0.9 years, which is comparable
with the half-life (1998 to 2005) in Arctic ringed seals from Arviat (2.0 ± 0.6 years) (Butt et
al. 2007b), but lower than reported in polar bears from eastern and western sampling sites in
the North American Arctic (10.5 ± 7.5 and 13.8 ± 17.0 years for 1972 to 2002, respectively)
(Smithwick et al. 2006). PFOS had a half-life of 5.6 ± 18.9 years, the uncertainty was higher
than for the other calculated half-lives in this study, because of the lower significance
(p = 0.067). However, most studies found a increasing temporal trend of PFOS like in polar
bear and ringed seal livers from the Arctic (Bossi et al. 2005a; Dietz et al. 2008; Smithwick et
al. 2006), whereas Smithwick et al. 2006 calculated half-lives of 9.8 ± 5.1 and
13.1 ± 4.0 years, respectively. Holmström et al. 2005 investigated the temporal trend of PFOS
and PFOA in guillemot eggs from the Baltic Sea from 1968-2003. They found an increasing
PFOS concentration, but after 2002 the concentration declined. Furthermore, Butt et al. 2007b
were the first who found a statistically significant decreasing trend of PFOS in Arctic ringed
seals with a half-life of 3.2 ± 0.9 years (Arviat, 1998-2005) and 4.6 ± 9.2 years (Resolute Bay,
2000-2005), respectively (see Figure 21).
Table 18. Doubling times, half-lives (years ± 95% confidence interval) and statistical parameters based on the linear regressions of PFCs in liver tissue of harbor seals (Phoca vitulina) from the German Bight, 1999-2008 (≥ 7 month old, n = 44)
Analyte r2 P Doubling times/ half-lives (yr)
Perfluorobutane sulfonate (PFBS) b 0.263 0.185 - a Perfluoropentane sulfonate (PFPS) 0.425 <0.001 4.2 ± 0.9 Perfluorohexane sulfonate (PFHxS) 0.616 <0.001 4.0 ± 0.9 Perfluoroheptane sulfonate (PFHpS) 0.472 <0.001 2.9 ± 0.5 Perfluorooctane sulfonate (PFOS) 0.280 0.067 5.6 ± 18.9 Perfluorononane sulfonate (PFNS) 0.008 0.561 - a Perfluorodecane sulfonate (PFDS) c 0.014 0.070 26.2 ± 2.4 Perfluorooctane sulfinate (PFOSi) 0.546 0.028 4.7 ± 3.6 Perfluorooctanoic acid (PFOA) 0.367 0.031 5.6 ± 4.2 Perfluorononanoic acid (PFNA) 0.063 0.993 - a Perfluorodecanoic acid (PFDA) 0.069 0.912 - a Perfluoroundecanoic acid (PFUnDA) 0.007 0.571 - a Perfluorododecanoic acid (PFDoDA) 0.055 0.255 - a Perfluorotridecanoic acid (PFTriDA) 0.066 0.189 - a Perfluorooctane sulfonamide (FOSA) 0.710 <0.001 2.8 ± 0.9 a Not determined, because of insignificant slope; b if the linear regressions was carried out from 2000 to 2008, the PFBS concentration decreased statistically significant (r2 = 0.762, p = 0.017); c value for PFDS in italics indicating doubling time per year.
Ahrens et al. / Chemosphere 2009, 76, 151−158
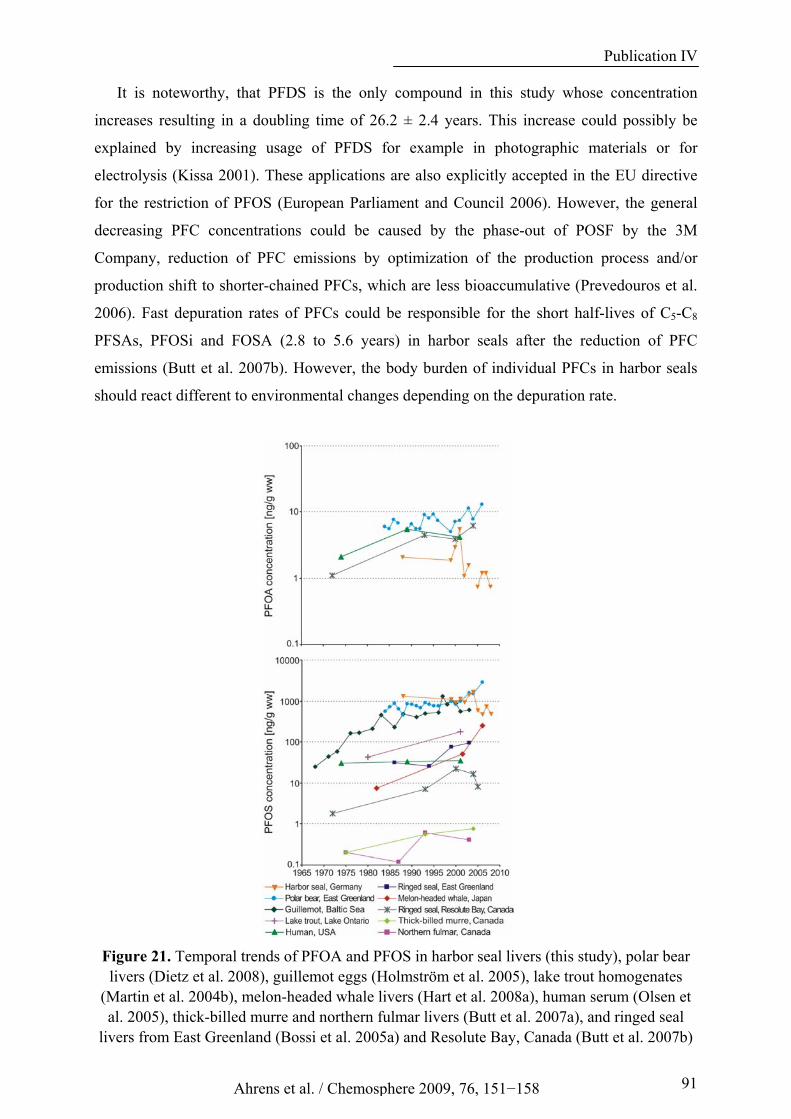
Publication IV
91Ahrens et al. / Chemosphere 2009, 76, 151−158
It is noteworthy, that PFDS is the only compound in this study whose concentration
increases resulting in a doubling time of 26.2 ± 2.4 years. This increase could possibly be
explained by increasing usage of PFDS for example in photographic materials or for
electrolysis (Kissa 2001). These applications are also explicitly accepted in the EU directive
for the restriction of PFOS (European Parliament and Council 2006). However, the general
decreasing PFC concentrations could be caused by the phase-out of POSF by the 3M
Company, reduction of PFC emissions by optimization of the production process and/or
production shift to shorter-chained PFCs, which are less bioaccumulative (Prevedouros et al.
2006). Fast depuration rates of PFCs could be responsible for the short half-lives of C5-C8
PFSAs, PFOSi and FOSA (2.8 to 5.6 years) in harbor seals after the reduction of PFC
emissions (Butt et al. 2007b). However, the body burden of individual PFCs in harbor seals
should react different to environmental changes depending on the depuration rate.
Figure 21. Temporal trends of PFOA and PFOS in harbor seal livers (this study), polar bear livers (Dietz et al. 2008), guillemot eggs (Holmström et al. 2005), lake trout homogenates
(Martin et al. 2004b), melon-headed whale livers (Hart et al. 2008a), human serum (Olsen et al. 2005), thick-billed murre and northern fulmar livers (Butt et al. 2007a), and ringed seal
livers from East Greenland (Bossi et al. 2005a) and Resolute Bay, Canada (Butt et al. 2007b)

Publication IV
92
6.3.4. Temporal Trends of PFCAs
Statistically significant temporal trends of PFCAs could only be found for PFOA
(p = 0.031, Figure 20), representing a decrease of 86% between 1999 and 2008. C9-C13 PFCA
concentrations were detected in 95% to 100% of the samples, but no significant temporal
trend could be observed (p = 0.188 to p = 0.993). PFTeDA and PFPDA were found in 17 and
7% of the samples, respectively and were, therefore, not used for the statistical temporal trend
analysis. The half-life of PFOA was 5.6 ± 4.2 years (Table 18), conversely, other studies
found increasing PFOA concentrations (Dietz et al. 2008; Smithwick et al. 2006) (see
Figure 21), whereas Smithwick et al. 2006 calculated doubling times of 7.3 ± 2.8 and
13.9 ± 14.2 years in polar bears from east and west North American Arctic, respectively. The
phase-out of POSF-based products in 2001 and the reduction of global PFOA emissions for
the period 1999-2008 could be responsible for the clearly decreasing temporal trend of PFOA,
but PFOA is still produced by other manufactures and used in fluoropolymer production
(Prevedouros et al. 2006). Furthermore, the elimination rate of PFOA in organisms by urinary
or faecal excretion, and possibly by milk by females is faster than, for example, PFOS, which
could lead to a fast elimination after the uptake and low concentration level in the liver of the
animals (Hart et al. 2008a; Olsen et al. 2007).
6.4. Conclusion
Previous temporal trend studies demonstrated decreasing concentrations of PFOS and
FOSA (Butt et al. 2007b; Hart et al. 2008a), this study shows for the first time significant
decreasing concentrations of C5-C7 PFSAs, PFOSi and PFOA in marine mammals during the
past 10 years. The reason could be, probably, that this is the effect of the phase-out of POSF
by 3M Company, the reduction of PFOA emissions by a stewardship program from the
U.S. EPA and replacement of PFOS and their derivates by less bioaccumulative compounds
because of the formed directive from the EU (Prevedouros et al. 2006; European Parliament
and Council 2006). But the observations of increasing PFDS levels and the still high
concentrations of PFOS in 2008 and constant levels of C9-C13 PFCAs indicates that further
work on the reduction of sources of PFCs are necessary. Ultimately, these high PFCs body
burden could possibly have an effect on the immune system and physiological functions of
the animals (Guruge et al. 2006; Ishibashi et al. 2008b; Yang et al. 2002).
The intake of water by harbor seals is being done completely via the food, hence the water
could not be directly responsible for the contamination of the harbor seals with PFCs.
However, the harbor seals were collected in an urbanised/industrialised area where PFCs
could be released directly (e.g., manufacture and consumer products) or indirectly (e.g. PFC
Ahrens et al. / Chemosphere 2009, 76, 151−158

Publication IV
93Ahrens et al. / Chemosphere 2009, 76, 151−158
precursors) into the aqueous environment and can be bioaccumulated in the marine food web.
Other reports found increasing concentrations in polar bears and Arctic ringed seals from
Greenland, which were explained by the degradation of neutral precursor compounds to ionic
PFCs (Bossi et al. 2005a; Dietz et al. 2008). Hereby, the composition profile and temporal
trends for PFCs in the German Bight could reflect the regional usage pattern of different PFC
products. This study highlights the importance of further monitoring studies in seals and other
marine mammals from highly populated sites in order to evaluate association between PFCs
and pathological conditions, and changes in pattern and long-term perspective trends.
Acknowledgements
We kindly acknowledge the German Federal Environmental Foundation for sponsoring
the project. The pathological investigations on the seals were partly funded by the Ministry of
Agriculture, Environment and Rural Development of Schleswig-Holstein, Germany.

Additional studies
94
7. Additional studies
Several studies were performed besides the main issue of the Ph.D. work, which are
described in the following. Firstly, water samples were collected along the river Elbe into the
North Sea to examine the distribution of PFCs in the dissolved and particulate phase and their
discharge into the North Sea (7.1) (Ahrens et al. 2009c). In addition, a second cruise along the
river Elbe was carried out in the river Elbe to investigate the influence of WWTP effluents to
the riverine mass flow (7.2) (Ahrens et al. 2009f). Furthermore, surface water samples were
collected in the North Sea, Baltic Sea and Norwegian Sea, where the occurrence and spatial
distribution between river estuaries, coastal water, in brackish as well as salt water, and open
sea water was compared (7.3) (Ahrens et al. submitted). Finally, within the frame of a
research stay at the National Institute of Advanced Industrial Science and Technology (AIST)
in Japan, the partitioning behaviour of PFCs between pore water and sediment in two
sediment cores from Tokyo Bay, Japan was investigated (7.4.) (Ahrens et al. 2009g).
7.1 PFCs in water and suspended particulate matter in the river Elbe and
North Sea
Surface water samples were taken at 24 locations from the river Elbe and the North Sea
(Germany) in August 2006 (Figure 22). Details of the sampling and the physicochemical
parameters of the water samples are presented in Table S15 in the Supplementary material.
Figure 22. Map showing the sampling locations in the river Elbe and the North Sea (a dam is located between sampling stations 21 and 22)
One to two litre of water samples were obtained via a metal ship inlet system at 1-m water
depth into brown glass bottles. A depth profile was taken at sampling station 23 at 0.5, 1.0,

Additional studies
95
2.0, 2.5, and 2.8-m water depth for the estimation of the flux from the river Elbe into the
North Sea. The samples were filtered using GFFs (> 1.2 µm) on the same or following day.
The sample analysis was performed as described in publication II.
Concentration of PFCs in the particulate and dissolved phase
Overall 20 of the 40 examined analytes were found at the 24 sampling locations. The
PFCs quantified included C4-C8 PFSAs, 6:2 FTS, C6 and C8 PFSiAs, C4-C12 PFCAs,
3,7m2-PFOA, FOSA, and EtFOSE. The uneven carbon chained analytes PFPS and PFHpS
may be by-products of the POSF-based and PBSF-based production, respectively.
3,7m2-PFOA could be a by-product of the production of PFCAs, while EtFOSE is a precursor
of PFSAs.
In the particulate phase 10 PFCs were detected, however, only PFOSi and FOSA were
found in all samples. PFOS was found in three-quarters of the samples and the occurrence of
C8 to C11 PFCAs decreased from 63% to 21% in the samples taken. A maximal ∑PFC
concentration was observed with 6.0 ng/L (location 23). The average ∑PFC concentrations
decreased by a factor of 3.6 and 16 from Hamburg towards the Elbe Estuary and the North
Sea, respectively. The large decrease in ∑PFC concentration towards the North Sea could be a
result of sedimentation processes and/or dilution with sea-borne particles in the estuary.
However, the concentrations in the particulate phase of the single compounds were usually
lower than 1 ng/L except FOSA and PFOS with a few ng/L, while towards the North Sea the
concentrations decreased below the MQL.
In the dissolved phase the compounds, PFOS, FOSA, and C5 to C9 of PFCAs were
detected in all water samples. In contrast to the particulate phase, the occurrence of PFCs in
the dissolved phase decreased with increasing chain length. A maximal ∑PFC concentration
of 50.7 ng/L was observed at location 16 in Hamburg City. This indicates the major influence
of the urban area at Hamburg City as a source of PFC contamination of the river Elbe. The
average ∑PFC concentration dropped by a factor of 3 towards the North Sea. Just PFOS and
both short-chained PFBA and PFBS showed a different behaviour along the river Elbe
towards the North Sea. PFOS had a maximum concentration of 7.5 ng/L in Hamburg, and in
addition a second maximum in the North Sea of 4.2 ng/L. Over the entire course down to the
North Sea the concentration of PFBS and PFBA was relatively constant at 1.3 and 2.3 ng/L,
respectively, but towards the North Sea (locations 1 to 4) the concentration increased to
2.5 ng/L and 3.0 ng/L, respectively.
Investigations by Caliebe et al. 2004 determined mean concentrations of PFCs in the river
Elbe in 2003 of about 20 ng/L for PFOA and PFOS, and 1 ng/L to 3 ng/L for other PFCs like
PFHxA, PFNA, PFDA, PFHxS, and FOSA. The concentrations of PFOA and PFOS in 2003

Additional studies
96
were twice as high as in this study from 2006, which may be a result of the phased out of the
production of POSF from 3M.
Particulate related PFC fraction (φ = [PFC]SPM/([PFC]dissolved+[PFC]SPM) × 100) was
calculated from the concentrations in the dissolved and particulate phase, which varied from
compound to compound and depended on the location from where the samples were taken.
The PFCs were mostly distributed in the dissolved phase, only EtFOSE was exclusively found
in the particulate phase. PFOSi and FOSA were detected in every particulate phase with a
proportion of 7% to 100% and 9% to 45%, respectively. The mean percentages of the
particulate associated fraction were also relatively high for PFOS (14%), PFUnDA (12%),
and PFDA (10%). PFSAs and longer-chained PFCAs, and perfluorinated sulfonamides and
sulfonamido ethanols were more associated to particles than the shorter-chained PFCAs. This
indicates that these compounds could rather settle down and accumulate in the sediment
depending on their solid-water distribution coefficients (Higgins and Luthy 2006). PFCs
which exist predominantly in the dissolved phase such as the shorter-chained PFCAs, will be
rapidly dispersed in the aquatic environment and can be transported over long distances
(Yamashita et al. 2005).
Total PFC flux from the river Elbe into the North Sea
The riverine discharge calculations are based on data from the ARGE Elbe (personal
communication), a consortium of German states for the prevention of pollution in the river
Elbe. At the sampling day riverine discharge showed only a 7% higher amount compared to
the mean annual riverine discharge. Because of this good agreement, or similarity, the total
estimated flux per year was calculated with the riverine discharge of 736 m3/s for the
sampling day, which represents a riverine discharge of 2.32E+10 m3 water per year. For this
estimation the mean concentration of the water samples at 0.5, 1.0, 2.0, 2.5, and 2.8-m depth
at location 23 was used, which is a rough estimation assuming a constant load over the whole
year. The depth profile sampling was carried out at location 23 because this sampling point
was behind the water dam at Geesthacht and was not influenced by the tides. The total
estimated flux per year for the dissolved and the particulate phase is presented in Table 19. In
the particulate phase the total riverine PFC flux was 152 kg/year, where the greatest
proportions were observed for FOSA, PFOS, PFOSi, and PFOA with 63 kg, 35 kg, 27 kg, and
10 kg per year, respectively. A much higher riverine PFC flux was estimated for the dissolved
phase with a total flux of 802 kg/year. The calculation of the flux of FOSA may be too high,
because the downstream concentrations were lower and it can be degraded to PFOS.
Table 19. Total estimated flux of individual PFCs in the dissolved

Additional studies
97
and particulate phases in the river Elbe towards the North Sea a
Conclusion
In summary, this is the first study to determine PFCs in the particulate phase in surface
water. In addition, PFPS, PFHpS, PFHxSi and 3,7m2-PFOA were determined for the first time
in the dissolved phase in surface water. The PFCs were mostly distributed in the dissolved
phase (~93%), only EtFOSE was exclusively found in the particulate phase. Particles are
subject to sedimentation and can therefore be important for bioavailability to benthic
organisms. Further investigations are necessary to clarify if this leads to adverse effects such
as a reduction of biodiversity. The total riverine PFC flux was 802 kg/year for the dissolved
phase and 152 kg/year for the particulate phase. Discharge from the river Elbe contributed to
a contamination of the North Sea with PFCs. This study found that PFBS and PFBA had other
unknown sources in addition to the river Elbe, making research on the short-chained PFCs
even more important. Further studies should therefore include a separate analysis of the
dissolved and particulate phases. The particle mass and its content of organic matter should be
determined to obtain a better understanding of the exchange processes between the dissolved
and particulate phases, and to calculate partition coefficients between them.
Analytes Total flux/(kg/year) Dissolved phase Particulate phase
PFBS 18 0 PFPSb 21 0 PFHxS 8 0 PFOS 106 35 PFOSi 13 27 PFBA 35 0 PFPA 50 0 PFHxA 88 0 PFHpA 54 0 PFOA 169 10 PFNA 36 3 PFDA 66 5 PFUnDA 0 3 PFDoDA 0 0 3,7m2-PFOA 0 0 FOSA 139 63 EtFOSE 0 6 ∑PFCs 802 152 a The mean concentration of the five water samples collected at 0.5-, 1.0-, 2.0-, 2.5-, and 2.8-m depth at location 23 (for details see text) was used for the calculation; b have to be considered as estimates, because no standard was available for this compound.

Additional studies
98
7.2 PFCs in effluents of waste water treatment plants and surface water
along the river Elbe
In June 2007 one litre water samples were taken midstream at 15 locations of the river
Elbe (1 to 15 in Figure 23) on board of the research vessel Ludwig Prandtl using the water
intake system of the ship (~1 m depth). Water samples were filtered subsequently (> 1.2 µm,
GFFs) on board (detailed information see Table S16 in the in the Supplementary material).
Figure 23. Sampling locations for surface water samples (white dots with numbers) and at the effluents of waste water treatment plants (red dots with letters) along the river Elbe, Germany
Effluent samples from 9 WWTPs along of the river Elbe from Lauenburg to Cuxhaven,
Germany, were taken in May 2007 (A to I in Figure 23). The major WWTP (D) is treating
waste water of about 2.2 million population equivalents (PEs), while the smallest one covers
about 14,000 PEs (detailed information see Table 20).
Table 20. Sampling parameters of the waste water treatment plants
A B C D E F G H I
Population equivalents 25 000 45 000 90 000 2 200 000 650 000 150 000 14 000 20 000 400 000Effluent volume [m³/day] 1 900 6 000 17 000 432 000 72 000 13 200 1 285 1 000 18 000Domestic waste water [%] ~60-70%~60-70% ~100% ~80% ~65-70% ~100% ~100% ~100% ~100%Industrial/commercial waste water [%] ~30-40%~30-40% ~0% ~20% ~30-35% ~0% ~0% ~0% ~0% Dissolved organic carbon [mg/L] 10.9 7.1 8.1 13.7 14.1 17.3 14.5 14.4 14.8 pH 7.0 7.3 6.9 7.4 7.0 7.4 8.0 7.1 7.7 Temperature [°C] 20.6 19.3 19.0 n.a. 18.9 20.1 15.8 16.6 24.7 Sampling date 20/06/07 29/05/07 31/05/07 31/05/07 29/05/07 07/06/07 29/05/07 29/05/07 07/06/07
n.a. = not available.
One litre water samples in duplicate were taken in glass bottles, filtered over 1.2 µm GFFs
before the analysis. The sample analysis is described in publication II.

Additional studies
99
PFC concentrations and compositions in effluents of WWTPs
Overall, 21 substances of 39 analysed compounds were detected in WWTP effluents. The
∑PFC discharge of each WWTP and their composition profiles are shown in Figure 24. The
∑PFC concentrations in WWTP effluents ranged from 30 ng/L (WWTP I) to 266 ng/L
(WWTP B). The composition profile in the WWTP B to D and F to I were relatively similar,
whereas PFCAs were the major group with approximately 70% of the ∑PFC amount. WWTP
A and E had a different composition, where 6:2 FTS and PFOS dominated, respectively. In
6 of the 9 WWTPs the concentrations of the PFSAs were 2-7 times lower than the
concentrations of the PFCAs, in WWTP B they were even lower by a factor of 25.
Conversely, in WWTP A and E the concentrations of PFSAs were about two times higher
than the concentrations of PFCAs. Three potential precursors, FOSA, MeFBSA and
MeFBSE, were found in all WWTPs, whereas FOSA can degrade to PFOS (Rhoads et al.
2008) and the C4 compounds MeFBSA and MeFBSE could possibly degrade to the
C4 homologues of PFCAs and PFSAs (D'eon et al. 2006; Martin et al. 2006).
WWTP C, F, G, H and I were not influenced by industrial sewage water, on the other hand
WWTP A, B, D and E have rather high industrial influences with about 20% to 40%
industrial/commercial waste water. In average, ∑PFC concentrations of these four WWTP
effluents were more than 4 times higher (171 ng/L) than the effluents of WWTPs without
industrial waste water parts (36 ng/L). Thus it is presumed that industrial or commercial waste
water had an influence on the PFC contamination level and profile, according to a previous
study (Sinclair and Kannan 2006). The waste water of a big textile-service company, located
close to WWTP A, might be responsible for the high concentrations of 6:2 FTS and MeFBSA
in the effluent. Whereas a carpet factory located close to WWTP B might be responsible for
the increased PFCA concentrations, because PFCs are used as coatings on textiles and carpets
(Kissa 2001). The mean ∑PFC concentration in WWTP effluents (~99 ng/L) were about
5 times higher, compared to the mean concentrations of river water samples (~19 ng/L).
Therefore, WWTPs are potential sources of PFCs to the marine environment.
PFCs discharges from the WWTPs into the river Elbe were roughly estimated from the
PFC concentration and mean water discharge per day of the effluent and river flow,
respectively (PFCs discharge = PFC concentration * water discharge) (see Figure 24).
Although the effluent of WWTP B had the highest PFC concentration per litre, its
contribution to the environment was rather low (1.6 g/day) due to its low effluent volume.
WWTP D and E had the highest portion of PFC contamination of the river Elbe with 55.6 and
11.6 g/day, respectively. The remaining 6 WWTPs had a combined discharge of 3.8 g/day
into the river Elbe. The total discharges per year were estimated assuming that the

Additional studies
100
concentrations were stable throughout the whole year. The samples were taken in a dry period
with almost no precipitation, so the samples were not influenced by rain water. The total
discharge of ∑PFCs from all nine WWTPs was approximately 26 kg per year based on a
rough estimation, PFOA having the highest percentage (~47%), followed by 6:2 FTS (~20%),
PFOS (~12%) and PFBS (~5.5%). WWTP D and E were responsible for approximately 95%
of the total discharge.
Figure 24. A: Discharge of ∑PFCs in g per day by the waste water treatment plant effluents (note: Logarithmic scale). B: Percentage composition of individual PFCs in the waste water
treatment plant effluents
PFC concentrations and compositions in surface water of the river Elbe
The water samples of the river Elbe showed ∑PFC concentrations ranging from 7.6 ng/L
at the estuary mouth (location 15) to 26.4 ng/L at Hamburg City (location 4). At all
15 sampling locations 17 PFCs were found, ten of them at each location (i.e., PFBS, PFHxS
and PFOS of the PFSAs, C5 to C10 of the PFCAs and FOSA). The PFCAs were the major
group with approximately 70% of the ∑PFC amount. In all samples PFOA was the
predominant substance with concentrations ranging from 2.8 ng/L (location 15) to 9.6 ng/L
(location 6).
In 2003, Caliebe et al. 2004 found PFOS and PFOA concentrations of about 20 ng/L in the

Additional studies
101
river Elbe. In addition, they noticed a decrease of PFOS concentrations by approximately a
factor of 10 from May to July. In 2006, a sampling campaign along the river Elbe resulted in
two times higher PFC concentrations than during this sampling campaign in 2007 (Ahrens et
al. 2009c). In 2006, especially PFOS and FOSA were detected in significantly higher
concentrations (1.3 to 8.3 ng/L and 0.9 to 8.9 ng/L, respectively) than in 2007 (0.5 to 2.9 and
0.1 to 1.0 ng/L, respectively). The sampling campaign in the present study was done during a
dry weather period. The river Elbe estuary stream flow in 2007 (474 m³/s) was only the half
of the mean flow in 2006. One possible explanation for the higher concentration levels in
2006 could be a runoff of PFCs from contaminated soil, as shown for the river Möhne and the
river Ruhr, where PFCs were washed out by precipitation from contaminated soils applied to
agricultural areas (Skutlarek et al. 2006). However, no contaminated soil has been observed
along the river Elbe up to now. A second explanation could be that rain water was
contaminated with PFCs and led directly to an increase PFC concentration in the river Elbe.
Scott et al. 2006a found a total PFCA fluxes between 540 and 12471 ng/m2 in precipitation,
which supported the source there being the precipitation pathway. This could explain the
higher concentrations of PFCAs in 2006 because the samples were taken during a wet weather
period with an estuary stream flow of 916 m³/s. The lower concentration levels of PFOS and
FOSA cannot be explained by the higher amount of rain water, because PFCAs were the
dominating PFCs in precipitation (Taniyasu et al. 2008). The most likely and straightforward
explanation for the low PFOS and FOSA concentrations in 2007 could be the impact of the
new EU directive, which regulates the general use of PFOS and their derivates like FOSA.
Even though the use was not prohibited before July 2008, it might be possible that companies
stopped using PFOS or switched to substitute compounds like the shorter-chained PFBS or
their precursors already before the directive came into effect (D'eon et al. 2006). The reasons
for using shorter-chained substitutes are their lower toxicity and accumulation potential
compared to longer-chained PFCs (Lau et al. 2007).
Conclusion
No significant relationship between ∑PFC concentrations and DOC in WWTPs and in
surface water was found, respectively. A positive relationship between sorption to sediment
and TOC amount was found from Higgins and Luthy 2006, whereas the DOC may have a less
influence on the distribution and concentration level of PFCs in the aquatic environment. The
mass flow of ∑PFC from the effluents of the WWTPs and the surface water along the river
Elbe is shown in Figure 25. Upstream Hamburg City (location 1) the ∑PFC mass flow was
729 g/day, whereas the mass flow increased to 964 g/day (location 4). This increase could be
caused by WWTPs C and D with a combined discharge of 56.3 g/day, which is about 24% of

Additional studies
102
the total increase (235 g/day). The lacking 76% could originate from other point sources like
industrial waste water effluents or diffuse sources from surface runoff, which were not
covered in this study. An increasing ∑PFC mass flow was also observed between locations 5
and 6, whereas ~10% could stem from WWTP E with a discharge of 11.6 g/day. The other
WWTPs showed no influence on the mass flow along the river Elbe. However, the PFC
composition profile in surface water in the river Elbe is relatively similar to the compositions
of WWTP B to D and F to I. These results suggest that the PFC contamination in these
WWTPs and the river Elbe were caused by similar sources, whereas WWTP A and E were
influenced by other sources.
Figure 25. Estimated mass flow of ∑PFCs in g per day in surface water and waste water treatment plant effluents (A to I) along the river Elbe, Germany
Assuming that the concentrations found in this study were constant throughout the whole
year and assuming that the concentrations measured at the surface were representative over
the whole profile of the river, a rough estimation of the PFC mass flow reaching the German
Bight through the river Elbe could be done. The long term mean water discharges of the river
Elbe at the locations 1 and 11 were 752 and 812 m³/s, respectively (personal communication
ARGE Elbe). Using these data the calculation of the annual ∑PFC discharge results in
480 kg/year (location 1) to 540 kg/year (location 11). In further studies chemical substitutes
of PFOS and PFOA should be investigated to see any production shifts to shorter-chained or
less fluorinated PFCs. In addition to WWTPs, further sources are likely to exist which have
not been identified yet. How to reduce the riverine discharge of PFCs into the marine
ecosystem will be an important challenge for the future.

Additional studies
103
7.3 Sources of PFCs in the North Sea, Baltic Sea and Norwegian Sea:
Evidence from their spatial distribution in surface water
Surface water samples were taken at 6 locations in the North Sea/Norwegian Sea
(sampling locations I-VI), 22 locations in the North Sea/German coast (sampling locations
1-22) and 18 locations in the Baltic Sea (sampling locations A-R) in 2007 (Figure 26).
Details of the sampling and the water temperature and salinity are presented in Table S17 in
the Supplementary material. Two litre water samples were collected in brown glass bottles via
the ships’ intake systems at approximately 11 m below the surface. The two litre water
samples were filtered directly after sampling onboard or the following days using GFFs
(> 1.2 µm). The samples were extracted and analysed as described in publication II.
In addition, at 19 sampling locations in the North Sea (i.e., location 1-8, 10, 11 and 13-21)
water samples were collected in ten litre glass bowls at the same water depth as the two litre
water samples. The ten litre water samples were taken from the Federal Maritime and
Hydrographic Agency (BSH), in order to compare the two different sampling and analysis
techniques. The water samples were extracted with an half-automated extraction system
(APOS, Automated Extraction System for Organic Substances) using a 12 mL PP cartridge
filled with 1.7 g glass fibre cotton for the separation of the particles and 1.7 g of Chromabond
HR-P resin (Macherey-Nagel, Düren, Germany) for the enrichment of the target compounds
(for details see Theobald et al. 2007a).
Figure 26. Geographic locations of the water sampling sites in the North Sea, Norwegian Sea and Baltic Sea
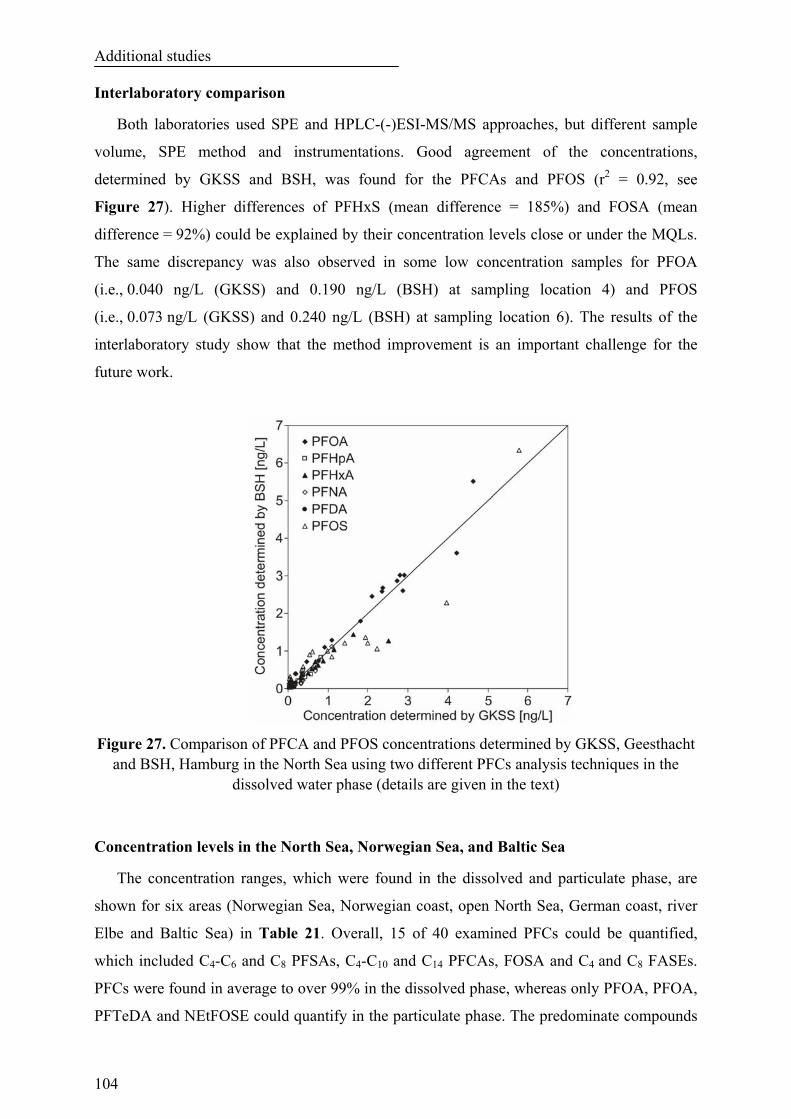
Additional studies
104
Interlaboratory comparison
Both laboratories used SPE and HPLC-(-)ESI-MS/MS approaches, but different sample
volume, SPE method and instrumentations. Good agreement of the concentrations,
determined by GKSS and BSH, was found for the PFCAs and PFOS (r2 = 0.92, see
Figure 27). Higher differences of PFHxS (mean difference = 185%) and FOSA (mean
difference = 92%) could be explained by their concentration levels close or under the MQLs.
The same discrepancy was also observed in some low concentration samples for PFOA
(i.e., 0.040 ng/L (GKSS) and 0.190 ng/L (BSH) at sampling location 4) and PFOS
(i.e., 0.073 ng/L (GKSS) and 0.240 ng/L (BSH) at sampling location 6). The results of the
interlaboratory study show that the method improvement is an important challenge for the
future work.
Figure 27. Comparison of PFCA and PFOS concentrations determined by GKSS, Geesthacht and BSH, Hamburg in the North Sea using two different PFCs analysis techniques in the
dissolved water phase (details are given in the text)
Concentration levels in the North Sea, Norwegian Sea, and Baltic Sea
The concentration ranges, which were found in the dissolved and particulate phase, are
shown for six areas (Norwegian Sea, Norwegian coast, open North Sea, German coast, river
Elbe and Baltic Sea) in Table 21. Overall, 15 of 40 examined PFCs could be quantified,
which included C4-C6 and C8 PFSAs, C4-C10 and C14 PFCAs, FOSA and C4 and C8 FASEs.
PFCs were found in average to over 99% in the dissolved phase, whereas only PFOA, PFOA,
PFTeDA and NEtFOSE could quantify in the particulate phase. The predominate compounds

Additional studies
105
in the dissolved phase were PFOA and PFBS and in the particulate phase PFOS.
Table 21. Concentration range for individual PFCs and ∑PFCs in ng/L (dissolved phase/particulate phases) for the Norwegian Sea, Norwegian coast, open North Sea, German coast, river Elbe and Baltic Sea
Area Norwegian Sea
Norwegiancoast
Open North Sea
German coast River Elbe Baltic Sea
Location number a I-II III-VI 1-3 4-19 20-22 A-R
Concentration (dissolved phase/particulate phase) [ng/L]
PFBA n.d. n.d. n.d. n.d.-4.73/- n.d.-0.40/- n.d.-0.44/- PFPA n.d. n.d. n.d. n.d.-0.38/- 0.37-0.47/- n.d.-0.12/- PFHxA n.d. 0.20-0.31/- n.d. n.d.-1.18/- 1.66-2.56/- 0.12-0.27/- PFHpA n.d. n.d.-0.21/- n.d. n.d.-0.58/- 0.70-0.94/- 0.06-0.26/- PFOA 0.01/- 0.07-0.35/- 0.02-0.07/- 0.08-3.02/- 4.36-4.81/- 0.25-4.55/- PFNA n.d. 0.01-0.04/- 0.04-0.05/- 0.05-0.37/- 0.69-1.16/- 0.10-0.42/- PFDA n.d. n.d. n.d. n.d.-0.17/- 0.24-0.85/- n.d. PFTeDA n.d. -/n.d.-0.18 n.d. n.d. n.d. n.d. PFBS n.d. n.d.-0.09/- n.d.-0.07/- 0.01-6.51/- 3.49-5.27/- 0.26-0.88/- PFPS b n.d. n.d. n.d. n.d.-0.10/- 0.13-0.20/- n.d. PFHxS n.d. n.d.-0.03/- n.d. n.d.-0.28/- 0.32-0.50/- n.d.-0.61/-
PFOS n.d. n.d. n.d.-0.07/- n.d.-2.26/ n.d.-0.16
4.09-6.16/ n.d.-1.07
n.d.-0.35/ n.d.-0.03
FOSA n.d. 0.12-0.28/- n.d.-0.07/- n.d.-0.38/- 0.50-0.78/- n.d.-0.46/- NEtFOSE n.d. n.d. n.d. -/n.d.-0.74 n.d. n.d. MeFBSE n.d. n.d. 0.04-0.43/- n.d.-0.93/- 0.41-0.69/- n.d.
∑PFCs 0.01/- 0.55-1.10/ n.d.-0.18
0.15-0.57/- 0.15-16.15/ n.d.-0.94
19.41-22.08/ n.d.-1.07
0.92-6.24/ n.d.-0.03
n.d. = not detected; a the locations of the numbers can be found in the map displayed in Figure 26; b have to be considered as estimates, because no standard was available for this compound.
Highest ∑PFC concentrations of all sampling stations were found in the river Elbe with
22 ng/L (sampling station 21). Towards the offshore sea the ∑PFC concentration decreased
rapidly by, in average, a factor of ~50 (sampling stations 1 to 3), which indicates a strong
influence of the river on the concentration level at the German coast. This was confirmed with
the high annual discharge for ∑PFCs of 506 kg/year for the dissolved phase and 4 kg/year for
the particulate phase. The annual discharge based on the observed Elbe concentrations and
mean annual discharge of 745 m3/s at sampling station 22 (personal communication ARGE
Elbe), which is a roughly estimation assuming a constant load over the whole year. The river
Elbe flows through a high industrial area, where PFBS, PFOS and PFOA dominated
(sampling stations 20 to 22), which suggests that there may be a specific source of these
compounds in the river Elbe watershed. Conversely to the river Elbe, PFBA was detected at
the German coast and also the concentration of PFBS increased (sampling stations 4-19). This
may be the result of an additional source, where PFBS and PFBA were transported into the

Additional studies
106
North Sea by the westerly current. It is suggested that this contamination was originating from
the river Rhine, where Skutlarek et al. 2006 found a high PFC contamination caused by
contaminated sewage sludge applied to neighbouring agricultural fields. In contrast to the
increasing PFBS and PFBA concentrations, decreased the concentration of PFOS by a factor
of ~5 from the river Elbe towards the North Sea, which may be the result of dilution effects
and/or sedimentation processes. However, it was found that the sorption of PFSAs is by a
factor of 1.7 stronger than of PFCAs (Higgins and Luthy 2006). In the particulate phase only
PFOS, PFOA and NEtFOSA could observed sporadically in low concentration range. Highest
particle-bound concentration could find for PFOS with 0.9 ng/L (4.8% of the ∑PFCs) at
location 21 in the river Elbe, whereas in the North Sea particle-bound PFOS was only
detected at two sampling stations under 0.12 ng/L (<1.3% of the ∑PFCs), these results
confirm the hypothesis that the sediment is a potential sink of PFOS.
∑PFC concentrations along the Norwegian coast ranged from 0.55 to 1.1 ng/L (sampling
stations III to VI), which is by a factor of ~10 times lower than at the German coast (sampling
stations 4 to 19). The low contamination corresponds with the sparse populated Norwegian
coast and therefore it existed less potential sources like from domestic and industrial WWTP
effluents. The dominated PFCs were PFHxA, PFOA and FOSA, whereas PFBA and PFBS
were not detected. The water can further transport to the Arctic region, whereas the PFC
concentration decreased rapidly and only PFOA could detect with 0.01 ng/L (sampling
stations I and II) in the Norwegian Sea. The transport of PFCAs by the water phase is
supposed as the main transportation pathway in the Arctic region, whereas the long range
atmospheric transport was considered as negligible (Prevedouros et al. 2006).
In the Baltic Sea the ∑PFC concentration ranged between 0.92 to 6.24 ng/L and was
therefore by a factor over 3 lower than in coastal water from the German coast (sampling
locations 4 to 19), but much higher in comparison to open North Sea water (0.15 to 0.57 ng/L,
sampling locations 1 to 3). The higher contamination of the Baltic Sea can be explained by
the relatively closed ecosystem, where the water can only flows out into the North Sea
through the Danish strait, and additionally by the influence from over 250 streams, which
drain into the basin from mostly industrial areas. The Baltic Sea is a brackish inland sea,
which may explain the relative uniform distribution of PFCs in contrast to the North Sea,
where no primary contamination source such as fluorochemical production could identify, but
diffuse sources dominated. PFOA and PFBS were the predominated compounds with a
concentration range of 0.16 to 4.5 ng/L and 0.26 to 0.88 ng/L, respectively. Interestingly, a
positive relationship was found between PFBS concentration and the salinity (r2 = 0.74,
Figure 28), which suggest that PFBS originated from the North Sea with their high salinity
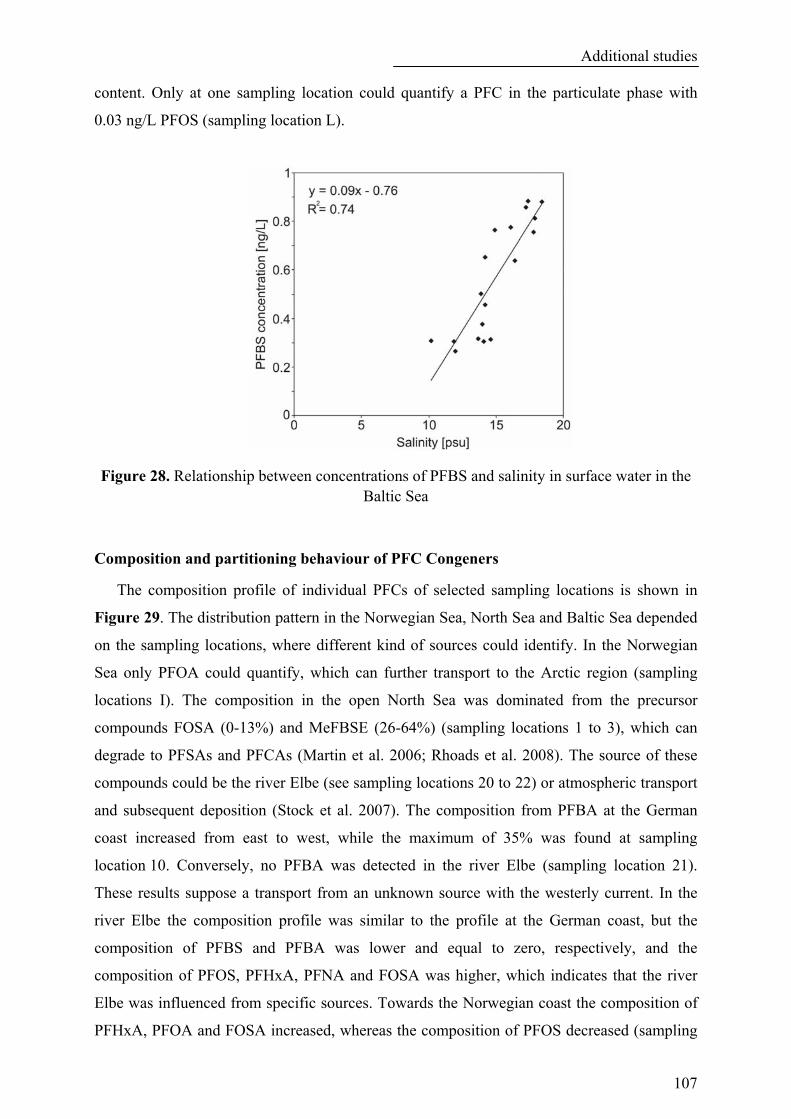
Additional studies
107
content. Only at one sampling location could quantify a PFC in the particulate phase with
0.03 ng/L PFOS (sampling location L).
Figure 28. Relationship between concentrations of PFBS and salinity in surface water in the Baltic Sea
Composition and partitioning behaviour of PFC Congeners
The composition profile of individual PFCs of selected sampling locations is shown in
Figure 29. The distribution pattern in the Norwegian Sea, North Sea and Baltic Sea depended
on the sampling locations, where different kind of sources could identify. In the Norwegian
Sea only PFOA could quantify, which can further transport to the Arctic region (sampling
locations I). The composition in the open North Sea was dominated from the precursor
compounds FOSA (0-13%) and MeFBSE (26-64%) (sampling locations 1 to 3), which can
degrade to PFSAs and PFCAs (Martin et al. 2006; Rhoads et al. 2008). The source of these
compounds could be the river Elbe (see sampling locations 20 to 22) or atmospheric transport
and subsequent deposition (Stock et al. 2007). The composition from PFBA at the German
coast increased from east to west, while the maximum of 35% was found at sampling
location 10. Conversely, no PFBA was detected in the river Elbe (sampling location 21).
These results suppose a transport from an unknown source with the westerly current. In the
river Elbe the composition profile was similar to the profile at the German coast, but the
composition of PFBS and PFBA was lower and equal to zero, respectively, and the
composition of PFOS, PFHxA, PFNA and FOSA was higher, which indicates that the river
Elbe was influenced from specific sources. Towards the Norwegian coast the composition of
PFHxA, PFOA and FOSA increased, whereas the composition of PFOS decreased (sampling
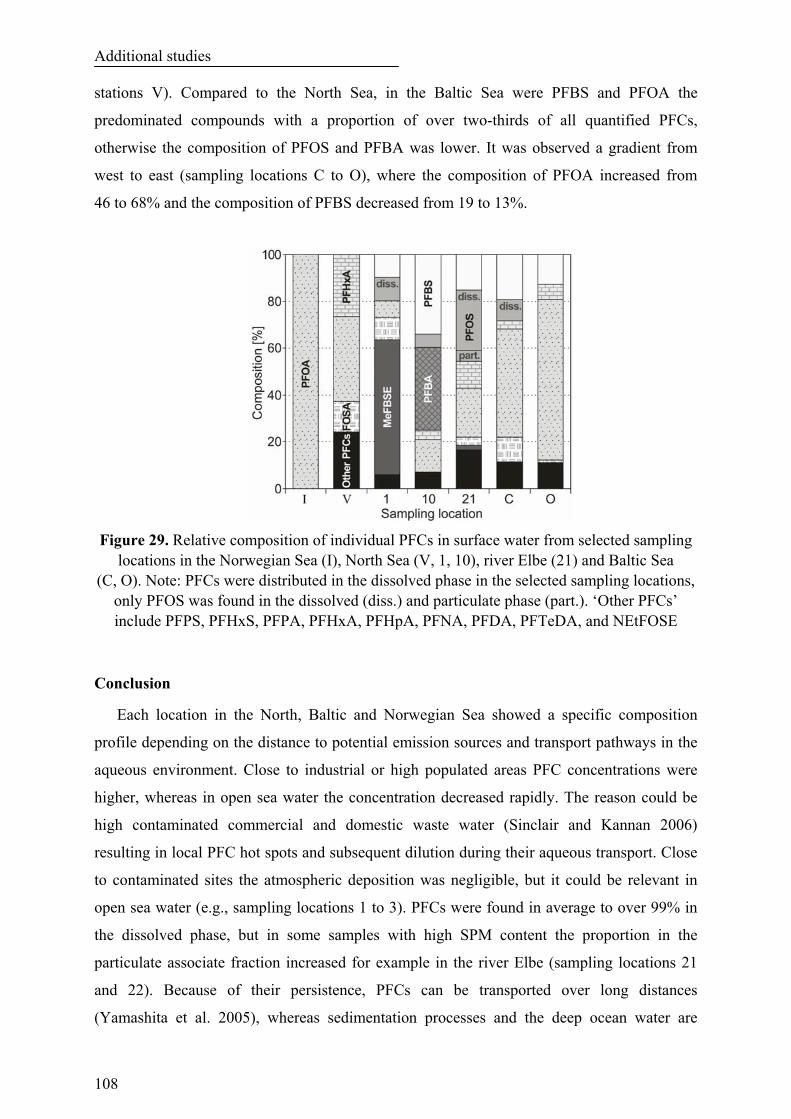
Additional studies
108
stations V). Compared to the North Sea, in the Baltic Sea were PFBS and PFOA the
predominated compounds with a proportion of over two-thirds of all quantified PFCs,
otherwise the composition of PFOS and PFBA was lower. It was observed a gradient from
west to east (sampling locations C to O), where the composition of PFOA increased from
46 to 68% and the composition of PFBS decreased from 19 to 13%.
Figure 29. Relative composition of individual PFCs in surface water from selected sampling locations in the Norwegian Sea (I), North Sea (V, 1, 10), river Elbe (21) and Baltic Sea
(C, O). Note: PFCs were distributed in the dissolved phase in the selected sampling locations, only PFOS was found in the dissolved (diss.) and particulate phase (part.). ‘Other PFCs’ include PFPS, PFHxS, PFPA, PFHxA, PFHpA, PFNA, PFDA, PFTeDA, and NEtFOSE
Conclusion
Each location in the North, Baltic and Norwegian Sea showed a specific composition
profile depending on the distance to potential emission sources and transport pathways in the
aqueous environment. Close to industrial or high populated areas PFC concentrations were
higher, whereas in open sea water the concentration decreased rapidly. The reason could be
high contaminated commercial and domestic waste water (Sinclair and Kannan 2006)
resulting in local PFC hot spots and subsequent dilution during their aqueous transport. Close
to contaminated sites the atmospheric deposition was negligible, but it could be relevant in
open sea water (e.g., sampling locations 1 to 3). PFCs were found in average to over 99% in
the dissolved phase, but in some samples with high SPM content the proportion in the
particulate associate fraction increased for example in the river Elbe (sampling locations 21
and 22). Because of their persistence, PFCs can be transported over long distances
(Yamashita et al. 2005), whereas sedimentation processes and the deep ocean water are

Additional studies
109
possible sinks (Prevedouros et al. 2006). Neutral precursor compounds like FASAs and
FASEs were only detected sporadically, but it is possible that these precursors were already
degraded in WWTPs (Schultz et al. 2006b; Sinclair and Kannan 2006). The occurrence of
high concentrations of PFCs in coastal water could possibly be problematic, because they are
bioavailable and can accumulate in the marine food chain (Martin et al. 2003a). Especially,
the Baltic Sea has an unique flora and fauna, which is adapted to brackish water. Chemical
‘fingerprints’ may help to identify specific sources of PFC contamination into the aqueous
environment.
7.4 Partitioning behaviour of PFCs between pore water and sediment in two
sediment cores from Tokyo Bay
Two sediment cores were collected from Tokyo Bay using an acrylic tube (120 cm long
and 12 cm i.d.) in May 2008 (core A and B, see Figure 30). These cores were sliced at 3-cm
intervals for the first 9 cm for core A (6 cm for core B) and then at 2-cm intervals for up to
79 and 70 cm, respectively, using a clean stainless steel slicer and then stored in PP tubes. The
sampling conditions, including total organic carbon (TOC), total nitrogen (TN), pH, oxygen
reaction potential (ORP), moisture and dry density, are shown in Table S18 and Table S19 in
the Supplementary material.
Figure 30. Map showing the sampling locations A and B in Tokyo Bay, Japan
The sedimentation rate was estimated from the excess 210Pb (dpm) in each layer and the
cumulative weight (g/cm) in core A. The average sedimentation rates of the dry matter were
calculated to be 0.76 g/cm2 per year for the 1958 to 2008 time period, which is approximately
1.5 cm/year for the core sections. The pore water was extracted from the wet sediment within
0 km 10 20
Tokyo Bay
Arakawa
Hanamigawa
Tamagawa
Sumidagawa
B
A

Additional studies
110
72 h by centrifugation at 10,000 rpm for 10 min at a constant temperature of 10 °C
(AvantiTM J-25 Centrifuge, Beckman, USA).
The pore water was then filtered through 0.45 µm nylon syringe filters (Iwaki, Fukushima,
Japan) into a PP bottle and extracted by SPE with Oasis® WAX cartridges as described by
Taniyasu et al. 2005. The sediment was extracted using the method described by Powley et al.
2005 with a few modifications. Briefly, a 5 g sediment sample was weighed into a PP tube;
2 mL of 100 mM sodium hydroxide in 20% Millipore water and 80% methanol was added
and then soaked for 30 min. The extraction was carried out with 20 mL methanol, and 1 ng
absolute IS mix was spiked. The sample was then shaken in a wrist-action shaker at 250 rpm
for 30 min. After shaking, the tube was centrifuged at 3000 rpm for 15 min, and the
supernatant was decanted into another PP tube. The extraction was repeated with 1 mL
100 mM sodium hydroxide in 20% Millipore water and 80% methanol, soaked for 30 min,
and 10 ml methanol, shaken at 250 rpm for 30 min and centrifuged at 3000 rpm for 15 min.
Both extracts were combined and acidulated with 0.1 mL 4 M hydrochloric acid. This extract
was centrifuged again at 3000 rpm for 5 min, and an aliquot of one-eighth (4.15 mL) of the
supernatant was used for the cleanup with Supelclean ENVI-Carb® cartridges (100 mg, 1 mL,
100-400 mesh, Supelco, USA). The conditioning of the cartridges was carried out three times
with 1 ml methanol. Afterwards, the sample extract and three times 1 mL methanol were
added to the cartridge and directly collected in another vial. Finally, the extract was reduced
to 1 mL under a nitrogen stream. Details of the instrumental conditions and quantification for
PFC analysis have been described elsewhere (Taniyasu et al. 2008).
Vertical profiles
In the following, the concentrations in the pore water and dried sediment are expressed in
pg/cm3 to enable a direct comparison of their concentration levels. In this study, 11 PFCs
were found in pore water (i.e., PFHxS, PFOS, 6:2 FTS, N-EtFOSAA, and C4-C10 PFCA). In
contrast to those in the pore water, the PFCs in the dried sediment showed a different vertical
profile. No 6:2 FTS or shorter-chain PFCAs (C ≤ 7) were detected in the sediment, although
PFDS, FOSA and longer-chain PFCAs (C ≥ 11) were. These results correspond with the
findings of that each CF2 moiety increases the distribution coefficient by 0.5 to 0.6 log units
(Higgins and Luthy 2006) and ~0.87 log units (Liu and Lee 2007), respectively. In total
10 PFCs were quantified in the sediment (i.e., PFHxS, PFOS, PFDS, FOSA, N-EtFOSAA,
and C8-C12 and C14 PFCA).
Both cores had a similar vertical profile, with a maximum ∑PFC concentration at depths
of 9-11 and 6-8 cm of 182 pg/cm3 (sediment core A) and 132 pg/cm3 (sediment core B),
respectively (Figure 31). Close to the surface, these ∑PFC concentrations were slightly

Additional studies
111
lower, and, after reaching their maximum, with increasing sampling depth they rapidly
decreased by a factor of 6 to 9. In general, PFHxS, PFOS, FOSA, N-EtFOSAA and, in a
lower proportion, PFUnDA accounted for the highest proportion in the sediment, whilst in the
deeper layers only PFOS was found. FOSA and N-EtFOSAA were found only in the upper
layers (up to 35 cm in depth in core A to 46 cm in depth in core B), whereas the composition
of PFHxS and PFOS increased with increasing depth. Interestingly, the proportion of ∑PFCs
increased in the pore water with increasing sampling depth. In the pore water, PFBA, PFOA
and PFNA dominated in the upper layers, but the composition changed in the deeper layers, in
which, in addition to PFOA, PFHxA became the predominant compound, whereas PFBA was
only predominant in core B.
Figure 31. Vertical profile of PFSAs, FOSA/ N-EtFOSAA and PFCAs in pore water and sediment in pg/cm3 from two sediment cores (A and B) collected from Tokyo Bay
Fluxes and temporal trends
The fluxes were calculated for core A using the dry sediment concentration multiplied by
the density-corrected yearly sedimentation rate. The highest flux was observed for the ∑PFCs,
with 197 pg/cm2 per year in 2001-2002, respectively. Before and after these time periods the
∑PFCs decreased down to 7.1 pg/cm2 per year (1956-1958) and 87.7 pg/cm2 per year
(2006-2008), respectively. The greatest proportion of the flux was attributable to PFOS and

Additional studies
112
EtFOSAA, whereas PFOS was largely responsible for the increasing flux and EtFOSAA for
the reduction of the flux before and after 2001-2002. The calculated flux in sediment core A
was used for a rough estimation of the total flux of PFCs in Tokyo Bay sediments from 1956
to 2008 assuming that the sediment surface amount to 1000 km2. Based on this assumption
the total flux for the 52 year period was estimated to be 28.5 kg total for ∑PFCs in Tokyo Bay
sediments, a partition in 13.6 kg total for PFSAs, 11.6 kg total for FOSA/N-EtFOSAA and
3.2 kg total for PFCAs.
ANOVA tests (SPSS 16.0 for Windows, 2007) were used to determine the statistically
significant differences (significance level α = 0.05) between 1956 and 2008 for each analyte
(Figure 32). Data were natural-logarithm transformed prior to statistical analysis to meet
assumptions of normality and the homogeneity of variances. No significant trend was
observed for PFHxS (p = 0.200), PFDA (p = 0.413) and PFDoDA (p = 0.073), whereas
concentrations of PFOS (p < 0.0001), PFNA (p < 0.0001) and PFUnDA (p < 0.001) increased
from 1956 to 2008, 1990 to 2008 and 1990 to 2008, respectively. Doubling times were
calculated as described elsewhere (Butt et al. 2007b), with 16.1, 4.0 and 5.1 years for PFOS,
PFNA and PFUnDA. In this study, however, the increasing trend of PFOS slowed down
between 2001 and 2008 and possibly reached currently a steady state level. The concentration
of FOSA and N-EtFOSAA increased from 1985 to 2001 with doubling times of 6.3 and
4.5 years, respectively (p = 0.046 and p = 0.002, respectively), but after 2001 the
concentration decreased significantly with half-lives of 13.5 and 2.8 years, respectively
(p = 0.013 and p = 0.002, respectively). This may reflect increased production and emissions
since the 1950s in the Tokyo Bay area and the phased out of POSF-based compounds by 3M
in 2000, of which at least 4 companies in Japan were affected (Paul et al. 2009). Nearly the
same temporal trend was observed for FOSA in melon-headed whales stranded along the
Japanese coast with increasing concentration between 1982 and 2001/2002, and following
decreasing concentration until 2006 (Hart et al. 2008a).
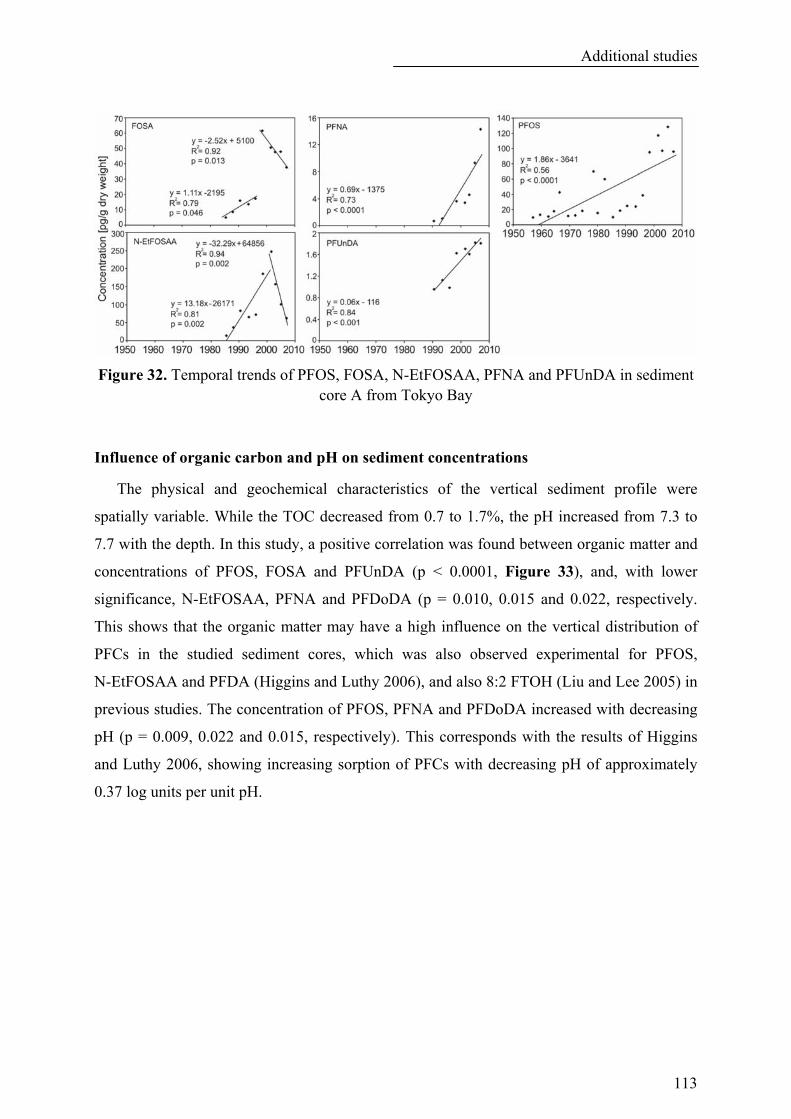
Additional studies
113
Figure 32. Temporal trends of PFOS, FOSA, N-EtFOSAA, PFNA and PFUnDA in sediment core A from Tokyo Bay
Influence of organic carbon and pH on sediment concentrations
The physical and geochemical characteristics of the vertical sediment profile were
spatially variable. While the TOC decreased from 0.7 to 1.7%, the pH increased from 7.3 to
7.7 with the depth. In this study, a positive correlation was found between organic matter and
concentrations of PFOS, FOSA and PFUnDA (p < 0.0001, Figure 33), and, with lower
significance, N-EtFOSAA, PFNA and PFDoDA (p = 0.010, 0.015 and 0.022, respectively.
This shows that the organic matter may have a high influence on the vertical distribution of
PFCs in the studied sediment cores, which was also observed experimental for PFOS,
N-EtFOSAA and PFDA (Higgins and Luthy 2006), and also 8:2 FTOH (Liu and Lee 2005) in
previous studies. The concentration of PFOS, PFNA and PFDoDA increased with decreasing
pH (p = 0.009, 0.022 and 0.015, respectively). This corresponds with the results of Higgins
and Luthy 2006, showing increasing sorption of PFCs with decreasing pH of approximately
0.37 log units per unit pH.

Additional studies
114
Figure 33. Dependence of PFOS, FOSA and PFUnDA concentrations in sediment on sediment fraction organic carbon (fOC)
Conclusion
The study showed the partition behaviour of PFCs between pore water and sediment in
two sediment cores. Pore water concentrations of PFCs were determined for the first time.
PFSAs, N-EtFOSAA and FOSA seemed to bind more strongly to sediment than PFCAs,
whereas only the shorter-chain PFCAs (C ≤ 7) could be found exclusively in the pore water.
These results corroborate the laboratory findings of Higgins and Luthy 2006 and thus show
that perfluorocarbon chain length and functional group both influence partitioning behaviour
of PFCs in the real environment. In addition, an increasing sorption was found with increasing
organic matter and decreasing pH, which correspond with experimental data (Higgins and
Luthy 2006; Liu and Lee 2007). However, other factors like geochemical parameters
(e.g., metal cations, etc.) (Higgins and Luthy 2006) or benthic organisms (e.g., degradation,
bioturbated mixing, etc.) could have an influence on the partitioning behaviour of PFCs in
sediment. The presence of longer-chain PFCAs (C ≥ 8), PFSAs, FOSA and N-EtFOSAA in
the sediment suggest a their bioavailability to benthic organisms (Higgins et al. 2007) and that
the aquatic sediment act as a sink for these compounds. Future work could link the pore water
and sediment concentrations of PFCs to bioconcentration factors, uptake routes and possible
adverse effects. The temporal trend data presented here provide a basis for future trend studies
of PFCs in sediment cores.
Summary and outlook
115
8. Summary and outlook
In this study the determination of PFCs in surface water and different biological matrices
was developed. The water samples were filtrated and the dissolved and particulate phases
were extracted separately using SPE with Oasis® WAX or Strata® XAW cartridges for the
dissolved phase and sonication with methanol for the particulate phase (see publication I;
Ahrens et al. 2009c). The biota samples were extracted using sonication with acetonitrile and
subsequent clean-up using ENVI-Carb® cartridges (see publication III). All samples were
analysed simultaneously for 40 target compounds plus 20 IS using HPLC/(-)ESI-MS/MS. The
target compounds include 16 PFCAs, 7 PFSAs, 3 PFSiAs, 3 FTCAs, 3 FTUCAs, 4 FASAs,
3 FASEs and 6:2 FTS. In most studies, the concentrations of PFOS and PFOA were only
reported, whereas in this study, over 20 PFCs could detect in the surface water and biota,
respectively. In the dissolved phase in water dominated the short-chained PFCAs (C4-C10),
PFBS, PFOS, PFOSi and FOSA, while in the particulate phases in water and in biota
dominated the longer-chained PFCAs (C8-C15), PFSAs, PFOSi and FOSA. However, several
of the detected compounds were found for the first time in surface water and biota.
The optimised analytical protocol for the analysis of PFCs in biota was integrated in the
report of the MCWG for the International Council for the Exploration of the Sea (ICES)
(ICES 2008). Furthermore, an interlaboratory comparison of the sampling techniques and
analysis was conducted between the GKSS and BSH for water samples in the North Sea (see
chapter 7.3). Both laboratories used SPE and HPLC-(-)ESI-MS/MS approaches, but different
sample volume, SPE method and instrumentations. Overall, the results indicate a good
agreement of the concentrations determined by the GKSS and BSH. In addition, the accuracy,
precision, robustness and matrix effects of the analysis of PFCs in water and biota samples
was verified in an interlaboratory method evaluation study (Van Leeuwen et al. 2009). In total
21 North American and European laboratories attended the interlaboratory study. The within
laboratory precision of individual laboratories was good with 12% for water samples and
6.8% for fish tissue for all PFCs. These results improved considerably in comparison to an
previous interlaboratory study (Van Leeuwen et al. 2006). The using of well-defined native
and IS for quantification and the minimisation of matrix effects by an effective clean-up were
identified as the most important steps for a good analytical performance. However, the
method improvement is an important challenge for the future work.
A variety of laboratory products contain fluoropolymers such as PTFE, which can
contaminate the samples during the sampling, sample preparation, and instrumental analysis.
The sources of contamination were identified and eliminated which made it possible to detect

Summary and outlook
116
low pg/L levels in oceans waters and pg/g ww levels in biota samples. But instrumental signal
suppression was observed for some compounds depending on the extraction volume for the
water samples and the tissue-type for the biota samples. It is recommended for future studies
to optimise further the extraction method, to use additional clean-up steps and/or, if possible,
to reduce the sample volume. However, 20 IS were used for correction of matrix effects and
possible losses during the sample preparation.
A water volume of 1-5 L was used for SPE in this study. For further studies at low
contaminated sampling sites (e.g., Arctic, Antarctica, etc.) it could be useful to enrich a higher
volume of water on SPE cartridges to reduce the MDL. On the other hand, for higher
contaminated water samples (e.g., WWTP effluents, landfill sites, river water, etc.) a large-
volume injection for the direct analysis of PFCs using HPLC/(-)ESI-MS/MS could be useful
for routine analysis.
The riverine transportation of PFCs into the German Bight was investigated (see
chapter 7.1 and 7.2). The municipal WWTP effluents had only a low influence on the mass
flow along the river Elbe. Further investigations are necessary to identify the origin of the
contamination like diffuse sources from runoff into the river or other point sources like
landfill effluents and/or industrial WWTPs. Furthermore, for a mass balance, besides the
sources, additionally the sinks (e.g., sediment, biota) should be investigated. In addition, a
monitoring over a longer period using a flow-proportional composite sampler would be useful
to determine temporal trends or seasonal changes. Ultimately, the particle mass and its
content of organic matter should be determined to obtain a better understanding of the
exchange processes between the dissolved and particulate phase, and to calculate partition
coefficients between them.
The occurrence and distribution pattern of PFCs was investigated in the German Bight to
identify potential sources in the sampling area (see publication I). The rivers Elbe, Weser and
Ems had a high influence on the distribution of individual PFCs in the German Bight, with
maximum PFC concentrations found in their estuaries, and decreasing concentrations with
increasing distance from the coast. The compounds PFBS and PFBA are not originated from
the rivers Elbe, Weser and Ems, but the river Rheine might be the source for the
contamination of these compounds in the German Bight. However, chemical ‘fingerprints’
may help to identify specific sources of PFC contamination into the aqueous environment.
Further studies on the spatial distribution of PFCs in coastal area are necessary to understand
the transportation mechanism and fate of PFCs in the marine environment.
The distribution of PFCs in surface water in the Atlantic Ocean was investigated along the
longitudinal gradient from Las Palmas (Spain) to St. Johns (Canada) (15° W to 52° W) and

Summary and outlook
117
the latitudinal gradient from the Bay of Biscay to the South Atlantic Ocean (46° N to 26° S)
(see publication II). The increasing and decreasing concentration gradients of PFCs in the
Atlantic Ocean can be explained by the pattern of ocean water currents, in which industrial
areas are considered as a source for PFCs, and ocean waters and the atmosphere are important
as sinks and for transportation of these compounds. These data of the spatial distribution of
PFCs in ocean waters are very useful for global transportation models (Wania and Mackay
1995). In this study, only at one station were collected deep water samples. It was
hypothesised that PFCs could be transported globally with the thermohaline circulation
system (Yamashita et al. 2008), further investigations on the vertical concentration profile of
PFCs are necessary to support this assumption. In addition, further studies on the distribution
of PFCs in the surface microlayer (50 µL thickness) and subsurface water (> 30 cm depth) (Ju
et al. 2008) are necessary to understand the importance of the seaspray-mediated transport
(McMurdo et al. 2008). Overall, further investigations of the biochemical cycle of PFCs in
ocean waters are necessary for understanding of the transportation and fate of individual PFCs
in the marine environment.
In previous studies the concentration in liver tissue and plasma are often used to estimate
whole body burden in animals. In this study, the distribution of PFCs in harbor seals for a
wide range of biological matrices (i.e., liver, kidney, lung, heart, blood, brain, muscle,
thyroid, thymus, and blubber) was investigated (see publication III). This provides advice on
the analysis of the whole body burden in harbor seals for individual PFCs, which is relevant
for calculation of the bioaccumulation potential of these compounds in marine mammals.
Blood and liver contributed three-fourths of the whole body burden for PFCs in harbour seals.
It is recommended for monitoring of PFCs in marine mammals to collect liver or blood
samples, because there were found an effectively accumulation in these tissues. However, it is
suggested that the distribution of individual PFCs depends on the species, which make further
studies on the tissue distribution and whole body burden in other organisms necessary.
Furthermore, the bioaccumulation potential could be studied by the determination of PFCs
along the marine food web (e.g., zooplankton, benthic organisms, fish, etc.).
Higher concentrations were found in younger harbor seals (<7 month old) in comparison
to older harbor seals (≥ 7 month old) for several PFCs suggesting transplacental transfer of
PFC contaminants to the foetus and/or consumption of different contaminated food (see
publication IV). However, information on the influence of the age on the PFC concentrations
in marine mammals is very sparse. The harbor seals had a relatively high whole body burden
for PFCs, but no significant correlation between PFC concentration levels and health status
was found. But, physiological changes were observed in Baikal seals (Ishibashi et al. 2008b)

Summary and outlook
118
which required further studies in order to evaluate association between PFCs and pathological
conditions.
Significant declining concentrations of C5-C7 PFSAs, PFOSi, FOSA and PFOA were
observed in archived harbor seal livers from the German Bight over the last decade (see
publication IV). The reason could be, probably, that this is the effect of the phase-out of
POSF by the 3M Company, the reduction of PFOA emissions by the stewardship program
from the U.S. EPA and replacement of PFOS and their derivates by less bioaccumulative
compounds because of the formed directive from the EU (Prevedouros et al. 2006; European
Parliament and Concil 2006; U.S. EPA 2006). But the high concentrations of PFOS and
constant levels of C9-C13 PFCAs indicates that further work on the reduction of environmental
emissions of PFCs are necessary. In addition, it is suggested that in biota exist a high
contribution of unidentified PFCs (Miyake et al. 2007b) which needs a non-target analysis to
identify and quantify these compounds. Ultimately, this study highlights the importance of
further monitoring studies in seals and other marine mammals from highly populated sites in
order to evaluate changes in pattern and long-term perspective trends.

Bibliography
119
9. Bibliography
3M, 2000. Phase-out plan for POSF-based products; U.S. EPA Docket ID OPPT-2002-0043.
Ahrens L, Barber JL, Xie Z, Ebinghaus R, 2009a. Longitudinal and latitudinal distribution of perfluoroalkyl compounds in the surface water of the Atlantic Ocean. Environ. Sci. Technol. 43, 3122-3127.
Ahrens L, Felizeter S, Ebinghaus R, 2009b. Spatial distribution of polyfluoroalkyl compounds in seawater of the German Bight. Chemosphere 76, 179-184.
Ahrens L, Gerwinski W, Theobald N, Ebinghaus R. Sources of polyfluoroalkyl compounds in the North Sea, Baltic Sea and Norwegian Sea: Evidence from their spatial distribution in surface water. Marine Poll. Bull. submitted.
Ahrens L, Plassmann M, Xie Z, Ebinghaus R, 2009c. Determination of polyfluoroalkyl compounds in water and suspended particulate matter in the River Elbe and North Sea, Germany. Front. Environ. Sci. Engin. China. 3, 152-170.
Ahrens L, Siebert U, Ebinghaus R, 2009d. Temporal trends of polyfluoroalkyl compounds in harbor seals (Phoca vitulina) from the German Bight, 1999-2008. Chemosphere 76, 151-158.
Ahrens L, Siebert U, Ebinghaus R, 2009e. Total body burden and tissue distribution of polyfluorinated compounds in harbor seals (Phoca vitulina) from the German Bight. Marine Poll. Bull. 58, 520-525.
Ahrens L, Felizeter S, Sturm R, Xie Z, Ebinghaus R, 2009f. Polyfluorinated compounds in effluents of waste water treatment plants and surface water along the River Elbe, Germany. Marine Poll. Bull. 58, 1326-1333.
Ahrens L, Yamashita N, Yeung LWY, Taniyasu S, Horii Y, Lam PKS, Ebinghaus R, 2009g. Partitioning behaviour of per- and polyfluoroalkyl compounds between pore water and sediment in two sediment cores from Tokyo Bay, Japan. Environ. Sci. Technol. in press.
Austin ME, Kasturi BS, Barber M, Kannan K, Mohan Kumar PS, Mohan Kumar SMJ, 2003. Neuroendocrine effects of perfluorooctane sulfonate in rats. Environ. Health Perspect. 111, 1485-1489.
Barber JL, Berger U, Chaemfa C, Huber S, Jahnke A, Temme C, Jones KC, 2007. Analysis of per- and polyfluorinated alkyl substances in air samples from Northwest Europe. J. Environ. Monit. 9, 530–541.
Becker AM, Gerstmann S, Frank H, 2008a. Perfluorooctane surfactants in waste waters, the major source of river pollution. Chemosphere 72, 115–121.
Becker AM, Gerstmann S, Frank H, 2008b. Perfluorooctanoic acid and perfluorooctane sulfonate in the sediment of the Roter Main river, Bayreuth, Germany. Environ. Poll. 156, 818–820.
Belisle J, Hagen DF, 1980. A method for the determination of perfluorooctanoic acid in blood and other biological samples. Anal. Chem. 101, 369-376.

Bibliography
120
Berger U, Haukas M, 2005. Validation of a screening method based on liquid chromatography coupled to high-resolution mass spectrometry for analysis of perfluoroalkylated substances in biota. J. Chromatogr. A 1081, 210-217.
Berger U, Langlois I, Oehme M, Kallenborn R, 2004. Comparison of three types of mass spectrometer for high-performance liquid chromatography/ mass spectrometry analysis of perfluoroalkylated substances and fluorotelomer alcohols. Eur. J. Mass. Spectrom. 10, 579-588.
Berthiaume J, Wallace KB, 2002. Perfluorooctanoate, perflourooctanesulfonate, and N-ethyl perfluorooctanesulfonamido ethanol; peroxisome proliferation and mitochondrial biogenesis. Toxicol. Lett. 129, 23–32.
Betts KS, 2003. Potential explanation for fluorinated compounds persistence. Environ. Sci. Technol., A-Pages 37, 312A-313A.
Biegel LB, Hurtt ME, Frame SR, O'Connor JC, Cook JC, 2001. Mechanisms of extrahepatic tumor induction by peroxisome proliferators in male CD rats. Toxicol. Sci. 60, 44-55.
Bininda-Emonds ORP, 2000. Pinniped brain sizes. Mar. Mamm. Sci. 16, 469-481.
Bossi R, Riget FF, Dietz R, 2005a. Temporal and spatial trends of perfluorinated compounds in ringed seal (Phoca hispida) from Greenland. Environ. Sci. Technol. 39, 7416-7422.
Bossi R, Riget FF, Dietz R, Sonne C, Fauser P, Dam M, Vorkamp K, 2005b. Preliminary screening of perfluorooctane sulfonate (PFOS) and other fluorochemicals in fish, birds and marine mammals from Greenland and the Faroe Islands. Environ. Poll. 136, 323-329.
Bossi R, Strand J, Sortkjaer O, Larson MM, 2008. Perfluorinated compounds in Danish wastewater treatment plants and aquatic environments. Environ. Intern. 34, 443-450.
Boudreau TM, Wilson CJ, Chwong WJ, Sibley PK, A. MS, Muir DCG, Solomon K, 2003. Response of the zooplankton community and environmental fate of perfluorooctane sulfonic acid in aquatic microcosms. Environ. Toxicol. Chem. 22, 2739-2745.
Boulanger B, Peck AM, Schnoor JL, Hornbuckle KC, 2005a. Mass budget of perfluorooctane surfactants in Lake Ontario. Environ. Sci. Technol. 39, 74-79.
Boulanger B, Vargo J, Schnoor JL, Hornbuckle K, 2005b. Evaluation of perfluorooctane surfactants in a wastewater treatment system and in a commercial surface protection product. Environ. Sci. Technol. 39, 5524-5530.
Boulanger B, Vargo J, Schnoor JL, Hornbuckle KC, 2004. Detection of perfluorooctane surfactants in Great Lakes water. Environ. Sci. Technol. 38, 4064-4070.
Braune BM, Outridge PM, Fisk AT, Muir DC, Helm PA, Hobbs K, Hoekstra PF, Kuzyk ZA, Kwan M, Letcher RJ, Lockhart WL, Norstrom RJ, Stern GA, Stirling I, 2005. Persistent oranic pollutants and mercury in marine biota oft the Canadian Arctic: an overview of spatial and temporal trends. Sci. Total Environ. 351, 4-56.
Brooke D, Footitt A, Nwaogu TA, 2004. Environmental risk evaluation report: perfluorooctanesulfonate (PFOS). Environmental Agency, 1-46.
Burns JM, Costa DP, Frost K, Harvey JT, 2005. Development of body oxygen stores in Harbor seals: effects of age, mass, and body composition. Physiol. Biochem. Zool. 78, 1057-1068.
Burris JM, Lundberg JK, Olsen GW, Simpson CA, Mandel J, 2002. Interim Report No. 2.

Bibliography
121
Determination of Serum Half-Lives of Several Fluorochemicals. 3M Company, St. Paul, MN. U.S. EPA Public docket AR 226-1086.
Butenhoff JL, Costa G, Elcombe C, Farrar D, Hansen K, Iwai H, Jung R, Kennedy G, Lieden P, Olsen GW, Thomford P, 2002. Toxicity of ammonium perfluorooctanoate in mal cynomolgus monkeys after oral dosis for 6 month. Toxicol. Sci. 69, 244-257.
Butt C, Mabury SA, Muir DC, Braune BM, 2007a. Prevalence of long-chained perfluorinated carboxylates in seabirds from the Canadian Arctic between 1975 and 2004. Environ. Sci. Technol. 41, 3521-3528.
Butt C, Muir DC, Stirling I, Kwan M, Mabury SA, 2007b. Rapid response of Arctic ringed seals to changes in perfluoroalkyl production. Environ. Sci. Technol. 41, 42-49.
Calafat AM, Kuklenyik Z, Caudill SP, Reidy JA, Needham LL, 2006. Perfluorochemicals in pooled serum samples from United States residents in 2001 and 2002. Environ. Sci. Technol. 40, 2128-2134.
Calafat AM, Kuklenyik Z, Reidy JA, Caudill SP, Tully JL, Needham LL, 2007. Serum concentrations of 11 polyfluoroalkyl compounds in the U.S. population: data from the National Health and Nutrition Examination Survey (NHANES) 1999-2000. Environ. Sci. Technol. 41, 2237-2242.
Caliebe C, Gerwinski W, Hühnerfuss H, Theobald N, 2004. Occurrence of perfluorinates organic acids in the water of the North Sea. Organohalogen Comp. 66, 4074-4078.
Conder JM, Hoke RA, de Wolf W, Russell MH, Buck RC, 2008. Are PFCAs bioaccumulative? A critical review and comparison with regulatory criteria and persistent lipophilic compounds. Environ. Sci. Technol. 42, 995-1003.
Corsolini S, Guerranti S, Perra G, Focardi S, 2008. Polybrominated diphenyl ethers, perfluorinated compounds and chlorinated pesticides in swordfish (Xiphias gladius) from the Mediterranean Sea. Environ. Sci. Technol. 42, 4344-4349.
Cunha I, Hoff P, Van de Vijver K, Guilhermino L, Esmans E, De Coen W, 2005. Baseline study of perfluorooctane sulfonate occurrence in mussels, Mytilus galloprovincialis, from north-central Portuguese estuaries. Marin Poll. Bull. 50, 1128-1132.
D'eon JC, Hurley MD, Wallington TJ, Mabury SA, 2006. Atmospheric chemistry of n-methyl perfluorobutane sulfonamidoethanol, C4F9SO2N(CH3)CH2CH2OH: Kinetics and mechanism of reaction with OH. Environ. Sci. Technol. 40, 1862-1868.
D'eon JC, Mabury SA, 2007. Production of perfluorinated carboxylic acids (PFCAs) from the biotransformation of polyfluoroalkyl phosphate surfactants (PAPS): exploring routes of human contamination. Environ. Sci. Technol. 41, 4799-4805.
Dai J, Li M, Jin Y, Saito N, Xu M, Wei F, 2006. Perfluorooctanesulfonate and perfluorooctanoate in red panda and giant panda from China. Environ. Sci. Technol. 40, 5647-5652.
De Silva AO, Mabury SA, 2006. Isomer distribution of perfluorocarboxylates in human blood: potential correlation to source. Environ. Sci. Technol. 40, 2903-2909.
Del Gobbo L, Tittlemier S, Diamond M, Pepper K, Tague B, Yeudall F, Vanderlinden L, 2008. Cooking decreases observed perfluorinated compound concentrations in fish. J. Agric. Food Chem. 56, 7551-7559.
Bibliography
122
Dietz R, Bossi R, Riget FF, Sonne C, Born EW, 2008. Increasing perfluoroalkyl contaminants in East Greenland polar bears (Ursus maritimus): a new toxic threat to the Arctic bears. Environ. Sci. Technol. 42, 2701-2707.
Dinglasan-Panlilio MJA, Mabury SA, 2006. Significant residual fluorinated alcohols present in various fluorinated materials. Environ. Sci. Technol. 40, 1447-1453.
Dorneles PR, Lailson-Brito J, Azevedo AF, Meyer J, Vidal LG, Fragoso AB, Torres JP, Malm O, Blust R, Das K, 2008. High accumulation of perfluorooctane sulfonate (PFOS) in marine tucuxi dolphins (Sotalia guianensis) from the Brazilian coast. Environ. Sci. Technol. 42, 5368-5373.
Dreyer A, Ebinghaus R, 2009. Polyfluorinated compounds in ambient air from ship- and land-based measurements in northern Germany. Atmos. Environ. 43, 1527–1535.
Dreyer A, Temme C, Sturm R, Ebinghaus R, 2008. Optimized method avoiding solvent-induced response enhancement in the analysis of volatile and semi-volatile polyfluorinated alkylated compounds using gas chromatography–mass spectrometry. J. Chromatogr. A 1178, 199–205.
Ellis DA, Martin JW, Mabury SA, De Silva AO, Hurley MD, Sulbaek Anderson MD, Wallington TJ, 2004. Degradation of fluorotelomer alcohols: a likely atmospheric source of perfluorinated carboxylic acids. Environ. Sci. Technol. 38, 3316-3321.
Ellis DA, Martin JW, Mabury SA, Hurley MD, Sulbaek Anderson MD, Wallington TJ, 2003. Atmospheric lifetime of fluorotelomer alcohols. Environ. Sci. Technol. 37, 3816-3820.
Ellis DA, Martin JW, Muir DCG, Mabury SA, 2000. Development of an 19F NMR method for the analysis of fluorinated acids in environmental water samples. Anal. Chem. 72, 726-731.
Ericson I, Martí-Cid R, Nadal M, Van Bavel B, Lindström G, Domingo JL, 2008. Human exposure to perfluorinated chemicals through the diet: intake of perfluorinated compounds in foods from the Catalan (Spain) market. J. Agric. Food Chem. 56, 1787-1794.
Falandysz J, Taniyasu S, Gulkowska A, Yamashita N, Schulte-Oehlmann U, 2006. Is fish a major source of fluorinated surfactants and repellents in humans living on the Baltic coast? Environ. Sci. Technol. 40, 748-751.
Flaherty JM, Connoly PD, Decker ER, Kennedy SM, Ellefson ME, Reagen WK, Szostek B, 2005. Quantitative determination of perfluorooctanoic acid in serum and plasma by liquid chromatography tandem mass spectrometry. J. Chromatogr. B 819, 329-338.
Frank H, Christoph EH, Holm-Hansen O, Bullister JL, 2002. Trifluoroacetate in ocean waters. Environ. Sci. Technol. 36, 12-15.
Fromme H, Midasch O, Twardella D, Angerer J, Boehmer S, Liebl B, 2007a. Occurrence of perfluorinated substances in an adult German population in southern Bavaria. Int. Arch. Occup. Environ. Health 80, 313-319.
Fromme H, Schlummer M, Möller A, Gruber L, Wolz G, Ungewiss J, Böhmer S, Dekant W, Mayer R, Liebl B, Twardella D, 2007b. Exposure of an adult population to perfluorinated substances using duplicate diet portions and biomonitoring data. Environ. Sci. Technol. 41, 7928-7933.
Furdui VI, Helm PA, Crozier PW, Lucaciu C, Reiner EJ, Marvin CH, Whittle DM, Mabury SA, Tomy GT, 2008. Temporal trends of perfluoroalkyl compounds with isomer analysis in lake trout from Lake Ontario (1979-2004). Environ. Sci. Technol. 42,

Bibliography
123
4739-4744.
Furdui VI, Stock NL, Ellis DA, Butt CM, Whittle DM, Crozier PW, Reiner EJ, Muir DC, Mabury SA, 2007. Spatial distribution of perfluoroalkyl contaminants in lake trout from the Great Lakes. Environ. Sci. Technol. 41, 1554-1559.
Giesy JP, Kannan K, 2001. Global distribution of perfluorooctane sulfonate in wildlife. Environ. Sci. Technol. 35, 1339-1342.
Giesy JP, Kannan K, 2002. Perfluorochemical surfactants in the environment. These bioaccumulative compounds occur globally, warranting further study. Environ. Sci. Technol. 36, 146A-152A.
Goecke-Flora CM, Reo NV, 1996. Influence of carbon chain length on the hepatic effects of perfluorinated fatty acids. A 19F- and 31P-NMR investigation. Chem. Res. Toxicol. 9, 689-695.
González-Barreiro C, Martínez-Carballo E, Sitka A, Scharf S, Gans O, 2006. Method optimization for determination of selected perfluorinated alkylated substances in water samples. Anal. Bioanal. Chem. 386, 2123-2132.
Gulkowska A, Jiang Q, So MK, Taniyasu S, Yamashita N, 2006. Persistent perfluorinated acids in seafood collected from two cities of China. Environ. Sci. Technol. 40 3736-3741.
Guruge K, Taniyasu S, Yamashita N, Manage PM, 2007. Occurrence of perfluorinated acids and fluorotelomers in water from Sri Lanka. Marine Poll. Bull. 54, 1663-1672.
Guruge KS, Yeung LWY, Yamanaka N, Miyazaki S, Lam PKS, Giesy JP, Jones PD, Yamashita N, 2006. Gene expression profiles in rat liver treated with perfluorooctanoic acid (PFOA). Toxicol. Sci. 89, 93-107.
Han X, Snow TA, Kemper RA, Jepson GW, 2003. Binding of perfluorooctanoic acid to rat and human plasma proteins. Chem. Res. Toxicol. 16, 775-781.
Hansen KJ, Clemen LA, Ellefson ME, Johnson HO, 2001. Compound-specific, quantitative characterization of organic fluorochemicals in biological matrices. Environ. Sci. Technol. 35, 766-770.
Hansen KJ, Johnson HO, Eldridge JS, Butenhoff JL, Dick LA, 2002. Quantitative characterization of trace levels of PFOS and PFOA in the Tennessee River. Environ. Sci. Technol. 36, 1681-1685.
Harada K, Koizumi A, Saito N, Inoue K, Yoshinaga T, Date C, al. e, 2007. Historical and geographical aspects of the increasing perfluorooctanoate and perfluorooctane sulfonate contamination in human serum in Japan. Chemosphere 66, 293-301.
Harada K, Saito N, Inoue K, Yoshinaga T, Watanabe T, Sasaki S, Kamiyama S, Koizumi A, 2004. The influence of time, sex and geographic factors on levels of perfluorooctane sulfonate and perfluorooctanoate in human serum over the last 25 years. J. Occup. Health 46, 141-147.
Harada K, Saito N, Sasaki K, Inoue K, Koizumi A, 2003. Perfluorooctane sulfonate contamination of drinking water in the Tama River, Japan: estimated effects on resident serum levels. Bull. Environ. Contam. Toxicol. 71, 31–36.
Hart K, Kannan K, Isobe T, Takashani S, Yamada T, Miyazaki A, Tanabe S, 2008a. Time trends and transplacental transfer of perfluorinated compounds in melon-headed

Bibliography
124
whales strandes along the Japanese coast in 1982, 2001/2002, and 2006. Environ. Sci. Technol. 403, 215-221.
Hart K, Kannan K, Tao L, Takashani S, Tanabe S, 2008b. Skipjack tuna as a bioindicator of contamination by perfluorinated compounds in the oceans. Sci. Total Environ. 403, 215-228.
Haug LS, Thomsen C, Becher G, 2009. Time trends and the influence of age and gender on serum concentrations of perfluorinated compounds in archived human samples. Environ. Sci. Technol. 43, 2131–2136.
Haukas M, Berger U, Hop H, Gulliksen B, Gabrielsen GW, 2007. Bioaccumulation of per- and polyfluorinated alkyl substances (PFAS) in selected species from the Barents Sea food web. Environ. Poll. 148, 360-371.
Hekster FM, Laane RWPM, De Voogt P, 2003. Environment and toxicity effects of perfluoroalkylated substances. Rev. Environ. Contam. Toxicol. 179, 99-121.
Henderson WM, Weber EJ, Duirk SE, Washington JW, Smith MA, 2007. Quantification of fluorotelomer-based chemicals in mammalian matrices by monitoring perfluoroalkyl chain fragments with GC/MS. J. Chromatogr. B 846, 155-161.
Higgins CP, Field JA, Criddle CS, Luthy RG, 2005. Quantitative determination of perfluorochemicals in sediments and domestic sludge. Environ. Sci. Technol. 39, 3946-3956.
Higgins CP, Luthy RG, 2006. Sorption of perfluorinated surfactants on sediment. Environ. Sci. Technol. 40, 7251-7256.
Higgins CP, McLeod PB, MacManus-Spencer LA, Luthy RG, 2007. Bioaccumulation of perfluorochemicals in sediments by the aquatic oligochaete Lumbriculus variegatus. Environ. Sci. Technol. 41, 4600-4606.
Hoff PT, Van De Vijver K, Van Dongen W, Esmans EL, Blust R, De Coen WM, 2003a. Perflurooctane sulfonic acid in bib (Trisopterus luscus) and plaive (Pleuronectes platessa) from the Western Scheldt and the Belgian North Sea: distribution and biochemical effects. Environ. Toxicol. Chem. 22, 608-614.
Hoff PT, Van Dongen W, Esmans EL, Blust R, De Coen WM, 2003b. Evaluation of the toxicological effects of perfluorooctane sulfonic acid in the common carp (Cyprinus carpio). Aquat. Toxicol. 62, 349-359.
Holmström K, Berger U, 2008. Tissue distribution of perfluorinated surfactants in common guillemot (Uria aalge) from the Baltic Sea. Environ. Sci. Technol. 42, 5879-5884.
Holmström K, Järnberg U, Bignert A, 2005. Temporal trends of PFOS and PFOA in guillemot eggs from the Baltic Sea, 1968-2003. Environ. Sci. Technol. 39, 80-84.
Hölzer J, Midasch O, Rauchfuss K, Kraft M, Reupert R, Angerer J, Kleeschulte P, Marschall N, Wilhelm M, 2008. Biomonitoring of perfluorinated compounds in children and adults exposed to perfluorooctanoate-contaminated drinking water. Environ. Health Perspect. 116, 651-657.
Houde M, Balmer BC, Brandsma S, Wells RS, Rowles TK, Solomon KR, Muir DC, 2006a. Perfluoroalkyl compounds in relation to life-history and reproductive parameters in bottlenose dolphins (Tursiops truncatus) from Sarasota Bay, Florida, USA. Environ. Toxicol. Chem. 25, 2405-2412.
Houde M, Bujas J, Wells RS, Fair PA, Bossart GD, Solomon KR, Muir DC, 2006b.

Bibliography
125
Biomagnification of perfluoroalkyl compounds in the bottlenose dolphin (Tursiops truncatus) food web. Environ. Sci. Technol. 40, 4138-4144.
Houde M, Martin JW, Lethcher RJ, Solomon KR, Muir DCG, 2006c. Biological monitoring of polyfluoroalkyl substances: a review. Environ. Sci. Technol. 40, 3463-3473.
Hu W, Jones PD, Upham BL, Trosko JE, Lau C, Giesy JP, 2002. Inhibition of gap junctional intercellular communication by perfluorinated compounds in rat liver and dolphin kidney epithelial cell lines in vitro and sprague-dawley rats in vivo. Toxicol. Sci. 68, 429-436.
Huset CA, Chiaia AC, Barfosky DF, Jonkers N, Kohler H-PE, Ort C, Giger W, Field JA, 2008. Occurrence and mass flows of fluorochemicals in the Glatt Valley watershed, Switzerland. Environ. Sci. Technol. 42, 6369–6377.
ICES, 2008. Report of the Marine Chemistry Working Group (MCWG), 3-7 March 2008. ICES CM 2008/MHC:04. 106 pp. .
Ikeda T, Aiba K, Fukuda K, Tanaka M, 1985. The induction of peroxisome proliferation in rat-liver by perfluorinated fatty-acids, metabolically inert derivatives of fatty-acids. J. Biochem. 98, 475-482.
Inoue K, Okada F, Ito R, Kato S, Sasaki S, Nakajima S, Uno A, Saijo Y, Sata F, Yoshimura Y, Kishi R, Nakazawa H, 2004. Perfluorooctane sulfonate (PFOS) and related perfluorinated compounds in human maternal and cord blood samples: assessment of PFOS exposure in a susceptible population during pregnancy. Environ. Health Perspect. 112, 1204-1207.
Intrasuksri U, Rangwala SM, O'Brien M, Noonan DJ, Feller DR, 1998. Mechanisms of peroxisome proliferation by perfluorooctanoic acid and endogenous fatty acids. Gen. Pharmacol. Vasc. Syst. 31, 187-197
Ishibashi H, Iwata H, Kim EY, Tao L, Kannan K, Amano M, Miyazaki N, Tanabe S, Batoev VB, Petrov EA, 2008a. Contamination and effects of perfluorochemicals in baikal seal (Pusa sibirica). 1. Residue level, tissue distribution, and temporal trend. Environ. Sci. Technol. 42, 2295-2301.
Ishibashi H, Iwata H, Kim EY, Tao L, Kannan K, Tanabe S, Batoev VB, Petrov EA, 2008b. Contamination and effects of perfluorochemicals in baikal seal (Pusa sibirica). 2. Molecular characterization, expression level, and transcriptional activation of peroxisome proliferator-activated receptor α. Environ. Sci. Technol. 42, 2302-2308.
Jahnke A, Ahrens L, Ebinghaus R, Berger U, Barber JL, Temme C, 2007a. An improved method for the analysis of volatile polyfluorinated alkyl substances in environmental air samples. Anal. Bioanal. Chem. 387, 965–975.
Jahnke A, Ahrens L, Ebinghaus R, Temme C, 2007b. Urban versus remote air concentrations of fluorotelomer alcohols and other polyfluorinated alkyl substances in germany. Environ. Sci. Technol. 41, 745-752.
Jahnke A, Berger U, 2009. Trace analysis of per- and polyfluorinated alkyl substances in various matrices-How do current methods perform? J. Chromatogr. A 1216, 410-421.
Jahnke A, Berger U, Ebinghaus R, Temme C, 2007c. Latitudinal gradient of airborne polyfluorinated alkyl substances in the marine atmosphere between Germany and South Africa (53° N-33° S). Environ. Sci. Technol. 41, 3055-3061.
Bibliography
126
Joensen UN, Bossi R, Leffers H, Jensen AA, Skakkebæk NE, Jørgensen N, 2009. Do perfluoroalkyl compounds impair human semen quality? Environ. Health Perspec. doi: 10.1289/ehp.0800517.
Johnson JD, Gibson SJ, Ober RE, 1984. Cholestyramine-enhanced fecal elimination of carbon-14 in rats after administration of ammonium [14C]perfluorooctanoate or potassium [14C]perfluorooctanesulfonate. Fundam. Appl. Toxicol. 4, 972-976.
Jones PD, Hu WY, De Coen W, Newsted JL, Giesy JP, 2003. Binding of perfluorinated fatty acids to serum proteins. Environ. Toxicol. Chem. 22, 2639-2649.
Ju X, Jin Y, Sasaki K, Saito N, 2008. Perfluorinated surfactants in surface, subsurface water and microlayer from Dalian coastal waters in China. Environ. Sci. Technol. 42, 3538-3542.
Kaiser MA, Larsen BS, Kao C-PC, Buck RC, 2005. Vapor pressures of perfluorooctanoic, -nonanoic, -decanoic, -undecanoic, and -dodecanoic acids. J. Chem. Eng. Data 50, 1841-1843.
Kallenborn R, Berger U, Järnberg U, 2004. Perfluorinated alkylated substances (PFAS) in the nordic environment. Tema Nord, 1-107.
Kannan K, Choi J-W, Iseki N, Senthilkumar K, Kim DH, Masunaga S, Giesy JP, 2002a. Concentrations of perfluorinated acids in livers of birds from Japan and Korea. Chemosphere 49, 225-231.
Kannan K, Corsolini S, Falandysz J, Fillmann G, Kumar KS, Loganathan BG, Ali Mohd M, Olivero J, Van Wouwe N, Ho Yang J, Aldous KM, 2004. Perfluorooctanesulfonate and related fluorochemicals in human blood from several countries. Environ. Sci. Technol. 38, 4489-4495.
Kannan K, Corsolini S, Falandysz J, Oehme G, Silvano F, Giesy JP, 2002b. Perfluorooctanesulfonate and related fluorinated hydrocarbons in marine mammals, fishes, and birds from coasts of the Baltic and the Mediterranean Seas. Environ. Sci. Technol. 36, 3210-3216.
Kannan K, Franson JC, Bowerman WW, Hansen KJ, Jones PD, Giesy JP, 2001a. Perfluorooctane sulfonate in fish-eating water birds including bald eagles and albatrosses. Environ. Sci. Technol. 35, 3065-3070.
Kannan K, Koistinen J, Beckmen K, Evans T, Gorzelany JF, Hansen KJ, Jones PD, Helle E, Nyman M, Giesy JP, 2001b. Accumulation of perfluorooctane sulfonate in marine mammals. Environ. Sci. Technol. 35, 1593-1598.
Kannan K, Newsted J, Halbrook RS, Giesy JP, 2002c. Perfluorooctanesulfonate and related fluorinated hydrocarbons in mink and river otters from the United States. Environ. Sci. Technol. 36, 2566-2571.
Kannan K, Perrotta E, Thomas NJ, 2006. Association between perfluorinated compounds and pathological conditions in southern sea otters. Environ. Sci. Technol. 40, 4943-4948.
Kannan K, Tao L, Sinclair E, Pastva SD, Jude DJ, Giesy JP, 2005. Perfluorinated compounds in aquatic organisms at various trophic levels in a Great Lakes food chain. Environ. Contam. Toxicol. 48, 559-566.
Kärrman A, Ericson I, van Bavel B, Darnerud PO, Aune M, Glynn A, Lignell S, Lindstrom G, 2007. Exposure of perfluorinated chemicals through lactation: Levels of matched human milk and serum and a temporal trend, 1996-2004, in Sweden. Environ. Health Perspec. 115, 226-230.

Bibliography
127
Kärrman A, Mueller JF, van Bavel B, Harden F, Toms L-ML, Lindström G, 2006a. Levels of 12 perfluorinated chemicals in pooled australian serum, collected 2002-2003, in relation to age, gender, and region. Environ. Sci. Technol. 40, 3742-3748.
Kärrman A, van Bavel B, Järnberg U, Hardell L, Lindström G, 2006b. Perfluorinated chemicals in relation to other persistent organic pollutants in human blood. Chemosphere 64, 1582–1591.
Kato K, Calafat AM, Wong L-Y, Wanigatunga AA, Caudill SP, Needham LL, 2009. Polyfluoroalkyl compounds in pooled sera from children participating in the National Health and Nutrition Examination Survey 2001-2002. Environ. Sci. Technol. 43, 2641–2647.
Keller JM, Kannan K, Taniyasu S, Yamashita N, Day RD, Arendt MD, Segars AL, Kucklick JR, 2005. Perfluorinated compounds in the plasma of loggerhead and kemp’s ridley sea turtles from the southeastern coast of the United States. Environ. Sci. Technol. 39, 9101-9108.
Key BD, Howell RD, Criddle CS, 1997. Fluorinated organics in the biosphere. Environ. Sci. Technol. 31, 2445-2454.
Kim S-K, Kannan K, 2007. Perfluorinated acids in air, rain, snow, surface runoff, and lakes: relative importance of pathways to contamination of urban lakes. Environ. Sci. Technol. 41, 8328-8334.
Kissa E, 2001. Fluorinated surfactants and repellents. Marcel Dekker 97.
Kubwabo C, Stewart B, Zhu J, Marro L, 2005. Occurrence of perfluorosulfonates and other perfluorochemicals in dust from selected homes in the city of Ottawa, Canada. J. Environ. Monit. 7, 1074-1078.
Kubwabo C, Vais N, Benoit FM, 2004. A pilot study on the determination of perfluorooctanesulfonate and other perfluorinated compounds in blood of Canadians. J. Environ. Monit. 6.
Larsen BS, Stchur P, Szostek B, Bachmura SF, Rowand RC, Prickett KB, Korzeniowski SH, Buck RC, 2006. Method development for the determination of residual fluorotelomer raw materials and perflurooctanoate in fluorotelomer-based products by gas chromatography and liquid chromatography mass spectrometry. J. Chromatogr. A 1110, 117–124.
Lau C, Anitole K, Hodes C, Lai D, Pfahles-Hutchens A, Seed J, 2007. Perfluoroalkyl acids: a review of monitoring and toxicological findings. Toxicol. Sci. 99, 366–394.
Law RJ, Bersuder P, Mead LK, Jepson PD, 2008. PFOS and PFOA in the livers of harbour porpoises (Phocoena phocoena) stranded or bycaught around the UK. Marine Poll. Bull. 56, 770–797.
Lei YD, Wania F, Mathers D, A. MS, 2004. Determination of vapor pressures, octanol-air, and water-air partition coefficients for polyfluorinated sulfonamide, sulfonamidoethanols, and telomer alcohols. J. Chem. Eng. Data 49, 1013-1022.
Leonel J, Kannan K, Tao L, Fillmann G, Montone RC, 2008. A baseline study of perfluorochemicals in Franciscana dolphin and subantarctic fur seal from coastal waters of Southern Brazil. Marin Poll. Bull. 56, 778-781.

Bibliography
128
Li X, Yeung LWY, Taniyasu S, Li M, Zhang H, Liu D, Lam PKS, Yamashita N, Dai J, 2008a. Perfluorooctanesulfonate and related fluorochemicals in the amur tiger (Panthera tigris altaica) from China. Environ. Sci. Technol. 42, 7078-7083.
Li X, Yeung LWY, Xu M, Taniyasu S, Lam PKS, Yamashita N, Dai J, 2008b. Perfluorooctane sulfonate (PFOS) and other fluorochemicals in fish blood collected near the outfall of wastewater treatment plant (WWTP) in Beijing. Environ. Poll. 156, 1298–1303.
Liu J, Lee LS, 2005. Solubility and sorption by soils of 8:2 fluorotelomer alcohol in water and cosolvent systems. Environ. Sci. Technol. 39, 7535-7540.
Liu J, Lee LS, 2007. Effect of fluorotelomer alcohol chain length on aqueous solubility and sorption by soils. Environ. Sci. Technol. 41, 5357-5362.
Loewen M, Halldorson T, Wang F, Tomy G, 2005. Fluorotelomer carboxylic acids and PFOS in rainwater from an urban center in Canada. Environ. Sci. Technol. 39, 2944-2951.
Loewen M, Wania F, Wang F, Tomy G, 2008. Altitudinal transect of atmospheric and aqueous fluorinated organic compounds in western Canada. Environ. Sci. Technol. 42, 2374-2379.
Löfstrand K, Jörundsdottir H, Tomy G, Svavarsson J, Weihe P, Nygard T, Bergman A, 2008. Spatial trends of polyfluorinated compounds in gueillemot (Uria algea) eggs from North-Western Europe. Chemosphere 72, 1475-1480.
Loganathan BG, Sajwan KS, Sinclair E, Kumar KS, Kannan K, 2007. Perfluoroalkyl sulfonates and perfluorocarboxylates in two wastewater treatment facilities in Kenntucky and Georgia. Water Research 41, 4611-4620.
Loos R, Gawlik BM, Locoro G, Rimaviciute E, Contini S, Bidoglio G, 2009. EU-wide survey of polar organic persistent pollutants in European river waters. Environ. Poll. 157, 561–568.
Loos R, Locoro G, Huber T, Wollgast J, Christoph EH, de Jager A, Gawlik BM, Hanke G, Umlauf G, Zaldı´var J-M, 2008. Analysis of perfluorooctanoate (PFOA) and other perfluorinated compounds (PFCs) in the River Po watershed in N-Italy. Chemosphere 71, 306–313.
Loos R, Wollgast J, Huber T, Hanke G, 2007. Polar herbicides, pharmaceutical products, perfluorooctanesulfonate (PFOS), perfluorooctanoate (PFOA), and nonylphenol and its carboxylates and ethoxylates in surface and tap waters around Lake Maggiore in Northern Italy. Anal. Bioanal. Chem. 387, 1469–1478.
Luebker DJ, Hansen KJ, Bass NM, Butenhoff JL, Seacat AM, 2002. Interactions of flurochemicals with rat liver fatty acid-binding protein. Toxicol. 176, 175-185.
Mahmoud MAM, Kärrman A, Oono S, Harada KH, Koizumi A, 2009. Polyfluorinated telomers in precipitation and surface water in an urban area of Japan. Chemosphere 74, 467-472.
Maras M, Vanparys C, Muylle F, Robbens J, Berger U, Barber JL, Blust R, De Coen W, 2006. Estrogen-like properties of fluorotelomer alcohols as revealed by MCF-7 breast cancer cell proliferation. Environ. Health Perspect. 114, 100-105.
Martin JW, Ellis DA, Mabury SA, Hurley MD, Wallington TJ, 2006. Atmospheric chemistry of perfluoroalkanesulfonamides: kinetic and product studies of the OH radical and Cl atom initiated oxidation of n-ethyl perfluorobutanesulfonamide. Environ. Sci. Technol. 40, 864-872.

Bibliography
129
Martin JW, Mabury SA, Solomon KR, Muir DCG, 2003a. Bioconcentration and tissue distribution of perfluorinated acids in rainbow trout (Oncorhynchus mykiss). Environ. Toxicol. Chem. 22, 196-204.
Martin JW, Mabury SA, Solomon KR, Muir DCG, 2003b. Dietary accumulation of perfluorinated acids in juvenile rainbow trout (Oncorhynchus mykiss). Environ. Toxicol. Chem. 22, 189-195.
Martin JW, Muir DCG, Moody CA, Ellis DA, Kwan WC, Solomon KR, Mabury SA, 2002. Collection of airborne fluorinated organics and analysis by gas chromatography/chemical ionization mass spectrometry. Anal. Chem. 74, 584-590.
Martin JW, Smithwick MM, Braune BM, Hoekstra PF, Muir DCG, Mabury SA, 2004a. Identification of long-chain perfluorinated acids in biota from the Canadian Arctic. Environ. Sci. Technol. 38, 373-380.
Martin JW, Whittle DM, Muir DCG, Mabury SA, 2004b. Perfluoroalkyl contaminants in a food web from Lake Ontario. Environ. Sci. Technol. 38, 5379-5385.
Mawn MP, McKay RG, Ryan TW, Szostek B, Powley CR, Buck RC, 2005. Determination of extractable perfluorooctanoic acid (PFOA) in water, sweat simulant, saliva simulant, and methanol from textile and carpet samples by LC/MS/MS. Analyst 130, 670-678.
McLachlan MS, Holmstrom KE, Reth M, Berger U, 2007. Riverine discharge of perfluorinated carboxylates from the European continent. Environ. Sci. Technol. 41, 7260-7265.
McMurdo CJ, Ellis DA, Webster E, Butler J, Christensen RD, Reid LK, 2008. Aerosol enrichment of the surfactant PFO and mediation of the water-air transport of gaseous PFOA. Environ. Sci. Technol. 42, 3969-3974.
Midasch O, Schettgen T, Angerer J, 2006. Pilot study on the perfluorooctanesulfonate and perfluorooctanoate exposed of the German general population. Int. J. Hyg. Environ. Health. 209, 489-496.
Miyake Y, Yamashita N, Rostkowski P, So MK, Taniyasu S, Lam PKS, Kannan K, 2007a. Determination of trace levels of total fluorine in water using combustion ion chromatography for fluorine: a mass balance approach to determine individual perfluorinated chemicals in water. J. Chromatogr. A 1143, 98–104.
Miyake Y, Yamashita N, So MK, Rostkowski P, Taniyasu S, Lam PKS, Kannan K, 2007b. Trace analysis of total fluorine in human blood using combustion ion chromatography for fluorine: a mass balance approach for the determination of known and unknown organofluorine compounds. J. Chromatogr. A 1154, 214–221.
Moody CA, Field JA, 1999. Determination of perfluorocarboxylates in groundwater impacted by fire-fighting activity. Environ. Sci. Technol. 33, 2800-2806.
Moody CA, Hebert GN, Strauss SH, Field JA, 2003. Occurrence and persistence of perfluorooctanesulfonate and other perfluorinated surfactants in groundwater at a fire-training area at Wurtsmith Air Force Base, Michigan, USA. J. Environ. Monit. 5, 341-345.
Moody CA, Kwan WC, Martin JW, Muir DCG, Mabury SA, 2001. Determination of perfluorinated surfactants in surface water samples by two independent analytical techniques: liquid chromatography/tandem mass spectrometry and 19F NMR. Anal. Chem. 73, 2200-2206.

Bibliography
130
Moody CA, Martin JW, Kwan WC, Muir DCG, Mabury SA, 2002. Monitoring perfluorinated surfactants in biota and surface water samples following an accidental release of fire-fighting foam into Etobicoke Creek. Environ. Sci. Technol. 36, 545-551.
Moriwaki H, Takata Y, Arakawa R, 2003. Concentrations of perfluorooctane sulfonate (PFOS) and perfluorooctanoic acid (PFOA) in vacuum cleaner dust collected in Japanese homes. J. Environ. Monit. 5, 753-757.
Mulkiewicz E, Jastorff B, Składanowski AC, Kleszczynski K, Stepnowski P, 2007. Evaluation of the acute toxicity of perfluorinated carboxylic acids using eukaryotic cell lines, bacteria and enzymatic assays. Environ. Toxicol. Pharmacol. 23, 279–285.
Murakami M, Imamura E, Shinohara H, Kiri K, Muramatsu Y, Harada A, Takada H, 2008. Occurence and sources of perfluorinated surfactants in rivers in Japan. Environ. Sci. Technol.
Murakami M, Shinohara H, Takada H, 2009. Evaluation of wastewater and street runoff as sources of perfluorinated surfactants (PFSs). Chemosphere 74, 487–493.
Murakami M, Takada H, 2008. Perfluorinated surfactants (PFSs) in size-fractionated street dust in Tokyo. Chemosphere 73, 1172-1177.
Nakata H, Kannan K, Nasu T, Cho H-S, Sinclair E, Takemura A, 2006. Perfluorinated contaminants in sediments and aquatic organisms collected from shallow water and tidal flat areas of thr Ariake Sea, Japan: Environmental fate of perfluorooctane sulfonate in aquatic ecosystems. Environ. Sci. Technol. 40, 4916-4921.
Nakayama S, Harada K, Inoue K, Sasaki K, Seery B, Saito N, Koizumi A, 2005. Distributions of perfluorooctanoic acid (PFOA) and perfluorooctane sulfonate (PFOS) in Japan and their toxicities. Environmental Sciences 12, 293-313.
Nakayama S, Helfant L, Egeghy P, Ye X, Lindstrom AB, 2007. Perfluorinated compounds in the cape fear drainage basin in North Carolina. Environ. Sci. Technol. 41, 5271-5276.
Newsted JL, Beach SA, Gallagher SP, Giesy JP, 2008. Acute and chronic effects of perfluorobutane sulfonate (PFBS) on the mallard and northern bobwhite quail. Arch. Environ. Contam. Toxicol. 54, 535-545.
Oakes KD, Sibley PK, Solomon KR, Mabury SA, Van der Kraak GJ, 2004. Impact of perfluorooctanoic acid on fathead minnow (Pimephales promelas) fatty acyl-CoA oxidase activity, circulating steroids, and reproduction in outdoor microcosms. Environ. Toxicol. Chem. 23, 1912-1919.
Olivero-Verbel J, Tao L, Johnson-Restrepo B, Guette-Fernández J, Baldiris-Avila R, O´byrne-Hoyos I, Kannan K, 2006. Perfluorooctanesulfonate and related fluorochemicals in biological samples from the north coast of Colombia. Environ. Poll. 142, 367-372.
Olsen GW, Burris JM, Ehresman DJ, Froehlich JW, Seacat AM, Butenhoff JL, Zobel LR, 2007. Half-life of serum elimination of perfluorooctanesulfonate, perfluorohexanesulfonate, and perfluorooctanoate in retired fluorochemical. Environ. Health Perspect. 115, 1298-1305.
Olsen GW, Burris JM, Mandel JH, Zobel LR, 1999. Serum perfluorooctane sulfonate and hepatic and lipid clinical chemistry test in fluorochemical production employees. J. Occup. Environ. Med. 41, 799-806.
Olsen GW, Church TR, Larson EB, van Belle G, Lundberg JK, Hansen KJ, Burris JM, Mandel JH, Zobel LR, 2004. Serum concentrations of perfuorooctanesulfonate and

Bibliography
131
other fuorochemicals in an elderly population from Seattle, Washington. Chemosphere 54, 1599-1611.
Olsen GW, Church TR, Miller JP, Burris JM, Hansen KJ, Lundberg JK, Armitage JB, Herron RM, Medhdizadehkashi Z, Nobiletti JB, O'Neill EM, Mandel JH, Zobel LR, 2003a. Perfluorooctanesulfonate and other fluorochemicals in the serum of american red cross adult blood donors. Environ. Health Perspect. 111, 1892-1901.
Olsen GW, Hansen KJ, Stevenson LA, Burris JM, Mandel JH, 2003b. Human donor liver and serum concentrations of perfluorooctanesulfonate and other perfluorochemicals. Environ. Sci. Technol. 37, 888-891.
Olsen GW, Huang H-Y, Helzlsouer KJ, Hansen KJ, Butenhoff JL, Mandel JH, 2005. Historical comparison of perfluorooctanesulfonate, perfluorooctanoate, and other fluorochemicals in human blood. Environ. Health Perspect. 113, 539-545.
Olsen GW, Mair DC, Church TR, Ellefson ME, Reagen WK, Boyd TM, Herron RM, Medhdizadehkashi Z, Nobiletti JB, Rios JA, Butenhoff JL, Zobel LR, 2008. Decline in perfluorooctanesulfonate and other polyfluoroalkyl chemicals in American red cross adult blood donors, 2000-2006. Environ. Sci. Technol. 42, 4989-4995.
Olson CT, Andersen ME, 1983. The acute toxicity o perfluorooctanoic and perfluorodecanoic acids in male rats and effects on tissue fatty acids. Toxicol. Appl. Pharmacol. 70, 362-372.
Oono S, Matsubara E, Harada KH, Takagi S, Hamada S, Asakawa A, Inoue K, Watanabe I, Koizumi A, 2008. Survey of airborne polyfluorinated telomers in keihan area, Japan. Bull. Environ. Contam. Toxicol. 80, 102–106.
Orata F, Quinete N, Werres F, Wilken R-D, 2009. Determination of Perfluorooctanoic Acid and Perfluorooctane Sulfonate in Lake Victoria Gulf Water. Bull. Environ. Contam. Toxicol. 82, 218–222.
Paul AG, Jones KC, Sweetman AJ, 2009. A first global production, emission, and environmental inventory for perfluorooctane sulfonate. Environ. Sci. Technol. 43, 386-392.
Phillips MM, Dinglasan-Panlilio MJA, Mabury SA, Solomon KR, Sibley PK, 2007. Fluorotelomer acids are more toxic than perfluorinated acids. Environ. Sci. Technol. 41, 7159-7163.
Plumlee MH, Larabee J, Reinhard M, 2008. Perfluorochemicals in water reuse. Chemosphere 72, 1514-1547.
Poulsen PB, Jensen AA, Bossi R, Jensen F, Olsen L, 2008. Use of polyfluorinated compounds in consumer products in Denmark. Poster presentation at the SETAC World 2008, 3-7 August 2008, Sydney, Australia.
Powley CR, George SW, Russell MH, Hoke RA, Buck RC, 2008. Polyfluorinated chemicals in a spatially and temporally integrated food web in the Western Arctic. Chemosphere 70, 664–672.
Powley CR, George SW, Ryan TW, Buck RC, 2005. Matrix effect-free analytical methods for determination of perfluorinated carboxylic acids in environmental matrixes. Anal. Chem. 77, 6353-6358.
Prevedouros K, Cousins IT, Buck RC, Korzeniowski SH, 2006. Sources, fate and transport of perfluorocarboxylates. Environ. Sci. Technol. 40, 32-44.

Bibliography
132
Reagen WK, Ellefson ME, Kannan K, Giesy JP, 2008. Comparison of extraction and quantification methods of perfluorinated compounds in human plasma, serum, and whole blood. Anal. Chim. Acta. 628, 214-221.
Reijnders PJH, Abt KF, Brasseur SMJM, Camphuysen K, Reineking B, Scheidat M, Siebert U, Stede M, Tougaard J, Tougaard S, 2005. Marine Mammals. In: Essink K, Dettmann C, Farke H, Laursen K, Lüerßen G, Marencic H, Wiersinga W (Eds). Wadden Sea Quality Status Report 2004. Wadden Sea Ecosystem No. 19. Trilateral Monitoring and Assessment Group, Common Wadden Sea Secretariat, Wilhelmshaven, Germany, 305-318.
Rhoads KR, Janssen EM-L, Luthy RG, Criddle CS, 2008. Aerobic biotransformation and fate of n-ethyl perfluorooctane sulfonamidoethanol (n-EtFOSE) in activated sludge. Environ. Sci. Technol. 42, 2873-2878.
Römpp A, Klemm O, Fricke W, Frank H, 2001. Haloacetates in fog and rain. Environ. Sci. Technol. 35, 1294-1298.
Ryg M, Lydersen C, Markussen NH, 1990. Estimating the blubber content of phocid seals. Can. J. Fish. Aquat. Sci. 47, 1223-1227.
Saito N, Harada K, Inoue K, Sasaki K, Yoshinaga T, Koizumi A, 2004. Perfluorooctanoate and perfluorooctane sulfonate concentrations on surface water in Japan. J. Occup. Health 46, 49-59.
Sanderson H, Boudreau TM, Mabury SA, Cheong W-J, Solomon KR, 2002. Ecological impact and environmental fate of perfluorooctane sulfonate on the zooplankton community in indoor microcosms. Environ. Toxicol. Chem. 21, 1490-1496.
Sanderson H, Boudreau TM, Mabury SA, Solomon KR, 2004. Effects of perfuorooctane sulfonate and perfuorooctanoic acid on the zooplanktonic community. Ecotoxicol. Environ. Saf. 58, 68-76.
Sasaki K, Harada K, Saito N, Tsutsui T, Nakanishi S, Tsuzuki H, Koizumi A, 2003. Impact of airborne perfluorooctane sulfonate on the human body burden and the ecological system. Bull. Environ. Contam. Toxicol. 71, 408-413.
Schröder HF, 2003. Determination of fluorinated surfactants and their metabolites in sewage sludge samples by liquid chromatography with mass spectrometry and tandem mass spectrometry after pressurised liquid extraction and separation on fluorine-modified reversed-phase sorbents. J. Chromatogr. A 1020, 131-151.
Schultz MM, Barofsky DF, Field JA, 2003. Fluorinated alkyl surfactants. Environ. Eng. Sci. 20, 487-501.
Schultz MM, Barofsky DF, Field JA, 2004. Quantitative determination of fluorotelomer sulfonates in groundwater by LC MS/MS. Environ. Sci. Technol. 38, 1828-1835.
Schultz MM, Barofsky DF, Field JA, 2006a. Quantitative determination of fluorinated alkyl substances by large-volume-injection liquid chromatography tandem mass spectrometry-characterization of municipal wastewaters. Environ. Sci. Technol. 40, 289-295.
Schultz MM, Higgins CP, Huset CA, Luthy RG, Barofsky DF, Field JA, 2006b. Fluorochemical mass flows in a municipal wastewater treatment facility. Environ. Sci. Technol. 40, 7350-7357.
Scott BF, Moody CA, Spencer C, Small JM, Muir DC, Mabury SA, 2006a. Analysis for perfluorocarboxylic acids/anions in surface waters and precipitation using GC-MS and

Bibliography
133
analysis of PFOA from large-volume samples. Environ. Sci. Technol. 40, 6405-6410.
Scott BF, Spencer C, Mabury SA, Muir DCG, 2006b. Poly and perfluorinated carboxylates in North American precipitation. Environ. Sci. Technol. 40, 7167-7174.
Seacat AM, Thomford PJ, Hansen KJ, Clemen LA, Eldridge SR, Elcombe CR, Butenhoff JL, 2003. Sub-chronic dietary toxicity of potassium perfluorooctanesulfonate in rats. Toxicol. 183, 117-131.
Seacat AM, Thomford PJ, Hansen KJ, Olsen GW, Case MT, Butenhoff JL, 2002. Subchronic toxicity studies on perfluorooctanesulfonate potassium salt in cynomolgus monkeys. Toxicol. Sci. 68, 249-264.
Senthilkumar K, Ohi E, Sajwan K, Takasuga T, Kannan K, 2007. Perfluorinated compounds in river water, river sediment, market fish, an wildlife samples from Japan. Bull. Environ. Contam. Toxicol. 79, 427-431.
Shoeib M, Harner T, Ikonomou M, Kannan K, 2004a. Indoor and outdoor air concentrations and phase partitioning of perfluoroalkyl sulfonamides and polybrominated diphenyl ethers. Environ. Sci. Technol. 38, 1313-1320.
Shoeib M, Harner T, Lee SC, Lane D, Zhu J, 2008. Sorbent-impregnated polyurethane foam disk for passive air sampling of volatile fluorinated chemicals. Anal. Chem. 80, 675-682.
Shoeib M, Harner T, Vlahos P, 2006. Perfluorinated chemicals in the Arctic atmosphere. Environ. Sci. Technol. 40, 7577-7583.
Shoeib M, Harner T, Wilford B, Jones K, Zhu J, 2004b. A Survey of Perfluoroalkyl sulfonamides in indoor and outdoor air using passive air samplers. Flourinated POPS 66, 3999-4003.
Shoeib M, Harner T, Wilford BH, Jones K, Zhu J, 2005. Perfluorinated sulfonamides in indoor and outdoor air and indoor dust: occurrence, partitioning, and human exposure. Environ. Sci. Technol. 39, 6599-6606.
Siebert U, Wohlstein P, Lehnert K, Baumgärtner W, 2007. Pathological findings in harbour seals (Phoca vitulina): 1996-2005. J. Comp. Path. 137, 47-58.
Simcik MF, Dorweiler KJ, 2005. Ratio of perfluorochemical concentrations as a tracer of atmospheric deposition to surface waters. Environ. Sci. Technol. 39, 8678-8683.
Simons JH. , 1950. Electrochmical process of making fluorine-containing carbon compounds. U.S. Patent US 2,519,983. 3M Company.
Sinclair E, Kannan K, 2006. Mass loading and fate of perfluoroalkyl surfactants in wastewater treatment plants. Environ. Sci. Technol. 40, 1408-1414.
Sinclair E, Kim SK, Akinley HB, Kannan K, 2007. Quantitation of gas-phase perfluoroalkyl surfactants and fluorotelomer alcohols released from nonstick cookware and microwave popcorn bags. Environ. Sci. Technol. 41, 1180-1185.
Skutlarek D, Exner M, Färber H, 2006. Perfluorinated surfactants in surface and drinking waters. Environ. Sci. Pollut. Res. 13, 299-307.
Smart BE, 2001. Fluorine substituent effects (on bioactivity). J. Fluorine Chem. 109, 3-11.
Smithwick M, Mabury S, Solomon KR, Sonne C, Martin JW, Born EW, Dietz R, Derocher AE, Letcher RJ, Evans TJ, Gabrielsen GW, Nagy J, Stirling I, Taylor MK, Muir DCG,

Bibliography
134
2005a. Circumpolar study of perfluoroalkyl contaminants in polar bears (Ursus maritimus). Environ. Sci. Technol. 39, 5517-5523.
Smithwick M, Muir DCG, Mabury SA, Solomon KR, Martin JW, Sonne C, Born EW, Letcher RJ, Dietz R, 2005b. Perfluoroalkyl contaminants in liver tissue from East Greenland polar bears (Ursus Maritimus). Environ. Toxicol. Chem. 24, 981-986.
Smithwick M, Norstrom RJ, Mabury S, Solomon K, Evans TJ, Stirling I, Taylor MK, Muir DCG, 2006. Temporal trends of perfluoroalkyl contaminants in polar bears (Ursus maritimus) from two locations in the North American Arctic, 1972-2002. Environ. Sci. Technol. 40, 1139-1143.
So MK, Miyake Y, Yeung WY, Ho YM, Taniyasu S, Rostkowski P, Yamashita N, Zhou BS, Shi XJ, Wang JX, Giesy JP, Yu H, Lam PKS, 2007. Perfluorinated compounds in the Pearl River and Yangtze River of China. Chemosphere 68, 2085-2095.
So MK, Taniyasu S, Yamashita N, Giesy JP, Zheng J, Fang Z, Im SH, Lam PKS, 2004. Perfluorinated compounds in coastal waters of Hong Kong, South China, and Korea. Environ. Sci. Technol. 38, 4056-4063.
Spliethoff HM, Tao L, Shaver SM, Aldous KM, Pass KA, Kannan K, Eadon GA, 2008. Use of newborn screening program blood spots for exposure assessment: declining levels of perfluorinated compounds in New York State infants. Environ. Sci. Technol. 42, 5361-5367.
Stadalius M, Connoly P, L'Empereur K, Flaherty JM, Isemura T, Kaiser MA, al. e, 2006. A method for the low-level (ng g-1) determination of perfluorooctanoate in paper and textile by liquid chromatography with tandem mass spectrometry. J. Chromatogr. A 1123, 10-14.
Stevenson CN, MacManus-Spencer LA, Luckenbach T, Luthy RG, Epel D, 2006. New perspectives on perfluorochemical ecotoxicology: inhibition and induction of an efflux transporter in the marine mussel, Mytilus californianus Environ. Sci. Technol. 40, 5580-5585.
Stewardson CL, Hemsley S, Meyer MA, Canfield PJ, Maindonald JH, 1999. Gross and microscopic visceral anatomy of the male Cape for seal, Arctocephalus pusillus pusillus (Pinnipedia Otariidae), with reference to organ size and growth. J. Anat. 195, 235-255.
Stock NL, Ellis DA, Deleebeeck L, Muir DCG, Mabury SA, 2004a. Vapor pressures of the fluorinated telomer alcohols - limitations of estimation methods. Environ. Sci. Technol. 38, 1693-1699.
Stock NL, Furdui VI, Muir DCG, Mabury SA, 2007. Perfluoroalkyl contaminants in the Canadian Arctic: evidence of atmospheric transport and local contamination. 41, 3529-3536.
Stock NL, Lau FK, Ellis DA, Martin JW, Muir DCG, Mabury SA, 2004b. Polyfluorinated telomer alcohols and sulfonamides in the North American troposphere. Environ. Sci. Technol. 38, 991-996.
Strynar MJ, Lindstrom AB, 2008. Perfluorinated compounds in house dust from Ohio and North Carolina, USA. Environ. Sci. Technol. 42, 3751–3756.
Sturman S, Small J, Solomon KR, Muir DC, 2007. Tissue distribution of polyfluorinated compounds from two ringed seal (Phoca hispida) populations in the Canadian Arctic. Poster presented at the SETAC Europe 17th Annual Meeting, Porto, Portugal, 20-24.

Bibliography
135
May.
Takino M, Daishima S, Nakahara T, 2003. Determination of perfluorooctane sulfonate in river water by liquid chromatography/atmospheric pressure photoionization mass spectrometry by automated on-line extraction using turbulent flow chromatography. Rapid Commun. Mass Spectrom. 17, 383-390.
Taniyasu S, Kannan K, Horii Y, Hanari N, Yamashita N, 2003. A survey of perfluorooctane sulfonate and related perfluorinated organic compounds in water, fish, birds, and humans from Japan. Environ. Sci. Technol. 37, 2634-2639.
Taniyasu S, Kannan K, So MK, Gulkowska A, Sinclair E, Okazawa T, Yamashita N, 2005. Analysis of fluorotelomer alchols, fluorotelomer acids, and short- and long-chain perfluorinated acids in water and biota. J. Chromatogr. A 1093, 89-97.
Taniyasu S, Kannan K, Yeung LWY, Kwok KY, Lam PKS, Yamashita N, 2008. Analysis of trifluoroacetic acid and other short-chain perfluorinated acids (C2–C4) in precipitation by liquid chromatography–tandem mass spectrometry: Comparison to patterns of long-chain perfluorinated acids (C5–C18). Anal. Chim. Acta. 619, 221-230.
Tao L, Kannan K, Najiwara N, Costa M, Fillmann G, Takahashi S, Tanabe S, 2006. Perfluorooctanesulfonate and related fluorochemicals in albatrosses, elephant seals, penguins, and polar skuas from the Southern Ocean. Environ. Sci. Technol. 40, 7642-7648.
Tao L, Kannan K, Wong CM, Arcaro KF, Butenhoff JL, 2008a. Perfluorinated compounds in human milk from Massachusetts, U.S.A. Environ. Sci. Technol. 42, 3096–3101.
Tao L, Ma J, Kunisue TE, Libelo L, Tanabe S, Kannan K, 2008b. Perfluorinated compounds in human breast milk from several Asian countries, and in infant formula and dairy milk from the United States. Environ. Sci. Technol. 42, 8597-8602.
Taves DR, 1968. Evidence that there are two forms of fluoride in human serum. Nauture 217, 1050-1051.
Theobald N, Gerwinski W, Caliebe C, Haarich M, 2007a. Development and validation of a method for the determination of polyfluorinated organic substances in sea water, sediments and biota. Occurrence of these Compounds in the North and Baltic Seas. Report No. UBA-FB: 001049, (abstract in English, text in German).
Theobald N, Gerwinski W, Jahnke A, 2007b. Occurrence of perfluorinated organic acids in surface sea-water of the East Atlantic Ocean between 53° north and 30° south. Poster presentation at the SETAC Europe Annual Meeting 20-24 May 2007 in Porto, Portugal.
Tittlemier SA, Pepper K, Edwards L, Tomy G, 2005. Development and characterization of a solvent extraction–gas chromatographic/mass spectrometric method for the analysis of perfluorooctanesulfonamide compounds in solid matrices. J. Chromatogr. A 1066, 189-195.
Tittlemier SA, Pepper K, Seymour C, Moisey J, Bronson R, Cao X-L, Dabeka RW, 2007. Dietary exposure of Canadians to perfluorinated carboxylates and perfluorooctane sulfonate via consumption of meat, fish, fast foods, and food items prepared in their packaging. J. Agric. Food Chem. 55, 3203-3210.
Tomy GT, Budakowski WR, Halldorson T, Helm PA, Stern GA, Friesen K, Pepper K, Tittlemier SA, Fisk AT, 2004a. Fluorinated organic compounds in an Eastern Arctic marine food web. Environ. Sci. Technol. 38, 6475-6481.

Bibliography
136
Tomy GT, Tittlemier SA, Palace VP, Budakowski WR, Braekevelt E, Brinkworth L, Friesen K, 2004b. Biotransformation of n-ethyl perfluorooctanesulfonamide by rainbow trout (Oncorhynchus mykiss) liver microsomes. Environ. Sci. Technol. 38, 758-762.
Trudel D, Horowitz L, Wormuth M, Scheringer M, Cousins IT, Hungerbuhler K, 2008. Estimating consumer exposure to PFOS and PFOA. Risk Analysis 28, 251-269.
U.S. Environmental Protection Agency, 2000. Perfluorooctyl sulfonates; proposed significant new rule. Fed. Regist. 65, 62319-62333.
U.S. Environmental Protection Agency, 2005. Draft risk assessment on the potential human health effects associated with exposure to perfluorooctanoic acid and its salts. Office of Pollution Prevention and Toxics Risk Assessment Division. Washington DC, USA.
U.S. Environmental Protection Agency, 2006. PFOA Stewardship Program. Docket EPA-HQ-OPPT-2006-0621.
UNEP. 2007. In: http://www.chem.unep.ch/pops/. United Nations Environment Programme - Persistent Organic Pollutants.
Van de Vijver K, Hoff P, Das K, Brasseur S, Van Dongen W, Esmans E, Reijnders P, Blust R, De Coen W, 2005. Tissue distribution of perfluorinated chemicals in harbor seals (Phoca vitulina) from the Dutch Wadden Sea. Environ. Sci. Technol. 39, 6978-6984.
Van de Vijver K, Holsbeek L, Das K, Blust R, Joiris C, De Coen W, 2007. Occurence of perfluoroctane sulfonate and other perfluorinated alkylated substances in harbor porpoises from the Black Sea. Environ. Sci. Technol. 41, 315-320.
Van de Vijver KI, Hoff PT, Das K, Van Dongen W, Esmans EL, Jauniaux T, Bouquegneau JM, Blust R, De Coen W, 2003a. Perfluorinated chemicals infiltrate ocean waters: link between exposure levels and stable isotope ratios in marine mammals. Environ. Sci. Technol. 37, 5545-5550.
Van de Vijver KI, Hoff PT, Das K, Van Dongen W, Esmans EL, Siebert U, Bouquegneau JM, Blust R, De Coen WM, 2004. Baseline study of perfuorochemicals in harbour porpoises (Phocoena phocoena) from Northern Europe. Baseline / Marine Poll. Bull. 48, 992-997.
Van de Vijver KI, Hoff PT, Van Dongen W, Esmans EL, Blust R, De Coen WM, 2003b. Exposure patterns of perfluorooctane sulfonate in aquatic invertebrates from the Western Scheldt Estuary and the southern North Sea. Environ. Toxicol. Chem. 22, 2037-2041.
Van Leeuwen SPJ, De Boer J, 2007. Extraction and clean-up strategies for the analysis of poly- and perfluoroalkyl substances in environmental and human matrices. J. Chromatogr. A 1153, 172–185.
Van Leeuwen SPJ, Kärrman A, Van Bavel B, De Boer J, Lindström G, 2006. Struggle for quality in determination of perfluorinated contaminants in environmental and human samples. Environ. Sci. Technol. 40, 7854-7860.
Van Leeuwen SPJ, Swart CP, De Boer J, 2009. Significant improvements in the analysis of perfluorinated compounds in water and fish: results from an interlaboratory method evaluation study. J. Chromatogr. A 1216, 401-409.
Verreault J, Berger U, Gabrielsen GW, 2007. Trends of perfluorinated alkyl substances in herring gulls from two coastal colonies in northern Norway: 1983 - 2003. Environ. Sci. Technol. 41, 6671-6677.

Bibliography
137
Verreault J, Houde M, Gabrielsen GW, Berger U, Haukas M, Letcher RJ, Muir DCG, 2005. Perfluorinated alkyl substances in plasma, liver, brain, and eggs of glaucous gulls (Larus hyperboreus) from the Norwegian Arctic. Environ. Sci. Technol. 39, 7439-7445.
Vestergren R, Cousins IT, Trudel D, Wormuth M, Scheringer M, 2008. Estimating the contribution of precursor compounds in consumer exposure to PFOS and PFOA. Chemosphere 73, 1617-1624.
Villagrasa M, de Alda ML, Barceló D, 2006. Environmental analysis of fluorinated alkyl substances by liquid chromatography–(tandem) mass spectrometry: a review. Anal. Bioanal. Chem. 386, 953–972.
Völkel W, Genzel-Boroviczény O, Demmelmair H, Gebauer C, Koletzko B, Twardella D, Raab U, Fromme H, 2008. Perfluorooctane sulphonate (PFOS) and perfluorooctanoic acid (PFOA) in human breast milk: Results of a pilot study. Int. J. Hyg. Environ. Health. 211, 440-446.
Wang N, Szostek B, Buck RC, Folsom PW, Sulecki LM, Capka V, Berti WR, Gannon JT, 2005. Fluorotelomer alcohol biodegradations direct evidence that perfluorinated carbon chains breakdown. Environ. Sci. Technol. 39, 7516-7528.
Wang Y, Yeung LWY, Taniyasu S, Yamashita N, Lam JCW, Lam PKS, 2008. Perfluorooctane sulfonate and other fluorochemicals in waterbird eggs from South China. Environ. Sci. Technol. 42, 8146-8151.
Wania F, Mackay D, 1995. A global distribution model for persistent organic chemicals. Sci. Total Environ. 160/161, 211-232.
Washburn ST, Bingman TS, Braithwaite SK, Buck RC, Buxton W, Clewell HJ, Haroun LA, Kester JE, Rickard RW, Shipp AM, 2005. Exposure assessment and risk characterization for perfluorooctanoate in selected consumer articles. Environ. Sci. Technol. 39, 3904-3910.
Washington JW, Ellington JJ, Jenkins TM, Evans JJ, 2007. Analysis of perfluorinated carboxylic acids in soils: detection and quantitation issues at low concentrations. J. Chromatogr. A 1154, 111-120.
Washington JW, Henderson WM, Ellington JJ, Jenkins TM, Evans JJ, 2008. Analysis of perfluorinated carboxylic acids in soils II: optimization of chromatography and extraction. J. Chromatogr. A 1181, 21–32.
Wei S, Chen LQ, Taniyasu S, So MK, Murphy MB, Yamashita N, Yeung LWY, Lam PKS, Wei S, Chen LQ, 2008. Distribution of perfluorinated compounds in surface seawaters between Asia and Antarctica. Marine Poll. Bull. 54, 1813–1838.
Wickbold R, 1954. Die quantitative Verbrennung Fluor-haltiger organischer Substanzen. Angew. Chem. 66, 173-174.
Wujcik CE, Cahill TM, Seiber JN, 1999. Determination of trifluoroacetic acid in 1996-1997 precipitation and surface waters in California and Nevada. Environ. Sci. Technol. 33, 1747-1751.
Yamashita N, Kannan K, Taniyasu S, Horii Y, Okazawa T, Petrick G, Gamo T, 2004. Analysis of perfluorinated acids at parts-per-quadrillion levels in seawater using liquid chromatography-tandem mass spectrometry. Environ. Sci. Technol. 38, 5522-5528.

Bibliography
138
Yamashita N, Kannan K, Taniyasu S, Horii Y, Petrick G, Gamo T, 2005. A global survey of perfluorinated acids in oceans. Marine Poll. Bull. 51, 658-668.
Yamashita N, Taniyasu S, Petrick G, Wei S, Gamo T, Lam PKS, Kannan K, 2008. Perfluorinated acids as novel chemical tracers of global circulation of ocean waters. Chemosphere 70, 1247-1255.
Yang Q, Xie Y, Alexson SEH, Nelson BD, DePierre JW, 2002. Involvement of the peroxisome proliferators-activated receptor alpha in the immunomodulation caused by peroxisome proliferators in mice. Biochem. Pharmacol. 63, 1893-1900.
Yeung LWY, Miyake Y, Taniyasu S, Wang Y, Yu H, So MK, Jiang G, Wu Y, Li J, Giesy JP, Yamashita N, Lam PKS, 2008. Perfluorinated compounds and total and extractable organic fluorine in human blood samples from China. Environ. Sci. Technol. 42, 8140-8145.
Yeung LWY, So MK, Jiang G, Taniyasu S, Yamashita N, Song M, Wu Y, Li J, Giesy JP, Guruge KS, Lam PKS, 2006. Perfluorooctanesulfonate and related fluorochemicals in human blood samples from China. Environ. Sci. Technol. 40, 715-720.
Ylinen M, Hanhijarvi H, Peura P, Ramo O, 1985. Quantitative gas-chromatographic determination of perfluorooctanoic acids as the benzyl ester in plasma and urine. Arch. Environ. Contam. Toxicol. 14, 713-717.
Yoo H, Guruge KS, Yamanaka N, Sato C, Mikami O, Miyazaki S, Yamashita N, Giesy JP, 2009. Depuration kinetics and tissue disposition of PFOA and PFOS in white leghorn chickens (Gallus gallus) administered by subcutaneous implantation. Ecotoxicol. Environ. Safety 72, 26-36.
Young CJ, Furdui VI, Franklin J, Koerner RM, Muir DC, Mabury SA, 2007. Perfluorinated acids in arctic snow: new evidence for atmospheric formation. Environ. Sci. Technol. 41, 3455-3461.

Supplementary material
139
10. Supplementary material
Table S1. Locations, sampling time and standard parameters of sampling for the German Bight survey from 1st to 9th August in 2007 a
Station number
Sampling date
UTC time b Latitude Longitude
Water temperature
[°C]
Suspended particulate
matter [mg/L]
Dissolved organic
carbon [mg/L]
Particulate organic
carbon [mg/L]
1 01/08/2007 11:45 N53° 53.40' E08° 42.60' 18.0 53.68 n.a. 1.58 2 01/08/2007 12:33 N53° 58.20' E08° 37.80' 17.6 178.38 8.32 4.87 3 01/08/2007 13:25 N53° 59.40' E08° 26.10' 17.9 45.44 9.47 0.87 4 01/08/2007 14:45 N54° 03.83' E08° 10.71' n.a. 63.00 7.53 0.98 5 01/08/2007 15:30 N54° 08.15' E07° 59.91' n.a. 29.64 n.a. 0.45 6 01/08/2007 15:56 N54° 09.91' E07° 54.22' n.a. 27.13 7.06 0.37 7 02/08/2007 06:25 N54° 08.40' E07° 39.60' 18.1 0.89 n.a. 0.23 8 02/08/2007 07:06 N54° 02.10' E07° 45.60' 18.1 2.29 7.80 0.35 9 02/08/2007 08:11 N53° 55.80' E07° 55.80' 18.0 3.77 8.07 0.32
10 02/08/2007 09:01 N53° 51.60' E08° 07.20' 18.0 10.22 8.74 0.58 11 02/08/2007 10:02 N53° 44.40' E08° 13.20' 17.9 26.80 n.a. 1.43 12 02/08/2007 11:20 N53° 37.20' E08° 28.80' 19.1 41.02 11.81 1.72 13 02/08/2007 12:07 N53° 30.60' E08° 32.40' 20.0 58.73 12.91 2.50 14 04/08/2007 09:37 N53° 49.80' E07° 54.00' 18.3 29.82 8.04 1.42 15 04/08/2007 09:55 N53° 49.20' E07° 49.20' 18.4 11.66 7.02 0.75 16 04/08/2007 10:36 N53° 47.10' E07° 37.80' 18.6 57.02 8.12 1.09 17 04/08/2007 11:18 N53° 46.80' E07° 25.80' 18.7 13.60 7.68 0.79 18 04/08/2007 12:33 N53° 44.40' E07° 07.20' 18.7 5.98 8.48 0.66 19 04/08/2007 13:06 N53° 43.20' E06° 59.40' 18.2 6.68 n.a. 0.54 20 04/08/2007 14:17 N53° 40.80' E06° 41.40' 18.3 11.73 n.a. 0.79 21 05/08/2007 06:59 N53° 19.80' E07° 10.20' 18.8 87.03 n.a. 2.97 22 05/08/2007 07:29 N53° 19.80' E07° 00.00' 18.8 37.83 11.33 1.60 23 05/08/2007 08:15 N53° 28.20' E06° 51.60' 18.7 81.54 n.a. 3.20 24 05/08/2007 09:13 N53° 36.00' E06° 36.60' 18.6 27.32 n.a. 1.27 25 05/08/2007 10:36 N53° 48.60' E06° 30.60' 18.7 2.37 7.06 0.42 26 05/08/2007 11:46 N54° 00.00' E06° 30.60' 18.7 3.55 n.a. 0.38 27 05/08/2007 13:27 N54° 00.60' E07° 00.60' 19.5 1.36 6.16 0.38 28 05/08/2007 14:32 N54° 01.20' E07° 20.40' 19.5 1.05 5.75 0.31 29 06/08/2007 11:12 N54° 25.28' E07° 53.94' n.a. 45.96 n.a. 0.42 30 06/08/2007 12:23 N54° 36.71' E07° 53.99' n.a. 1.24 7.63 0.35 31 06/08/2007 13:47 N54° 50.07 E07° 54.14' n.a. 1.07 6.20 0.30 32 06/08/2007 15:12 N55° 03.88' E07° 53.52' n.a. 1.39 n.a. 0.45 33 06/08/2007 16:11 N55° 05.55' E08° 10.32' n.a. 4.48 6.69 1.40 34 06/08/2007 17:11 N55° 02.60' E08° 28.07' n.a. 1.93 7.24 0.22 35 07/08/2007 09:17 N54° 54.32' E08° 15.92' n.a. 2.28 5.81 0.46 36 07/08/2007 10:46 N54° 40.30' E08° 10.32' n.a. 2.09 6.26 0.31 37 07/08/2007 11:33 N54° 44.16' E08° 18.63' n.a. 2.54 5.45 0.33 38 07/08/2007 12:18 N54° 47.56 E08° 27.55' n.a. 3.77 n.a. 0.36 39 07/08/2007 14:30 N54° 40.20' E08° 31.80' n.a. 2.63 5.65 0.29 40 07/08/2007 15:00 N54° 35.97 E08° 24.35' n.a. 1.62 5.59 0.33 41 07/08/2007 16:30 N54° 36.35' E08° 47.36' n.a. 10.67 6.24 0.80 42 09/08/2007 08:10 N54° 28.80' E09° 00.11' n.a. 22.68 7.99 1.22 43 09/08/2007 09:20 N54° 26.44' E08° 44.53' n.a. 4.41 6.56 0.37 44 09/08/2007 10:13 N54° 22.93' E08° 32.53' n.a. 3.30 5.47 0.31 45 09/08/2007 11:07 N54° 14.30' E08° 27.63' n.a. 2.82 5.64 0.20 46 09/08/2007 11:56 N54° 05.78' E08° 25.70' n.a. 5.57 6.08 0.78 47 09/08/2007 12:11 N54° 03.38' E08° 26.07' n.a. 8.06 n.a. 0.58 48 09/08/2007 12:51 N53° 59.63' E08° 34.04' n.a. 14.73 n.a. 0.86
a n.a. = not available; b UTC = universal time coordinated.

Supplementary material
140
Table S2. Concentrations and standard deviation of PFCs in ng per litre surface water from sampling station 1 to 16 in the German Bight a
Analyte 1 2 3 4 5 6 7 b 8 9 10 11 12 13 14 15 16
PFBS 5.05 ± 0.56
4.75 ± 0.42
5.38 ± 0.57
6.52 ± 0.19
4.81 ± 0.26
5.00 ± 0.77
5.80 ± 0.51
6.32 ± 0.13
4.75 ± 0.29
7.68 ± 0.02
8.19 ± 1.10
3.84 ± 0.11
5.45 ± 0.42
6.69 ± 0.71
7.97 ± 0.37
8.09 ± 0.05
PFPS c 0.39 ± 0.03
n.d. 0.20 ± 0.02
n.d. 0.13 ± 0.02
n.d. 0.11 ± 0.04
0.12 ± 0.003
0.13 ± 0.01
0.24 ± 0.03
n.d. 0.44 ± 0.01
0.70 ± 0.04
0.18 ± 0.01
0.20 ± 0.02
0.20 ± 0.03
PFHxS 0.91 ± 0.03
0.56 ± 0.03
0.46 ± 0.01
0.30 ± 0.02
0.27 ± 0.003
0.26 ± 0.03
0.29 ± 0.07
0.34 ± 0.05
0.31 ± 0.02
0.30 ± 0.05
0.47 ± 0.10
0.44 ± 0.05
0.38 ± 0.005
0.35 ± 0.003
0.39 ± 0.001
0.40 ± 0.02
PFOS 2.42 ± 0.18
1.40 ± 0.07
0.83 ± 0.04
1.35 ± 0.10
1.15 ± 0.17
0.69 ± 0.03
0.96 ± 0.29
0.80 ± 0.04
1.33 ± 0.001
1.21 ± 0.02
1.48 ± 0.17
2.51 ± 0.08
2.27 ± 0.58
1.00 ± 0.15
1.24 ± 0.05
1.39 ± 0.09
PFNS c n.d. n.d. n.d. n.d. n.d. n.d. 0.29 ± 0.06
n.d. n.d. n.d. n.d. n.d. n.d. n.d. n.d. n.d.
6:2 FTS 0.44 ± 0.04
n.d. n.d. n.d. n.d. n.d. n.d. n.d. n.d. n.d. 0.49 ± 0.12
n.d. n.d. n.d. n.d. n.d.
PFPA 0.65 ± 0.09
0.78 ± 0.03
1.60 ± 0.17
0.20 ± 0.04
0.96 ± 0.14
1.25 ± 0.14
1.07 ± 0.54
0.31 ± 0.03
0.76 ± 0.03
0.22 ± 0.001
2.50 ± 0.12
1.53 ± 0.10
0.94 ± 0.02
0.58 ± 0.02
0.94 ± 0.08
(0.13) ± 0.21
PFHxA 2.79 ± 0.14
2.30 ± 0.06
1.83 ± 0.07
1.15 ± 0.06
0.59 ± 0.02
0.67 ± 0.10
0.67 ± 0.07
1.19 ± 0.03
0.77 ± 0.01
1.64 ± 0.06
3.37 ± 0.12
9.51 ± 0.58
9.56 ± 0.06
0.72 ± 0.01
0.77 ± 0.0002
0.97 ± 0.07
PFHpA 1.87 ± 0.02
1.42 ± 0.09
1.07 ± 0.04
0.56 ± 0.03
0.40 ± 0.001
0.60 ± 0.04
0.51 ± 0.13
0.88 ± 0.03
0.49 ± 0.002
0.60 ± 0.02
0.90 ± 0.05
1.04 ± 0.01
2.52 ± 0.06
0.50 ± 0.01
0.60 ± 0.03
0.62 ± 0.06
PFOA 7.83 ± 0.11
4.94 ± 0.11
4.08 ± 0.32
3.39 ± 0.14
3.22 ± 0.09
3.34 ± 0.13
3.66 ± 0.13
4.28 ± 0.06
3.83 ± 0.11
3.71 ± 0.06
4.16 ± 0.03
5.29 ± 0.61
7.74 ± 0.76
3.96 ± 0.04
4.75 ± 0.32
4.35 ± 0.08
PFNA 0.92 ± 0.02
0.53 ± 0.04
0.20 ± 0.002
0.27 ± 0.03
0.19 ± 0.005
0.12 ± 0.004
0.17 ± 0.07
0.21 ± 0.03
0.20 ± 0.002
0.24 ± 0.005
0.26 ± 0.005
0.72 ± 0.07
0.76 ± 0.08
0.22 ± 0.02
0.20 ± 0.04
0.25 ± 0.001
PFDA 0.50 ± 0.01
0.20 ± 0.03
0.10 ± 0.001
0.11 ± 0.01
0.09 ± 0.004
0.07 ± 0.01
0.08 ± 0.01
0.10 ± 0.01
0.07 ± 0.01
0.08 ± 0.002
0.12 ± 0.0003
0.24 ± 0.03
0.62 ± 0.01
0.08 ± 0.002
0.06 ± 0.01
0.09 ± 0.01
PFUnDA n.d. 0.02 ± 0.01
(0.01) ± 0.01
n.d. 0.03 ± 0.001
(0.01) ± 0.004
0.02 ± 0.02
n.d. (0.01) ± 0.001
0.02 ± 0.003
n.d. n.d. 0.05 ± 0.003
0.03 ± 0.005
0.02 ± 0.003
0.03 ± 0.001
PFDoDA n.d. (0.005)
± 0.002
n.d. n.d. 0.03 ± 0.001
n.d. n.d. n.d. n.d. n.d. n.d. n.d. (0.003) ± 0.001
0.02 ± 0.002
n.d. n.d.
FOSA 0.11 ± 0.0004
0.14 ± 0.0004
0.06 ± 0.002
0.03 ± 0.01
0.02 ± 0.003
n.d. n.d. 0.07 ± 0.01
n.d. 0.04 ± 0.003
n.d. 0.06 ± 0.004
0.20 ± 0.01
0.04 ± 0.01
0.03 ± 0.01
n.d.
MeFBSA n.d. n.d. n.d. n.d. n.d. n.d. n.d. n.d. n.d. n.d. n.d. n.d. n.d. n.d. n.d. n.d.
MeFBSE 0.54 ± 006
0.29 ± 0.06
0.37 ± 0.01
n.d. (0.18) ±
0.03 n.d. n.d.
0.74 ± 0.17
n.d. n.d. n.d. (0.13) ± 0.003
n.d. (0.12) ± 0.004
n.d. n.d.
FDUEA (0.01) ± 0.001
n.d. n.d. n.d. n.d. n.d. n.d. 0.04 ± 0.002
n.d. 0.04 ± 0.005
n.d. 0.06 ± 0.01
n.d. 0.02 ± 0.0004
n.d. n.d.
∑PFCs 24.43 ±
1.38 17.34 ± 0.94
16.18 ± 1.25
13.88 ± 0.60
12.06 ± 0.75
12.00 ± 1.26
13.63 ± 2.03
15.39 ± 0.59
12.65 ± 0.49
16.03 ± 0.29
21.94 ± 1.82
25.82 ± 1.68
31.18 ± 2.05
14.51 ± 0.99
17.17 ± 0.93
16.50 ± 0.61
a Values in brackets are between MDL and MQL and are not included in the sum concentrations. n.d. = not detected; b mean and standard deviation of a duplicate sample; c have to be considered as estimates, because no standards were available for this compound.

Supplementary material
141
Table S3. Concentrations and standard deviation of PFCs in ng per litre surface water from sampling station 17 to 32 in the German Bight a
Analyte 17 18 19 20 21 22 23 24 25 26 27 28 29 b 30 31 32
PFBS 7.32 ± 0.76
7.76 ± 0.16
9.21 ± 0.37
11.43 ± 0.06
4.78 ± 0.22
10.56 ± 1.05
6.18 ± 0.20
17.67 ± 1.58
5.14 ± 0.18
4.20 ± 0.05
4.27 ± 0.21
5.72 ± 0.23
4.48 ± 1.55
3.38 ± 0.13
3.72 ± 0.07
3.48 ± 0.07
PFPS c 0.15 ± 0.01
0.30 ± 0.04
0.16 ± 0.02
0.21 ± 0.02
0.79 ± 0.04
0.86 ± 0.01
0.51 ± 0.01
n.d. 0.15 ± 0.004
0.10 ± 0.01
0.08 ± 0.01
0.10 ± 0.0004
0.17 ± 0.04
n.d. n.d. 0.13 ± 0.03
PFHxS 0.46 ± 0.02
0.45 ± 0.02
0.38 ± 0.001
0.38 ± 0.02
0.98 ± 0.04
1.13 ± 0.04
0.75 ± 0.04
0.59 ± 0.06
0.30 ± 0.005
0.22 ± 0.0003
0.27 ± 0.02
0.29 ± 0.02
0.24 ± 0.02
0.26 ± 0.2
0.26 ± 0.02
0.27 ± 0.04
PFOS 0.99 ± 0.19
1.44 ± 0.02
1.33 ± 0.04
1.29 ± 0.11
3.95 ± 0.51
3.04 ± 0.20
2.44 ± 0.18
1.75 ± 0.03
1.13 ± 0.04
0.88 ± 0.02
1.25 ± 0.01
0.86 ± 0.08
0.74 ± 0.01
1.34 ± 0.07
1.27 ± 0.04
1.40 ± 0.10
PFNS c n.d. n.d. n.d. n.d. n.d. n.d. n.d. n.d. n.d. n.d. n.d. n.d. n.d. n.d. n.d. n.d.
6:2 FTS n.d. n.d. 0.73 ± 0.05
n.d. n.d. n.d. n.d. n.d. n.d. 0.32 ± 0.01
n.d. 0.32 ± 0.01
n.d. n.d. n.d. n.d.
PFPA 0.98 ± 0.02
0.45 ± 0.04
0.53 ± 0.01
0.49 ± 0.11
0.33 ± 0.01
n.d. 0.36 ± 0.02
2.20 ± 0.31
0.57 ± 0.02
n.d. 0.34 ± 0.0005
0.96 ± 0.03
0.54 ± 0.23
0.70 ± 0.03
0.46 ± 0.05
0.52 ± 0.01
PFHxA 0.91 ± 0.10
0.83 ± 0.02
0.84 ± 0.01
0.94 ± 0.02
2.47 ± 0.08
2.28 ± 0.09
1.58 ± 0.03
1.29 ± 0.25
0.72 ± 0.01
0.47 ± 0.04
0.53 ± 0.05
0.61 ± 0.01
0.80 ± 0.04
0.71 ± 0.001
0.74 ± 0.04
0.66 ± 0.02
PFHpA 0.90 ± 0.07
0.54 ± 0.02
0.66 ± 0.03
0.58 ± 0.04
0.83 ± 0.02
1.02 ± 0.03
0.69 ± 0.01
0.80 ± 0.08
0.36 ± 0.03
0.36 ± 0.005
0.31 ± 0.004
0.59 ± 0.04
0.40 ± 0.07
0.41 ± 0.04
0.35 ± 0.01
0.40 ± 0.01
PFOA 4.85 ± 0.08
4.03 ± 0.16
4.11 ± 0.03
3.91 ± 0.09
7.43 ± 0.55
6.24 ± 0.31
5.79 ± 0.23
4.31 ± 0.63
3.74 ± 0.02
2.67 ± 0.01
2.96 ± 0.07
3.99 ± 0.39
3.02 ± 0.23
3.37 ± 0.08
2.95 ± 0.04
3.21 ± 0.02
PFNA 0.14 ± 0.0004
0.22 ± 0.01
0.19 ± 0.01
0.22 ± 0.01
0.82 ± 0.08
0.57 ± 0.01
0.49 ± 0.02
0.21 ± 0.001
0.21 ± 0.01
0.11 ± 0.003
0.17 ± 0.01
0.10 ± 0.02
0.14 ± 0.02
0.25 ± 0.02
0.24 ± 0.03
0.28 ± 0.07
PFDA 0.09 ± 0.01
0.08 ± 0.01
0.05 ± 0.01
0.10 ± 0.01
0.19 ± 0.002
0.11 ± 0.001
0.11 ± 0.003
n.d. 0.09 ± 0.01
(0.02) ± 0.01
(0.04) ± 0.005
0.06 ± 0.01
0.05 ± 0.03
0.08 ± 0.01
0.08 ± 0.002
0.09 ± 0.002
PFUnDA 0.02 ± 0.01
0.02 ± 0.01
0.02 ± 0.0001
0.03 ± 0.01
0.03 ± 0.01
0.02 ± 0.001
0.02 ± 0.002
n.d. 0.03 ± 0.002
n.d. n.d. n.d. 0.02 ± 0.01
0.02 ± 0.01
n.d. 0.02 ± 0.004
PFDoDA 0.01 ± 0.003
0.01 ± 0.002
n.d. n.d. 0.01 ± 0.002
n.d. n.d. n.d. 0.03 ± 0.01
n.d. n.d. n.d. n.d. n.d. 0.01 ± 0.002
n.d.
FOSA 0.04 ± 0.003
0.02 ± 0.002
n.d. n.d. 0.04 ± 0.001
0.03 ± 0.01
n.d. n.d. 0.02 ± 0.001
n.d. 0.01 ± 0.03
0.04 ± 0.004
n.d. n.d. n.d. n.d.
MeFBSA n.d. n.d. n.d. n.d. n.d. n.d. n.d. n.d. 0.46 ± 0.17
n.d. n.d. n.d. n.d. n.d. n.d. n.d.
MeFBSE n.d. (0.15) ± 0.001
n.d. n.d. (0.14) ±
0.01 0.36 ± 0.01
(0.22) ± 0.01
n.d. (0.14) ±
0.01 n.d.
(0.09) ± 0.01
n.d. n.d. n.d. n.d. (0.10) ±
0.01
FDUEA (0.01) ±
0.01 n.d. n.d. n.d.
0.05 ± 0.003
0.05 ± 0.0002
n.d. n.d. n.d. n.d. n.d. n.d. n.d. n.d. n.d. n.d.
∑PFCs 16.87 ±
1.29 16.30 ±
0.52 18.23 ±
0.58 19.56 ±
0.49 22.83 ±
1.56 26.27 ±
1.75 19.14 ±
0.76 28.82 ±
2.95 13.08 ±
0.52 9.36 ± 0.16
10.33 ± 0.41
13.65 ± 0.84
10.68 ± 0.88
10.51 ± 0.42
10.08 ± 0.30
10.57 ± 0.39
a Values in brackets are between MDL and MQL and are not included in the sum concentrations; n.d. = not detected; b mean and standard deviation of a duplicate sample; c have to be considered as estimates, because no standards were available for this compound.

Supplementary material
142
Table S4. Concentrations and standard deviation of PFCs in ng per litre surface water from sampling station 33 to 48 in the German Bight a
Analyte 33 34 35 b 36 37 38 39 40 41 42 43 b 44 45 46 47 48
PFBS 4.11 ± 0.21
4.22 ± 0.23
4.01 ± 0.07
3.97 ± 0.03
5.49 ± 0.56
4.45 ± 0.15
4.67 ± 0.19
5.38 ± 0.39
4.79 ± 0.41
12.44 ± 2.60
3.60 ± 0.43
5.00 ± 1.69
7.85 ± 1.75
8.78 ± 1.37
8.00 ± 1.6
11.93 ± 0.39
PFPS c n.d. n.d. n.d. 0.16 ± 0.02
0.12 ± 0.01
(0.06) ± 0.09
0.16 ± 0.01
n.d. 0.14 ± 0.002
n.d. n.d. 0.11 ± 0.07
n.d. n.d. n.d. n.d.
PFHxS 0.26 ± 0.04
0.31 ± 0.01
0.29 ± 0.01
0.26 ± 0.06
0.33 ± 0.01
0.30 ± 0.01
0.26 ± 0.04
0.29 ± 0.002
0.30 ± 0.02
0.47 ± 0.15
0.37 ± 0.04
0.24 ± 0.02
0.24 ± 0.03
0.50 ± 0.01
0.43 ± 0.02
0.67 ± 0.01
PFOS 1.42 ± 0.07
1.04 ± 0.06
0.98 ± 0.12
1.53 ± 0.35
0.74 ± 0.04
0.80 ± 0.07
1.02 ± 0.02
1.12 ± 0.06
0.95 ± 0.06
1.82 ± 0.09
1.04 ± 0.11
0.86 ± 0.23
1.18 ± 0.17
1.44 ± 0.003
1.63 ± 0.14
1.83 ± 0.13
PFNS c n.d. n.d. 0.11 ± 0.01
n.d. n.d. n.d. n.d. n.d. n.d. n.d. n.d. n.d. n.d. n.d. n.d. n.d.
6:2 FTS n.d. n.d. n.d. n.d. n.d. n.d. n.d. n.d. n.d. n.d. n.d. n.d. n.d. n.d. n.d. n.d.
PFPA 0.72 ± 0.08
0.46 ± 0.11
0.39 ± 0.03
0.43 ± 0.07
0.91 ± 0.05
0.33 ± 0.02
0.33 ± 0.005
(0.13) ± 0.03
0.33 ± 0.01
1.21 ± 0.17
0.70 ± 0.07
2.02 ± 0.06
2.23 ± 0.27
2.04 ± 0.28
1.85 ± 0.01
PFHxA 0.81 ± 0.02
0.86 ± 0.01
0.80 ± 0.01
0.78 ± 0.04
0.91 ± 0.03
0.83 ± 0.04
0.83 ± 0.03
0.85 ± 0.03
0.90 ± 0.03
1.16 ± 0.14
1.06 ± 0.04
0.96 ± 0.12
0.96 ± 0.08
1.09 ± 0.01
1.21 ± 0.03
1.51 ± 0.05
PFHpA 0.42 ± 0.01
0.38 ± 0.02
0.37 ± 0.02
0.37 ± 0.01
0.70 ± 0.07
0.41 ± 0.01
0.40 ± 0.01
0.49 ± 0.05
0.42 ± 0.02
1.19 ± 0.05
0.58 ± 0.04
0.76 ± 0.10
0.74 ± 0.11
0.74 ± 0.002
0.89 ± 0.06
1.27 ± 0.01
PFOA 3.39 ± 0.12
3.29 ± 0.06
3.05 ± 0.16
3.20 ± 0.17
2.91 ± 0.09
3.42 ± 0.10
3.67 ± 0.12
3.36 ± 0.15
3.93 ± 0.002
4.71 ± 0.31
2.92 ± 0.06
3.04 ± 0.05
3.14 ± 0.31
3.34 ± 0.06
3.64 ± 0.12
4.26 ± 0.29
PFNA 0.27 ± 0.02
0.23 ± 0.01
0.20 ± 0.02
0.29 ± 0.02
0.13 ± 0.02
0.23 ± 0.004
0.28 ± 0.04
0.17 ± 0.001
0.26 ± 0.01
0.50 ± 0.02
0.20 ± 0.03
0.17 ± 0.07
0.26 ± 0.02
0.26 ± 0.02
0.24 ± 0.001
0.30 ± 0.02
PFDA 0.09 ± 0.02
0.07 ± 0.01
0.08 ± 0.03
0.14 ± 0.003
(0.03) ± 0.003
0.06 ± 0.002
0.09 ± 0.003
(0.03) ± 0.002
0.08 ± 0.003
0.15 ± 0.03
n.d. (0.03) ±
0.01 0.06 ± 0.003
0.08 ± 0.01
0.10 ± 0.005
0.13 ± 0.03
PFUnDA 0.03 ± 0.001
0.03 ± 0.004
0.04 ± 0.02
0.07 ± 0.01
n.d. (0.01) ± 0.0002
0.02 ± 0.01
n.d. (0.01) ± 0.002
n.d. n.d. n.d. n.d. n.d. n.d. n.d.
PFDoDA n.d. n.d. n.d. 0.05 ± 0.002
n.d. n.d. n.d. n.d. n.d. n.d. n.d. n.d. n.d. n.d. n.d. n.d.
FOSA n.d. n.d. n.d. n.d. n.d. n.d. n.d. n.d. 0.02 ± 0.001
0.07 ± 0.01
n.d. 0.02 ± 0.005
n.d. 0.03 ± 0.02
n.d. n.d.
MeFBSA n.d. n.d. n.d. n.d. n.d. n.d. n.d. n.d. n.d. n.d. n.d. n.d. n.d. n.d. n.d. n.d.
MeFBSE (0.16) ± 0.001
(0.10) ± 0.004
(0.10) ± 0.02
(0.22) ± 0.03
n.d. n.d. n.d. n.d. n.d. n.d. n.d. n.d. n.d. n.d. n.d. n.d.
FDUEA n.d. n.d. n.d. 0.03 ± 0.04
n.d. n.d. n.d. n.d. n.d. n.d. n.d. n.d. n.d. n.d. n.d. n.d.
∑PFCs 11.67 ±
0.60 10.98 ±
0.51 10.42 ±
0.45 11.50 ±
0.85 12.28 ±
0.88 10.92 ±
0.58 11.73 ±
0.47 11.80 ±
0.72 12.14 ±
0.57 22.50 ±
3.41 10.98 ±
0.93 11.89 ±
2.19 16.46 ±
2.53 18.49 ±
1.76 18.19 ±
2.25 23.74 ±
0.94 a Values in brackets are between MDL and MQL and are not included in the sum concentrations; n.d. = not detected; b mean and standard deviation of a duplicate sample; c have to be considered as estimates, because no standards were available for this compound.
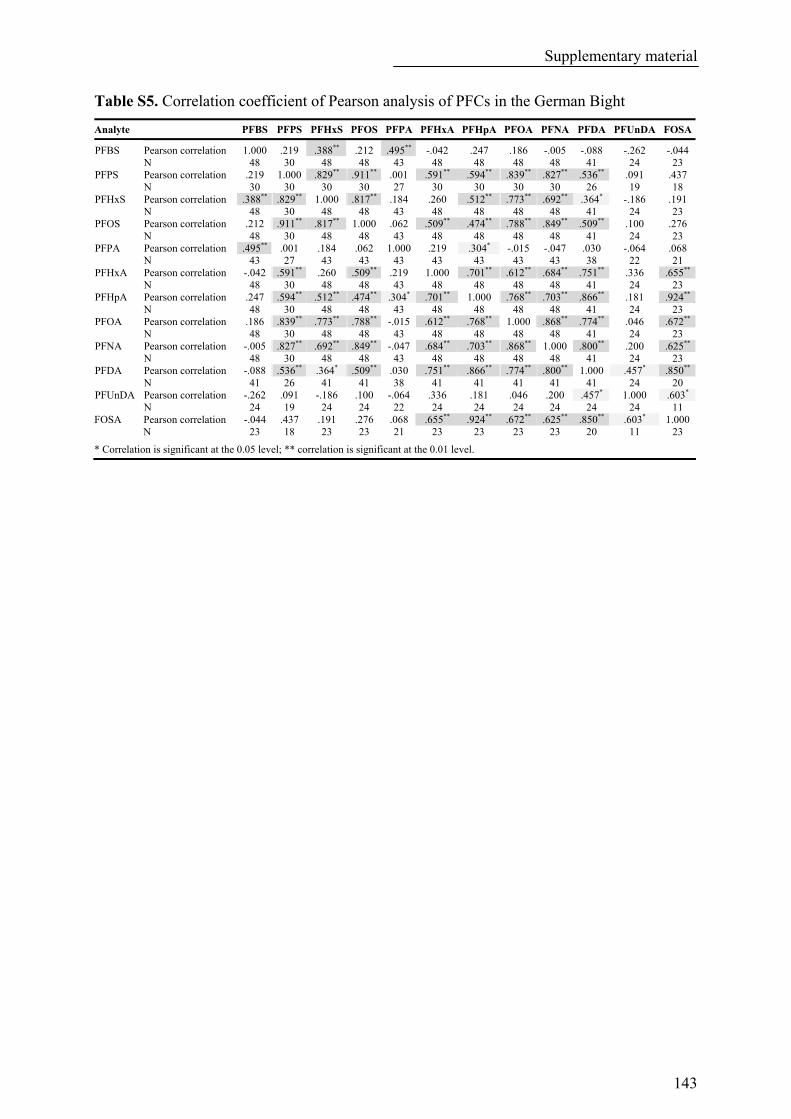
Supplementary material
143
Table S5. Correlation coefficient of Pearson analysis of PFCs in the German Bight
Analyte PFBS PFPS PFHxS PFOS PFPA PFHxA PFHpA PFOA PFNA PFDA PFUnDA FOSA
Pearson correlation 1.000 .219 .388** .212 .495** -.042 .247 .186 -.005 -.088 -.262 -.044 PFBS N 48 30 48 48 43 48 48 48 48 41 24 23 Pearson correlation .219 1.000 .829** .911** .001 .591** .594** .839** .827** .536** .091 .437 PFPS N 30 30 30 30 27 30 30 30 30 26 19 18 Pearson correlation .388** .829** 1.000 .817** .184 .260 .512** .773** .692** .364* -.186 .191 PFHxS N 48 30 48 48 43 48 48 48 48 41 24 23 Pearson correlation .212 .911** .817** 1.000 .062 .509** .474** .788** .849** .509** .100 .276 PFOS N 48 30 48 48 43 48 48 48 48 41 24 23 Pearson correlation .495** .001 .184 .062 1.000 .219 .304* -.015 -.047 .030 -.064 .068 PFPA N 43 27 43 43 43 43 43 43 43 38 22 21 Pearson correlation -.042 .591** .260 .509** .219 1.000 .701** .612** .684** .751** .336 .655**PFHxA N 48 30 48 48 43 48 48 48 48 41 24 23 Pearson correlation .247 .594** .512** .474** .304* .701** 1.000 .768** .703** .866** .181 .924**PFHpA N 48 30 48 48 43 48 48 48 48 41 24 23 Pearson correlation .186 .839** .773** .788** -.015 .612** .768** 1.000 .868** .774** .046 .672**PFOA N 48 30 48 48 43 48 48 48 48 41 24 23 Pearson correlation -.005 .827** .692** .849** -.047 .684** .703** .868** 1.000 .800** .200 .625**PFNA N 48 30 48 48 43 48 48 48 48 41 24 23 Pearson correlation -.088 .536** .364* .509** .030 .751** .866** .774** .800** 1.000 .457* .850**PFDA N 41 26 41 41 38 41 41 41 41 41 24 20 Pearson correlation -.262 .091 -.186 .100 -.064 .336 .181 .046 .200 .457* 1.000 .603* PFUnDA
N 24 19 24 24 22 24 24 24 24 24 24 11 FOSA Pearson correlation -.044 .437 .191 .276 .068 .655** .924** .672** .625** .850** .603* 1.000 N 23 18 23 23 21 23 23 23 23 20 11 23
* Correlation is significant at the 0.05 level; ** correlation is significant at the 0.01 level.

Supplementary material
144
Table S6. Locations, sampling time and water temperature of water sampling from cruises of the research vessels Maria S. Merian (15° W-52° W) and Polarstern (46° N-26° S) in the Atlantic Ocean
Station number Sampling date UTC timea Latitude Longitude Water temperature [°C]
1 29.10.2007 11:45 N46° 17.257' W06° 29.386' 17.3 2 29.10.2007 18:09 N45° 50.129' W06° 34.129' 17.3 3 30.10.2007 9:48 N45° 50.786' W06° 38.372' 17.4 4 30.10.2007 15:07 N45° 15.217' W07° 28.793' 17.3 5 30.10.2007 19:54 N44° 32.711' W08° 29.306' 17.3 6 31.10.2007 6:02 N42° 45.431' W10° 09.153' 16.8 7 31.10.2007 13:58 N42° 09.180' W10° 39.598' 17.5 8 31.10.2007 21:30 N40° 56.412' W10° 53.255' 17.9 9 01.11.2007 6:05 N39° 21.663' W11° 27.465' 18.5
10 01.11.2007 14:00 N37° 53.236' W12° 00.314 19.9 11 01.11.2007 22:03 N36° 18.403' W12° 34.709' 19.9 12 02.11.2007 6:04 N34° 51.085' W13° 05.819' 21.1 13 02.11.2007 13:58 N33° 49.468' W14° 11.388' 21.7 14 02.11.2007 21:57 N32° 21.020' W14° 33.162' 21.9 15 03.11.2007 6:00 N30° 48.669' W14° 28.321' 22.1 16 03.11.2007 20:41 N29° 26.399' W15° 08.289' 22.4 17 04.11.2007 14:27 N27° 26.048' W15° 51.313' 22.9 18 04.11.2007 21:05 N26° 40.036' W17° 13.217' 23.6 19 05.11.2007 7:26 N25° 29.587' W19° 17.573' 23.8 20 05.11.2007 18:38 N24° 41.732' W20° 44.640' 24.0 21 06.11.2007 7:18 N22° 30.657' W20° 51.172' 23.5 22 06.11.2007 17:31 N20° 09.986' W20° 58.390' 23.9 23 07.11.2007 7:10 N17° 09.137' W21° 07.505' 25.2 24 07.11.2007 18:30 N14° 37.361' W21° 11.231' 27.4 25 08.11.2007 7:44 N11° 47.590' W20° 26.967' 28.7 26 09.11.2007 6:45 N10° 11.867' W20° 03.115' 28.7 27 09.11.2007 20:10 N08° 06.418' W18° 50.586' 29.2 28 10.11.2007 6:07 N06° 41.328' W17° 39.397' 29.0 29 10.11.2007 18:13 N05° 02.993' W16° 17.380' 28.8 30 11.11.2007 6:14 N03° 30.652' W15° 00.554' 28.1 31 12.11.2007 8:02 N02° 15.446' W13° 20.527' 27.4 32 12.11.2007 18:13 N01° 13.523' W11° 57.961' 26.2 33 13.11.2007 10:45 S00° 29.615' W09° 40.469' 25.3 34 14.11.2007 14:30 S03° 59.562' W06° 44.382' 25.7 35 15.11.2007 17:10 S07° 26.390' W04° 08.697' 24.0 36 16.11.2007 13:36 S10° 38.548' W01° 39.086' 22.4 37 17.11.2007 17:28 S13° 21.221' E00° 37.067' 21.0 38 18.11.2007 12:38 S15° 49.494' E02° 22.162' 19.8 39 19.11.2007 12:41 S19° 27.539' E05° 12.842' 19.7 40 20.11.2007 11:28 S22° 59.804' E08° 02.746' 18.9 41 21.11.2007 10:15 S25° 16.359' E09° 38.236' 18.3 42 22.11.2007 6:36 S26° 29.940' E10° 37.656' 17.9 A 26.04.2007 19:38 N47° 31.530' W52° 01.455' 0.2 B 25.04.2007 15:40 N44° 18.728' W50° 05.773' 3.7 C 27.04.2007 17:00 N47° 06.103' W44° 57.691' 4.1 D 28.04.2007 16:15 N47° 01.698' W43° 09.601' 4.9 E 29.04.2007 15:20 N46° 59.893' W42° 54.675' 6.1 F 30.04.2007 15:00 N46° 58.500' W41° 01.986' 13.8 G 24.04.2007 14:06 N42° 42.012' W47° 30.021' 8.2 H 23.04.2007 20:00 N42° 06.548' W45° 11.957' 16.3 I 22.04.2007 22:40 N42° 47.637' W42° 19.648' 16.1 J 21.04.2007 17:10 N43° 49.982' W38° 37.856' 15.6 K 20.04.2007 14:00 N44° 51.484' W34° 59.425' 15.0 L 19.04.2007 12:35 N46° 59.028' W31° 56.440' 13.6 M 18.04.2007 19:29 N46° 45.984' W30° 32.736' 13.3 N 17.04.2007 23:30 N42° 41.516' W27° 49.606' 14.8 O 17.04.2007 16:55 N41° 32.530' W27° 05.618' 15.1 P 16.04.2007 21:15 N37° 42.467' W24° 38.880' 16.5 Q 15.04.2007 21:45 N34° 06.428' W20° 59.002' 18.8 R 15.04.2007 09:50 N32° 28.675' W19° 22.527' 18.4
a UTC = universal time coordinated.

Supplementary material
145
Table S7. Matrix spike recovery values of the IS and relative standard deviation (RSD) (%) for the dissolved and particulate phase determined at two different spiking levels (5 ng/L and 20 ng/L)
Recovery [%] Dissolved phase Particulate phase 5 ng/L, n = 4 20 ng/L , n = 4 5 ng/L , n = 4 20 ng/L , n = 4 IS Mean RSD Mean RSD Mean RSD Mean RSD
[18O2]-PFHxS 66 4.5 64 3.4 87 15.2 83 4.8 [13C4]-PFOS 57 9.9 55 5.7 98 8.1 102 7.9 [13C4]-PFOSi 67 4.9 61 3.5 79 11.7 72 0.7 [13C2]-PFHxA 54 4.5 53 6.1 124 9.2 110 6.7 [13C4]-PFOA 54 3.9 57 7.7 105 7.4 111 7.9 [13C4]-PFNA 67 14.5 57 4.9 109 12.8 103 17.0 [13C4]-PFDA 80 9.3 87 2.4 77 6.7 70 3.2 [13C2]-PFUnDA 59 14.5 60 2.6 110 1.0 99 8.2 [13C2]-PFDoDA 52 12.2 53 4.6 110 4.0 101 7.9 d3-MeFOSA 24 21.3 27 6.7 52 2.9 50 3.5 d5-EtFOSA 34 20.9 36 5.1 56 1.0 56 0.7 d7-MeFOSE 35 17.6 37 4.3 68 5.5 69 7.2 d9-EtFOSE 32 17.7 33 2.0 67 2.3 63 4.4 [13C2]-FHEA 69 10.9 76 13.0 95 9.7 83 9.2 [13C2]-FOEA 50 14.9 53 7.5 74 11.5 65 1.6 [13C2]-FDEA 56 13.9 55 4.1 116 9.5 99 4.6 [13C2]-FHUEA 90 4.0 87 4.3 105 13.0 92 9.8 [13C2]-FOUEA 65 8.1 62 2.9 76 11.7 64 4.1 [13C2]-FDUEA 54 17.5 54 4.0 115 5.3 98 8.0

Supplementary material
146
Table S8. Individual PFC concentrations (pg/L) for cruises of the research vessels Maria S. Merian (15° W-52° W) and Polarstern (46° N-26° S) in the Atlantic Ocean a
Station number PFBS PFOS FOSA PFHxA PFHpA PFOA PFNA ∑PFC
1 60 291 302 127 <5.9 229 107 1115 2 7.1 114 307 87 <5.9 209 100 8243 16 40 97 82 <5.9 99 65 3994 45 <10 183 83 <5.9 147 69 5275 17 <10 143 88 <5.9 97 63 4096 <1.6 <10 104 77 <5.9 115 73 3687 14 <10 97 83 <5.9 94 65 3528 <1.6 <10 71 84 <5.9 108 68 3329 7.2 <10 32 86 <5.9 80 66 271
10 <1.6 <10 44 81 <5.9 88 52 26611 34 <10 37 11 45 65 31 22312 <1.6 <10 39 17 46 62 16 18113 40 <10 <17 7 47 69 33 19614 32 <10 45 12 49 72 23 23215 29 <10 64 <5.7 43 20 13 17016 31 <10 37 <5.7 47 47 29 19117 30 <10 <17 <5.7 45 42 25 14218 <1.6 <10 <17 <5.7 45 40 11 9619 20 <10 <17 <5.7 43 77 13 15320 <1.6 <10 67 <5.7 45 25 38 17521 <1.6 <10 110 <5.7 <5.9 20 40 17122 <1.6 <10 72 <5.7 8.5 <4.0 42 12323 <1.6 <10 <17 <5.7 <5.9 <4.0 28 2824 <1.6 <10 60 <5.7 <5.9 <4.0 29 8925 <1.6 <10 <17 <5.7 9.7 87 29 12626 <1.6 60 <17 <5.7 8.9 82 35 18727 <1.6 <10 <17 <5.7 <5.9 65 30 9528 <1.6 <10 52 <5.7 <5.9 <4.0 31 8229 <1.6 <10 <17 <5.7 <5.9 <4.0 33 3330 <1.6 <10 <17 <5.7 <5.9 <4.0 27 2731 <1.6 <10 56 <5.7 <5.9 <4.0 <5.1 5632 <1.6 <10 37 <5.7 <5.9 <4.0 <5.1 3733 <1.6 <10 53 <5.7 <5.9 <4.0 <5.1 5334 <1.6 <10 41 <5.7 <5.9 <4.0 <5.1 4135 <1.6 <10 <17 <5.7 <5.9 <4.0 <5.1 n.a.36 <1.6 <10 <17 <5.7 <5.9 <4.0 <5.1 n.a.37 <1.6 <10 <17 <5.7 <5.9 <4.0 <5.1 n.a.38 <1.6 <10 <17 <5.7 <5.9 <4.0 <5.1 n.a.39 <1.6 <10 <17 <5.7 <5.9 <4.0 <5.1 n.a.40 <1.6 <10 <17 <5.7 <5.9 <4.0 <5.1 n.a.41 <1.6 <10 <17 <5.7 <5.9 <4.0 <5.1 n.a.42 <1.6 <10 <17 <5.7 <5.9 <4.0 <5.1 n.a.A <1.6 <10 <17 <5.7 36 81 <5.1 116B <1.6 51 <17 <5.7 <5.9 26 <5.1 77C <1.6 <10 <17 <5.7 <5.9 40 <5.1 40D <1.6 <10 <17 <5.7 <5.9 35 <5.1 36E <1.6 <10 <17 <5.7 <5.9 <4.0 <5.1 n.a.F <1.6 <10 <17 <5.7 <5.9 <4.0 6.6 7G <1.6 <10 <17 <5.7 <5.9 73 <5.1 73H <1.6 <10 <17 <5.7 <5.9 52 <5.1 52I <1.6 <10 <17 <5.7 <5.9 87 <5.1 87J <1.6 69 <17 <5.7 <5.9 48 <5.1 117K <1.6 <10 <17 <5.7 <5.9 72 <5.1 72L <1.6 <10 <17 <5.7 <5.9 73 <5.1 73M <1.6 <10 <17 <5.7 104 <4.0 <5.1 104N <1.6 <10 <17 <5.7 80 <4.0 <5.1 80O <1.6 <10 <17 <5.7 14 82 <5.1 96P <1.6 <10 <17 <5.7 26 121 <5.1 147Q <1.6 <10 <17 51 <5.9 118 <5.1 169R <1.6 54 <17 51 <5.9 86 <5.1 191
a <x below the respective method quantification limit (MQL); n.a. = not available.
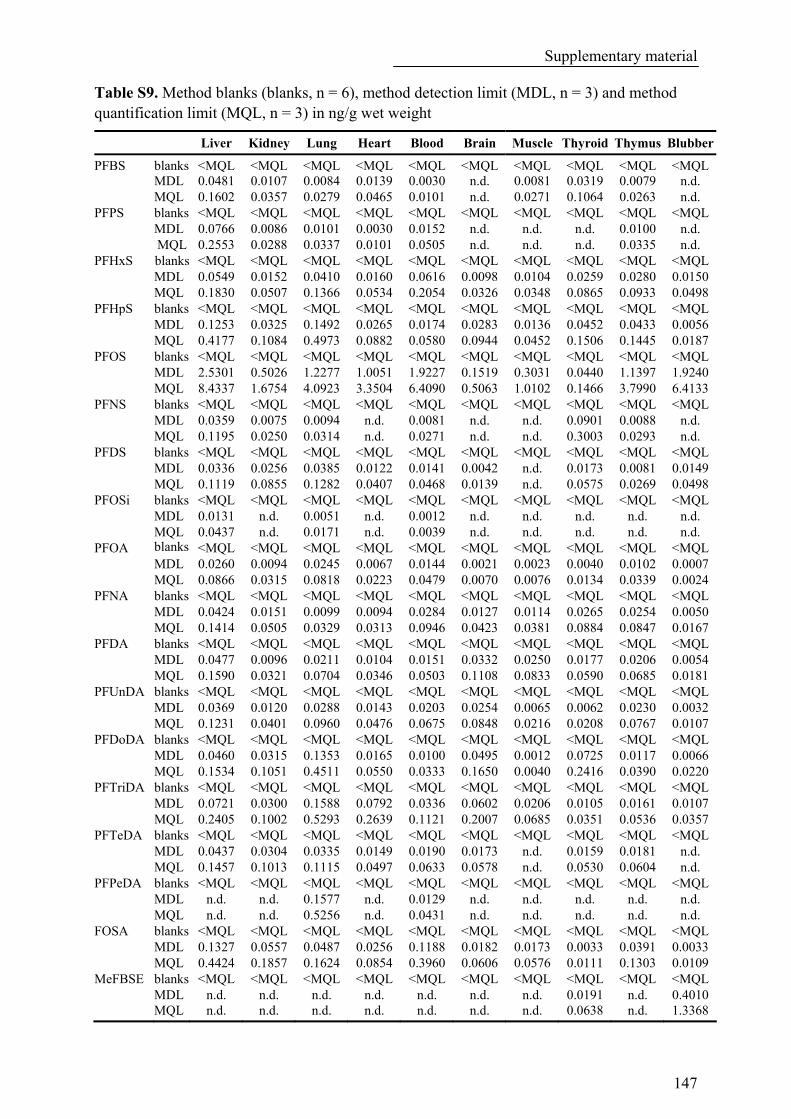
Supplementary material
147
Table S9. Method blanks (blanks, n = 6), method detection limit (MDL, n = 3) and method quantification limit (MQL, n = 3) in ng/g wet weight
Liver Kidney Lung Heart Blood Brain Muscle Thyroid Thymus Blubber
PFBS blanks <MQL <MQL <MQL <MQL <MQL <MQL <MQL <MQL <MQL <MQL MDL 0.0481 0.0107 0.0084 0.0139 0.0030 n.d. 0.0081 0.0319 0.0079 n.d. MQL 0.1602 0.0357 0.0279 0.0465 0.0101 n.d. 0.0271 0.1064 0.0263 n.d. PFPS blanks <MQL <MQL <MQL <MQL <MQL <MQL <MQL <MQL <MQL <MQL MDL 0.0766 0.0086 0.0101 0.0030 0.0152 n.d. n.d. n.d. 0.0100 n.d. MQL 0.2553 0.0288 0.0337 0.0101 0.0505 n.d. n.d. n.d. 0.0335 n.d. PFHxS blanks <MQL <MQL <MQL <MQL <MQL <MQL <MQL <MQL <MQL <MQL MDL 0.0549 0.0152 0.0410 0.0160 0.0616 0.0098 0.0104 0.0259 0.0280 0.0150 MQL 0.1830 0.0507 0.1366 0.0534 0.2054 0.0326 0.0348 0.0865 0.0933 0.0498 PFHpS blanks <MQL <MQL <MQL <MQL <MQL <MQL <MQL <MQL <MQL <MQL MDL 0.1253 0.0325 0.1492 0.0265 0.0174 0.0283 0.0136 0.0452 0.0433 0.0056 MQL 0.4177 0.1084 0.4973 0.0882 0.0580 0.0944 0.0452 0.1506 0.1445 0.0187 PFOS blanks <MQL <MQL <MQL <MQL <MQL <MQL <MQL <MQL <MQL <MQL MDL 2.5301 0.5026 1.2277 1.0051 1.9227 0.1519 0.3031 0.0440 1.1397 1.9240 MQL 8.4337 1.6754 4.0923 3.3504 6.4090 0.5063 1.0102 0.1466 3.7990 6.4133 PFNS blanks <MQL <MQL <MQL <MQL <MQL <MQL <MQL <MQL <MQL <MQL MDL 0.0359 0.0075 0.0094 n.d. 0.0081 n.d. n.d. 0.0901 0.0088 n.d. MQL 0.1195 0.0250 0.0314 n.d. 0.0271 n.d. n.d. 0.3003 0.0293 n.d. PFDS blanks <MQL <MQL <MQL <MQL <MQL <MQL <MQL <MQL <MQL <MQL MDL 0.0336 0.0256 0.0385 0.0122 0.0141 0.0042 n.d. 0.0173 0.0081 0.0149 MQL 0.1119 0.0855 0.1282 0.0407 0.0468 0.0139 n.d. 0.0575 0.0269 0.0498 PFOSi blanks <MQL <MQL <MQL <MQL <MQL <MQL <MQL <MQL <MQL <MQL MDL 0.0131 n.d. 0.0051 n.d. 0.0012 n.d. n.d. n.d. n.d. n.d. MQL 0.0437 n.d. 0.0171 n.d. 0.0039 n.d. n.d. n.d. n.d. n.d. PFOA blanks <MQL <MQL <MQL <MQL <MQL <MQL <MQL <MQL <MQL <MQL MDL 0.0260 0.0094 0.0245 0.0067 0.0144 0.0021 0.0023 0.0040 0.0102 0.0007 MQL 0.0866 0.0315 0.0818 0.0223 0.0479 0.0070 0.0076 0.0134 0.0339 0.0024 PFNA blanks <MQL <MQL <MQL <MQL <MQL <MQL <MQL <MQL <MQL <MQL MDL 0.0424 0.0151 0.0099 0.0094 0.0284 0.0127 0.0114 0.0265 0.0254 0.0050 MQL 0.1414 0.0505 0.0329 0.0313 0.0946 0.0423 0.0381 0.0884 0.0847 0.0167 PFDA blanks <MQL <MQL <MQL <MQL <MQL <MQL <MQL <MQL <MQL <MQL MDL 0.0477 0.0096 0.0211 0.0104 0.0151 0.0332 0.0250 0.0177 0.0206 0.0054 MQL 0.1590 0.0321 0.0704 0.0346 0.0503 0.1108 0.0833 0.0590 0.0685 0.0181 PFUnDA blanks <MQL <MQL <MQL <MQL <MQL <MQL <MQL <MQL <MQL <MQL MDL 0.0369 0.0120 0.0288 0.0143 0.0203 0.0254 0.0065 0.0062 0.0230 0.0032 MQL 0.1231 0.0401 0.0960 0.0476 0.0675 0.0848 0.0216 0.0208 0.0767 0.0107 PFDoDA blanks <MQL <MQL <MQL <MQL <MQL <MQL <MQL <MQL <MQL <MQL MDL 0.0460 0.0315 0.1353 0.0165 0.0100 0.0495 0.0012 0.0725 0.0117 0.0066 MQL 0.1534 0.1051 0.4511 0.0550 0.0333 0.1650 0.0040 0.2416 0.0390 0.0220 PFTriDA blanks <MQL <MQL <MQL <MQL <MQL <MQL <MQL <MQL <MQL <MQL MDL 0.0721 0.0300 0.1588 0.0792 0.0336 0.0602 0.0206 0.0105 0.0161 0.0107 MQL 0.2405 0.1002 0.5293 0.2639 0.1121 0.2007 0.0685 0.0351 0.0536 0.0357 PFTeDA blanks <MQL <MQL <MQL <MQL <MQL <MQL <MQL <MQL <MQL <MQL MDL 0.0437 0.0304 0.0335 0.0149 0.0190 0.0173 n.d. 0.0159 0.0181 n.d. MQL 0.1457 0.1013 0.1115 0.0497 0.0633 0.0578 n.d. 0.0530 0.0604 n.d. PFPeDA blanks <MQL <MQL <MQL <MQL <MQL <MQL <MQL <MQL <MQL <MQL MDL n.d. n.d. 0.1577 n.d. 0.0129 n.d. n.d. n.d. n.d. n.d. MQL n.d. n.d. 0.5256 n.d. 0.0431 n.d. n.d. n.d. n.d. n.d. FOSA blanks <MQL <MQL <MQL <MQL <MQL <MQL <MQL <MQL <MQL <MQL MDL 0.1327 0.0557 0.0487 0.0256 0.1188 0.0182 0.0173 0.0033 0.0391 0.0033 MQL 0.4424 0.1857 0.1624 0.0854 0.3960 0.0606 0.0576 0.0111 0.1303 0.0109 MeFBSE blanks <MQL <MQL <MQL <MQL <MQL <MQL <MQL <MQL <MQL <MQL MDL n.d. n.d. n.d. n.d. n.d. n.d. n.d. 0.0191 n.d. 0.4010
MQL n.d. n.d. n.d. n.d. n.d. n.d. n.d. 0.0638 n.d. 1.3368

Supplementary material
148
Table S10. Absolute (subtraction of background concentration) as well as relative (IS and subtraction of background concentration) recovery values (%) of a seal liver spiked with 10 ng absolute (100 µL of a 0.1 µg/mL solution, n = 3) and allocation of IS for individual PFCs
Absolute recovery [%] a
Relative recovery [%] a
Allocation of the IS
Analyte mean RSD mean RSD PFBS 48 3.7 70 3.7PFHxS 51 7.7 75 7.7PFHpS 78 6.3 115 6.3
[18O2]-PFHxS
PFOS 52 5.0 74 5.0PFDS 46 19.9 65 19.96:2 FTS 83 13.3 116 13.3
[13C4]-PFOS
PFHxSi 90 12.5 109 12.5PFOSi 67 4.1 81 4.1PFDSi 61 6.8 74 6.8
[13C4]-PFOSi
PFBA 88 4.0 88 4.0 [13C4]-PFBA PFPA 64 3.5 92 3.5PFHxA 42 3.6 60 3.6PFHpA 80 11.7 114 11.7
[13C2]-PFHxA
PFOA 77 2.5 87 2.5 [13C4]-PFOA PFNA 54 8.3 120 8.3 [13C5]-PFNA PFDA 94 8.1 122 8.1 [13C2]-PFDA PFUnDA 111 21.8 125 21.8 [13C2]-PFUnDA PFDoDA 129 5.8 127 5.8PFTriDA 93 4.0 92 4.0PFTeDA 122 8.2 120 8.2PFHxDA 57 3.0 56 3.0PFOcDA 65 2.5 64 2.5
[13C2]-PFDoDA
3,7m2-PFOA 108 9.1 121 9.1 [13C4]-PFOA MeFBSA 52 10.5 109 10.5 d3-N-MeFOSA FOSA 44 18.8 62 18.8 [13C4]-PFOS MeFOSA 53 7.2 112 7.2 d3-N-MeFOSA EtFOSA 48 5.4 92 5.4 d5-N-EtFOSA MeFBSE 83 3.1 98 3.1MeFOSE 84 8.0 99 8.0
d7-N-MeFOSE
EtFOSE 72 11.5 135 11.5 d9-N-EtFOSE FHEA 60 7.2 73 7.2 [13C2]-FHEA FOEA 64 7.2 82 7.2 [13C2]-FOEA FDEA 82 0.8 85 0.8 [13C2]-FDEA FHUEA 98 4.7 110 4.7 [13C2]-FHUEA FOUEA 58 3.1 108 3.1 [13C2]-FOUEA FDUEA 111 2.5 105 2.5 [13C2]-FDUEA a Mean recoveries are given with relative standard deviations (RSD).
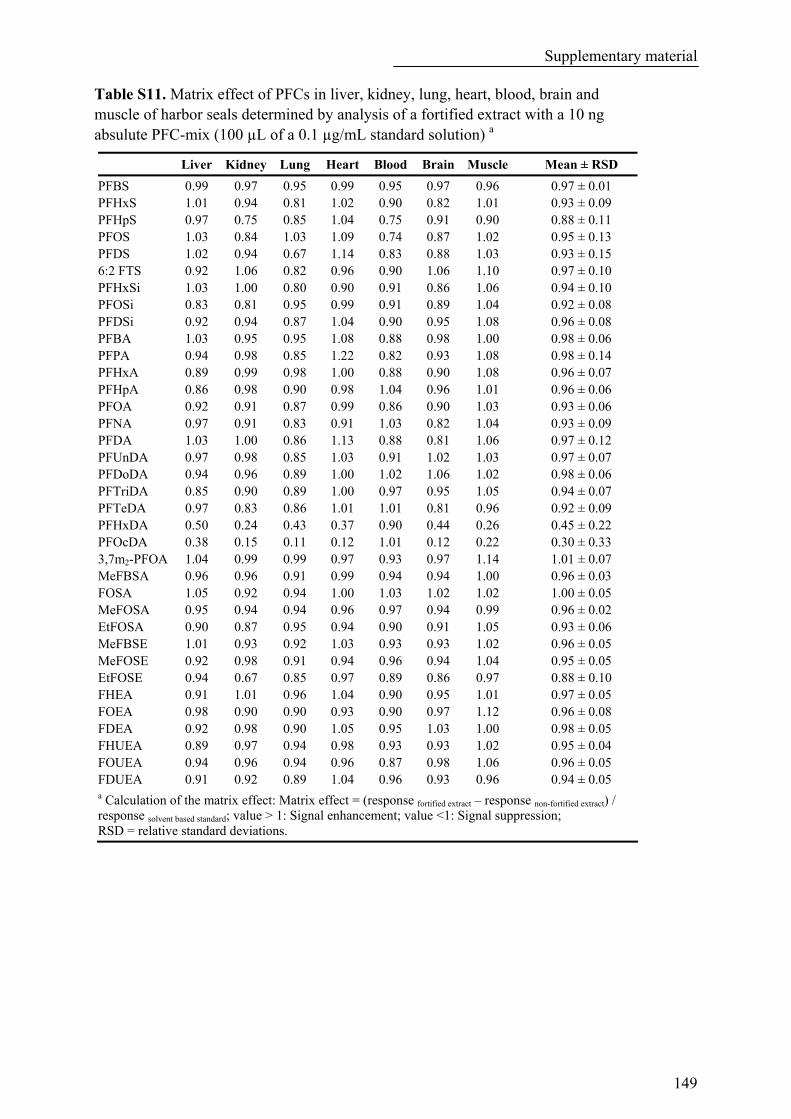
Supplementary material
149
Table S11. Matrix effect of PFCs in liver, kidney, lung, heart, blood, brain and muscle of harbor seals determined by analysis of a fortified extract with a 10 ng absulute PFC-mix (100 µL of a 0.1 µg/mL standard solution) a
Liver Kidney Lung Heart Blood Brain Muscle Mean ± RSD
PFBS 0.99 0.97 0.95 0.99 0.95 0.97 0.96 0.97 ± 0.01 PFHxS 1.01 0.94 0.81 1.02 0.90 0.82 1.01 0.93 ± 0.09 PFHpS 0.97 0.75 0.85 1.04 0.75 0.91 0.90 0.88 ± 0.11 PFOS 1.03 0.84 1.03 1.09 0.74 0.87 1.02 0.95 ± 0.13 PFDS 1.02 0.94 0.67 1.14 0.83 0.88 1.03 0.93 ± 0.15 6:2 FTS 0.92 1.06 0.82 0.96 0.90 1.06 1.10 0.97 ± 0.10 PFHxSi 1.03 1.00 0.80 0.90 0.91 0.86 1.06 0.94 ± 0.10 PFOSi 0.83 0.81 0.95 0.99 0.91 0.89 1.04 0.92 ± 0.08 PFDSi 0.92 0.94 0.87 1.04 0.90 0.95 1.08 0.96 ± 0.08 PFBA 1.03 0.95 0.95 1.08 0.88 0.98 1.00 0.98 ± 0.06 PFPA 0.94 0.98 0.85 1.22 0.82 0.93 1.08 0.98 ± 0.14 PFHxA 0.89 0.99 0.98 1.00 0.88 0.90 1.08 0.96 ± 0.07 PFHpA 0.86 0.98 0.90 0.98 1.04 0.96 1.01 0.96 ± 0.06 PFOA 0.92 0.91 0.87 0.99 0.86 0.90 1.03 0.93 ± 0.06 PFNA 0.97 0.91 0.83 0.91 1.03 0.82 1.04 0.93 ± 0.09 PFDA 1.03 1.00 0.86 1.13 0.88 0.81 1.06 0.97 ± 0.12 PFUnDA 0.97 0.98 0.85 1.03 0.91 1.02 1.03 0.97 ± 0.07 PFDoDA 0.94 0.96 0.89 1.00 1.02 1.06 1.02 0.98 ± 0.06 PFTriDA 0.85 0.90 0.89 1.00 0.97 0.95 1.05 0.94 ± 0.07 PFTeDA 0.97 0.83 0.86 1.01 1.01 0.81 0.96 0.92 ± 0.09 PFHxDA 0.50 0.24 0.43 0.37 0.90 0.44 0.26 0.45 ± 0.22 PFOcDA 0.38 0.15 0.11 0.12 1.01 0.12 0.22 0.30 ± 0.33 3,7m2-PFOA 1.04 0.99 0.99 0.97 0.93 0.97 1.14 1.01 ± 0.07 MeFBSA 0.96 0.96 0.91 0.99 0.94 0.94 1.00 0.96 ± 0.03 FOSA 1.05 0.92 0.94 1.00 1.03 1.02 1.02 1.00 ± 0.05 MeFOSA 0.95 0.94 0.94 0.96 0.97 0.94 0.99 0.96 ± 0.02 EtFOSA 0.90 0.87 0.95 0.94 0.90 0.91 1.05 0.93 ± 0.06 MeFBSE 1.01 0.93 0.92 1.03 0.93 0.93 1.02 0.96 ± 0.05 MeFOSE 0.92 0.98 0.91 0.94 0.96 0.94 1.04 0.95 ± 0.05 EtFOSE 0.94 0.67 0.85 0.97 0.89 0.86 0.97 0.88 ± 0.10 FHEA 0.91 1.01 0.96 1.04 0.90 0.95 1.01 0.97 ± 0.05 FOEA 0.98 0.90 0.90 0.93 0.90 0.97 1.12 0.96 ± 0.08 FDEA 0.92 0.98 0.90 1.05 0.95 1.03 1.00 0.98 ± 0.05 FHUEA 0.89 0.97 0.94 0.98 0.93 0.93 1.02 0.95 ± 0.04 FOUEA 0.94 0.96 0.94 0.96 0.87 0.98 1.06 0.96 ± 0.05 FDUEA 0.91 0.92 0.89 1.04 0.96 0.93 0.96 0.94 ± 0.05 a Calculation of the matrix effect: Matrix effect = (response fortified extract – response non-fortified extract) / response solvent based standard; value > 1: Signal enhancement; value <1: Signal suppression; RSD = relative standard deviations.
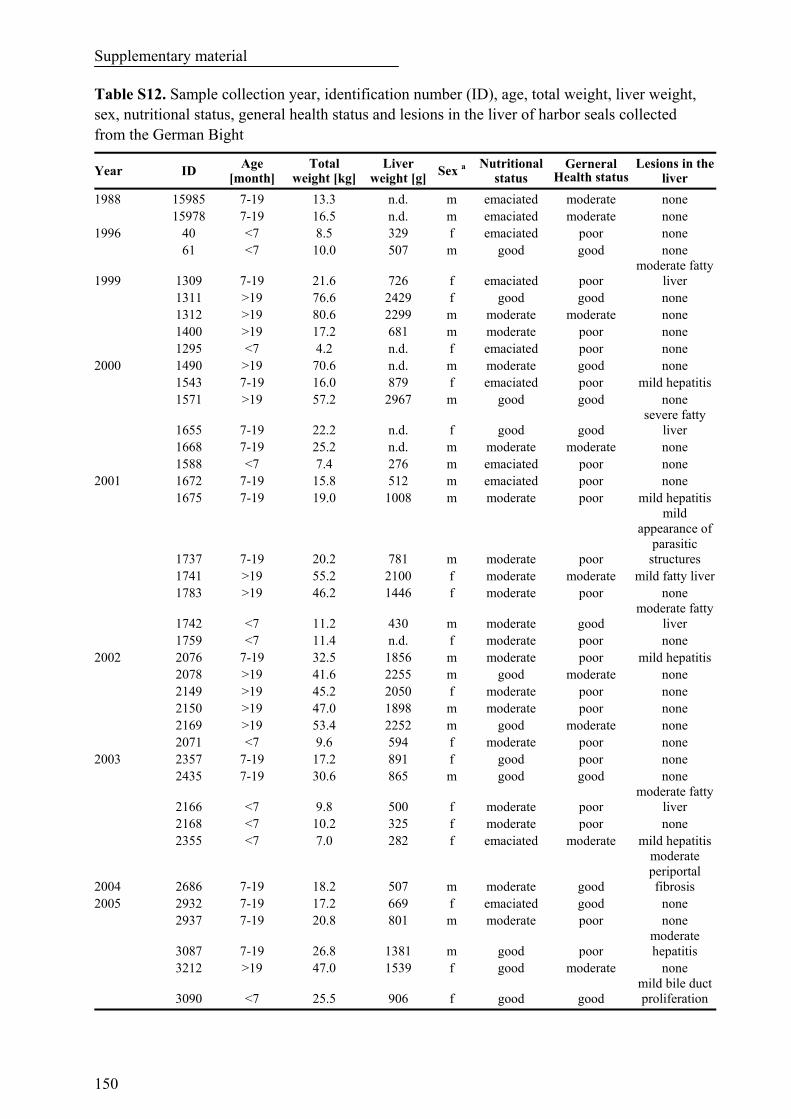
Supplementary material
150
Table S12. Sample collection year, identification number (ID), age, total weight, liver weight, sex, nutritional status, general health status and lesions in the liver of harbor seals collected from the German Bight
Year ID Age [month]
Total weight [kg]
Liver weight [g] Sex a Nutritional
status Gerneral
Health status Lesions in the
liver
1988 15985 7-19 13.3 n.d. m emaciated moderate none 15978 7-19 16.5 n.d. m emaciated moderate none 1996 40 <7 8.5 329 f emaciated poor none 61 <7 10.0 507 m good good none
1999 1309 7-19 21.6 726 f emaciated poor moderate fatty
liver 1311 >19 76.6 2429 f good good none 1312 >19 80.6 2299 m moderate moderate none 1400 >19 17.2 681 m moderate poor none 1295 <7 4.2 n.d. f emaciated poor none 2000 1490 >19 70.6 n.d. m moderate good none 1543 7-19 16.0 879 f emaciated poor mild hepatitis 1571 >19 57.2 2967 m good good none
1655 7-19 22.2 n.d. f good good severe fatty
liver 1668 7-19 25.2 n.d. m moderate moderate none 1588 <7 7.4 276 m emaciated poor none 2001 1672 7-19 15.8 512 m emaciated poor none 1675 7-19 19.0 1008 m moderate poor mild hepatitis
1737 7-19 20.2 781 m moderate poor
mild appearance of
parasitic structures
1741 >19 55.2 2100 f moderate moderate mild fatty liver 1783 >19 46.2 1446 f moderate poor none
1742 <7 11.2 430 m moderate good moderate fatty
liver 1759 <7 11.4 n.d. f moderate poor none 2002 2076 7-19 32.5 1856 m moderate poor mild hepatitis 2078 >19 41.6 2255 m good moderate none 2149 >19 45.2 2050 f moderate poor none 2150 >19 47.0 1898 m moderate poor none 2169 >19 53.4 2252 m good moderate none 2071 <7 9.6 594 f moderate poor none 2003 2357 7-19 17.2 891 f good poor none 2435 7-19 30.6 865 m good good none
2166 <7 9.8 500 f moderate poor moderate fatty
liver 2168 <7 10.2 325 f moderate poor none 2355 <7 7.0 282 f emaciated moderate mild hepatitis
2004 2686 7-19 18.2 507 m moderate good
moderate periportal fibrosis
2005 2932 7-19 17.2 669 f emaciated good none 2937 7-19 20.8 801 m moderate poor none
3087 7-19 26.8 1381 m good poor moderate hepatitis
3212 >19 47.0 1539 f good moderate none
3090 <7 25.5 906 f good good mild bile duct proliferation

Supplementary material
151
(Continued)
Year ID Age [month]
Total weight [kg]
Liver weight [g] Sex a Nutritional
status Gerneral
Health status Lesions in the
liver
2006 3242 7-19 19.4 842 m emaciated poor none 3452 >19 102.6 2774 f good good none 3510 >19 49.6 1346 m good good none 3405 <7 9.4 308 f good good none 3416 <7 7.0 303 m emaciated poor none 3420 <7 7.2 343 m moderate poor none 3461 <7 7.4 268 m emaciated poor none
3463 <7 7.8 251 m emaciated poor mild
haemosiderose2007 3615 7-19 17.3 400 m moderate poor severe hepatitis 3655 >19 69.5 2507 f good poor none 3671 7-19 15.0 441 m moderate poor none 3675 7-19 18.8 711 m moderate poor severe hepatitis 3723 7-19 17.4 726 m emaciated poor none 4143 7-19 17.4 725 m moderate n.d. n.d. 4144 7-19 17.8 856 f good n.d. n.d. 4145 7-19 17.4 974 m moderate n.d. n.d. 4183 7-19 21.4 1196 m moderate n.d. n.d. 4184 7-19 16.0 n.d. m emaciated poor none 3744 <7 11.4 750 m good moderate none
3757 <7 7.6 176 f emaciated poor severe
haemosiderose 3821 <7 7.9 236 f emaciated poor none 2008 4190 7-19 15.8 673 f moderate poor severe hepatitis 4191 7-19 22.9 1028 m moderate n.d. n.d. 4192 7-19 21.2 1419 m moderate poor severe hepatitis
n.d. = not determined; a m= male, f = female.

Supplementary material
152
Table S13. Quality assurance of the extraction of harbor seal livers: Instrument detection limits (IDL), method quantification limits (MQL), recoveries of spiked liver extracts, matrix effect and allocation of the IS
Analyte IDL [pg absolute]
MQL [ng/g ww]
Recovery [%] a
Matrix effect b
Allocation of the IS
PFBS 0.191 0.1602 70 ± 3.7 0.99 PFPS c - c 0.255 - c - c PFHxS 0.220 0.183 75 ± 7.7 1.01 PFHpS 0.199 0.418 115 ± 6.3 0.97
[18O2]-PFHxS
PFOS 0.264 8.434 74 ± 5.0 1.03 PFNS c - c 0.120 - c - c PFDS 0.156 0.112 65 ± 19.9 1.02 6:2 FTS 3.789 n.d. 116 ± 13.3 0.92
[13C4]-PFOS
PFHxSi 0.319 n.d. 109 ± 12.5 1.03 PFOSi 0.221 0.044 81 ± 4.1 0.83 PFDSi 0.307 n.d. 74 ± 6.8 0.92
[13C4]-PFOSi
PFBA 1.545 n.d. 88 ± 4.0 1.03 [13C4]-PFBA PFPA 0.420 n.d. 92 ± 3.5 0.94 PFHxA 0.270 n.d. 60 ± 3.6 0.89 PFHpA 0.258 n.d. 114 ± 11.7 0.86
[13C2]-PFHxA
PFOA 0.278 0.087 87 ± 2.5 0.92 [13C4]-PFOA PFNA 0.296 0.141 120 ± 8.3 0.97 [13C5]-PFNA PFDA 0.444 0.159 122 ± 8.1 1.03 [13C2]-PFDA PFUnDA 0.644 0.123 125 ± 21.8 0.97 [13C2]-PFUnDA PFDoDA 0.381 0.153 127 ± 5.8 0.94 PFTriDA 0.510 0.240 92 ± 4.0 0.85 PFTeDA 0.752 0.146 120 ± 8.2 0.97 PFPDA c - c 0.043 - c - c PFHxDA 1.561 n.d. 56 ± 3.0 0.50 PFHpDA c - c n.d. - c - c PFOcDA 1.160 n.d. 64 ± 2.5 0.38
[13C2]-PFDoDA
3,7m2-PFOA 0.801 n.d. 121 ± 9.1 1.04 [13C4]-PFOA MeFBSA 3.263 n.d. 109 ± 10.5 0.96 d3-N-MeFOSA FOSA 0.941 0.442 62 ± 18.8 1.05 [13C4]-PFOS MeFOSA 1.239 n.d. 112 ± 7.2 0.95 d3-N-MeFOSA EtFOSA 1.205 n.d. 92 ± 5.4 0.90 d5-N-EtFOSA MeFBSE 0.598 n.d. 98 ± 3.1 1.01 MeFOSE 0.803 n.d. 99 ± 8.0 0.92
d7-N-MeFOSE
EtFOSE 0.646 n.d. 135 ± 11.5 0.94 d9-N-EtFOSE FHEA 3.918 n.d. 73 ± 7.2 0.91 [13C2]-FHEA FOEA 2.520 n.d. 82 ± 7.2 0.98 [13C2]-FOEA FDEA 5.901 n.d. 85 ± 0.8 0.92 [13C2]-FDEA FHUEA 1.252 n.d. 110 ± 4.7 0.89 [13C2]-FHUEA FOUEA 0.709 n.d. 108 ± 3.1 0.94 [13C2]-FOUEA FDUEA 1.031 n.d. 105 ± 2.5 0.91 [13C2]-FDUEA n.d. = not detected; a recovery values (%) of spiked seal liver extracts with 10 ng absolute (100 µL of a 0.1 µg/mL solution, n = 3) are given with relative standard deviations (RSD); b calculation of the matrix effect by analysis of a fortified extract with a 10 ng absulute PFC-mix (100 µL of a 0.1 µg/mL standard solution): Matrix effect = (response fortified extract – response non-fortified extract) / response solvent based standard; value > 1: Signal enhancement; value <1: Signal suppression; c can not be calculated, because no standards were available for this compound.

Supplementary material
153
Table S14. Correlation coefficient of Pearson analysis of all detected PFCs in ≥ 7 month old harbor seals from 1988 to 2008
PFBS PFPS PFHxS PFHpS PFOS PFNS PFDS PFOSi PFOA PFNA PFDA PFUnDA PFDoDA PFTriDA FOSA
Pearson correlation
1.000 .030 .647** .716** .721** .171 .080 -.038 .797** .580** .523** .428* .320 .189 .048 PFBS
N 24 23 24 23 24 21 17 17 17 24 24 24 23 23 24 Pearson correlation .030 1.000 .119 .087 .213 -.077 .097 .019 .161 -.001 -.053 -.048 .044 .208 .121 PFPS
N 23 43 42 41 43 31 26 25 28 43 43 42 40 39 42 Pearson correlation .647** .119 1.000 .810** .585** -.058 -.184 .143 .679** .405** .371* .262 .227 .189 .150 PFHxS
N 24 42 43 42 43 32 26 24 28 43 43 42 40 39 42 Pearson correlation .716** .087 .810** 1.000 .692** .140 -.058 .138 .748** .580** .637** .566** .396* .262 .119 PFHpS
N 23 41 42 42 42 31 25 23 28 42 42 41 39 38 41 Pearson correlation .721** .213 .585** .692** 1.000 .509** .374 .120 .607** .633** .571** .549** .582** .425** .209 PFOS
N 24 43 43 42 44 32 26 25 28 44 44 43 41 40 43 Pearson correlation .171 -.077 -.058 .140 .509** 1.000 .887** -.166 -.086 .417* .579** .666** .599** .552** -.126 PFNS
N 21 31 32 31 32 32 25 22 23 32 32 32 32 32 32 Pearson correlation .080 .097 -.184 -.058 .374 .887** 1.000 -.318 -.137 .251 .314 .426* .542** .560** -.251 PFDS
N 17 26 26 25 26 25 26 17 20 26 26 26 26 26 26 Pearson correlation -.038 .019 .143 .138 .120 -.166 -.318 1.000 .047 -.219 -.099 .014 .030 -.113 .883**PFOSi
N 17 25 24 23 25 22 17 25 18 25 25 25 25 25 25 Pearson correlation .797** .161 .679** .748** .607** -.086 -.137 .047 1.000 .621** .367 .159 .190 .116 .091 PFOA
N 17 28 28 28 28 23 20 18 28 28 28 27 27 26 28 Pearson correlation .580** -.001 .405** .580** .633** .417* .251 -.219 .621** 1.000 .815** .701** .606** .353* -.164 PFNA
N 24 43 43 42 44 32 26 25 28 44 44 43 41 40 43 Pearson correlation .523** -.053 .371* .637** .571** .579** .314 -.099 .367 .815** 1.000 .922** .725** .445** -.079 PFDA
N 24 43 43 42 44 32 26 25 28 44 44 43 41 40 43 Pearson correlation .428* -.048 .262 .566** .549** .666** .426* .014 .159 .701** .922** 1.000 .858** .652** .000 PFUnDA
N 24 42 42 41 43 32 26 25 27 43 43 43 40 40 42 Pearson correlation .320 .044 .227 .396* .582** .599** .542** .030 .190 .606** .725** .858** 1.000 .815** -.048 PFDoDA
N 23 40 40 39 41 32 26 25 27 41 41 40 41 40 41 Pearson correlation .189 .208 .189 .262 .425** .552** .560** -.113 .116 .353* .445** .652** .815** 1.000 -.128 PFTriDA
N 23 39 39 38 40 32 26 25 26 40 40 40 40 40 40 Pearson correlation .048 .121 .150 .119 .209 -.126 -.251 .883** .091 -.164 -.079 .000 -.048 -.128 1.000 FOSA
N 24 42 42 41 43 32 26 25 28 43 43 42 41 40 43
* Correlation is significant at the 0.05 level; ** correlation is significant at the 0.01 level.

Supplementary material
154
Table S15. Sampling locations, time, turbidity, oxygen content, pH-value, conductibility, water temperature, salinity, and river discharge at the sampling day
Location Sampling time
[UTC]a
Latitude/ longitude
Turbidity [FNU]b
Oxygen content [mg/L]
pH value
Conductivity[mS/cm]
Water temperature
[°C]
Salinity[psu]c
River discharge
[m3/s]
1 16.08.2006 11:50
N54.157/ E7.938
0.18 12.2 8.1 43.40 19.4 31.77 n.a.
2 16.08.2006 12:16
N54.113/ E8.050
0.18 12.2 8.1 43.12 19.6 31.37 n.a.
3 16.08.2006 13:05
N54.030/ E8.266
0.18 14.0 8.1 41.72 19.2 30.55 n.a.
4 16.08.2006 13:34
N53.982/ E8.396
0.18 14.2 8.1 41.91 19.1 30.75 n.a.
5 16.08.2006 14:04
N53.962/ E8.578
0.21 13.7 8.0 37.08 19.2 26.80 n.a.
6 16.08.2006 14:24
N53.914/ E8.673
0.53 13.1 7.9 31.61 19.1 22.49 n.a.
7 17.08.2006 05:36
N53.859/ E8.737
0.33 9.8 7.9 29.68 19.3 20.93 916
8 17.08.2006 05:48
N53.839/ E8.787
0.47 9.8 7.7 25.05 19.1 17.45 894
9 17.08.2006 06:24
N53.847/ E8.969
0.36 10.8 7.8 19.00 19.7 12.72 879
10 17.08.2006 06:50
N53.873/ E9.094
0.36 11.0 7.8 14.97 20.2 9.689 866
11 17.08.2006 07:00
N53.878/ E9.142
0.33 11.0 7.7 10.45 20.6 6.52 866
12 17.08.2006 07:53
N53.823/ E9.374
0.42 11.3 7.6 3.17 21.3 1.79 843
13 17.08.2006 08:05
N53.795/ E9.396
0.47 11.4 7.6 2.33 21.3 1.30 819
14 17.08.2006 08:21
N53.756/ E9.421
0.47 11.1 7.5 1.61 21.2 0.88 819
15 17.08.2006 09:14
N53.631/ E9.528
0.33 9.5 7.3 1.19 21.4 0.640 818
16 17.08.2006 10:34
N53.551/ E9.818
0.24 6.1 7.1 0.96 20.6 0.52 817
17 17.08.2006 11:01
N53.541/ E9.922
0.33 9.3 7.3 0.82 20.0 0.45 817
18 17.08.2006 11:21
N53.537/ E9.994
0.27 12.9 7.7 0.71 19.8 0.39 810
19 17.08.2006 12:39
N53.462/ E10.065
0.50 16.7 7.9 0.50 19.8 0.27 803
20 17.08.2006 13:54
N53.397/ E10.170
0.50 17.5 7.9 0.54 19.8 0.29 796
21 17.08.2006 14:15
N53.395/ E10.234
0.50 17.8 8.0 0.53 20.0 0.28 788
22 18.08.2006 08:55
N53.399/ E10.429
0.39 16.2 7.9 0.54 19.8 0.29 737
23 18.08.2006 08:05
N53.377/ E10.491
0.36 15.7 7.9 0.53 19.8 0.29 736
24 18.08.2006 07:10
N53.370/ E10.554
0.36 15.0 7.9 0.52 19.7 0.28 735
a UTC = universal time coordinated; b FNU = formazin nephelometric unit; c psu = practical salinity unit; n.a. = not available.
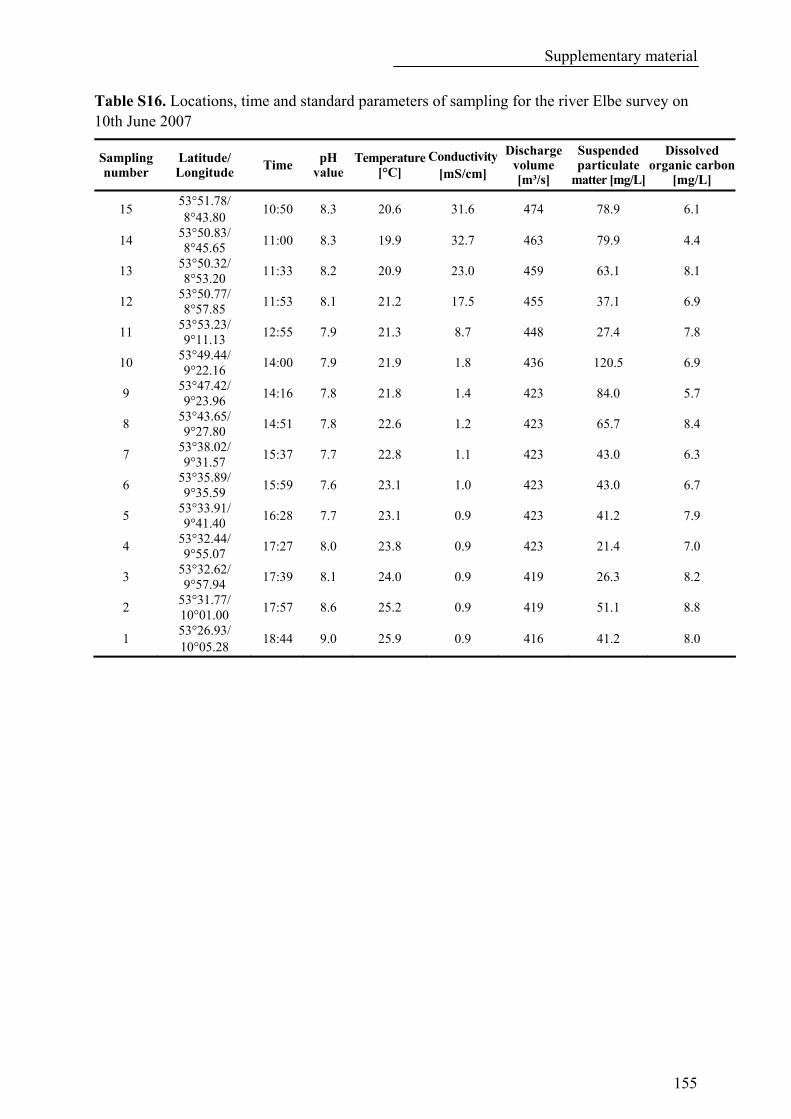
Supplementary material
155
Table S16. Locations, time and standard parameters of sampling for the river Elbe survey on 10th June 2007
Sampling number
Latitude/ Longitude Time pH
value Temperature
[°C] Conductivity
[mS/cm]
Discharge volume [m³/s]
Suspended particulate
matter [mg/L]
Dissolved organic carbon
[mg/L]
15 53°51.78/ 8°43.80
10:50 8.3 20.6 31.6 474 78.9 6.1
14 53°50.83/ 8°45.65
11:00 8.3 19.9 32.7 463 79.9 4.4
13 53°50.32/ 8°53.20
11:33 8.2 20.9 23.0 459 63.1 8.1
12 53°50.77/ 8°57.85
11:53 8.1 21.2 17.5 455 37.1 6.9
11 53°53.23/ 9°11.13
12:55 7.9 21.3 8.7 448 27.4 7.8
10 53°49.44/ 9°22.16
14:00 7.9 21.9 1.8 436 120.5 6.9
9 53°47.42/ 9°23.96
14:16 7.8 21.8 1.4 423 84.0 5.7
8 53°43.65/ 9°27.80
14:51 7.8 22.6 1.2 423 65.7 8.4
7 53°38.02/ 9°31.57
15:37 7.7 22.8 1.1 423 43.0 6.3
6 53°35.89/ 9°35.59
15:59 7.6 23.1 1.0 423 43.0 6.7
5 53°33.91/ 9°41.40
16:28 7.7 23.1 0.9 423 41.2 7.9
4 53°32.44/ 9°55.07
17:27 8.0 23.8 0.9 423 21.4 7.0
3 53°32.62/ 9°57.94
17:39 8.1 24.0 0.9 419 26.3 8.2
2 53°31.77/ 10°01.00
17:57 8.6 25.2 0.9 419 51.1 8.8
1 53°26.93/ 10°05.28
18:44 9.0 25.9 0.9 416 41.2 8.0

Supplementary material
156
Table S17. Locations, sampling time, water temperature and salinity of water sampling in the German Bight (1-22), Baltic Sea (A-R) and North and Norwegian Sea (I-VI) in 2007
Station number
Sampling date UTC time a Latitude Longitude Water
temperature [°C] Salinity
[psu]
1 02.11.2007 08:40 55 55.08 N 03 20.82 E 12.3 34.9 2 02.11.2007 14:40 55 30.07 N 04 00.56 E 12.4 34.9 3 02.11.2007 12:20 55 45.98 N 04 15.09 E 12.4 34.9 4 02.11.2007 20:25 54 59.99 N 05 29.96 E 13.3 34.9 5 03.11.2007 06:55 55 22.98 N 06 14.96 E 13.4 34.6 6 01.11.2007 19:20 55 00.02 N 06 19.42 E 13.5 34.7 7 01.11.2007 16:20 54 40.92 N 06 46.98 E 13.5 34.2 8 04.11.2007 15:10 54 20.07 N 05 39.93 E 13.6 34.4 9 04.11.2007 11:20 53 56.43 N 06 11.99 E 12.8 33.2 10 04.11.2007 17:55 54 10.02 N 06 20.50 E 13.1 33.6 11 04.11.2007 08:45 53 40.46 N 06 24.90 E 11.9 31.8 12 04.11.2007 21:05 53 56.54 N 06 46.99 E 12.4 32.3 13 31.10.2007 16:15 54 10.78 N 07 26.00 E 13.4 33.4 14 03.11.2007 12:10 54 59.91 N 07 30.01 E 12.6 32.1 15 01.11.2007 12:40 54 40.01 N 07 30.16 E 12.6 31.4 16 01.11.2007 10:15 54 39 87 N 07 49.94 E 12.1 30.5 17 03.11.2007 17:05 54 59.93 N 08 15.07 E 11.0 30.2 18 31.10.2007 09:25 53 59.85 N 08 06.32 E 11.8 29.3 19 31.10.2007 11:30 54 13.31 N 08 22.55 E 10.4 26.3 20 30.10.2007 17:55 53 52.68 N 08 43.28 E 10.3 n.a. 21 30.10.2007 13:05 53 37.01 N 09 32.84 E 9.5 n.a. 22 30.10.2007 10:45 53 32.17 N 10 00.82 E n.a. n.a. A 10.12.2007 15:52 54 49.64 N 09 52.17 E 7.1 18.4 B 10.12.2007 11:17 54 27.28 N 09 54.37 E 6.3 17.4 C 10.12.2007 13:54 54 38.10 N 10 02.70 E 6.7 17.8 D 11.12.2007 13:24 54 49.56 N 10 10.51 E 6.6 17.9 E 10.12.2007 8:50 54 24.24 N 10 12.61 E 6.6 16.4 F 15.12.2007 9:07 54 20.21 N 10 40.43 E 5.6 16.1 G 15.12.2007 10:34 54 29.66 N 10 43.67 E 5.8 17.2 H 14.12.2007 14:45 54 35.53 N 10 49.88 E 5.8 14.9 I 14.12.2007 13:26 54 44.48 N 10 56.24 E 5.9 14.2 J 16.12.2007 14:13 54 32.13 N 11 11.14 E 5.4 13.7 K 16.12.2007 15:29 54 40.29 N 11 17.28 E 5.2 12.0 L 19.12.2007 8:22 53 59.40 N 10 54.60 E 4.9 14.2 M 19.12.2007 11:50 54 06.67 N 11 05.98 E 5.5 14.6 N 19.12.2007 13:53 54 13.33 N 11 16.57 E 5.9 11.9 O 17.12.2007 11:58 54 21.06 N 11 21.04 E 5.5 14.1 P 17.12.2007 10:10 54 31.74 N 11 29.75 E 5.8 10.2 Q 17.12.2007 15:46 53 58.37 N 11 18.74 E 4.8 14.0 R 17.12.2007 13:44 54 09.15 N 11 31.56 E 5.6 13.9 I 14.08.2007 15:10 66 43.82 N 01 08.56 E 12.2 n.a. II 15.08.2007 06:45 64 34.62 N 00 25.22 E 12.2 n.a. III 16.08.2007 15:10 59 54.85 N 04 29.41 E 13.8 n.a. IV 17.08.2007 07:10 57 59.08 N 06 35.97 E 17.0 n.a. V 17.08.2007 10:40 57 50.60 N 07 46.00 E 16.7 n.a. VI 17.08.2007 14:10 58 04.91 N 08 51.54 E 16.6 n.a.
a UTC = universal time coordinated; psu = practical salinity unit; n.a. = not available.

Supplementary material
157
Table S18. Sampling location, sampling date and basic parameters of sediment core A from Tokyo Bay, Japan
Sampling date 10. May 2008 GPS position N 35°34'60''/ E 139°55'01'' Water depth (m) 12 Bottom water temperature 15.2
Depth (cm) pH ORP [mV] a
TN [mg/g] b TOC [%] c Moisture
[%] Dry density
[g/cm]
0-3 7.3 -170 2.3 1.7 85 0.16
3-6 2.2 1.7 82 0.19
6-9 7.4 -190
2.0 1.6 79 0.23
9-11 1.8 1.5 78 0.24
13-15 1.7 1.5 77 0.26
17-19
7.6 -198 1.3 1.2 72 0.32
21-23 1.3 1.2 68 0.36
25-27 1.5 1.4 74 0.30
29-31
7.4 -185 1.3 1.3 72 0.32
33-35 1.1 1.0 70 0.35
37-39 7.5 -201
1.0 0.9 69 0.37
41-43 0.9 0.9 68 0.39
45-47 7.6 -198
0.9 0.9 67 0.39
49-51 0.9 0.8 66 0.43
53-55 0.9 0.8 65 0.43
57-59
7.7 -194 0.9 0.8 64 0.44
61-63 0.8 0.7 61 0.50
65-67 7.7 -199
0.8 0.7 59 0.50
69-71 0.7 0.7 61 0.50
73-75 0.7 0.7 61 0.50
77-79
7.7 -201 0.8 0.7 60 0.49
a Oxygen reaction potential; b total nitrogen; c total organic carbon.

Supplementary material
158
Table S19. Sampling location, sampling date and basic parameters of sediment core B from Tokyo Bay, Japan
Sampling date 10. May 2008 GPS position N 35°29'18''/ E 139°54'24'' Water depth (m) 21 Bottom water temperature 15.2
Depth (cm) pH ORP [mV] a
TN [mg/g] b TOC [%] c Moisture
[%] Dry density
[g/cm3]
0-3 7.3 -163 1.9 1.5 79 0.23 3-6 1.7 1.4 76 0.27
6-8 1.8 1.4 75 0.27
8-10
7.4 -150 1.8 1.5 75 0.28
10-12 1.7 1.4 73 0.29
12-14 1.6 1.4 74 0.30
16-18
7.6 -160 1.5 1.3 72 0.31
20-22 1.5 1.3 72 0.32
24-26 1.5 1.3 70 0.34
28-30
7.7 -162 1.4 1.2 71 0.33
32-34 1.4 1.2 70 0.35
36-38 7.6 -165
1.3 1.1 67 0.39
40-42 1.1 0.9 65 0.42
44-46 1.0 0.9 65 0.42
48-50
7.6 -150 1.0 0.9 64 0.44
52-54 1.0 0.8 64 0.43
56-58 7.7 -159
0.9 0.8 62 0.45
60-62 0.9 0.8 61 0.47
64-66 0.9 0.8 63 0.46
68-70
7.7 -153 0.9 0.7 62 0.47
a Oxygen reaction potential; b total nitrogen; c total organic carbon.

Supplementary material
159
Figure S1. Relationship between concentrations of individual PFCs and dissolved organic carbon (DOC) in surface water in the German Bight

Supplementary material
160
Figure S2. Relationship between concentrations of individual PFCs and suspended particulate matter (SPM) in surface water in the German Bight

Supplementary material
161
Figure S3. Chromatograms of PFBS, PFOS, PFHxA, PFHpA, PFOA, PFNA and FOSA in the dissolved phase for sampling location 12 and a typical blank sample from the cruise of the
research vessel Polarstern (46° N-26° S) in the Atlantic Ocean

Supplementary material
162
Figure S4. Correlations between PFC concentrations in surface water in the Atlantic Ocean

Supplementary material
163
Figure S5. Sample locations of the collected habor seals in the German Bight, n = 63
Figure S6. Temporal trends of PFPS in ≥ 7 month old habor seals from the German Bight from 1999 to 2008. The plots display the geometric means (circles) and the median (squares)
together with the individual analysis (small dots) and the 95% confidence intervals of the geometric means