pollutants of priority concern in austrian rivers
76
Pollutants of Priority Concern in Austian Rivers Trisphosphates Mercury and its compounds
Transcript of pollutants of priority concern in austrian rivers

Pollutants of Priority Concernin Austian Rivers
TrisphosphatesMercury and its compounds


REPORTREP-0253
Vienna, 2010
POLLUTANTS OF PRIORITY CONCERN INAUSTRIAN RIVERS
Mercury and its compoundsTrisphosphates
Manfred ClaraMartin Kralik
Hermann MiesbauerMichael Schabuss
Sigrid ScharfBirgit VallantStefan Weiss
Britta Grillitsch
Project management Sigrid Scharf, Environment Agency Austria
Authors Manfred Clara, Environment Agency Austria Martin Kralik, Environment Agency Austria Hermann Miesbauer, Department of Environmental Protection, Office of the Upper Austrian Government Michael Schabuss, Department for Biomedical Sciences, University of Veterinary Medicine Sigrid Scharf, Environment Agency Austria Birgit Vallant, Environment Agency Austria Stefan Weiss, Environment Agency Austria Britta Grillitsch, Department for Biomedical Sciences, University of Veterinary Medicine
Editor Brigitte Read, Environment Agency Austria
Layout and typesetting Elisabeth Riss, Environment Agency Austria
Title photograph Aitel © M. Bernkopf, VUW
Acknowledgments: The contributions, collaboration and support during sampling at the River Ager provided by the Office of the Upper Austrian Government (Oberösterreich) are gratefully acknowledged.
For further information about the publications of the Umweltbundesamt please go to: http://www.umweltbundesamt.at/
Imprint
Owner and Editor: Umweltbundesamt GmbH Spittelauer Lände 5, 1090 Vienna/Austria
This publications is only available on: http://www.umweltbundesamt.at/
© Umweltbundesamt GmbH, Vienna, 2010 All Rights reserved ISBN 978-3-99004-054-6
Pollutants of Priority Concern in Austrian Rivers – Content
Umweltbundesamt REP-0253, Vienna, 2010 3
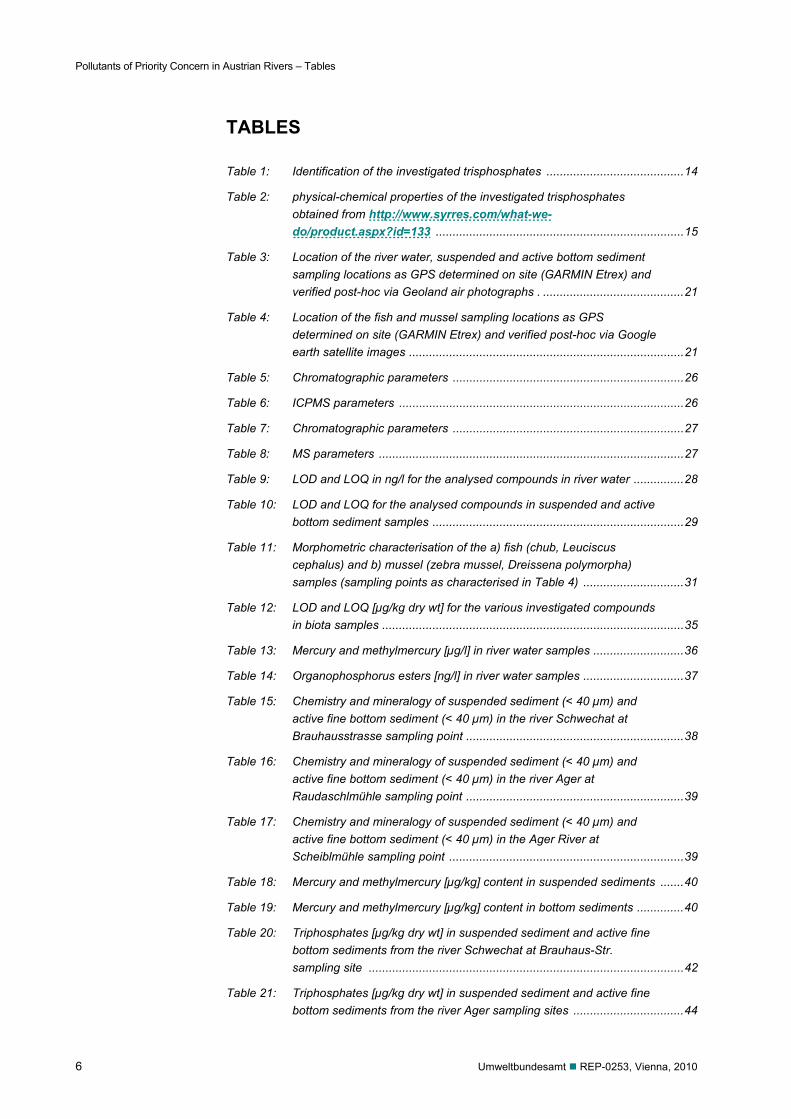
CONTENT
FIGURES ............................................................................................................ 5
TABLES .............................................................................................................. 6
SUMMARY AND CONCLUSIONS ................................................................. 8
ZUSAMMENFASSUNG ................................................................................... 9
1 INTRODUCTION ....................................................................................... 11 1.1 Background and significance ............................................................ 11 1.1.1 Mercury ................................................................................................. 11 1.1.2 Trisphosphates ...................................................................................... 14 1.2 Current state of research ................................................................... 16 1.2.1 Mercury and its compounds .................................................................. 16 1.2.2 Trisphosphates ...................................................................................... 17 1.2.3 Conclusions ........................................................................................... 19 1.3 Research aims ..................................................................................... 19
2 MATERIALS AND METHODS ........................................................ 20 2.1 Sampling design ................................................................................. 20 2.1.1 Rivers and sampling points ................................................................... 20 2.1.2 Sampling periods .................................................................................. 24 2.1.3 Samples ................................................................................................ 25 2.2 Sample collection ................................................................................ 25 2.2.1 Water and sediment .............................................................................. 25 2.2.2 Suspended particles .............................................................................. 25 2.2.3 Biota ...................................................................................................... 25 2.3 Laboratory analysis ............................................................................ 26 2.3.1 Water ..................................................................................................... 26 2.3.2 Sediments and suspended matter ........................................................ 28 2.3.3 Biota ...................................................................................................... 30 2.4 Data treatment ..................................................................................... 35 2.4.1 Solid – liquid partitioning ....................................................................... 35 2.4.2 Bioaccumulation .................................................................................... 35
3 RESULTS ............................................................................................ 36 3.1 Water .................................................................................................... 36 3.2 Suspended and active bottom sediments ........................................ 37 3.3 Biota ..................................................................................................... 45 3.3.1 Mercury and methylmercury .................................................................. 45 3.3.2 Trisphospates ........................................................................................ 47 3.4 Partitioning .......................................................................................... 49 3.4.1 Adsorption to solids ............................................................................... 49 3.4.2 Bioaccumulation .................................................................................... 51

Pollutants of Priority Concern in Austrian Rivers – Content
4 Umweltbundesamt REP-0253, Vienna, 2010
4 DISCUSSION ...................................................................................... 54 4.1 Contaminant levels compared among rivers and
sampling locations .............................................................................. 54 4.1.1 Mercury and methylmercury .................................................................. 54 4.1.2 Trisphosphates ...................................................................................... 55 4.2 Contaminant levels among the compartments analysed................ 57 4.2.1 Mercury and methylmercury .................................................................. 57 4.2.2 Trisphosphates ...................................................................................... 58 4.3 Contaminant levels versus critical values/Environmental
Quality Standards ................................................................................ 61 4.3.1 Environmental quality standards for water ............................................ 61
5 LITERATURE ..................................................................................... 62
6 ANNEXES ........................................................................................... 69 Annex 1: Water, suspended sediment and bottom sediment
samples in the river Schwechat at the Brauhaus-Str./ Schwechat, Lower Austria ............................................................. 70
Annex 2: Water, suspended sediment and bottom sediment samples in the river Ager at the Raudaschlmühle/ Schörfling at Attersee, Upper Austria ........................................... 71
Annex 3: Water, suspended sediment and bottom sediment samples in the river Ager at the Scheiblmühle/ Timelkam, Upper Austria ................................................................ 72

Pollutants of Priority Concern in Austrian Rivers – Figures
Umweltbundesamt REP-0253, Vienna, 2010 5
FIGURES
Figure 1: Localisation of the two sampling sites at the river Schwechat at Mannswörth and Schwarzmühlbrücke .................................................... 22
Figure 2: Characterisation of sampling site Schwechat Mannswörth ...................... 22
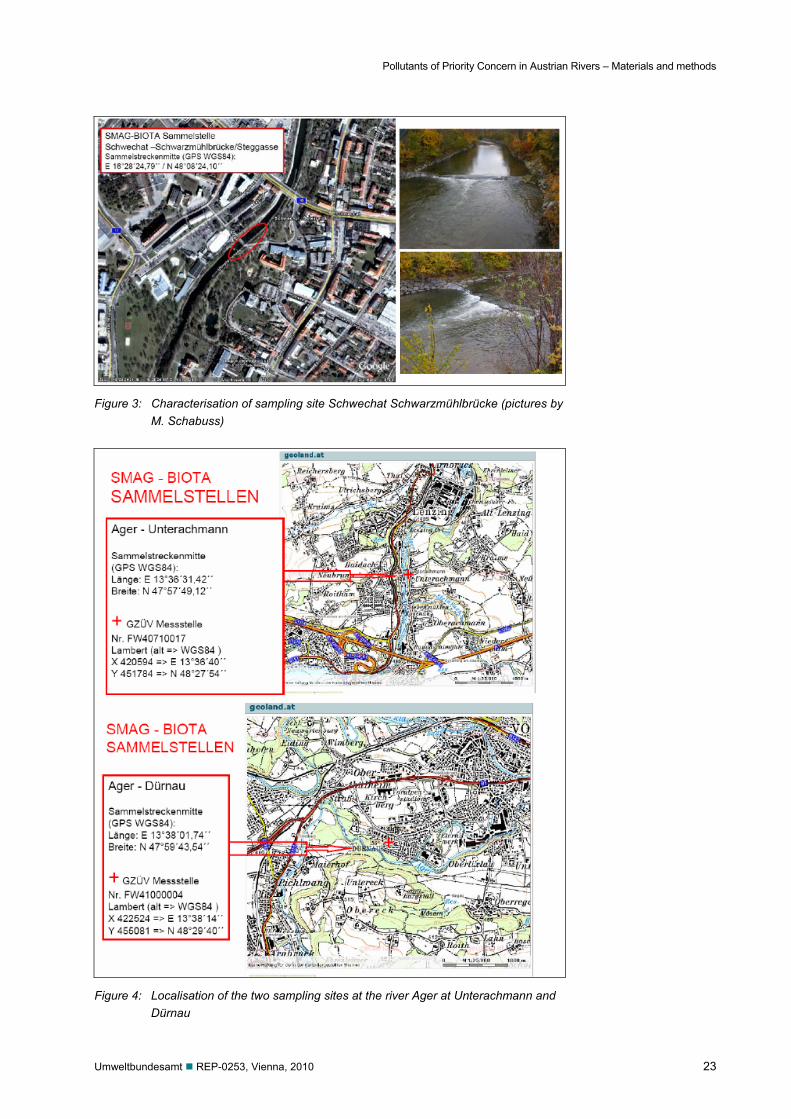
Figure 3: Characterisation of sampling site Schwechat Schwarzmühlbrücke ......... 23
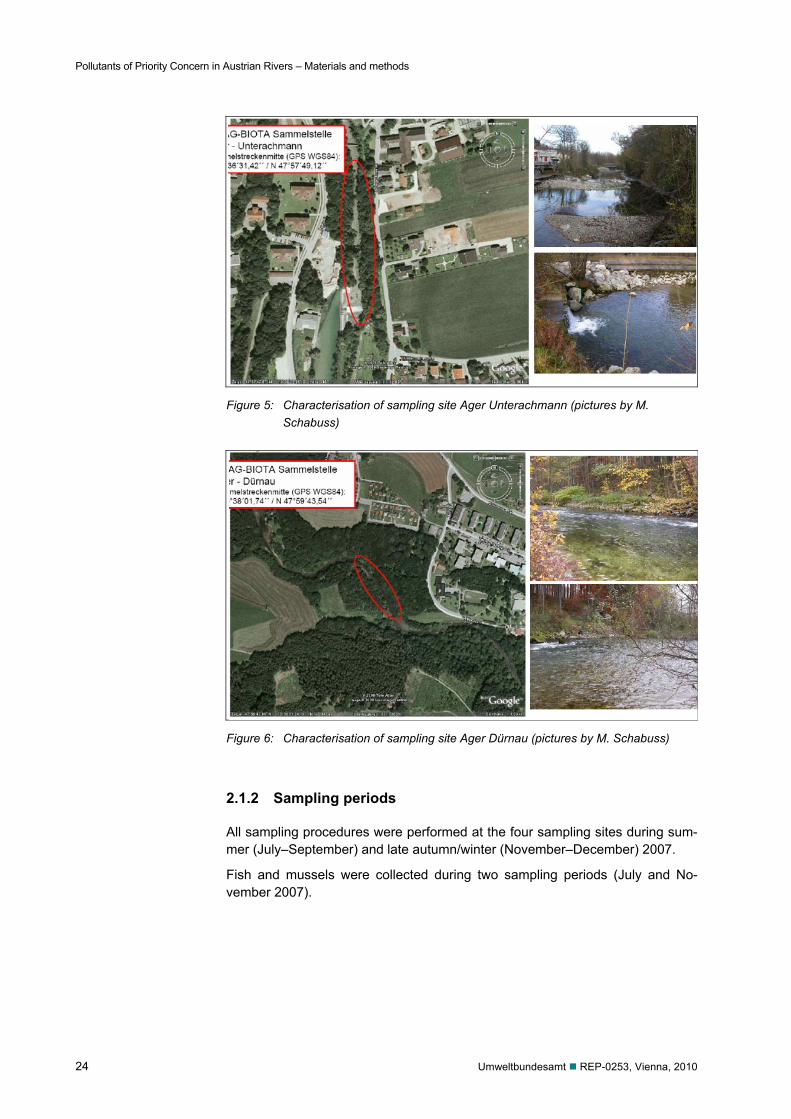
Figure 4: Localisation of the two sampling sites at the river Ager at Unterachmann and Dürnau ..................................................................... 23
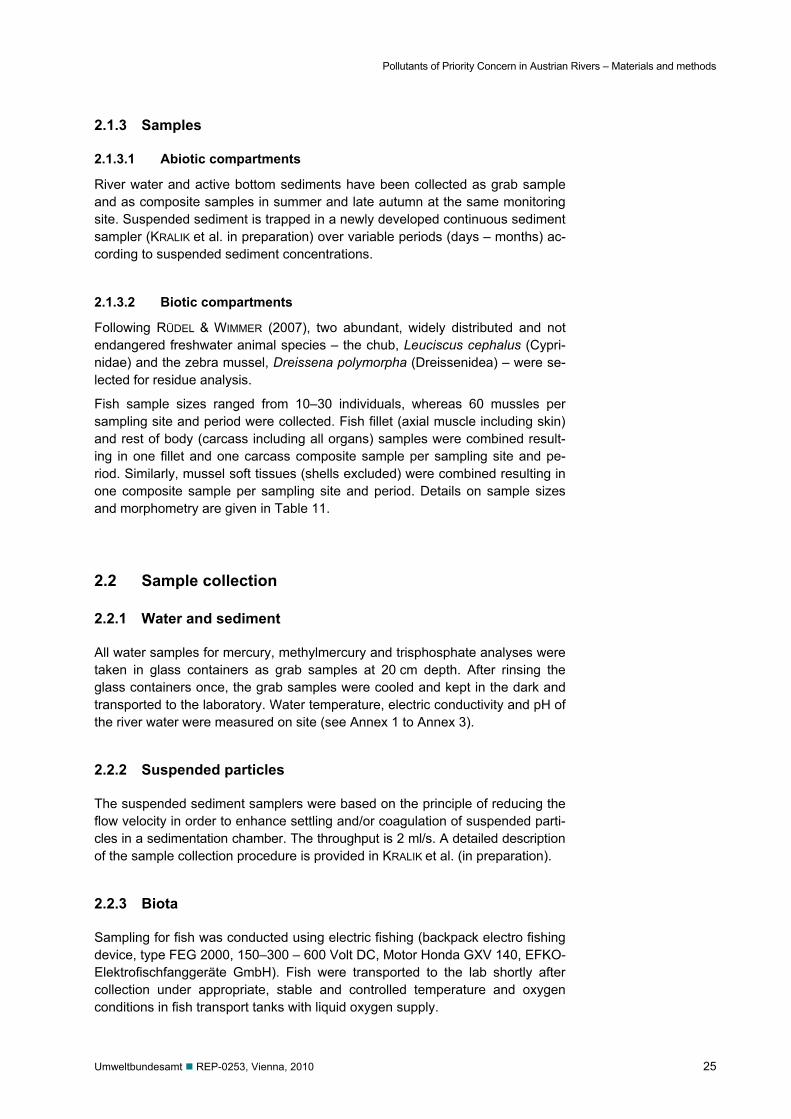
Figure 5: Characterisation of sampling site Ager Unterachmann ............................ 24
Figure 6: Characterisation of sampling site Ager Dürnau ....................................... 24
Figure 7: Mercury in active bottom sediments (< 40 µm) in the Schwechat River at the GZÜV monitoring sites Mannswörth and Maria Lanzendorf 1993–2006 and mercury in suspended sediment and active bottom sediments in August and November 2007 ........................ 41
Figure 8: Distribution pattern of the investigated trisphosphates in the particulate matter samples from the river Schwechat ............................. 43
Figure 9: Distribution pattern of the investigated trisphosphates in the particulate matter samples from the river Schwechat ............................. 44
Figure 10: Calculated log KOC values for suspended matter and sediments ............ 51
Figure 11: Bioaccumulation Factors (ranges) for total mercury (Hg) and methylmercury (Me-Hg) in fillet and whole body composite samples of fish from the rivers Ager and Schwechat ............................................. 52
Figure 12: Proportion (in percent) of methylmercury in total mercury in fillet and whole body composite samples of fish from the rivers Ager and Schwechat during the two sampling periods (P-1, P-2; Table 22) ........... 52
Figure 13: Bioaccumulation Factors (ranges) for the trisphosphates detected in fillet and whole body composite samples of fish from the rivers Ager and Schwechat ............................................................................... 53
Figure 14: Concentration ranges (minimum-maximum bars) of total mercury (Hg) and methylmercury (Me-Hg) in the rivers Ager and Schwechat over the compartments analysed (measured concentrations are as detailed in Table 13, Table 14, Table 18 to 24; concentrations below the analytical limits were set to zero in this graph, and are as detailed in Table 9, Table 10 and Table 12; mussels were sampled in the Ager river only ............................................................................... 58
Figure 15: Concentration ranges (minimum-maximum bars) of trisphosphates in the Ager River over the compartments analysed (concentrations below the analytical limits are set to zero in this graph; mussels were sampled in the Ager river only but sample volumes were too small for an analysis of the trisphosphates) ............................................ 59
Figure 16: Concentration ranges (minimum-maximum bars) of trisphosphates in the Schwechat River over the compartments analysed (concentrations below the analytical limits are set to zero in this graph; mussels were sampled in the Ager River only) ............................ 60
Pollutants of Priority Concern in Austrian Rivers – Tables
6 Umweltbundesamt REP-0253, Vienna, 2010
TABLES
Table 1: Identification of the investigated trisphosphates ......................................... 14
Table 2: physical-chemical properties of the investigated trisphosphates obtained from http://www.syrres.com/what-we-do/product.aspx?id=133 .......................................................................... 15
Table 3: Location of the river water, suspended and active bottom sediment sampling locations as GPS determined on site (GARMIN Etrex) and verified post-hoc via Geoland air photographs . .......................................... 21
Table 4: Location of the fish and mussel sampling locations as GPS determined on site (GARMIN Etrex) and verified post-hoc via Google earth satellite images .................................................................................. 21
Table 5: Chromatographic parameters ..................................................................... 26
Table 6: ICPMS parameters ..................................................................................... 26
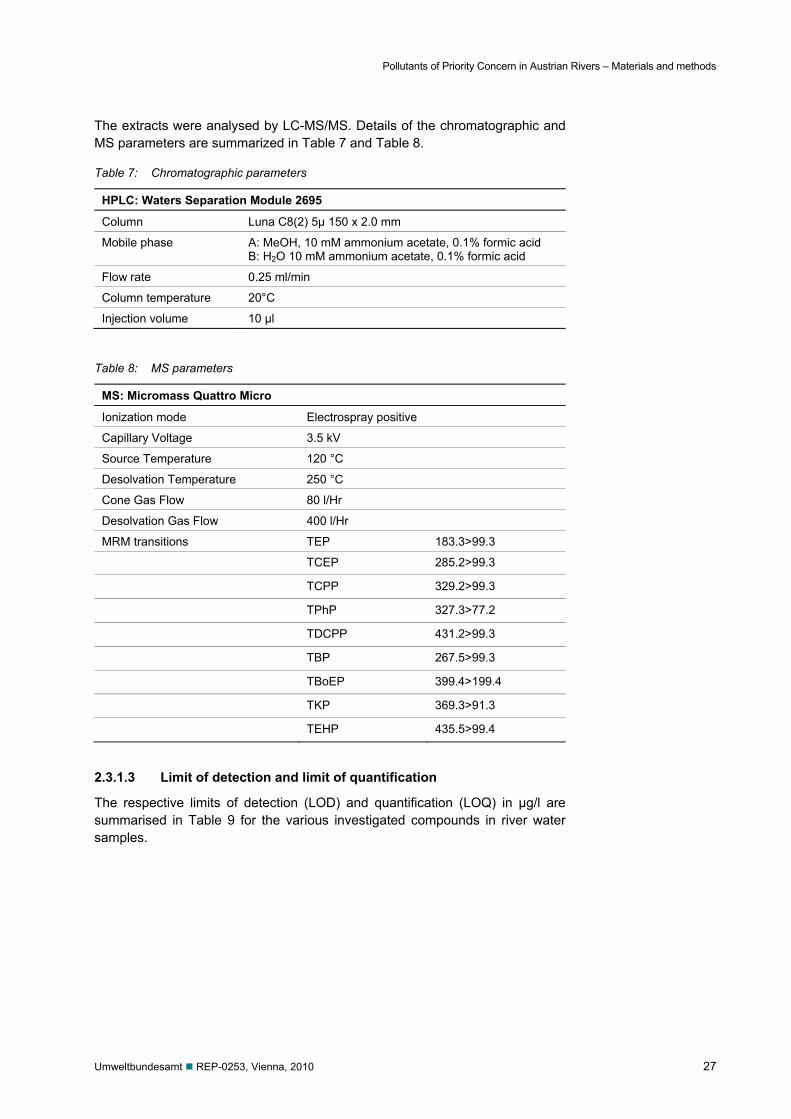
Table 7: Chromatographic parameters ..................................................................... 27
Table 8: MS parameters ........................................................................................... 27
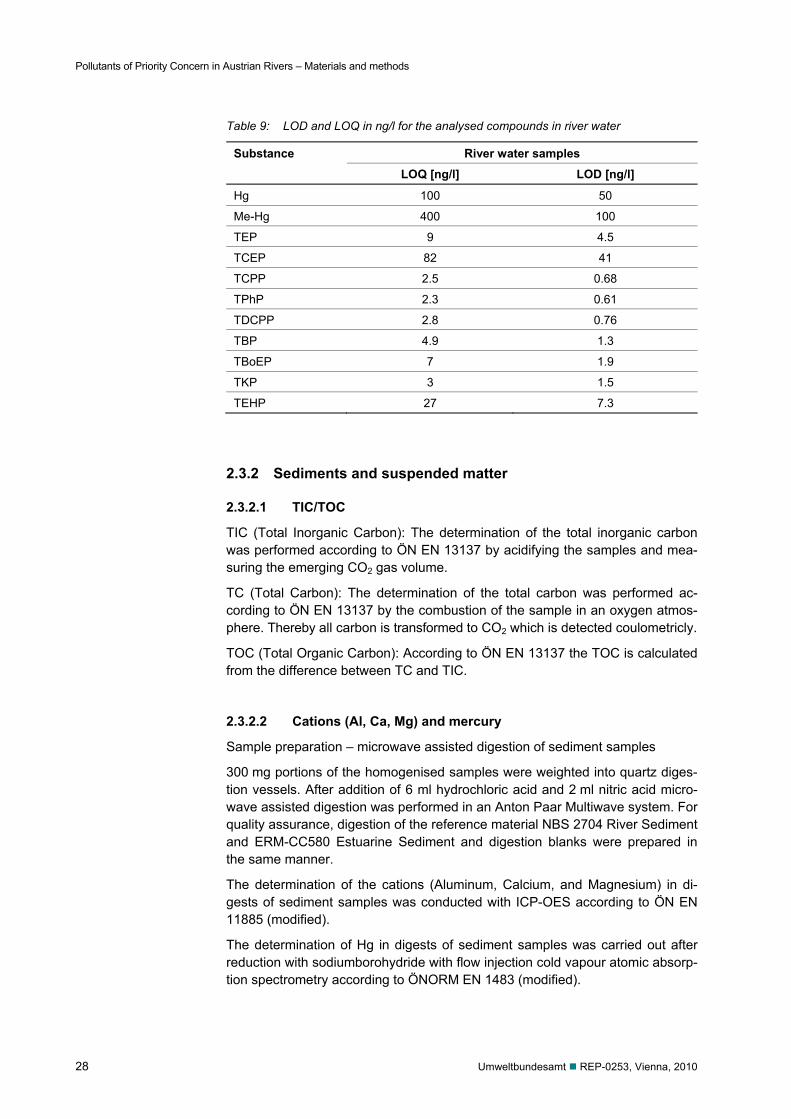
Table 9: LOD and LOQ in ng/l for the analysed compounds in river water ............... 28
Table 10: LOD and LOQ for the analysed compounds in suspended and active bottom sediment samples ........................................................................... 29
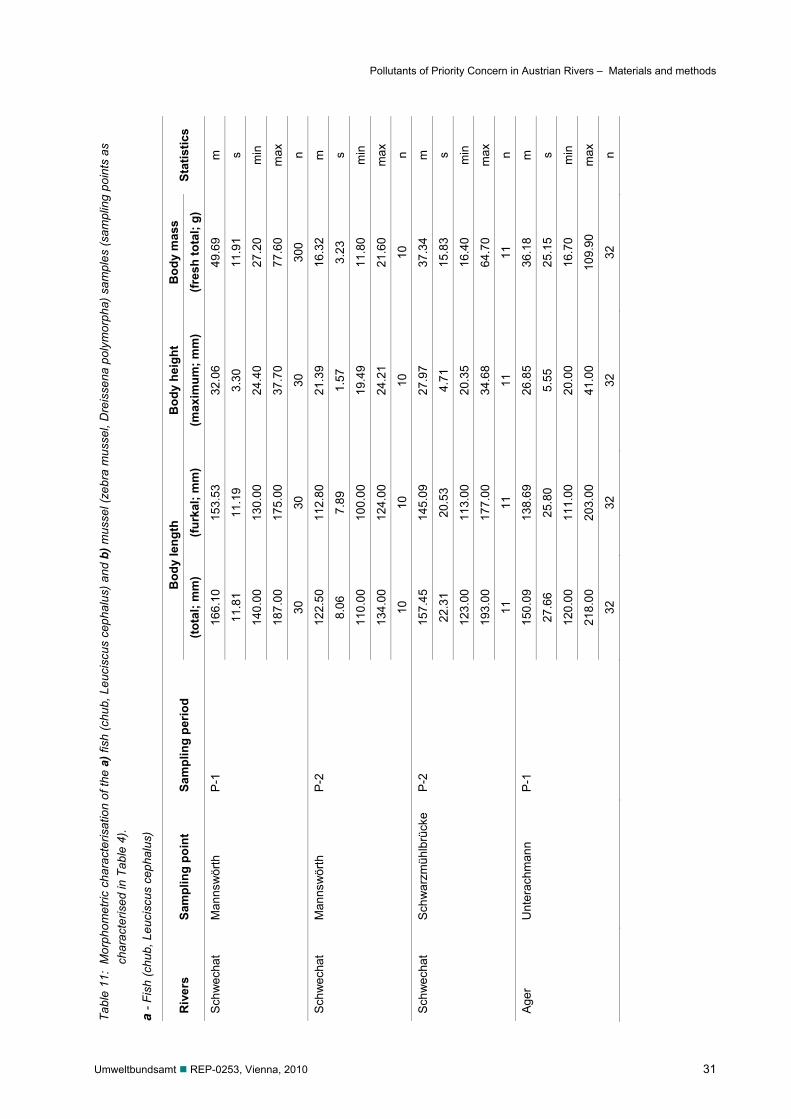
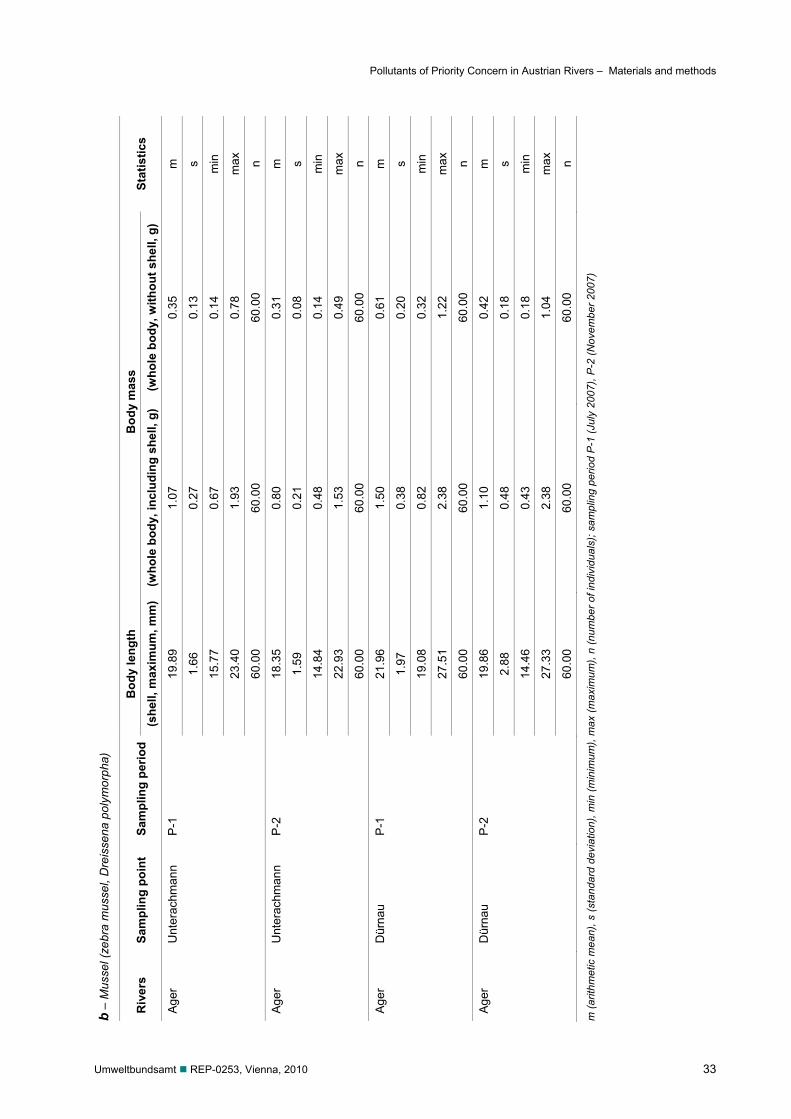
Table 11: Morphometric characterisation of the a) fish (chub, Leuciscus cephalus) and b) mussel (zebra mussel, Dreissena polymorpha) samples (sampling points as characterised in Table 4) .............................. 31
Table 12: LOD and LOQ [µg/kg dry wt] for the various investigated compounds in biota samples .......................................................................................... 35
Table 13: Mercury and methylmercury [µg/l] in river water samples ........................... 36
Table 14: Organophosphorus esters [ng/l] in river water samples .............................. 37
Table 15: Chemistry and mineralogy of suspended sediment (< 40 µm) and active fine bottom sediment (< 40 µm) in the river Schwechat at Brauhausstrasse sampling point ................................................................. 38
Table 16: Chemistry and mineralogy of suspended sediment (< 40 µm) and active fine bottom sediment (< 40 µm) in the river Ager at Raudaschlmühle sampling point ................................................................. 39
Table 17: Chemistry and mineralogy of suspended sediment (< 40 µm) and active fine bottom sediment (< 40 µm) in the Ager River at Scheiblmühle sampling point ...................................................................... 39
Table 18: Mercury and methylmercury [µg/kg] content in suspended sediments ....... 40
Table 19: Mercury and methylmercury [µg/kg] content in bottom sediments .............. 40
Table 20: Triphosphates [µg/kg dry wt] in suspended sediment and active fine bottom sediments from the river Schwechat at Brauhaus-Str. sampling site .............................................................................................. 42
Table 21: Triphosphates [µg/kg dry wt] in suspended sediment and active fine bottom sediments from the river Ager sampling sites ................................. 44
Pollutants of Priority Concern in Austrian Rivers – Tables
Umweltbundesamt REP-0253, Vienna, 2010 7
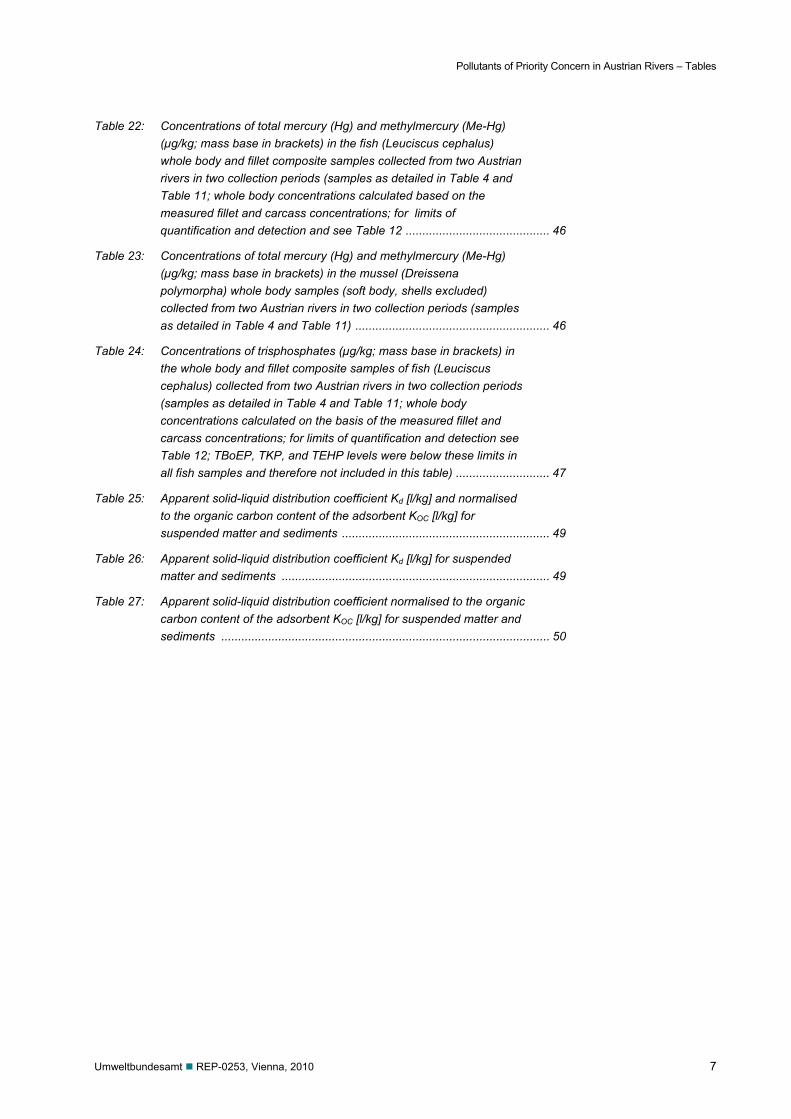
Table 22: Concentrations of total mercury (Hg) and methylmercury (Me-Hg) (µg/kg; mass base in brackets) in the fish (Leuciscus cephalus) whole body and fillet composite samples collected from two Austrian rivers in two collection periods (samples as detailed in Table 4 and Table 11; whole body concentrations calculated based on the measured fillet and carcass concentrations; for limits of quantification and detection and see Table 12 ........................................... 46
Table 23: Concentrations of total mercury (Hg) and methylmercury (Me-Hg) (µg/kg; mass base in brackets) in the mussel (Dreissena polymorpha) whole body samples (soft body, shells excluded) collected from two Austrian rivers in two collection periods (samples as detailed in Table 4 and Table 11) .......................................................... 46
Table 24: Concentrations of trisphosphates (µg/kg; mass base in brackets) in the whole body and fillet composite samples of fish (Leuciscus cephalus) collected from two Austrian rivers in two collection periods (samples as detailed in Table 4 and Table 11; whole body concentrations calculated on the basis of the measured fillet and carcass concentrations; for limits of quantification and detection see Table 12; TBoEP, TKP, and TEHP levels were below these limits in all fish samples and therefore not included in this table) ............................ 47
Table 25: Apparent solid-liquid distribution coefficient Kd [l/kg] and normalised to the organic carbon content of the adsorbent KOC [l/kg] for suspended matter and sediments .............................................................. 49
Table 26: Apparent solid-liquid distribution coefficient Kd [l/kg] for suspended matter and sediments ................................................................................ 49
Table 27: Apparent solid-liquid distribution coefficient normalised to the organic carbon content of the adsorbent KOC [l/kg] for suspended matter and sediments .................................................................................................. 50

Pollutants of Priority Concern in Austrian Rivers – Summary and conclusions
8 Umweltbundesamt REP-0253, Vienna, 2010
SUMMARY AND CONCLUSIONS
The aim of the present study was to generate a basis for an assessment of the occurrence and partitioning of the “priority pollutant” category mercury and its compounds, and the “emerging pollutants” trisphosphates (additives in flame re-tardants and softeners) in Austrian rivers. In two Austrian rivers (Schwechat and Ager) three abiotic compartments (river water, suspended and bottom sedi-ment) and three biotic compartments (fish, European Chub, Leuciscus cepha-lus, whole body and fillet, and zebra mussel, Dreissena polymorpha whole body) were compared for contamination with mercury and methylmercury as well as nine different trisphosphates (organophosphorus esters; TEP, TCEP, TCPP, TPhP, TDCPP, TBP, TBoEP, TKP, TEHP).
The key findings of the present study are as follows: Both pollutant categories
I. were ubiquitous in the fish samples, II. accumulated in fish and mussels, and III. accumulated on suspended and active bottom sediments. IV. An analysis of the partitioning of the analytes among the different com-
partments indicated that there was no single compartment suited best for monitoring a broader set of pollutants of priority concern: methylmercury was detected in fish (fillet > whole body) but not in water and sediments; more trisphosphate species were detected in the sediments than in the fish samples (whole body > fillet), and concentrations were highest and all above the detection limits in the suspended sediments fraction.
The observed mercury levels in water as well as in biota in almost all sam-ples were higher than the respective environmental quality standards. Mer-cury concentrations in fish reached critical limits for human consumption.
In order to perform an evaluation, further measurements are required as the EQSs refer to annual average values based on monthly samples. But never-theless, the described results highlight the necessity of further monitoring as a potential failure to reach the environmental quality target cannot be ex-cluded.
In order to assess mercury residues in fish with respect to safety for human consumption, further studies with fish species and size classes typically used for human consumption should be conducted.
Pollutants of Priority Concern in Austrian Rivers – Zusammenfassung
Umweltbundesamt REP-0253, Vienna, 2010 9
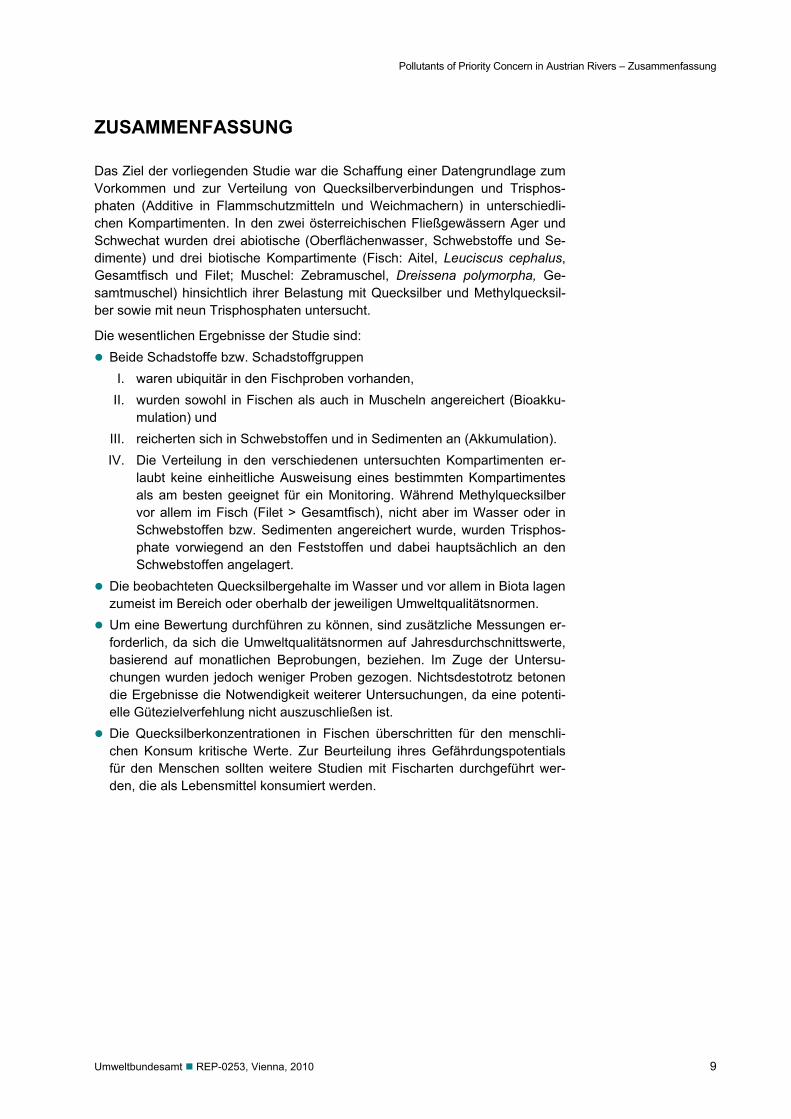
ZUSAMMENFASSUNG
Das Ziel der vorliegenden Studie war die Schaffung einer Datengrundlage zum Vorkommen und zur Verteilung von Quecksilberverbindungen und Trisphos-phaten (Additive in Flammschutzmitteln und Weichmachern) in unterschiedli-chen Kompartimenten. In den zwei österreichischen Fließgewässern Ager und Schwechat wurden drei abiotische (Oberflächenwasser, Schwebstoffe und Se-dimente) und drei biotische Kompartimente (Fisch: Aitel, Leuciscus cephalus, Gesamtfisch und Filet; Muschel: Zebramuschel, Dreissena polymorpha, Ge-samtmuschel) hinsichtlich ihrer Belastung mit Quecksilber und Methylquecksil-ber sowie mit neun Trisphosphaten untersucht.
Die wesentlichen Ergebnisse der Studie sind: Beide Schadstoffe bzw. Schadstoffgruppen
I. waren ubiquitär in den Fischproben vorhanden, II. wurden sowohl in Fischen als auch in Muscheln angereichert (Bioakku-
mulation) und III. reicherten sich in Schwebstoffen und in Sedimenten an (Akkumulation). IV. Die Verteilung in den verschiedenen untersuchten Kompartimenten er-
laubt keine einheitliche Ausweisung eines bestimmten Kompartimentes als am besten geeignet für ein Monitoring. Während Methylquecksilber vor allem im Fisch (Filet > Gesamtfisch), nicht aber im Wasser oder in Schwebstoffen bzw. Sedimenten angereichert wurde, wurden Trisphos-phate vorwiegend an den Feststoffen und dabei hauptsächlich an den Schwebstoffen angelagert.
Die beobachteten Quecksilbergehalte im Wasser und vor allem in Biota lagen zumeist im Bereich oder oberhalb der jeweiligen Umweltqualitätsnormen.
Um eine Bewertung durchführen zu können, sind zusätzliche Messungen er-forderlich, da sich die Umweltqualitätsnormen auf Jahresdurchschnittswerte, basierend auf monatlichen Beprobungen, beziehen. Im Zuge der Untersu-chungen wurden jedoch weniger Proben gezogen. Nichtsdestotrotz betonen die Ergebnisse die Notwendigkeit weiterer Untersuchungen, da eine potenti-elle Gütezielverfehlung nicht auszuschließen ist.
Die Quecksilberkonzentrationen in Fischen überschritten für den menschli-chen Konsum kritische Werte. Zur Beurteilung ihres Gefährdungspotentials für den Menschen sollten weitere Studien mit Fischarten durchgeführt wer-den, die als Lebensmittel konsumiert werden.

Pollutants of Priority Concern in Austrian Rivers – Introduction
Umweltbundesamt REP-0253, Vienna, 2010 11
1 INTRODUCTION
1.1 Background and significance
1.1.1 Mercury
Mercury has been known since antiquity. It rarely occurs as the free metal in na-ture. The main ore from which mercury is extracted is cinnabar (mercuric sul-phide). Mercury exists in organic (e.g. phenylmercury acetate and methyl-mercuric chloride) and inorganic (e.g. mercury salt, mercuric ll chloride, mercur-ous l chloride) forms. However, these forms may interconvert over time – or-ganic mercury may slowly decompose to form inorganic mercury while inorganic mercury can be transformed into organic mercury by bacteria in soil and water. Some mercury salts and organic compounds are soluble in water, depending on the chemical species.
Mercury is widely used in the manufacture of thermometers, barometers, diffu-sion pumps and other instruments. It is also used in making mercury-vapour lamps and advertising signs, and in mercury switches, batteries and other elec-trical apparatus. Other uses are in the chlor-alkali industry and in dental fillings. Former uses in pesticide, pharmaceutical and paint manufacturing have now been phased out.
Mercury is a silvery-white metal that is liquid at room temperature. It freezes at –39 degrees C and it boils at 357 degrees C at atmospheric pressure. Mercury is appreciably volatile. It is odourless and non-flammable. It forms a number of inorganic and organic compounds, notably mercuric and mercurous chlorides and methyl mercury (UK EA 16.02.2009).
Mercury and its compounds are very toxic to wildlife. As a chemical element mercury that is released into the environment will remain there indefinitely al-though it may be converted to various forms over time. Organic mercury com-pounds tend to bioaccumulate in organisms and biomagnify up trophic food chains, and can have a significant effect on aquatic species. Low levels of mer-cury contamination in water bodies can lead to high concentrations in insects, fish and birds, leading to very toxic contamination in various parts of the ecosys-tem. Mercury is also toxic to plants and microorganisms, hence its former use as a fungicide and bactericide (UK EA 16.02.2009).
Excessive exposure to mercury and its compounds may affect the brain, diges-tive system, eye, heart, kidney, lung, reproductive system, skin, and the unborn child (UK EA 16.02.2009).
Mercury is classified as toxic and dangerous to the environment and has to be labelled accordingly (T, N, R23: Toxic by inhalation; R33: Danger of cumulative effects; R50/53: Very toxic to aquatic organisms, may cause long-term adverse effects in the aquatic environment) (ECB 16.02.2009).
The EU’s mercury strategy is a comprehensive plan addressing mercury pollu-tion both in the EU and globally. It contains 20 measures to reduce mercury emissions, cut supply and demand and protect against exposure, especially to methylmercury found in fish (EC 2009). Mercury is the subject of various sub-
Pollutants of Priority Concern in Austrian Rivers – Introduction
12 Umweltbundesamt REP-0253, Vienna, 2010
stance specific regulations concerning emissions into water, air and soil as well as emissions from products. The main regulations referring to mercury in sur-face waters and groundwater are (list not complete):
European Water Framework Directive (2000/60/EC): framework for Commu-nity action in the field of water policy and establishing the list of priority sub-stances: mercury is defined as priority hazardous substance
Environmental quality standards (2008/105/EC): establishing environmental quality standards in the field of water policy
European Water Protection Directive (2006/11/EC, former Dangerous Sub-stances Directive 76/464/EEC): avoiding pollution caused by certain danger-ous substances discharged into the aquatic environment
Council Directive on mercury discharges (82/176/EEC): establishing limit val-ues and quality objectives for mercury discharges by the chlor-alkali electro-lysis industry
Council Directive on mercury discharges (84/156/EEC): establishing limit val-ues and quality objectives for mercury discharges by sectors other than the chloralkali electrolysis industry
Groundwater Directive (2006/118/EC): protection of groundwater against pol-lution and deterioration, member states have to establish threshold values
In January 2009 the European directive establishing environmental quality stan-dards (EQS) in the field of water policy (Directive 2008/105/EC) entered into force and member states are obliged to adopt national legislation to comply with this directive by 13 July 2010.
Directive 2008/105/EC defines a limit value (AA-EQS) for concentrations of mer-cury and its compounds of 50 ng/l expressed as an annual average value and of 70 ng/l expressed as maximal allowable concentration (MAC-EQS). The EQS refers to the dissolved concentration, i.e. the dissolved phase of a water sample obtained by filtration through a 0.45 μm filter or any equivalent pre-treatment.
Mercury occurs in natural water in several forms including elemental Hg (Hg0), which is rare in unpolluted waters, ionic Hg (Hg+ and Hg2+) and methylated Hg (CH3Hg+). There is increasing evidence that natural organic materials form strong complexes with mercury, via sulphidic functional groups, which influence the concentration, speciation and subsequent bioaccessibility of mercury in the aquatic environment. Background levels of Hg in surface water are usually very low, typically < 0.1 μg/l. Mercury minerals, such as cinnabar and metacinnabar, are insoluble under normal conditions, and metallic mercury will not react with stream water directly.
The median Hg content in European stream sediment is 40 µg/kg (N=848, < 0.15 mm) with a range from 3 to 13600 µg/kg. Mercury in stream sediment shows only a very weak correlation with antimony Sb (0.25) and zinc Zn (0.22). Mercury in floodplain sediment showed a good correlation (> 0.4) with Copper Cu and Cadmium Cd and a weak correlation with Zinc Zn and Phosphorus pen-toxide P2O5. This association points to mineralisation (Cu, Zn, Cd) and possible anthropogenic influence (phosphate fertilisers).
Normal soil (n=1612; < 2 mm) typically contains 20–150 μg/kg Hg, and surface soil values do not tend to exceed 400 μg/kg. The accumulation of Hg is related mainly to the levels of organic carbon C and sulphur S in soil (SALMINEN 2005).
Pollutants of Priority Concern in Austrian Rivers – Introduction
Umweltbundesamt REP-0253, Vienna, 2010 13
As mercury is known to bioaccumulate and the defined EQS in surface waters requires a sophisticated chemical analysis, directive 2008/105/EC also defines an EQS for biota equal to 20 µg/kg for mercury and its compounds in prey tis-sue (wet weight). The most appropriate indicator among fish, molluscs, crusta-ceans and other biota should be chosen.
Mercury emissions are, however, distributed over long distances in the atmos-phere and oceans. … Data on mercury concentrations in fish have been submit-ted from a number of nations and international organisations. Additionally, many investigations of mercury levels in fish are reported in the literature. Submitted data, giving examples of mercury concentrations in fish from various locations in the world, are summarised in the chapter. The mercury concentrations in vari-ous fish species are generally from about 0.05 to 1.4 milligrams of mercury per kilogram of fish tissue (mg/kg) depending on factors such as pH and redox po-tential of the water, and species, age and size of the fish. Since mercury bio-magnifies in the aquatic food web, fish higher on the food chain (or of higher trophic level) tend to have higher levels of mercury. Hence, large predatory fish, such as king mackerel, pike, shark, swordfish, walleye, barracuda, large tuna (as opposed to the small tuna usually used for canned tuna), scabbard and marlin, as well as seals and toothed whales, contain the highest concentrations. The available data indicate that mercury is present all over the globe (especially in fish) in concentrations that adversely affect human beings and wildlife. These levels have led to consumption advisories (for fish, and sometimes marine mammals) in a number of countries, warning people, especially sensitive sub-groups (such as pregnant women and young children), to limit or avoid con-sumption of certain types of fish from various waterbodies. Moderate consump-tion of fish (with low mercury levels) is not likely to result in exposures of con-cern. However, people who consume higher amounts of contaminated fish or marine mammals may be highly exposed to mercury and are therefore at risk (UNEP 2002).
With respect to food safety for human consumption, several countries and inter-national organizations have established reference levels for daily or weekly methyl-mercury or mercury intakes which, based on available data and research, are estimated to be safe (or without appreciable risk to health). The reference intake levels for methylmercury exposures range from 0.7 to 2 µg methylmer-cury per kilogram body weight (µg/kg body weight) per week (WHO 2008).
Because fish consumption dominates the pathway for exposure to methylmer-cury for most human populations, many governments provide recommendations or legal limits for the maximum allowable amount of mercury and/or methylmer-cury in fish to be sold on the market. For example, Codex Alimentarius guideline levels are 0.5 mg methylmercury/kg in non-predatory fish and 1 mg methylmer-cury/kg in predatory fish. The US Food and Drug Administration(FDA) has set an action level of 1 mg/kg for methylmercury in finfish and shellfish. The Euro-pean Community allows 0.5 mg/kg mercury in fishery products (with some ex-ceptions), and Japan allows up to 0.4 mg/kg total mercury (or 0.3 mg/kg me-thylmercury) in fish (WHO 2008).
As regards mercury, the EFSA adopted on 24 February 2004 an opinion related to mercury and methylmercury in food (1) and endorsed the provisional toler-able weekly intake of 1.6 μg/kg body weight. Methylmercury is the chemical form of most concern and can make up more than 90% of the total mercury in fish and seafood (EC 2006).
Pollutants of Priority Concern in Austrian Rivers – Introduction
14 Umweltbundesamt REP-0253, Vienna, 2010
According to the Commission Regulation setting maximum levels for certain contaminants in foodstuffs (EC 2006a, 2006b), maximum levels of mercury in fishery products and muscle meat of fish are 0.50 (mg/kg wet mass), but 1.0 mg/kg wet mass for species listed in chapter 3.3.
The European Food Safety Authority (EFSA) stresses that the main source of human exposure to methylmercury from food is fish and seafood products and provides precautionary advice for vulnerable groups and life phases, in particu-lar pregnancy and early childhood (EC 2004).
1.1.2 Trisphosphates
Trisphosphates are widely used as additives in flame retardants and softeners and are commonly attributed to the so-called “emerging pollutants”. The term ‘‘emerging pollutants’’ defines chemicals which are emitted to the environment but not yet included in national or international monitoring programmes. In view of their fate and (eco)toxicology they might be subjected to future restrictions, through derivation of quality standards, and be considered in monitoring pro-grammes.
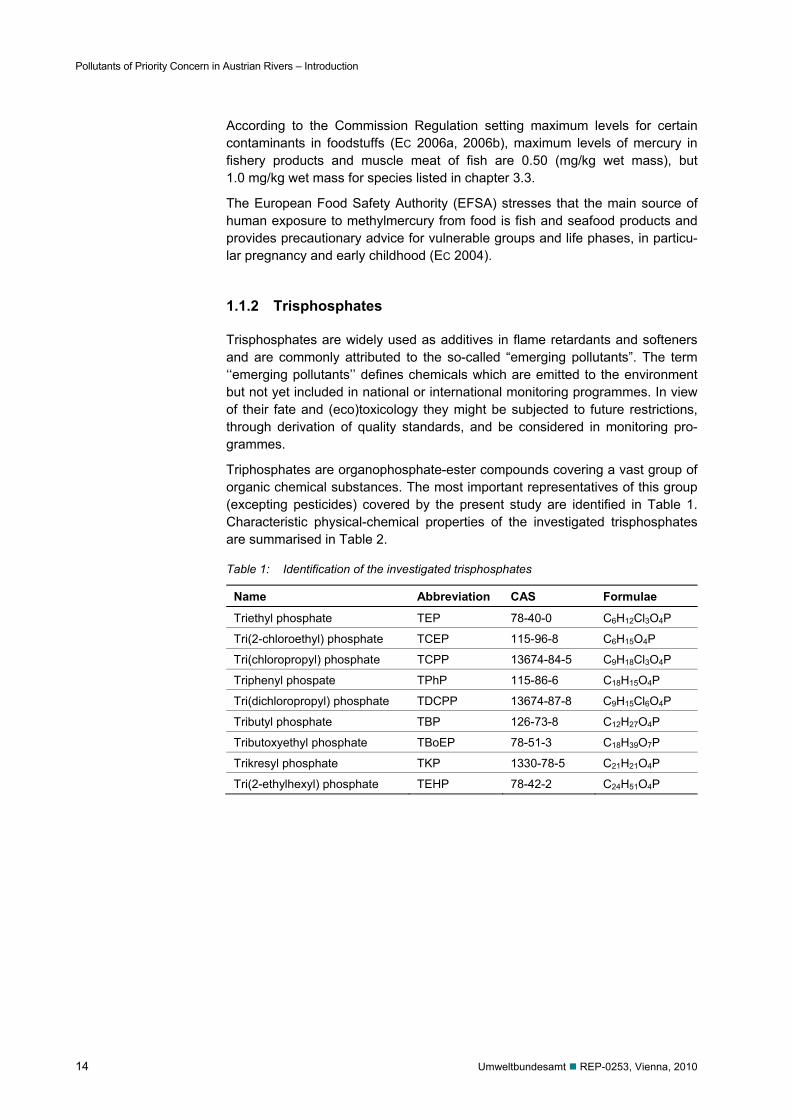
Triphosphates are organophosphate-ester compounds covering a vast group of organic chemical substances. The most important representatives of this group (excepting pesticides) covered by the present study are identified in Table 1. Characteristic physical-chemical properties of the investigated trisphosphates are summarised in Table 2.
Table 1: Identification of the investigated trisphosphates
Name Abbreviation CAS Formulae
Triethyl phosphate TEP 78-40-0 C6H12Cl3O4P
Tri(2-chloroethyl) phosphate TCEP 115-96-8 C6H15O4P
Tri(chloropropyl) phosphate TCPP 13674-84-5 C9H18Cl3O4P
Triphenyl phospate TPhP 115-86-6 C18H15O4P
Tri(dichloropropyl) phosphate TDCPP 13674-87-8 C9H15Cl6O4P
Tributyl phosphate TBP 126-73-8 C12H27O4P
Tributoxyethyl phosphate TBoEP 78-51-3 C18H39O7P
Trikresyl phosphate TKP 1330-78-5 C21H21O4P
Tri(2-ethylhexyl) phosphate TEHP 78-42-2 C24H51O4P

Pollutants of Priority Concern in Austrian Rivers – Introduction
Umweltbundesamt REP-0253, Vienna, 2010 15
Table 2: physical-chemical properties of the investigated trisphosphates obtained from http://www.syrres.com/what-we-do/product.aspx?id=133
MW [g/mol] SW [g/l] log POW [-] VP [Pa] TEP 182.16 500.0 0.8 52 TCEP 285.49 7.0 1.44 8 TCPP 327.57 1.2 2.59 2.69 x 10⁻³ TPhP 326.29 0.0019 4.59 8.37 x 10⁻⁴ TDCPP 430.91 0.007 3.65 9.81 x 10⁻⁶ TBP 266.32 0.28 4.00 1.51 x 10⁻¹ TBoEP 398.48 1.1 3.75 3.33 x 10⁻⁶ TKP 368.37 0.00036 5.11 8.00 x 10⁻⁵ TEHP 434.65 0.0006 9.49 1.10 x 10⁻⁵
MW…molecular weight, SW…water solubility, POW…octanol-water equilibrium distribution coefficient, VP…vapour pressure
The draft on the risk assessment of tri(2-chloroethyl) phosphate (TCEP) re-leased in March 2006 concluded that, at present, there is no need for further studies or reduction measures as regards environmental protection, while risk assessment with respect to human health has not yet been completed. Never-theless, it recognised the carcinogenicity, high toxicity and environmental per-sistence of this compound. However, TCEP does not meet the PBT criteria (persistence, bioaccumulation and toxicity), as it is not bioaccumulative. Risk assessment for the other two chlorinated compounds has not yet been com-pleted, but tri(chloropropyl) phosphate (TCPP) is also a suspected carcinogen, while the carcinogenicity of tri(dichloropropyl) phosphate (TDCPP) seems to have been proved more clearly. These two compounds with higher log KOW val-ues (Table 2) may therefore eventually meet the PBT criteria and may then re-quire regulatory measures to be taken. In the case of non-chlorinated trisphos-phates, neurotoxic effects were found for tributyl phosphate (TBP) and triphenyl phosphate (TPhP), whereas tributoxyethyl phosphate (TBoEP) is also a sus-pected carcinogenic compound (REEMTSMA et al. 2008).
For TBP, TCEP and TEP harmonised classification exists in Europe: TEP is classified as harmfull if swallowed (Xn, R22: harmful if swallowed). TBP is classified as Carc.Cat. 3, harmfull if swallowed and irritating to the skin (Carc.Cat. 3, Xn, Xi; R22: harmful if swallowed; R38: irritating to the skin; R40: limited evidence of a carcinogenic effect).
TCEP is classified as toxic to reproduction Cat. 2, Carc.Cat. 3, toxic and dan-gerous to the environment as well as harmfull (Repr. Cat. 2 R60: may impair fertility, Carc.Cat. 3 R40: limited evidence of a carcinogenic effect, Xn R22: harmful if swallowed and N R50/53: Very toxic to aquatic organisms, may cause long-term adverse effects in the aquatic environment) and has to be labelled accordingly (T, N) (ECB, 16.02.2009).
In the framework of the authorisation process according to REACH (Regulation (EC) No 1907/2006), Member States Competent Authorities or the European Chemicals Agency (ECHA), upon request of the European Commission, may prepare Annex XV dossiers for the identification of Substances of Very High Concern (SVHC). TCEP, classified as toxic to reproduction (cat. 2), has been identified as a SVHC (ECHA 2009).
Pollutants of Priority Concern in Austrian Rivers – Introduction
16 Umweltbundesamt REP-0253, Vienna, 2010
Trisphosphates are mostly employed as flame retardants in plastics, textiles and electronic equipment, as well as in furniture and construction, but also for anti-foaming, as additives to lacquers, in hydraulic fluids or floor polish, in hy-drometallurgy and as plasticisers. Many trisphosphates are regarded as high-production volume chemicals (HPVC) (REEMTSMA et al. 2008).
1.2 Current state of research
1.2.1 Mercury and its compounds
Metals in general and mercury and its compounds in particular are among the most intensively studied chemical classes in ecotoxicology with the state-of-the-science condensed in textbooks on metal toxicology (e.g., NORDBERG et al. 2007), reproductive toxicology (e.g., GOLUB 2006); ecotoxicology as well as ha-zard and life-cycle assessment (e.g., PAQUIN et al. 2003; DUBREUIL 2005; ADAMS & CHAPMAN 2007); environmental chemistry and important aspects of the speci-ation and availability of metals (e.g., SIEGEL 2002).
The ecotoxicology of metals has been reviewed for various biota such as ‘aqua-tic organisms’ (MANCE 1987), invertebrates (DALLINGER & RAINBOW 1993), fish (SORENSEN 1991), amphibians (LINDER & GRILLITSCH 2000), reptiles (GRILLITSCH & SCHIESARI in press), birds, and mammals, humans in particular (e.g., NORDBERG et al. 2007). Among the mercury targeted reviews, some of the most comprehensive ones were compiled by EISLER (1987, 2006), WOLFE et al. (1998), CHAN et al. (2003), WIENER et al. (2003), and HARRIS et al. (2007). Spe-cial issues of journals on mercury ecotoxicity were edited by EVERS & CLAIR (2005) and HARRIS et al. (2008).
Ultimately, the key findings of the Global Mercury Assessment (UNEP 2002) are that a. mercury is present throughout the environment; b. mercury is persistent and cycles globally; c. exposure to mercury has serious effects; d. intervention can be successful. Nowadays, mercury in the environment is recognised as a substance of utmost global concern which has reached a high priority in national and international environmental agencies and commissions such as the
European Commission DG Environment http://ec.europa.eu/environment/chemicals/mercury/
European Environment Agency http://dataservice.eea.europa.eu/atlas/viewdata/viewpub.asp?id=3204 http://dataservice.eea.europa.eu/atlas/available2.asp?type=findkeyword&theme=mercury
Environment Canada http://www.ec.gc.ca/MERCURY/EN/index.cfm http://www.ns.ec.gc.ca/msc/as/chemistry_mercury.html
United States Environmental Protection Agency (USEPA) http://www.epa.gov/mercury/
Pollutants of Priority Concern in Austrian Rivers – Introduction
Umweltbundesamt REP-0253, Vienna, 2010 17
US EPA Framework for Metals Risk Assessment http://cfpub.epa.gov/ncea/cfm/recordisplay.cfm?deid=167607
United States Geological Survey (USGS) http://www.usgs.gov/mercury/ http://minerals.usgs.gov/minerals/pubs/commodity/mercury/
United Nations Environment Programme (UNEP). Chemicals http://ec.europa.eu/environment/chemicals/mercury/ http://www.chem.unep.ch/MERCURY/publications/default.htm
Environment Agency Austria http://www.umweltbundesamt.at/umweltschutz/umweltanalytik/schadstoff/methylhg/
With regard to “Global Mercury Challenges” the European Council adopted the following conclusions in December 2008: http://europa.eu/rapid/pressReleasesAction.do?reference=PRES/08/355&format=HTML&aged=0&language=EN&guiLanguage=en >
There, the Council of the European Union: 1. reiterates that mercury is recognised as being persistent, toxic, bioaccumula-
tive and having long-range transport properties. 2. affirms its commitment to the overall objective of protecting human health
and the environment from the release of mercury and its compounds by minimising and, where feasible, ultimately eliminating global anthropogenic mercury releases to air, water and land.
3. recalls that the Council conclusions of 24th June 2005 regarded it as essen-tial to continue and intensify international efforts to reduce mercury emis-sions and exposure on a global scale with a view to achieving a global phase-out of primary production, preventing surpluses from re-entering the market, as well as phasing out its use and trade, taking into account the availability of alternatives.
4. underlines the progress made in implementing the Community Strategy Concerning Mercury since 2005, in particular the adoption of legislative acts exclusively dedicated to mercury: the 2007 Directive relating to restrictions on the marketing of certain measuring devices containing mercury and the Regulation on the banning of exports from the European Union and the safe storage of mercury as from March 2011, which was adopted this year. Under this Regulation, metallic mercury has to be safely stored within the EU in fa-cilities guaranteeing a high level of safety.
1.2.2 Trisphosphates
Organophosphorus flame retardants and plasticisers belong to the so-called emerging pollutants and have gained interest in the past decade.
Few studies exist on the occurrence and behaviour of trisphosphates in waste-water (MEYER & BESTER 2004; MARKLUND et al. 2005; RODIL et al. 2005; MARTINEZ-CARBALLO et al. 2007). TBoEP, in most cases, showed the highest in-fluent concentrations, but is at least partially removed during wastewater treat-
Pollutants of Priority Concern in Austrian Rivers – Introduction
18 Umweltbundesamt REP-0253, Vienna, 2010
ment. Whereas TBoEP, TBP and TPhP are moderately removed, the chlori-nated trisphosphates TCEP, TCPP and TDCPP usually are not removed during wastewater treatment. Thus, the chlorinated trisphosphates are discharged in nearly undiminished amounts into the aquatic environment. As major removal process for TBP and TPhP in wastewater treatment plants (WWTPs) biodegra-dation is assumed, since they were completely degraded (but not always mine-ralised) in laboratory degradation studies (KAWAGOSHI et al. 2002). In such la-boratory studies, chlorinated trisphosphates proved to be not biodegradable.
The discharge by wastewater treatment plants is considered the major source of trisphosphates in the aquatic environment. Apparently, especially the recalci-trant chlorinated trisphosphates are also present in surface waters (ANDRESEN et al. 2004; MARTINEZ-CARBALLO et al. 2007). Due to their polarity and poor bio-degradability some trisphosphates can also be found in bank filtrates (KNEPPER et al. 1999).
Trisphosphates are used as building materials, in upholstery and in floor polish-es and are therefore found in higher concentrations in indoor air samples than in outdoor samples (REEMTSMA et al. 2008). Concentrations in indoor air sam-ples show great variations depending on the usage of e.g. computer or screens, floor polishes or wall coverings. Furthermore they are found in explicitly high concentrations in air samples from hospitals and prisons as a result of their usage as flame retardants in mattresses. TCPP is especially used in the uphols-tery of cars and public transport vehicles where it is found in 10- to 100-fold higher concentrations compared to private houses (REEMTSMA et al. 2008). Moreover, trisphosphates were also detected in outdoor air samples and envi-ronmental samples from remote areas. Thus, air transport also contributes to the distribution of trisphosphates in the environment (REEMTSMA et al. 2008).
Among trisphosphates, organophosphorus (organic phosphate ester) flame re-tardants include compounds with low to very high hydrophobicity (log Kow 1–9) and therefore, some of these compounds were considered to have a potential for secondary poisoning (VERBRUGGEN et al. 2005). A comprehensive environmental risk assessment and evaluation study has been conducted for TCEP [tris(2-chloroethyl)phosphate)], TCPP [tris(1-chloro-2-propyl)phosphate], TDCP [tris(1,3-dichloro-2-propyl)phosphate], TBP [tri-nbutylphosphate], TiBP [tri-iso-butyl phos-phate], TEP [triethyl phosphate], TBEP [tris(butoxyethyl) phosphate], TEHP [tris(2-ethylhexyl) phosphate], TPP [triphenylphosphate], and TCP [tricresylphos-phate] (VERBRUGGEN et al. 2005). WHO IPCS (World Health Organisation, Inter-national Programme on Chemical Safety) has published Environmental Health Criteria Monographs (EHCs) for several flame retardants including TBPP [tris- and bis(2,3-dibromopropyl) phos-phate], TBEP [tris(2-butoxyethyl)phosphate], and TCPP among others (http://www.inchem.org/pages/ehc.html). Compre-hensive field studies on the accumulation of organophosphorus flame retar-dants in fish are still compara-tively scarce, and diverging with regard to the chemical and biological species and compartments analysed as well as to time and space, general environmental conditions, and types and degrees of habitat degradation. Overall, various trisphosphates have been detected in fish from Japan (WHO 1998, 2000), the Netherlands (VERBRUGGEN et al. 2005), the Nor-wegian Arctic (EVENSET et al. 2009) and Sweden (NATURVARDSVERKET 2009).
Pollutants of Priority Concern in Austrian Rivers – Introduction
Umweltbundesamt REP-0253, Vienna, 2010 19
1.2.3 Conclusions
Publications dealing with the fate and effects of mercury and its compounds in abiotic and biotic ecosystem compartments are abundant. Nevertheless, there is still an urgent need a. to build a database on the distribution of mercury within food webs in Austria,
and b. to design the most appropriate monitoring strategies. Whereas data for mercury and its compounds in abiotic and biotic ecosystems are available, only little information exists on the occurrence, distribution and fate of trisphosphates in the environment.
1.3 Research aims
The aim of the present study was to generate a basis for an assessment of the occurrence and partitioning of the “priority pollutants” mercury and methylmer-cury, and the “emerging pollutants” trisphosphates in Austrian rivers. For this purpose two Austrian lowland rivers were sampled at various sampling points. The sampled locations represent markedly different types and degrees of anth-ropogenic modifications. The analysis focused on the distribution of the analytes among the compartments water, particles (suspended and active bottom sedi-ments) and biota (fish and bivalves).
Pollutants of Priority Concern in Austrian Rivers – Materials and methods
20 Umweltbundesamt REP-0253, Vienna, 2010
2 MATERIALS AND METHODS
2.1 Sampling design
Mercury and methylmercury as well as organophosphate esters were analysed in biota (fish and mussels), river water, suspended particulate matter (SPM) and sediment samples. Although environmental quality standards usually refer to the water fraction it might be suitable to address other environmental compart-ments. Especially apolar lipophilic compounds with a low water solubility and high octanol-water distribution coefficient are hardly detectable in water, be-cause they tend to accumulate in biota and/or suspended matter or sediments.
SPM or suspended load in waters is that part of the stream load that is carried in suspension for a considerable period of time, free of contact with the stream bed (BATES & JACKSON 1980). The total amount of any sub-stance in the water is often separated into a particulate phase, the only one subject to gravitational sedimentation, and a dissolved phase. Operationally, the limit between particu-late and dissolved phase is generally determined by means of filtration, using a pore size of 0.45 µm. Evidently, this is an operational approach and many col-loidal particles will pass through such filters. WHITE (2008) divided suspended particulate matter (SPM) into the wash load which consists of all particles of less than 63 µm and the suspended bed material load consisting of coarser par-ticles intermittently moved from the river bed. The latter typically vary logarith-mically with depth toward the stream bed and gain in importance in Mountain Rivers and during storm floods.
The total amount of SPM found in natural waters is generally a complex mixture of substances of different origins with different properties (size, form, density, specific surface, capacity to bind pollutants, etc.). SPM may be divided into an organic (particulate organic material POM) and an inorganic fraction (particulate inorganic material PIM) (HÁKANSON 2007). Both change in composition with de-creasing grain size (KRALIK & AUGUSTIN 1993, 1994).
2.1.1 Rivers and sampling points
The two Austrian rivers analysed in this study are part of the Austrian Danube river basin (sub district downstream Jochenstein). They are well characterised with respect to their hydromorphology as well as with regard to abiotic and biotic river quality elements (KRALIK & SAGER 1987a, 1987b; JUNGWIRTH & WOHLSCHLAGER 1995; KRIECHBAUM & MOOG; SCHMEDTJE et al. 2005; MOOG et al. 2006; Wasserinformationssystem Austria http://wisa.lebensministerium.at). a. The Schwechat River (eastern Lower Austria) just east of Vienna is a heavily
modified (regulated channel) lowland river impacted by agriculture, industry and urbanization. It is characterised by a low gradient of 0.0031 and a mean flow rate of 7 (2-92) m3/s. The suspended sediment concentration varied ac-cording to filtration tests (Annex 1) from 7 to 31 mg/l.
b. The Ager River (pre-alpine Upper Austria) 30 km west of Linz is a lowland river partly impacted by industry and agriculture. It is characterised by a low gradient of 0.0038 as well as mean flow rate of 16 (2-55) m3/s. The sus-pended sediment concentration (see Annex 1 to Annex 3) is as low as 0.1 to 0.6 mg/l due to no (Raudaschlmühle) – or only a short – distance from the outflow (Scheiblmühle) of Lake Attersee.

Pollutants of Priority Concern in Austrian Rivers – Materials and methods
Umweltbundesamt REP-0253, Vienna, 2010 21
Along each river, two sampling locations were selected which are part of the Austrian Water Quality Monitoring System (AWQMS) according to the European Water Framework Directive (WFD) [Water Quality Monitoring Ordinance (Was-sergüte-Erhebungsverordnung WGEV) Federal Legal Gazette No. 338/1991 un-til December 2006; Ordinance on the Monitoring of the Status of Water Bodies (Gewässerzustandsüberwachungsverordnung GZÜV), Federal Legal Gazette No. 479/2006; GZÜV-Oberflächengewässer (Surface Waters); WAGNER & DEUTSCH 2008]. Three to four monitoring sites were selected including contami-nated and uncontaminated river sections.
The river water, suspended and active bottom sediment sampling sites are just below a weir not far from the AWQMS monitoring points (Table 3).
Table 3: Location of the river water, suspended and active bottom sediment sampling locations as GPS determined on site (GARMIN Etrex).
River Sampling point Position* Comments
Schwechat Brauhausstrasse Schwechat
E 16°32’14’’ N 48°09’22’’
Just before junction with Mitterbach
Ager Raudaschlmühle Schörfling
E 13°36’29’’ N 47°57’07’’
at the weir Raudaschlmühle
Ager Scheiblmühle Timelkam
E 13°37’06’’ N 47°59’29’’
at the weir Scheiblmühle
* Coordinates of the sampling points (GPS WGS84), midway of sampling stretch; E…Longitude East, N…Latitude North
The fish and mussel sampling stretches were close to the AWQMS monitoring points as characterised in Table 4 and Figure 1 to Figure 6.
Table 4: Location of the fish and mussel sampling locations as GPS determined on site (GARMIN Etrex) and verified post-hoc via Google earth satellite images.
River Sampling point Position* Length (m) of fish (mus-sels) sampling stretches
Schwechat Mannswörth E 16°29´07,44´´ N 48°08´56,21´´
1000 (1000)
Schwechat Schwarzmühlbrücke Steggasse
E 16°28´24,79´´ N 48°08´24,10´´
1000 (400)
Ager Unterachmann E 13°36´31,42´´ N 47°57´49,12´´
1000 (400)
Ager Dürnau E 13°38´01,74´´ N 47°59´43,54´´
1000 (400)
* Coordinates of the sampling points (GPS WGS84), midway of sampling stretch; E…Longitude East, N…Latitude North

Pollutants of Priority Concern in Austrian Rivers – Materials and methods
22 Umweltbundesamt REP-0253, Vienna, 2010
Figure 1: Localisation of the two sampling sites at the river Schwechat at Mannswörth and Schwarzmühlbrücke
Figure 2: Characterisation of sampling site Schwechat Mannswörth (pictures by M. Schabuss)
Pollutants of Priority Concern in Austrian Rivers – Materials and methods
Umweltbundesamt REP-0253, Vienna, 2010 23
Figure 3: Characterisation of sampling site Schwechat Schwarzmühlbrücke (pictures by M. Schabuss)
Figure 4: Localisation of the two sampling sites at the river Ager at Unterachmann and Dürnau
Pollutants of Priority Concern in Austrian Rivers – Materials and methods
24 Umweltbundesamt REP-0253, Vienna, 2010
Figure 5: Characterisation of sampling site Ager Unterachmann (pictures by M. Schabuss)
Figure 6: Characterisation of sampling site Ager Dürnau (pictures by M. Schabuss)
2.1.2 Sampling periods
All sampling procedures were performed at the four sampling sites during sum-mer (July–September) and late autumn/winter (November–December) 2007.
Fish and mussels were collected during two sampling periods (July and No-vember 2007).
Pollutants of Priority Concern in Austrian Rivers – Materials and methods
Umweltbundesamt REP-0253, Vienna, 2010 25
2.1.3 Samples
2.1.3.1 Abiotic compartments
River water and active bottom sediments have been collected as grab sample and as composite samples in summer and late autumn at the same monitoring site. Suspended sediment is trapped in a newly developed continuous sediment sampler (KRALIK et al. in preparation) over variable periods (days – months) ac-cording to suspended sediment concentrations.
2.1.3.2 Biotic compartments
Following RÜDEL & WIMMER (2007), two abundant, widely distributed and not endangered freshwater animal species – the chub, Leuciscus cephalus (Cypri-nidae) and the zebra mussel, Dreissena polymorpha (Dreissenidea) – were se-lected for residue analysis.
Fish sample sizes ranged from 10–30 individuals, whereas 60 mussles per sampling site and period were collected. Fish fillet (axial muscle including skin) and rest of body (carcass including all organs) samples were combined result-ing in one fillet and one carcass composite sample per sampling site and pe-riod. Similarly, mussel soft tissues (shells excluded) were combined resulting in one composite sample per sampling site and period. Details on sample sizes and morphometry are given in Table 11.
2.2 Sample collection
2.2.1 Water and sediment
All water samples for mercury, methylmercury and trisphosphate analyses were taken in glass containers as grab samples at 20 cm depth. After rinsing the glass containers once, the grab samples were cooled and kept in the dark and transported to the laboratory. Water temperature, electric conductivity and pH of the river water were measured on site (see Annex 1 to Annex 3).
2.2.2 Suspended particles
The suspended sediment samplers were based on the principle of reducing the flow velocity in order to enhance settling and/or coagulation of suspended parti-cles in a sedimentation chamber. The throughput is 2 ml/s. A detailed description of the sample collection procedure is provided in KRALIK et al. (in preparation).
2.2.3 Biota
Sampling for fish was conducted using electric fishing (backpack electro fishing device, type FEG 2000, 150–300 – 600 Volt DC, Motor Honda GXV 140, EFKO-Elektrofischfanggeräte GmbH). Fish were transported to the lab shortly after collection under appropriate, stable and controlled temperature and oxygen conditions in fish transport tanks with liquid oxygen supply.

Pollutants of Priority Concern in Austrian Rivers – Materials and methods
26 Umweltbundesamt REP-0253, Vienna, 2010
2.3 Laboratory analysis
2.3.1 Water
2.3.1.1 Mercury and methylmercury
The determination of mercury (Hg) in stabilized water samples (K2Cr2O7/HNO3, pH < 2) was carried out after reduction with sodium borohydride with flow injec-tion cold vapour atomic absorption spectrometry according to ÖNORM (Austrian Standard) EN 1483 (modified).
The determination of methylmercury (Me-Hg) in water samples (stabilised with HNO3, pH < 2) was conducted directly after filtration through 0.45 µm mem-brane filters with high performance liquid chromatography hyphenated to induc-tively coupled plasma mass spectrometry (HPLC-ICPMS). A detailed descrip-tion of the analytical method is provided in VALLANT et al. (2007). For further in-formation on chromatographic and ICPMS parameters please refer to Table 5 and Table 6.
Table 5: Chromatographic parameters
HPLC: Perkin Elmer LC 200 System
Column Hamilton PRP X-200
Mobile phase 50 mM pyridine, 0.5 % w/w L-cysteine, 5 % v/w methanol, pH 2
Flow rate 0.5 ml/min
Column temperature 50°C
Injection volume 20 µl
Table 6: ICPMS parameters
ICPMS: Perkin Elmer Elan DRC II
Nebulizer Sea Spray
Nebulizer gas ~ 1 ml/min
Auxiliary gas 1.6 ml/min
Plasma gas 15 L min-1
RF Power 1500 W
Autolens Off
Monitored isotopes m/z 200, m/z 202
2.3.1.2 Trisphosphates
Trisphosphates were determined by means of liquid chromatography-tandem mass spectrometry (LC-MS/MS) after enrichment of the analytes by liquid ex-traction (LLE) at pH7.
Briefly, 500 or 1000 g of the sample were adjusted to a pH of 7 and an isotopi-cally marked surrogate standard mixture was added. The samples were ex-tracted thrice by LLE with dichloromethane. The resulting extract was dried with sodium sulphate, evaporated under a nitrogen stream and brought to a final vo-lume of 1 ml.
Pollutants of Priority Concern in Austrian Rivers – Materials and methods
Umweltbundesamt REP-0253, Vienna, 2010 27
The extracts were analysed by LC-MS/MS. Details of the chromatographic and MS parameters are summarized in Table 7 and Table 8.
Table 7: Chromatographic parameters
HPLC: Waters Separation Module 2695
Column Luna C8(2) 5µ 150 x 2.0 mm
Mobile phase A: MeOH, 10 mM ammonium acetate, 0.1% formic acid B: H2O 10 mM ammonium acetate, 0.1% formic acid
Flow rate 0.25 ml/min
Column temperature 20°C
Injection volume 10 µl
Table 8: MS parameters
MS: Micromass Quattro Micro
Ionization mode Electrospray positive
Capillary Voltage 3.5 kV
Source Temperature 120 °C
Desolvation Temperature 250 °C
Cone Gas Flow 80 l/Hr
Desolvation Gas Flow 400 l/Hr
MRM transitions TEP 183.3>99.3
TCEP 285.2>99.3
TCPP 329.2>99.3
TPhP 327.3>77.2
TDCPP 431.2>99.3
TBP 267.5>99.3
TBoEP 399.4>199.4
TKP 369.3>91.3
TEHP 435.5>99.4
2.3.1.3 Limit of detection and limit of quantification
The respective limits of detection (LOD) and quantification (LOQ) in µg/l are summarised in Table 9 for the various investigated compounds in river water samples.
Pollutants of Priority Concern in Austrian Rivers – Materials and methods
28 Umweltbundesamt REP-0253, Vienna, 2010
Table 9: LOD and LOQ in ng/l for the analysed compounds in river water
Substance River water samples
LOQ [ng/l] LOD [ng/l]
Hg 100 50
Me-Hg 400 100
TEP 9 4.5
TCEP 82 41
TCPP 2.5 0.68
TPhP 2.3 0.61
TDCPP 2.8 0.76
TBP 4.9 1.3
TBoEP 7 1.9
TKP 3 1.5
TEHP 27 7.3
2.3.2 Sediments and suspended matter
2.3.2.1 TIC/TOC
TIC (Total Inorganic Carbon): The determination of the total inorganic carbon was performed according to ÖN EN 13137 by acidifying the samples and mea-suring the emerging CO2 gas volume.
TC (Total Carbon): The determination of the total carbon was performed ac-cording to ÖN EN 13137 by the combustion of the sample in an oxygen atmos-phere. Thereby all carbon is transformed to CO2 which is detected coulometricly.
TOC (Total Organic Carbon): According to ÖN EN 13137 the TOC is calculated from the difference between TC and TIC.
2.3.2.2 Cations (Al, Ca, Mg) and mercury
Sample preparation – microwave assisted digestion of sediment samples
300 mg portions of the homogenised samples were weighted into quartz diges-tion vessels. After addition of 6 ml hydrochloric acid and 2 ml nitric acid micro-wave assisted digestion was performed in an Anton Paar Multiwave system. For quality assurance, digestion of the reference material NBS 2704 River Sediment and ERM-CC580 Estuarine Sediment and digestion blanks were prepared in the same manner.
The determination of the cations (Aluminum, Calcium, and Magnesium) in di-gests of sediment samples was conducted with ICP-OES according to ÖN EN 11885 (modified).
The determination of Hg in digests of sediment samples was carried out after reduction with sodiumborohydride with flow injection cold vapour atomic absorp-tion spectrometry according to ÖNORM EN 1483 (modified).
Pollutants of Priority Concern in Austrian Rivers – Materials and methods
Umweltbundesamt REP-0253, Vienna, 2010 29
2.3.2.3 Methylmercury
Sample preparation – Extraction of sediment samples
300 mg portions of the homogenised samples were weighted into 15 ml poly-propylene test tubes. After addition of 5 ml 5 molar hydrochloric acid (sub boiled) the samples were extracted for 15 minutes in ultrasonic bath. The result-ing suspensions were centrifuged for 15 minutes at 4500 rpm. The supernatants were decanted and the residues were re-extracted as described above. After-wards, the two supernatants were combined. An aliquot (1.5 ml) of the superna-tant was filtered through 0.45 µm membrane filters. For quality assurance, ex-traction of the reference material ERM-CC580 Estuarine Sediment and extrac-tion blanks were prepared in the same manner.
The determination of Me-Hg was conducted with high performance liquid chro-matography hyphenated to inductively coupled plasma mass spectrometry (HPLC-ICP-MS).
2.3.2.4 Trisphosphates
Five grams of the homogenized sample were weighted in a 50 ml plastic tube and an isotopically marked surrogate standard mixture was added. Samples were extracted for 30 minutes in an ultrasonic bath at room temperature with a mixture of acetonitrile and ethylacetate (70/30 v/v) and centrifuged at 4000 rpm for 10 minutes. The extract was evaporated under a nitrogen stream to a vo-lume of about 4 ml and centrifuged again. The supernatant was evaporated un-der a nitrogen stream and brought to a final volume of 1 ml.
The extracts were analysed by means of LC-MS/MS as described above.
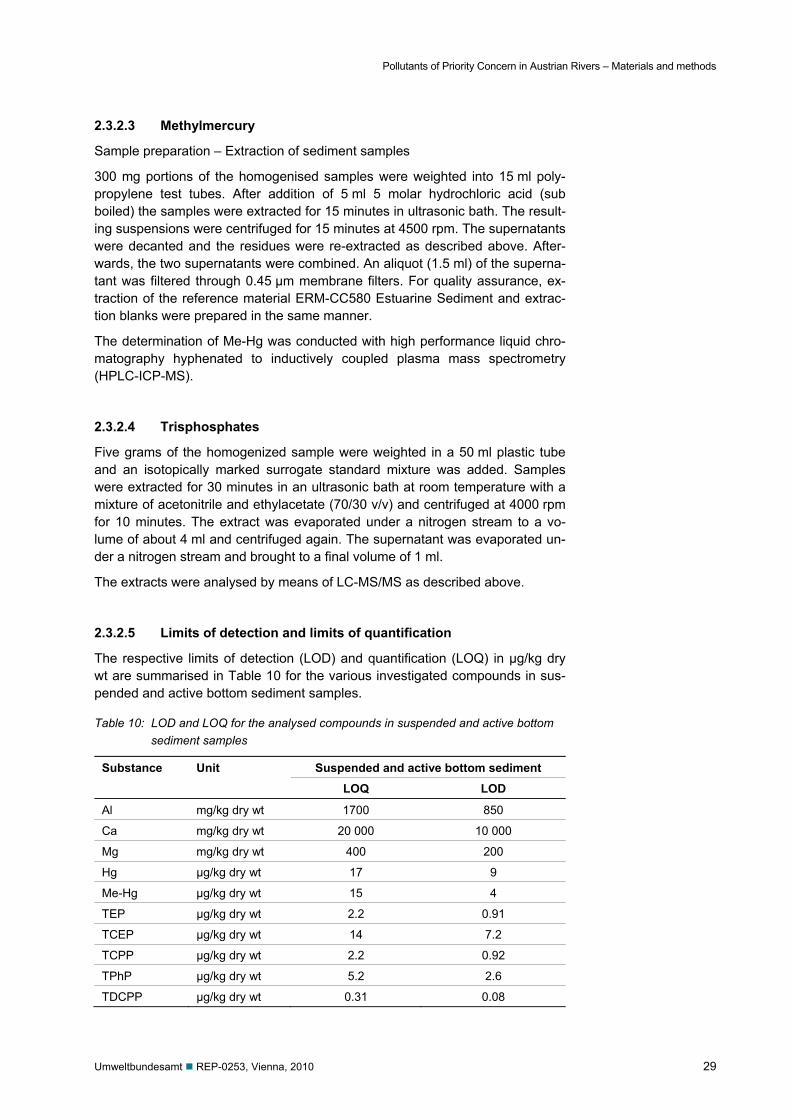
2.3.2.5 Limits of detection and limits of quantification
The respective limits of detection (LOD) and quantification (LOQ) in µg/kg dry wt are summarised in Table 10 for the various investigated compounds in sus-pended and active bottom sediment samples.
Table 10: LOD and LOQ for the analysed compounds in suspended and active bottom sediment samples
Substance Unit Suspended and active bottom sediment
LOQ LOD
Al mg/kg dry wt 1700 850
Ca mg/kg dry wt 20 000 10 000
Mg mg/kg dry wt 400 200
Hg µg/kg dry wt 17 9
Me-Hg µg/kg dry wt 15 4
TEP µg/kg dry wt 2.2 0.91
TCEP µg/kg dry wt 14 7.2
TCPP µg/kg dry wt 2.2 0.92
TPhP µg/kg dry wt 5.2 2.6
TDCPP µg/kg dry wt 0.31 0.08

Pollutants of Priority Concern in Austrian Rivers – Materials and methods
30 Umweltbundesamt REP-0253, Vienna, 2010
Substance Unit Suspended and active bottom sediment
LOQ LOD
TBP µg/kg dry wt 4.2 2.1
TBoEP µg/kg dry wt 0.82 0.23
TKP µg/kg dry wt 0.37 0.18
TEHP µg/kg dry wt 2.4 0.65
2.3.3 Biota
2.3.3.1 Narcosis, euthanasia, dissection, morphometry, deep freezing
Immediately upon arrival in the Ecotoxicology Laboratory at the University of Veterinary Medicine in Vienna, fish were killed (MS 222, tricaine methane sul-phonate followed by brain destruction) according to the European Commission recommendations for the euthanasia of experimental animals (Part 1 and Part 2; CLOSE et al. 1996, 1997). Mussels were deep frozen (–20°C) and sub-sequently analysed for external morphometry (calliper: Mauser ±0.02 mm mea-suring error; balance: Sartorius industry, ±1.0 g measuring error) and tissue preparation (Table 11). Definition of body measures followed SCHRECK & MOYLE (1990).
During all stages of sample analysis, particular care was taken in order to avoid any cross contamination of the fish tissues (US EPA 2000).
Immediately after dissection, fish and mussel samples were weighed, packed in labelled plastic bags, stored deep frozen (–20°C), and transported to the Um-weltbundesamt in Vienna for further analysis.
Pollutants of Priority Concern in Austrian Rivers – Materials and methods
Umweltbundsamt REP-0253, Vienna, 2010 31
Tabl
e 11
: M
orph
omet
ric c
hara
cter
isat
ion
of th
e a)
fish
(chu
b, L
euci
scus
cep
halu
s) a
nd b
) mus
sel (
zebr
a m
usse
l, D
reis
sena
pol
ymor
pha)
sam
ples
(sam
plin
g po
ints
as
char
acte
rised
in T
able
4).
a - F
ish
(chu
b, L
euci
scus
cep
halu
s)
Riv
ers
Sam
plin
g po
int
Sam
plin
g pe
riod
Bod
y le
ngth
B
ody
heig
ht
Bod
y m
ass
Stat
istic
s (to
tal;
mm
) (fu
rkal
; mm
) (m
axim
um; m
m)
(fres
h to
tal;
g)
Schw
echa
t M
anns
wör
th
P-1
166.
10
153.
53
32.0
6 49
.69
m
11
.81
11.1
9 3.
30
11.9
1 s
14
0.00
13
0.00
24
.40
27.2
0 m
in
18
7.00
17
5.00
37
.70
77.6
0 m
ax
30
30
30
30
0 n
Schw
echa
t M
anns
wör
th
P-2
122.
50
112.
80
21.3
9 16
.32
m
8.
06
7.89
1.
57
3.23
s
11
0.00
10
0.00
19
.49
11.8
0 m
in
13
4.00
12
4.00
24
.21
21.6
0 m
ax
10
10
10
10
n
Sch
wec
hat
Sch
war
zmüh
lbrü
cke
P-2
157.
45
145.
09
27.9
7 37
.34
m
22
.31
20.5
3 4.
71
15.8
3 s
12
3.00
11
3.00
20
.35
16.4
0 m
in
19
3.00
17
7.00
34
.68
64.7
0 m
ax
11
11
11
11
n
Ager
U
nter
achm
ann
P-1
150.
09
138.
69
26.8
5 36
.18
m
27
.66
25.8
0 5.
55
25.1
5 s
12
0.00
11
1.00
20
.00
16.7
0 m
in
21
8.00
20
3.00
41
.00
109.
90
max
32
32
32
32
n

Pollutants of Priority Concern in Austrian Rivers – Materials and methods
32 Umweltbundsamt REP-0253, Vienna, 2010
Riv
ers
Sam
plin
g po
int
Sam
plin
g pe
riod
Bod
y le
ngth
B
ody
heig
ht
Bod
y m
ass
Stat
istic
s (to
tal;
mm
) (fu
rkal
; mm
) (m
axim
um; m
m)
(fres
h to
tal;
g)
Ager
U
nter
achm
ann
P-2
171.
53
158.
60
29.7
5 46
.98
m
18
.15
17.0
1 3.
39
14.7
8 s
13
5.00
12
5.00
22
.70
22.3
0 m
in
20
4.00
19
0.00
36
.24
76.7
0 m
ax
30
30
30
30
n
Ager
D
ürna
u P-
1 17
6.43
16
2.67
31
.65
54.9
3 m
24
.18
22.6
5 4.
28
22.9
2 s
14
0.00
13
0.00
24
.60
26.2
0 m
in
21
6.00
20
0.00
38
.80
102.
00
max
30
30
30
30
n
Ager
D
ürna
u P-
2 16
4.03
15
0.70
28
.33
41.7
9 m
29
.85
27.3
5 5.
07
22.2
5 s
12
5.00
11
4.00
21
.25
16.1
0 m
in
21
8.00
19
7.00
37
.60
89.0
0 m
ax
30
30
30
30
n
m (a
rithm
etic
mea
n), s
(sta
ndar
d de
viat
ion)
, min
(min
imum
), m
ax (m
axim
um),
n (n
umbe
r of i
ndiv
idua
ls);
sam
plin
g pe
riod
P-1
(Jul
y 20
07),
P-2
(Nov
embe
r 200
7)
Pollutants of Priority Concern in Austrian Rivers – Materials and methods
Umweltbundsamt REP-0253, Vienna, 2010 33
b –
Mus
sel (
zebr
a m
usse
l, D
reis
sena
pol
ymor
pha)
Riv
ers
Sam
plin
g po
int
Sam
plin
g pe
riod
Bod
y le
ngth
B
ody
mas
s St
atis
tics
(she
ll, m
axim
um, m
m)
(who
le b
ody,
incl
udin
g sh
ell,
g)(w
hole
bod
y, w
ithou
t she
ll, g
)
Ager
U
nter
achm
ann
P-1
19.8
9 1.
07
0.35
m
1.
66
0.27
0.
13
s
15
.77
0.67
0.
14
min
23
.40
1.93
0.
78
max
60
.00
60.0
0 60
.00
n
Ager
U
nter
achm
ann
P-2
18.3
5 0.
80
0.31
m
1.
59
0.21
0.
08
s
14
.84
0.48
0.
14
min
22
.93
1.53
0.
49
max
60
.00
60.0
0 60
.00
n
Ager
D
ürna
u P-
1 21
.96
1.50
0.
61
m
1.
97
0.38
0.
20
s
19
.08
0.82
0.
32
min
27
.51
2.38
1.
22
max
60
.00
60.0
0 60
.00
n
Ager
D
ürna
u P-
2 19
.86
1.10
0.
42
m
2.
88
0.48
0.
18
s
14
.46
0.43
0.
18
min
27
.33
2.38
1.
04
max
60
.00
60.0
0 60
.00
n
m (a
rithm
etic
mea
n), s
(sta
ndar
d de
viat
ion)
, min
(min
imum
), m
ax (m
axim
um),
n (n
umbe
r of i
ndiv
idua
ls);
sam
plin
g pe
riod
P-1
(Jul
y 20
07),
P-2
(Nov
embe
r 200
7)

Pollutants of Priority Concern in Austrian Rivers – Materials and methods
34 Umweltbundesamt REP-0253, Vienna, 2010
2.3.3.2 Lyphilization, pooling, drying
Fillet (including skin) and rest of body (carcass including all organs) samples were combined resulting in one fillet and one carcass composite sample per sampling site and period. Similarly, mussel soft tissues (shells excluded) were combined resulting in one composite sample per sampling site and period.
2.3.3.3 Chemical analysis
Mercury
Sample preparation – microwave assisted digestion of biota samples
300 mg portions of the homogenised samples were weighted into quartz diges-tion vessels. After addition of 3 ml nitric acid and 0.5 ml hydrogen, peroxide mi-crowave assisted digestion was performed in an Anton Paar Multiwave system. For quality assurance, digestion of the reference material NIST 2976 (Mussel Tissue – Trace Elements and methylmercury) and digestion blanks were pre-pared in the same manner.
The determination of Hg in digests of fish samples was carried out after reduc-tion with sodium borohydride with flow injection cold vapour atomic absorption spectrometry according to ÖNORM EN 1483 (modified).
Methylmercury
Sample preparation – Extraction of biota samples
250 mg portions of the homogeniszed samples were weighted into 15 ml poly-propylene test tubes. After addition of 5 ml mobile phase (50 mmol pyridine, 0.5% w/w L-cysteine, 5% v/w methanol), the samples were extracted for 15 minutes in an ultrasonic bath. The resulting suspensions were centrifuged for 15 minutes at 4500 rpm. The supernatants were decanted and the residues re-extracted as described above. Afterwards, the two supernatants were combined. An aliquot (1.5 ml) of the supernatant was filtered through 0.45 µm membrane filters. For quality assurance, extraction of the reference material NIST 2976 (Mussel Tis-sue – Trace Elements and Methylmercury) and extraction blanks were prepared in the same manner.
The determination of Me-Hg was conducted with high performance liquid chro-matography hyphenated to inductively coupled plasma mass spectrometry (HPLC-ICPMS).
Trisphosphates
Sample preparation of biota samples was identical to sediment samples.
Limits of detection and limits of quantification
The respective limits of detection (LOD) and quantification (LOQ) in µg/kg dry wt are summarized in Table 12 for the various investigated compounds in biota samples.
Pollutants of Priority Concern in Austrian Rivers – Materials and methods
Umweltbundesamt REP-0253, Vienna, 2010 35
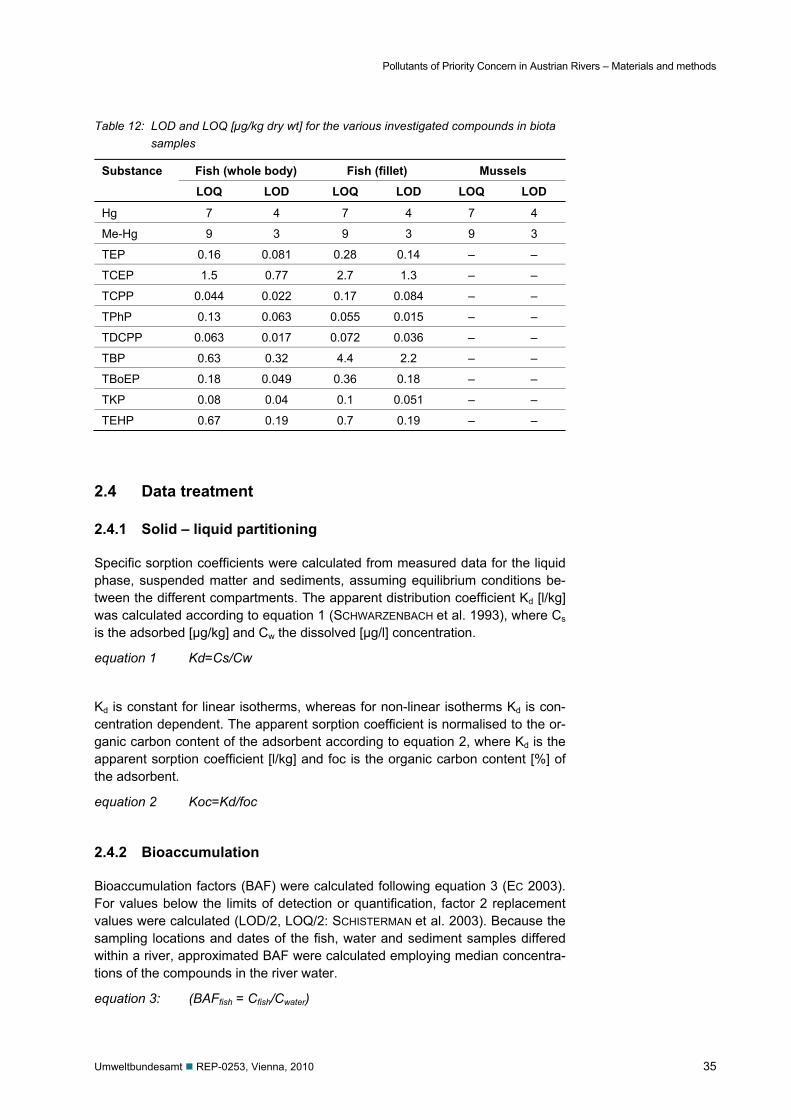
Table 12: LOD and LOQ [µg/kg dry wt] for the various investigated compounds in biota samples
Substance Fish (whole body) Fish (fillet) Mussels
LOQ LOD LOQ LOD LOQ LOD
Hg 7 4 7 4 7 4
Me-Hg 9 3 9 3 9 3
TEP 0.16 0.081 0.28 0.14 – –
TCEP 1.5 0.77 2.7 1.3 – –
TCPP 0.044 0.022 0.17 0.084 – –
TPhP 0.13 0.063 0.055 0.015 – –
TDCPP 0.063 0.017 0.072 0.036 – –
TBP 0.63 0.32 4.4 2.2 – –
TBoEP 0.18 0.049 0.36 0.18 – –
TKP 0.08 0.04 0.1 0.051 – –
TEHP 0.67 0.19 0.7 0.19 – –
2.4 Data treatment
2.4.1 Solid – liquid partitioning
Specific sorption coefficients were calculated from measured data for the liquid phase, suspended matter and sediments, assuming equilibrium conditions be-tween the different compartments. The apparent distribution coefficient Kd [l/kg] was calculated according to equation 1 (SCHWARZENBACH et al. 1993), where Cs is the adsorbed [µg/kg] and Cw the dissolved [µg/l] concentration.
equation 1 Kd=Cs/Cw
Kd is constant for linear isotherms, whereas for non-linear isotherms Kd is con-centration dependent. The apparent sorption coefficient is normalised to the or-ganic carbon content of the adsorbent according to equation 2, where Kd is the apparent sorption coefficient [l/kg] and foc is the organic carbon content [%] of the adsorbent.
equation 2 Koc=Kd/foc
2.4.2 Bioaccumulation
Bioaccumulation factors (BAF) were calculated following equation 3 (EC 2003). For values below the limits of detection or quantification, factor 2 replacement values were calculated (LOD/2, LOQ/2: SCHISTERMAN et al. 2003). Because the sampling locations and dates of the fish, water and sediment samples differed within a river, approximated BAF were calculated employing median concentra-tions of the compounds in the river water.
equation 3: (BAFfish = Cfish/Cwater)

Pollutants of Priority Concern in Austrian Rivers – Results
36 Umweltbundesamt REP-0253, Vienna, 2010
3 RESULTS
3.1 Water
Whereas mercury was detected in all analysed river water samples, methyl-mercury was not detectable and all analytical results were below the limit of de-tection of 0.1 µg/l. With the exception of one sample from the Ager river at Scheiblmühle all measured mercury concentrations were below the limit of quan-tification of 0.1 µg/l. At the Scheiblmühle sampling point mercury was detected in the water sample, during the sampling campaign in September 2009, at a concentration of 0.3 µg/l. The results are summarised in Table 13.
Table 13: Mercury and methylmercury [µg/l] in river water samples
River Sampling site Sampling period
River Water Analyte
sample [µg/l]
Schwechat Brauhaus-Str. 30.08.2007 3840 < 0.1 Hg
n.d. Me-Hg
23.11.2007 5610 < 0.1 Hg
n.d. Me-Hg
Ager Raudaschlmühle 26.09.2007 4771 < 0.1 Hg
n.d. Me-Hg
28.11.2007 5641 < 0.1 Hg
n.d. Me-Hg
Ager Scheiblmühle 26.09.2007 4770 0.3 Hg
n.d. Me-Hg
28.11.2007 5646 < 0.1 Hg
n.d. Me-Hg
n.d…not detected (LOD 0.1 µg/l); Hg=mercury; Me-Hg=methylmercury
Dissolved as well as total mercury contents also have been measured within the Austrian Water Quality Monitoring System (AWQMS) at various sites along the rivers Schwechat and Ager. Whereas, between 1996 and 1998, total mercury was detectable sporadically at some sampling sites, all measurements since 1999 at all sampled sites along the two rivers have been below the limit of de-tection (0.06 µg/l or 0.1 µg/l).
Among the trisphosphates, TKP and TEHP were not detected in any of the ana-lysed river water samples. Detection frequencies for the other organophosphorus compounds were as follows: TEP (60%) < TPhP (80%) and TBoEP (80%) < TCEP (100%), TCPP (100%), TDCPP (100%) as well as TBP (100%). The observed concentrations varied notably. Generally, higher concentrations were detected in the river Schwechat than in the river Ager, but it should be noted that only one water sample from the river Schwechat was analysed. In the Ager TEP and TBoEP were detected in concentrations below or in the range of the limit of quantification (9 ng/l for TEP; 7 ng/l for TBoEP). The chlorinated organo-phosphorus esters TCEP, TCPP and TDCPP as well as TBP and TPhP were the most relevant compounds. The highest concentrations in all river samples
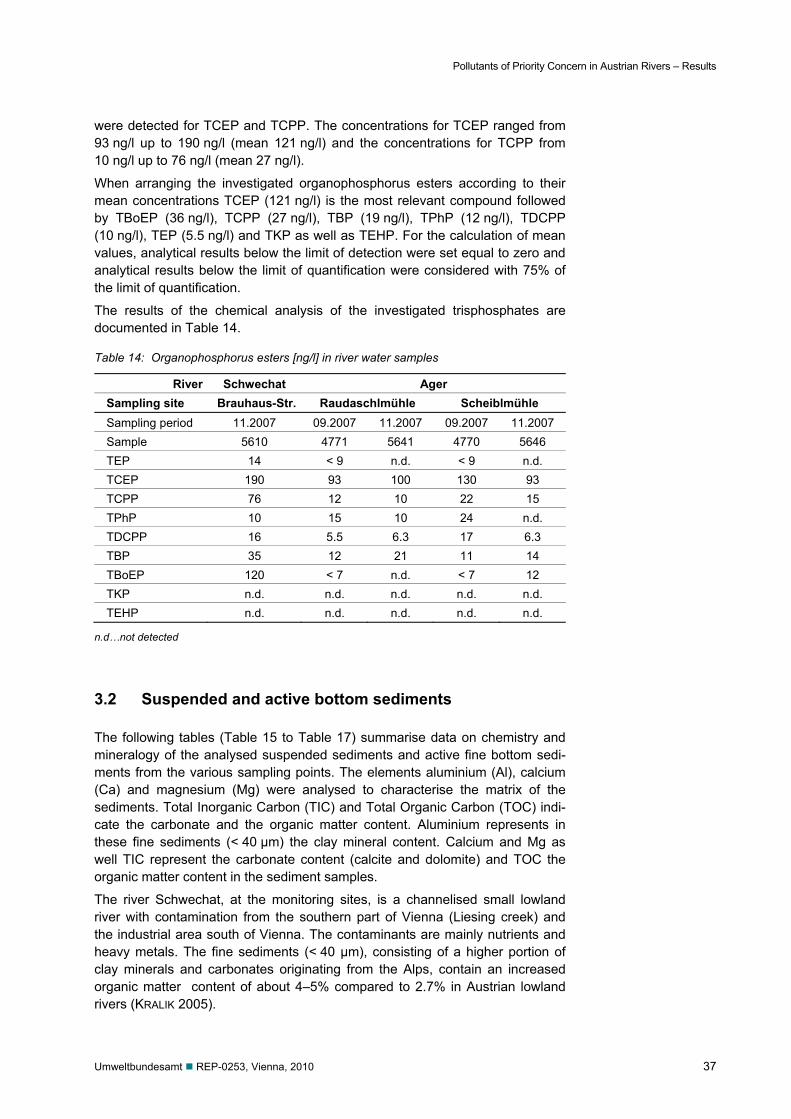
Pollutants of Priority Concern in Austrian Rivers – Results
Umweltbundesamt REP-0253, Vienna, 2010 37
were detected for TCEP and TCPP. The concentrations for TCEP ranged from 93 ng/l up to 190 ng/l (mean 121 ng/l) and the concentrations for TCPP from 10 ng/l up to 76 ng/l (mean 27 ng/l).
When arranging the investigated organophosphorus esters according to their mean concentrations TCEP (121 ng/l) is the most relevant compound followed by TBoEP (36 ng/l), TCPP (27 ng/l), TBP (19 ng/l), TPhP (12 ng/l), TDCPP (10 ng/l), TEP (5.5 ng/l) and TKP as well as TEHP. For the calculation of mean values, analytical results below the limit of detection were set equal to zero and analytical results below the limit of quantification were considered with 75% of the limit of quantification.
The results of the chemical analysis of the investigated trisphosphates are documented in Table 14.
Table 14: Organophosphorus esters [ng/l] in river water samples
River Schwechat Ager Sampling site Brauhaus-Str. Raudaschlmühle Scheiblmühle Sampling period 11.2007 09.2007 11.2007 09.2007 11.2007 Sample 5610 4771 5641 4770 5646 TEP 14 < 9 n.d. < 9 n.d. TCEP 190 93 100 130 93 TCPP 76 12 10 22 15 TPhP 10 15 10 24 n.d. TDCPP 16 5.5 6.3 17 6.3 TBP 35 12 21 11 14 TBoEP 120 < 7 n.d. < 7 12 TKP n.d. n.d. n.d. n.d. n.d. TEHP n.d. n.d. n.d. n.d. n.d.
n.d…not detected
3.2 Suspended and active bottom sediments
The following tables (Table 15 to Table 17) summarise data on chemistry and mineralogy of the analysed suspended sediments and active fine bottom sedi-ments from the various sampling points. The elements aluminium (Al), calcium (Ca) and magnesium (Mg) were analysed to characterise the matrix of the sediments. Total Inorganic Carbon (TIC) and Total Organic Carbon (TOC) indi-cate the carbonate and the organic matter content. Aluminium represents in these fine sediments (< 40 µm) the clay mineral content. Calcium and Mg as well TIC represent the carbonate content (calcite and dolomite) and TOC the organic matter content in the sediment samples.
The river Schwechat, at the monitoring sites, is a channelised small lowland river with contamination from the southern part of Vienna (Liesing creek) and the industrial area south of Vienna. The contaminants are mainly nutrients and heavy metals. The fine sediments (< 40 µm), consisting of a higher portion of clay minerals and carbonates originating from the Alps, contain an increased organic matter content of about 4–5% compared to 2.7% in Austrian lowland rivers (KRALIK 2005).

Pollutants of Priority Concern in Austrian Rivers – Results
38 Umweltbundesamt REP-0253, Vienna, 2010
The Ager river at the Schlögelmühle is a small lowland river flowing out of the uncontaminated lake Attersee. Most sediments are trapped in the lake and therefore only very small amounts of suspended sediments are transported, but a high calcite content indicates precipitation out of oversaturated river water. The sampling point Scheiblmühle is situated a few kilometres below the outflow of an industrial plant causing mainly zinc contamination. The suspended matter transport is already increased, with a similar high content of organic matter (TOC 5–8.5%), but a considerably lower calcite content. The fine fractions of the Ager sediment are rich in organic matter and even more in carbonates, in particular at the Raudaschlmühle at the outlet of lake Attersee.
The suspended sediment matrix composition compared to the bottom sediment is in all samples enriched in TOC. The matrix of the suspended sediment seems to be extremely influenced by the discharge and suspended load concentration. The Schwechat suspended load in August 2007 varied between 23–32 mg/l whereas in November the load was down to 4–8 mg/l (see Annex 1), with a change in TOC from 3.6 to 10.0% (Table 12). According to a similar pattern the mean suspended sediment load decreased at the Ager-Raudaschlmühle from 0.21 mg/l (August 2007) to 0.04 mg/l (October–December 2007; see Annex 2) with a simultaneous in-crease in TOC from 5.8 to 7.3% (Table 13).
The suspended load in the Ager about 8 km downstream of the outlet of lake At-tersee already had a somewhat higher suspended sediment load of 0.3–0.5 mg/l (see Annex 3).
Table 15: Chemistry and mineralogy of suspended sediment (< 40 µm) and active fine bottom sediment (< 40 µm) in the river Schwechat at Brauhausstrasse sampling point.
Schwechat - Brauhausstrasse
Median Sed. [%] Susp. Sed. [%] Bottom Sed. [%]
Sampling period 1) 08.2007 11.2007 08.2007 11.2007
Sample 4011 5614 3844 5609
Al 2.0 1.3 2.3 1.3 2.2
Ca 9.5 9.3 8.3 11 7.3
Mg 2.3 2.3 1.8 2.5 1.9
TIC - 3.54 2.58 3.66 2.54
TOC 4.4 3.62 9.99 3.02 2.48
Kaolinit – 4 7 4 3
Illite-mica – 16 28 16 14
Feldspar – 3 37 3 2
Quartz – 41 18 31 59
Calcite – 16 15 18 10
Dolomite – 14 10 17 8
Organic Matter – 6 17 5 4 1)…Median of GZÜV (Austrian Quality Monitoring) analyses of active fine bottom sediments of the
adjacent monitoring stations (1992–2006)

Pollutants of Priority Concern in Austrian Rivers – Results
Umweltbundesamt REP-0253, Vienna, 2010 39
Table 16: Chemistry and mineralogy of suspended sediment (< 40 µm) and active fine bottom sediment (< 40 µm) in the river Ager at Raudaschlmühle sampling point.
Ager – Raudaschlmühle Median Sed. [%] Susp. Sed. [%] Bottom Sed. [%]
Sampling period 1) 09.2007 11.2007 09.2007 11.2007
Sample 4013 0395 4769 5637
Al 0.99 – – 0.35 0.35
Ca 20.1 – – 24.0 28.0
Mg 1.53 – – 1.1 0.96
TIC – 7.49 6.89 – 8.91
TOC 3.73 5.75 7.28 – 1.76
Kaolinit – 0 0 0 0
Illite-mica – 5 4 4 4
Feldspar – 0 0 0 0
Quartz – 22 25 28 21
Calcite – 67 58 60 71
Dolomite – 0 0 0 0
Organic Matter – 10 13 7 3 1)…Median of GZÜV (Austrian Quality Monitoring) analyses of active fine bottom sediments (1992–
2006)
Table 17: Chemistry and mineralogy of suspended sediment (< 40 µm) and active fine bottom sediment (< 40 µm) in the Ager River at Scheiblmühle sampling point.
Ager – Scheiblmühle
Median Sed. [%] Susp. Sed. [%] Bottom Sed. [%]
Sampling period 1) 09.2007 11.2007 09.2007 11.2007
Sample 4014 0396 4768 5642
Al 1.24 1.5 – 0.25 0.69
Ca 10.21 8.1 – 3.2 13.0
Mg 1.27 0.89 – 0.35 1.7
TIC – 2.43 4.40 – 4.29
TOC 3.07 4.84 8.64 – 2.50
Kaolinit – 4 0 1 2
Illite-mica – 18 9 7 8
Feldspar – 3 2 2 2
Quartz – 46 37 67 55
Calcite – 20 37 13 26
Dolomite – 0 0 5 12
Organic Matter – 8 15 2 4 1)…Median of GZÜV (Austrian Quality Monitoring)-analyses of active fine bottom sediments (1992–
2006)
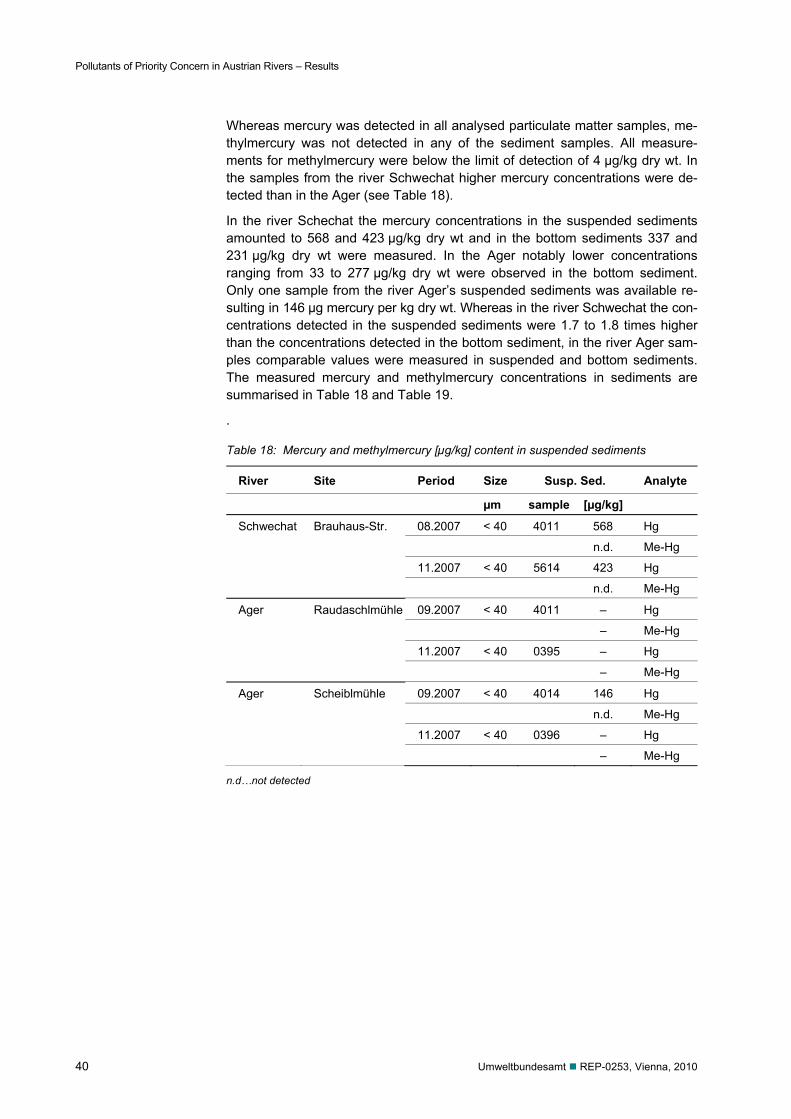
Pollutants of Priority Concern in Austrian Rivers – Results
40 Umweltbundesamt REP-0253, Vienna, 2010
Whereas mercury was detected in all analysed particulate matter samples, me-thylmercury was not detected in any of the sediment samples. All measure-ments for methylmercury were below the limit of detection of 4 µg/kg dry wt. In the samples from the river Schwechat higher mercury concentrations were de-tected than in the Ager (see Table 18).
In the river Schechat the mercury concentrations in the suspended sediments amounted to 568 and 423 µg/kg dry wt and in the bottom sediments 337 and 231 µg/kg dry wt were measured. In the Ager notably lower concentrations ranging from 33 to 277 µg/kg dry wt were observed in the bottom sediment. Only one sample from the river Ager’s suspended sediments was available re-sulting in 146 µg mercury per kg dry wt. Whereas in the river Schwechat the con-centrations detected in the suspended sediments were 1.7 to 1.8 times higher than the concentrations detected in the bottom sediment, in the river Ager sam-ples comparable values were measured in suspended and bottom sediments. The measured mercury and methylmercury concentrations in sediments are summarised in Table 18 and Table 19.
.
Table 18: Mercury and methylmercury [µg/kg] content in suspended sediments
River Site Period Size Susp. Sed. Analyte
µm sample [µg/kg]
Schwechat Brauhaus-Str. 08.2007 < 40 4011 568 Hg
n.d. Me-Hg
11.2007 < 40 5614 423 Hg
n.d. Me-Hg
Ager Raudaschlmühle 09.2007 < 40 4011 – Hg
– Me-Hg
11.2007 < 40 0395 – Hg
– Me-Hg
Ager Scheiblmühle 09.2007 < 40 4014 146 Hg
n.d. Me-Hg
11.2007 < 40 0396 – Hg
– Me-Hg
n.d…not detected
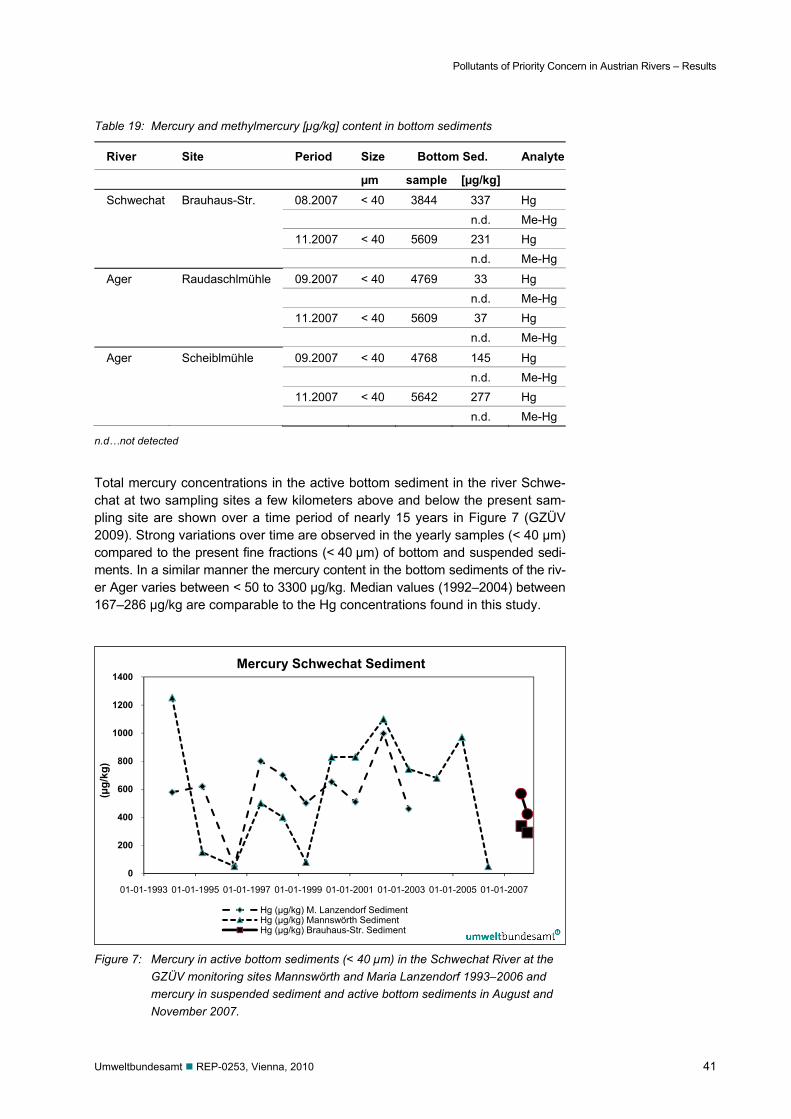
Pollutants of Priority Concern in Austrian Rivers – Results
Umweltbundesamt REP-0253, Vienna, 2010 41
Table 19: Mercury and methylmercury [µg/kg] content in bottom sediments
River Site Period Size Bottom Sed. Analyte
µm sample [µg/kg] Schwechat Brauhaus-Str. 08.2007 < 40 3844 337 Hg n.d. Me-Hg 11.2007 < 40 5609 231 Hg n.d. Me-Hg
Ager Raudaschlmühle 09.2007 < 40 4769 33 Hg n.d. Me-Hg 11.2007 < 40 5609 37 Hg n.d. Me-Hg
Ager Scheiblmühle 09.2007 < 40 4768 145 Hg n.d. Me-Hg 11.2007 < 40 5642 277 Hg n.d. Me-Hg
n.d…not detected
Total mercury concentrations in the active bottom sediment in the river Schwe-chat at two sampling sites a few kilometers above and below the present sam-pling site are shown over a time period of nearly 15 years in Figure 7 (GZÜV 2009). Strong variations over time are observed in the yearly samples (< 40 µm) compared to the present fine fractions (< 40 µm) of bottom and suspended sedi-ments. In a similar manner the mercury content in the bottom sediments of the riv-er Ager varies between < 50 to 3300 µg/kg. Median values (1992–2004) between 167–286 µg/kg are comparable to the Hg concentrations found in this study.
Figure 7: Mercury in active bottom sediments (< 40 µm) in the Schwechat River at the
GZÜV monitoring sites Mannswörth and Maria Lanzendorf 1993–2006 and mercury in suspended sediment and active bottom sediments in August and November 2007.
0
200
400
600
800
1000
1200
1400
01-01-1993 01-01-1995 01-01-1997 01-01-1999 01-01-2001 01-01-2003 01-01-2005 01-01-2007
Hg (µg/kg) M. Lanzendorf SedimentHg (µg/kg) Mannswörth SedimentHg (µg/kg) Brauhaus-Str. Sediment
Mercury Schwechat Sediment
(µg/
kg)
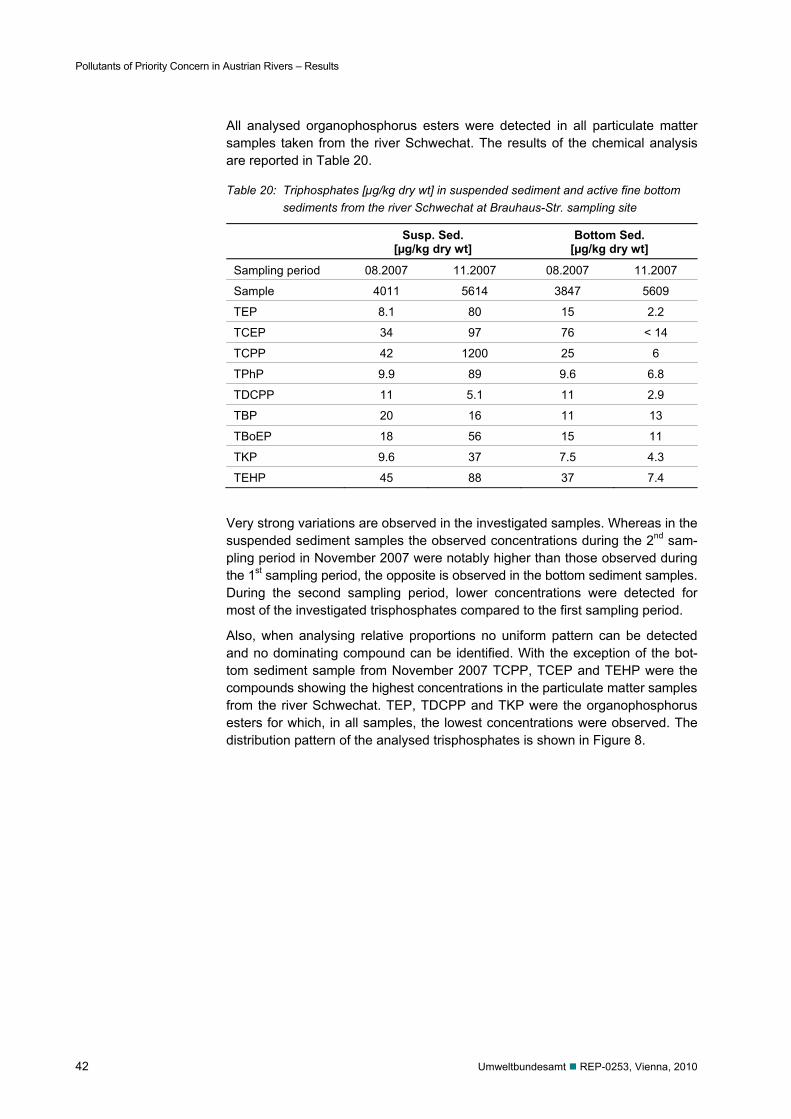
Pollutants of Priority Concern in Austrian Rivers – Results
42 Umweltbundesamt REP-0253, Vienna, 2010
All analysed organophosphorus esters were detected in all particulate matter samples taken from the river Schwechat. The results of the chemical analysis are reported in Table 20.
Table 20: Triphosphates [µg/kg dry wt] in suspended sediment and active fine bottom sediments from the river Schwechat at Brauhaus-Str. sampling site
Susp. Sed. [µg/kg dry wt]
Bottom Sed. [µg/kg dry wt]
Sampling period 08.2007 11.2007 08.2007 11.2007
Sample 4011 5614 3847 5609
TEP 8.1 80 15 2.2
TCEP 34 97 76 < 14
TCPP 42 1200 25 6
TPhP 9.9 89 9.6 6.8
TDCPP 11 5.1 11 2.9
TBP 20 16 11 13
TBoEP 18 56 15 11
TKP 9.6 37 7.5 4.3
TEHP 45 88 37 7.4
Very strong variations are observed in the investigated samples. Whereas in the suspended sediment samples the observed concentrations during the 2nd sam-pling period in November 2007 were notably higher than those observed during the 1st sampling period, the opposite is observed in the bottom sediment samples. During the second sampling period, lower concentrations were detected for most of the investigated trisphosphates compared to the first sampling period.
Also, when analysing relative proportions no uniform pattern can be detected and no dominating compound can be identified. With the exception of the bot-tom sediment sample from November 2007 TCPP, TCEP and TEHP were the compounds showing the highest concentrations in the particulate matter samples from the river Schwechat. TEP, TDCPP and TKP were the organophosphorus esters for which, in all samples, the lowest concentrations were observed. The distribution pattern of the analysed trisphosphates is shown in Figure 8.
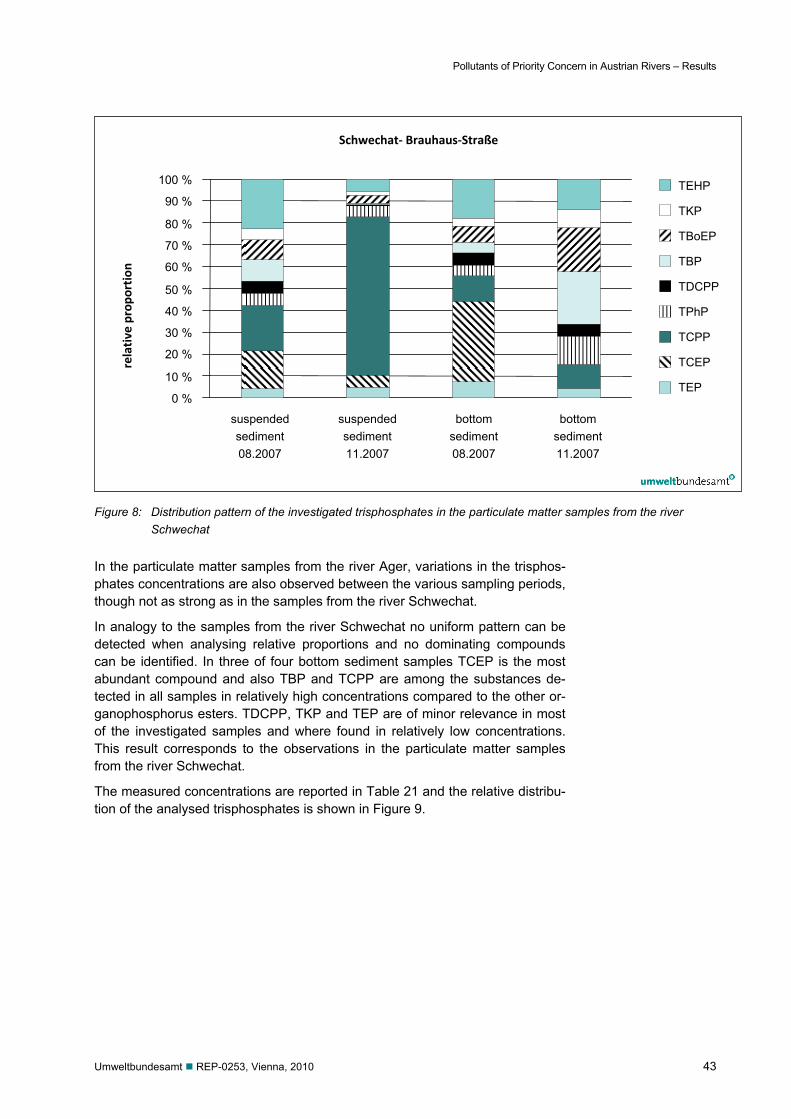
Pollutants of Priority Concern in Austrian Rivers – Results
Umweltbundesamt REP-0253, Vienna, 2010 43
Figure 8: Distribution pattern of the investigated trisphosphates in the particulate matter samples from the river
Schwechat
In the particulate matter samples from the river Ager, variations in the trisphos-phates concentrations are also observed between the various sampling periods, though not as strong as in the samples from the river Schwechat.
In analogy to the samples from the river Schwechat no uniform pattern can be detected when analysing relative proportions and no dominating compounds can be identified. In three of four bottom sediment samples TCEP is the most abundant compound and also TBP and TCPP are among the substances de-tected in all samples in relatively high concentrations compared to the other or-ganophosphorus esters. TDCPP, TKP and TEP are of minor relevance in most of the investigated samples and where found in relatively low concentrations. This result corresponds to the observations in the particulate matter samples from the river Schwechat.
The measured concentrations are reported in Table 21 and the relative distribu-tion of the analysed trisphosphates is shown in Figure 9.
0 %
10 %
20 %
30 %
40 %
50 %
60 %
70 %
80 %
90 %
100 %
suspended sediment 08.2007
Schwechat‐ Brauhaus‐Straße
TEHP
TKP
TBoEP
TBP
TDCPP
TPhP
TCPP
TCEP
TEP
relative propo
rtion
suspendedsediment11.2007
bottom sediment08.2007
bottom sediment 11.2007

Pollutants of Priority Concern in Austrian Rivers – Results
44 Umweltbundesamt REP-0253, Vienna, 2010
Table 21: Triphosphates [µg/kg dry wt] in suspended sediment and active fine bottom sediments from the river Ager sampling sites
Susp. Sed. [µg/kg dry wt]
Bottom Sed. [µg/kg dry wt]
Sampling site Scheiblmühle Scheiblmühle Raudaschlmühle
Sampling period 08.2007 08.2007 11.2007 08.2007 11.2007
Sample 4014 4768 5642 4769 5637
TEP 18 2.9 0.8 n.d. n.d.
TCEP 21 33 < 14 21 n.d.
TCPP 3.8 6.5 7.1 4 < 2.2
TPhP 48 2.4 < 5.2 < 5.2 < 5.2
TDCPP 4.5 6.4 0.9 0.98 n.d.
TBP 7 5.9 5.4 11 < 4.2
TBoEP 3.8 2.9 2.0 5.2 < 0.82
TKP 26 2.0 1.5 1.6 < 0.37
TEHP 8 3.6 4.0 2.9 n.d.
n.d…not detected
Figure 9: Distribution pattern of the investigated trisphosphates in the particulate matter samples from the river
Schwechat
Ager
relative propo
rtion
0 %
10 %
20 %
30 %
40 %
50 %
60 %
70 %
80 %
90 %
100 %
suspendedsediment08.2007
bottom sediment 08.2007
bottom sediment08.2007
bottom sediment11.2007
bottom sediment 11.2007
TEHP
TKP
TBoEP
TBP
TDCPP
TPhP
TCPP
TCEP
TEP

Pollutants of Priority Concern in Austrian Rivers – Results
Umweltbundesamt REP-0253, Vienna, 2010 45
3.3 Biota
3.3.1 Mercury and methylmercury
Mercury and methylmercury were detected in all fish composite tissue samples, i.e. from both rivers at all sampling locations for all periods studied (Table 22). Comparing between the two rivers, fish tissue levels were consistently higher in the Schwechat River than in the Ager River.
For the Schwechat River samples, the results did not indicate any differences between the two sampling locations. In contrast to the Ager River samples, dry mass based mercury levels in fish from the sampling location Unterachmann (fillet: 93–131 µg/kg, whole body: 74–275 µg/kg) consistently exceeded those from the Dürnau location (fillet: 78–88 µg/kg, whole body: 65–72 µg/kg); this trend was also evident but less distinct in the wet mass based tissue concentra-tions, but not evident for methylmercury.
Across all fish samples, the ranges of total mercury levels were: for fillet 78–342 µg/kg (dry mass) and 12–105 µg/kg (wet mass), and for the whole body 65–276 µg/kg (dry mass) and 18–80 µg/kg (wet mass). For the methylmercury levels, concentration ranges were: for fillet 41–226 µg/kg (dry mass) and 5–62 µg/kg (wet mass), and for the whole body 35–202 µg/kg (dry mass), and 8–46 µg/kg (wet mass).
From the dataset, no influence can be derived from the sampling season on the metal tissue concentrations.
In all but one of the fish composite samples, the total mercury residue levels in the fish fillet pools exceeded the whole body levels (proportion whole-body/fillet: 0.79–0.86 based on dry mass, 0.76–0.91 based on wet mass). Only one sample (Ager-Unterachmann, July 2007) showed the reverse relationship (proportion whole-body/fillet: 2.10 based on dry mass, 3.67 based on wet mass). Methyl-mercury levels showed the same – but less distinct – trend (proportion whole-body/fillet: 0.75–1.04 based on dry mass, 0.74–1.60 based on wet mass).
In all but one of the fish samples, total mercury concentrations exceeded those of methylmercury by factors of around 1.25–2.25 (factors ranges for fillet: 1.51–2.27 dry mass, 1.52–2.20 wet mass based; for the whole body: 1.25–2.11 dry mass, 1.23–2.11 wet mass based). In one sample (Ager-Unterachmann, July 2007) the mercury contents were relatively higher (mercury/methylmercury pro-portions for fillet 2.18 dry mass, 2.40 wet mass based; whole body: 5.29 dry mass, 5.50 wet mass based).
Mussels were only available from the Ager River. There, total mercury levels ranged from < 7 to 105 and methylmercury from < 9 to 36 µg/kg (wet mass), with the levels being consistently lower in the samples collected in July than in November (see Table 23).

Pollutants of Priority Concern in Austrian Rivers – Results
46 Umweltbundesamt REP-0253, Vienna, 2010
Table 22: Concentrations of total mercury (Hg) and methylmercury (Me-Hg) (µg/kg; mass base in brackets) in the fish (Leuciscus cephalus) whole body and fillet composite samples collected from two Austrian rivers in two collection periods (samples as detailed in Table 4 and Table 11; whole body concentrations calculated based on the measured fillet and carcass concentrations; for limits of quantification and detection and see Table 12).
Rivers Sampling points
SP Fillet concentrations
(µg/kg)
Whole body concentrations
(µg/kg)
Analytes
[dry] [wet] [dry] [wet] Schwechat Mannswörth P-1 300 105 257 80 Hg 178 62 148 46 Me-Hg P-2 342 82 276 69 Hg 226 54 170 42 Me-Hg Schwarz- P-1 n.a. n.a. n.a. n.a. Hg mühlbrücke n.a. n.a. n.a. n.a. Me-Hg P-2 317 61 252 49 Hg 194 37 202 40 Me-Hg Ager Unterachmann P-1 131 12 275 44 Hg 60 5 52 8 Me-Hg P-2 93 24 74 19 Hg 41 11 35 9 Me-Hg Dürnau P-1 78 20 65 18 Hg 50 13 38 11 Me-Hg P-2 88 22 72 20 Hg 41 10 42 11 Me-Hg
SP=sampling period: P-1 (July 2007), P-2 (November 2007); n.a. (not analysed)
Table 23: Concentrations of total mercury (Hg) and methylmercury (Me-Hg) (µg/kg; mass base in brackets) in the mussel (Dreissena polymorpha) whole body samples (soft body, shells excluded) collected from two Austrian rivers in two collection periods (samples as detailed in Table 4 and Table 11).
Rivers Sampling points PS Whole bodyconcentrations (µg/kg)
Analytes
[dry] [wet] Ager Unterachmann P-1 n.a. n.a. Hg n.a. n.a. Me-Hg P-2 105 9 Hg 36 3 Me-Hg Dürnau P-1 38 n.a. Hg ND n.a. Me-Hg P-2 56 4 Hg 17 1 Me-Hg
PS=sampling period: P-1 (July 2007), P-2 (November 2007); n.a. (not analysed); n.d. (not detected); for limits of quantification and detection see Table 12
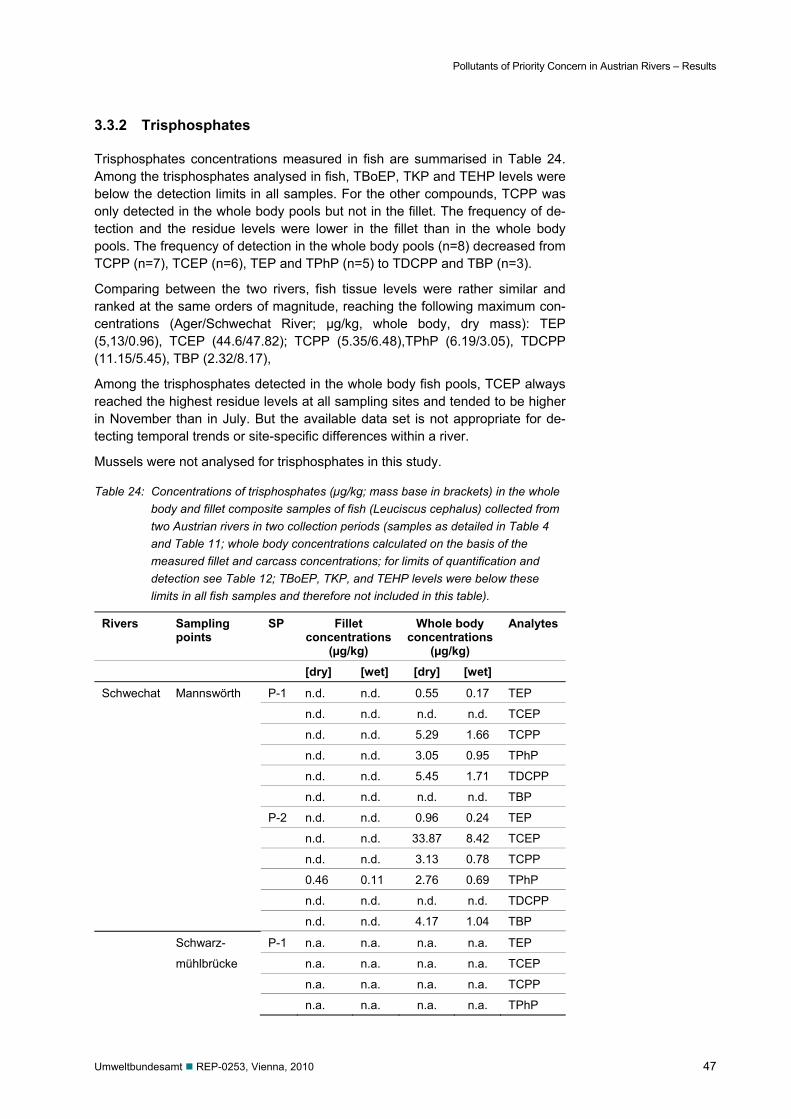
Pollutants of Priority Concern in Austrian Rivers – Results
Umweltbundesamt REP-0253, Vienna, 2010 47
3.3.2 Trisphosphates
Trisphosphates concentrations measured in fish are summarised in Table 24. Among the trisphosphates analysed in fish, TBoEP, TKP and TEHP levels were below the detection limits in all samples. For the other compounds, TCPP was only detected in the whole body pools but not in the fillet. The frequency of de-tection and the residue levels were lower in the fillet than in the whole body pools. The frequency of detection in the whole body pools (n=8) decreased from TCPP (n=7), TCEP (n=6), TEP and TPhP (n=5) to TDCPP and TBP (n=3).
Comparing between the two rivers, fish tissue levels were rather similar and ranked at the same orders of magnitude, reaching the following maximum con-centrations (Ager/Schwechat River; μg/kg, whole body, dry mass): TEP (5,13/0.96), TCEP (44.6/47.82); TCPP (5.35/6.48),TPhP (6.19/3.05), TDCPP (11.15/5.45), TBP (2.32/8.17),
Among the trisphosphates detected in the whole body fish pools, TCEP always reached the highest residue levels at all sampling sites and tended to be higher in November than in July. But the available data set is not appropriate for de-tecting temporal trends or site-specific differences within a river.
Mussels were not analysed for trisphosphates in this study.
Table 24: Concentrations of trisphosphates (µg/kg; mass base in brackets) in the whole body and fillet composite samples of fish (Leuciscus cephalus) collected from two Austrian rivers in two collection periods (samples as detailed in Table 4 and Table 11; whole body concentrations calculated on the basis of the measured fillet and carcass concentrations; for limits of quantification and detection see Table 12; TBoEP, TKP, and TEHP levels were below these limits in all fish samples and therefore not included in this table).
Rivers Sampling points
SP Fillet concentrations
(µg/kg)
Whole body concentrations
(µg/kg)
Analytes
[dry] [wet] [dry] [wet]
Schwechat Mannswörth P-1 n.d. n.d. 0.55 0.17 TEP
n.d. n.d. n.d. n.d. TCEP
n.d. n.d. 5.29 1.66 TCPP
n.d. n.d. 3.05 0.95 TPhP
n.d. n.d. 5.45 1.71 TDCPP
n.d. n.d. n.d. n.d. TBP
P-2 n.d. n.d. 0.96 0.24 TEP
n.d. n.d. 33.87 8.42 TCEP
n.d. n.d. 3.13 0.78 TCPP
0.46 0.11 2.76 0.69 TPhP
n.d. n.d. n.d. n.d. TDCPP
n.d. n.d. 4.17 1.04 TBP
Schwarz- P-1 n.a. n.a. n.a. n.a. TEP
mühlbrücke n.a. n.a. n.a. n.a. TCEP
n.a. n.a. n.a. n.a. TCPP
n.a. n.a. n.a. n.a. TPhP
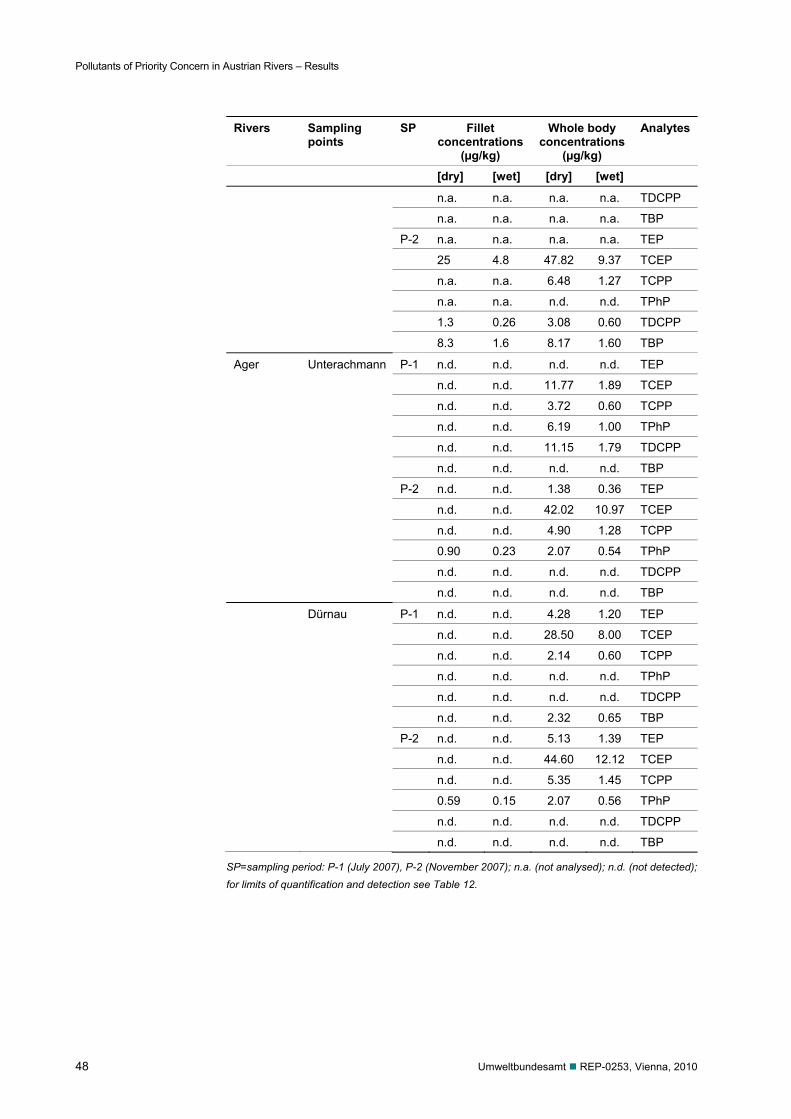
Pollutants of Priority Concern in Austrian Rivers – Results
48 Umweltbundesamt REP-0253, Vienna, 2010
Rivers Sampling points
SP Fillet concentrations
(µg/kg)
Whole body concentrations
(µg/kg)
Analytes
[dry] [wet] [dry] [wet]
n.a. n.a. n.a. n.a. TDCPP
n.a. n.a. n.a. n.a. TBP
P-2 n.a. n.a. n.a. n.a. TEP
25 4.8 47.82 9.37 TCEP
n.a. n.a. 6.48 1.27 TCPP
n.a. n.a. n.d. n.d. TPhP
1.3 0.26 3.08 0.60 TDCPP
8.3 1.6 8.17 1.60 TBP
Ager Unterachmann P-1 n.d. n.d. n.d. n.d. TEP
n.d. n.d. 11.77 1.89 TCEP
n.d. n.d. 3.72 0.60 TCPP
n.d. n.d. 6.19 1.00 TPhP
n.d. n.d. 11.15 1.79 TDCPP
n.d. n.d. n.d. n.d. TBP
P-2 n.d. n.d. 1.38 0.36 TEP
n.d. n.d. 42.02 10.97 TCEP
n.d. n.d. 4.90 1.28 TCPP
0.90 0.23 2.07 0.54 TPhP
n.d. n.d. n.d. n.d. TDCPP
n.d. n.d. n.d. n.d. TBP
Dürnau P-1 n.d. n.d. 4.28 1.20 TEP
n.d. n.d. 28.50 8.00 TCEP
n.d. n.d. 2.14 0.60 TCPP
n.d. n.d. n.d. n.d. TPhP
n.d. n.d. n.d. n.d. TDCPP
n.d. n.d. 2.32 0.65 TBP
P-2 n.d. n.d. 5.13 1.39 TEP
n.d. n.d. 44.60 12.12 TCEP
n.d. n.d. 5.35 1.45 TCPP
0.59 0.15 2.07 0.56 TPhP
n.d. n.d. n.d. n.d. TDCPP
n.d. n.d. n.d. n.d. TBP
SP=sampling period: P-1 (July 2007), P-2 (November 2007); n.a. (not analysed); n.d. (not detected); for limits of quantification and detection see Table 12.
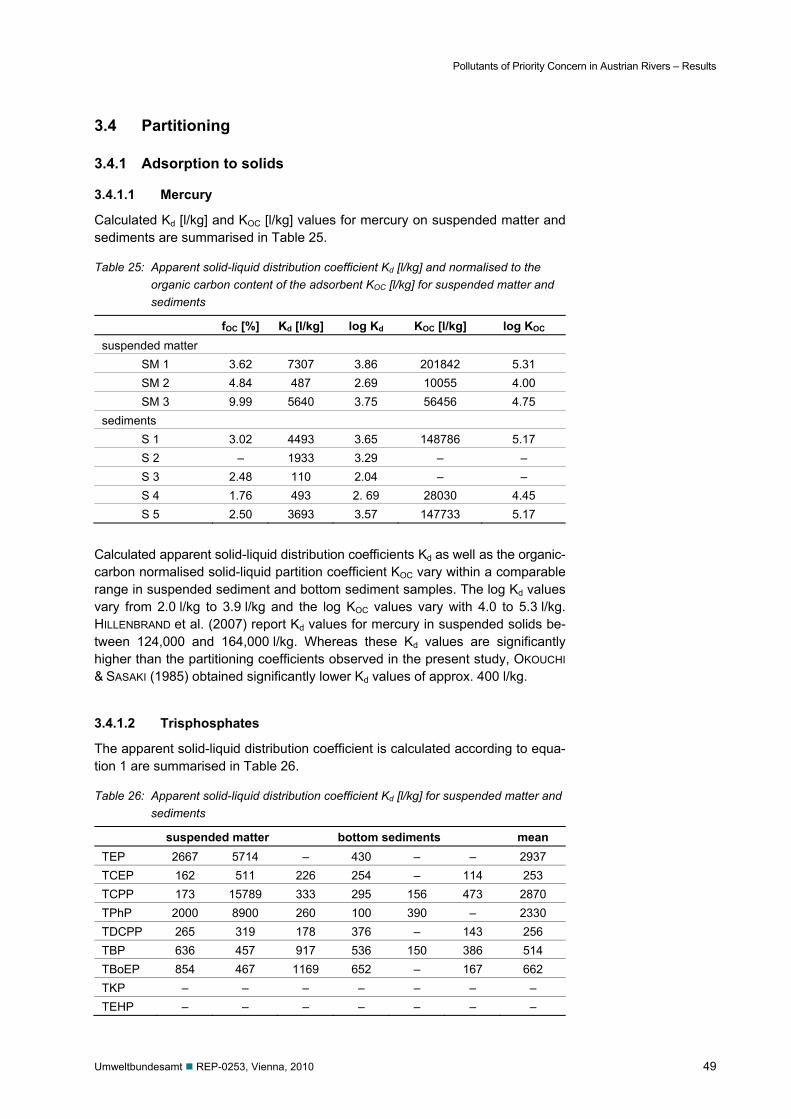
Pollutants of Priority Concern in Austrian Rivers – Results
Umweltbundesamt REP-0253, Vienna, 2010 49
3.4 Partitioning
3.4.1 Adsorption to solids
3.4.1.1 Mercury
Calculated Kd [l/kg] and KOC [l/kg] values for mercury on suspended matter and sediments are summarised in Table 25.
Table 25: Apparent solid-liquid distribution coefficient Kd [l/kg] and normalised to the organic carbon content of the adsorbent KOC [l/kg] for suspended matter and sediments
fOC [%] Kd [l/kg] log Kd KOC [l/kg] log KOC suspended matter SM 1 3.62 7307 3.86 201842 5.31 SM 2 4.84 487 2.69 10055 4.00 SM 3 9.99 5640 3.75 56456 4.75 sediments S 1 3.02 4493 3.65 148786 5.17 S 2 – 1933 3.29 – – S 3 2.48 110 2.04 – – S 4 1.76 493 2. 69 28030 4.45 S 5 2.50 3693 3.57 147733 5.17
Calculated apparent solid-liquid distribution coefficients Kd as well as the organic-carbon normalised solid-liquid partition coefficient KOC vary within a comparable range in suspended sediment and bottom sediment samples. The log Kd values vary from 2.0 l/kg to 3.9 l/kg and the log KOC values vary with 4.0 to 5.3 l/kg. HILLENBRAND et al. (2007) report Kd values for mercury in suspended solids be-tween 124,000 and 164,000 l/kg. Whereas these Kd values are significantly higher than the partitioning coefficients observed in the present study, OKOUCHI & SASAKI (1985) obtained significantly lower Kd values of approx. 400 l/kg.
3.4.1.2 Trisphosphates
The apparent solid-liquid distribution coefficient is calculated according to equa-tion 1 are summarised in Table 26.
Table 26: Apparent solid-liquid distribution coefficient Kd [l/kg] for suspended matter and sediments
suspended matter bottom sediments mean TEP 2667 5714 – 430 – – 2937 TCEP 162 511 226 254 – 114 253 TCPP 173 15789 333 295 156 473 2870 TPhP 2000 8900 260 100 390 – 2330 TDCPP 265 319 178 376 – 143 256 TBP 636 457 917 536 150 386 514 TBoEP 854 467 1169 652 – 167 662 TKP – – – – – – – TEHP – – – – – – –
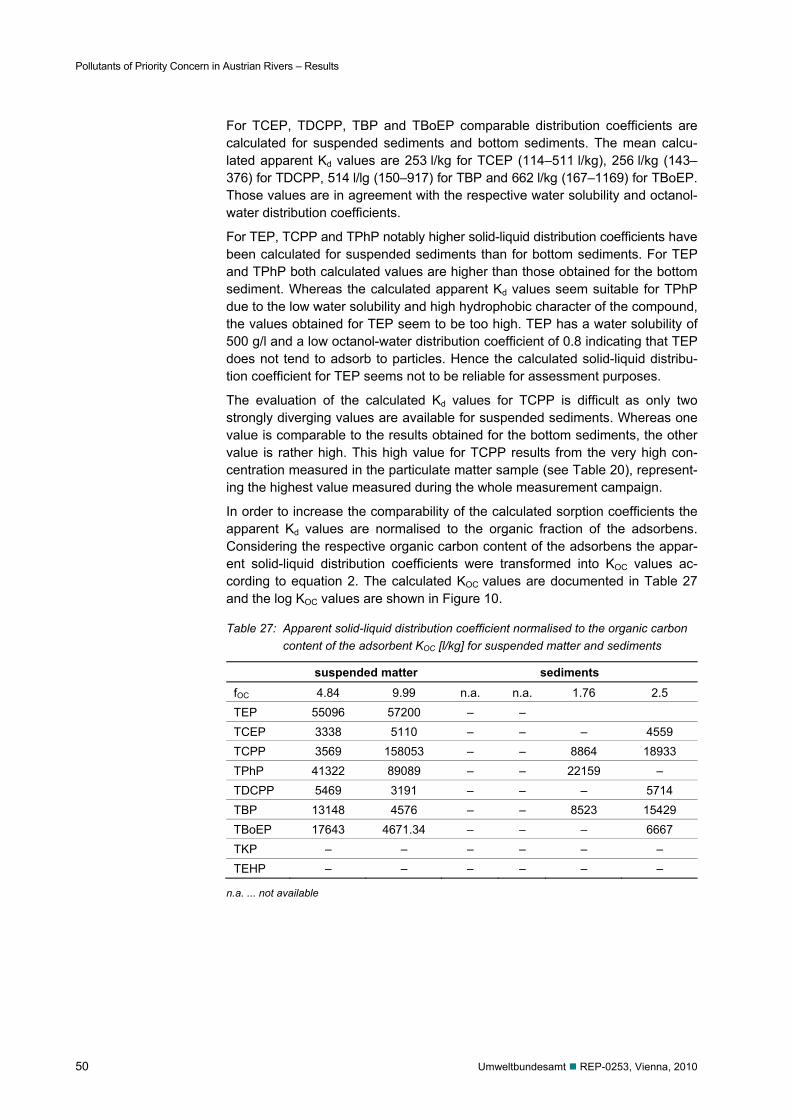
Pollutants of Priority Concern in Austrian Rivers – Results
50 Umweltbundesamt REP-0253, Vienna, 2010
For TCEP, TDCPP, TBP and TBoEP comparable distribution coefficients are calculated for suspended sediments and bottom sediments. The mean calcu-lated apparent Kd values are 253 l/kg for TCEP (114–511 l/kg), 256 l/kg (143–376) for TDCPP, 514 l/lg (150–917) for TBP and 662 l/kg (167–1169) for TBoEP. Those values are in agreement with the respective water solubility and octanol-water distribution coefficients.
For TEP, TCPP and TPhP notably higher solid-liquid distribution coefficients have been calculated for suspended sediments than for bottom sediments. For TEP and TPhP both calculated values are higher than those obtained for the bottom sediment. Whereas the calculated apparent Kd values seem suitable for TPhP due to the low water solubility and high hydrophobic character of the compound, the values obtained for TEP seem to be too high. TEP has a water solubility of 500 g/l and a low octanol-water distribution coefficient of 0.8 indicating that TEP does not tend to adsorb to particles. Hence the calculated solid-liquid distribu-tion coefficient for TEP seems not to be reliable for assessment purposes.
The evaluation of the calculated Kd values for TCPP is difficult as only two strongly diverging values are available for suspended sediments. Whereas one value is comparable to the results obtained for the bottom sediments, the other value is rather high. This high value for TCPP results from the very high con-centration measured in the particulate matter sample (see Table 20), represent-ing the highest value measured during the whole measurement campaign.
In order to increase the comparability of the calculated sorption coefficients the apparent Kd values are normalised to the organic fraction of the adsorbens. Considering the respective organic carbon content of the adsorbens the appar-ent solid-liquid distribution coefficients were transformed into KOC values ac-cording to equation 2. The calculated KOC values are documented in Table 27 and the log KOC values are shown in Figure 10.
Table 27: Apparent solid-liquid distribution coefficient normalised to the organic carbon content of the adsorbent KOC [l/kg] for suspended matter and sediments
suspended matter sediments fOC 4.84 9.99 n.a. n.a. 1.76 2.5 TEP 55096 57200 – – TCEP 3338 5110 – – – 4559 TCPP 3569 158053 – – 8864 18933 TPhP 41322 89089 – – 22159 – TDCPP 5469 3191 – – – 5714 TBP 13148 4576 – – 8523 15429 TBoEP 17643 4671.34 – – – 6667 TKP – – – – – – TEHP – – – – – –
n.a. ... not available
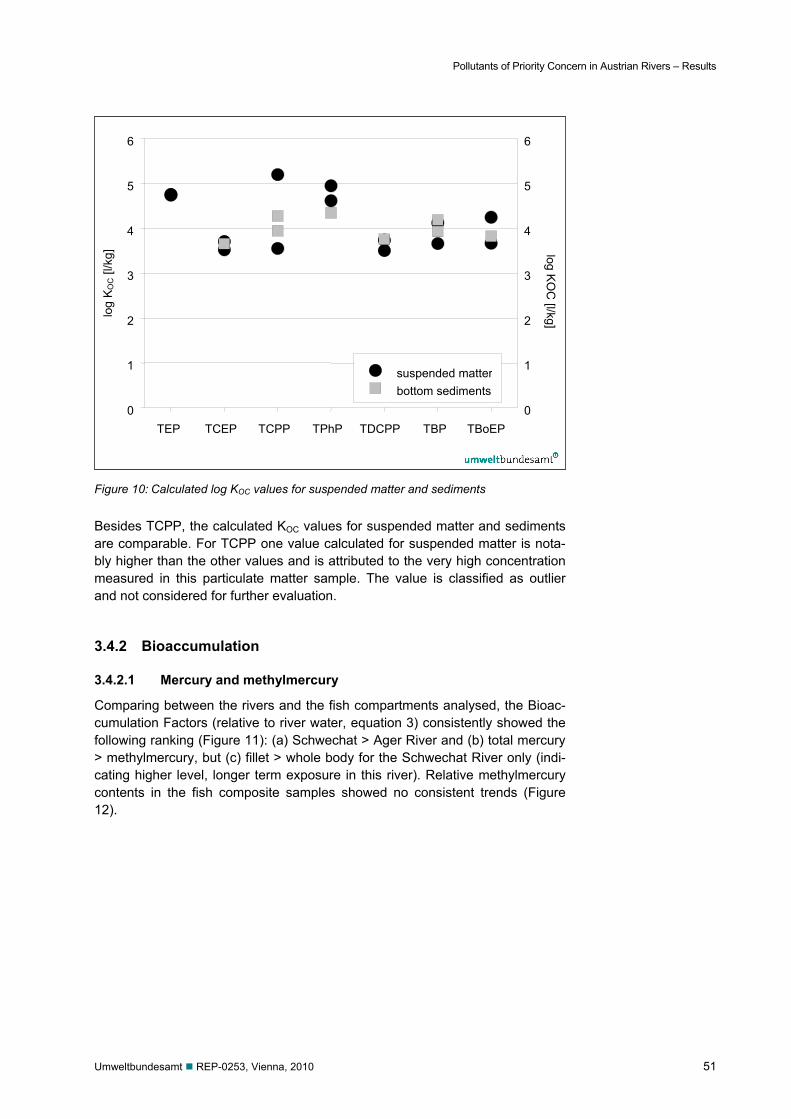
Pollutants of Priority Concern in Austrian Rivers – Results
Umweltbundesamt REP-0253, Vienna, 2010 51
Figure 10: Calculated log KOC values for suspended matter and sediments
Besides TCPP, the calculated KOC values for suspended matter and sediments are comparable. For TCPP one value calculated for suspended matter is nota-bly higher than the other values and is attributed to the very high concentration measured in this particulate matter sample. The value is classified as outlier and not considered for further evaluation.
3.4.2 Bioaccumulation
3.4.2.1 Mercury and methylmercury
Comparing between the rivers and the fish compartments analysed, the Bioac-cumulation Factors (relative to river water, equation 3) consistently showed the following ranking (Figure 11): (a) Schwechat > Ager River and (b) total mercury > methylmercury, but (c) fillet > whole body for the Schwechat River only (indi-cating higher level, longer term exposure in this river). Relative methylmercury contents in the fish composite samples showed no consistent trends (Figure 12).
TEP TCEP TCPP TPhP TDCPP TBP TBoEP
log
KO
C [l
/kg]
0
1
2
3
4
5
6
log KO
C [l/kg]
0
1
2
3
4
5
6
suspended matterbottom sediments
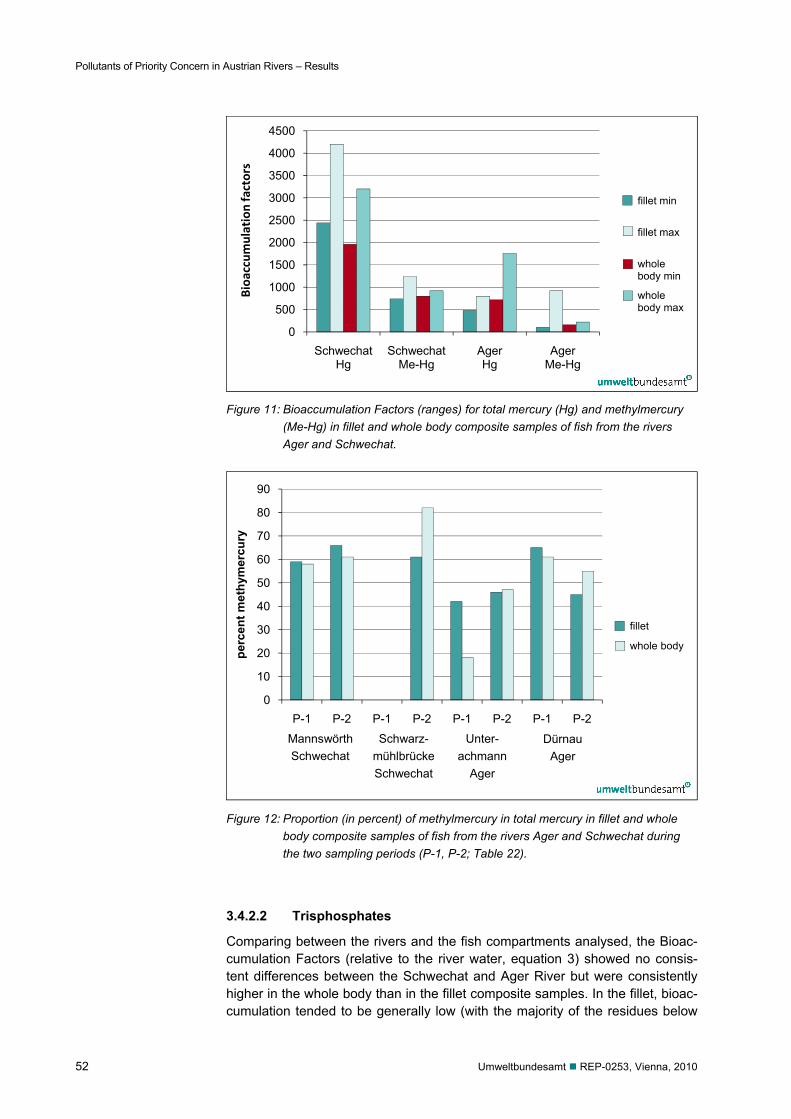
Pollutants of Priority Concern in Austrian Rivers – Results
52 Umweltbundesamt REP-0253, Vienna, 2010
Figure 11: Bioaccumulation Factors (ranges) for total mercury (Hg) and methylmercury
(Me-Hg) in fillet and whole body composite samples of fish from the rivers Ager and Schwechat.
Figure 12: Proportion (in percent) of methylmercury in total mercury in fillet and whole
body composite samples of fish from the rivers Ager and Schwechat during the two sampling periods (P-1, P-2; Table 22).
3.4.2.2 Trisphosphates
Comparing between the rivers and the fish compartments analysed, the Bioac-cumulation Factors (relative to the river water, equation 3) showed no consis-tent differences between the Schwechat and Ager River but were consistently higher in the whole body than in the fillet composite samples. In the fillet, bioac-cumulation tended to be generally low (with the majority of the residues below
0
500
1000
1500
2000
2500
3000
3500
4000
4500
SchwechatHg
SchwechatMe-Hg
AgerHg
AgerMe-Hg
Bioa
ccum
ulation factors
fillet min
fillet max
wholebody min
wholebody max
0
10
20
30
40
50
60
70
80
90
P-1 P-2 P-1 P-2 P-1 P-2 P-1 P-2
perc
ent m
ethy
mer
cury
fillet
whole body
MannswörthSchwechat
Schwarz- mühlbrückeSchwechat
Unter- achmann
Ager
Dürnau Ager
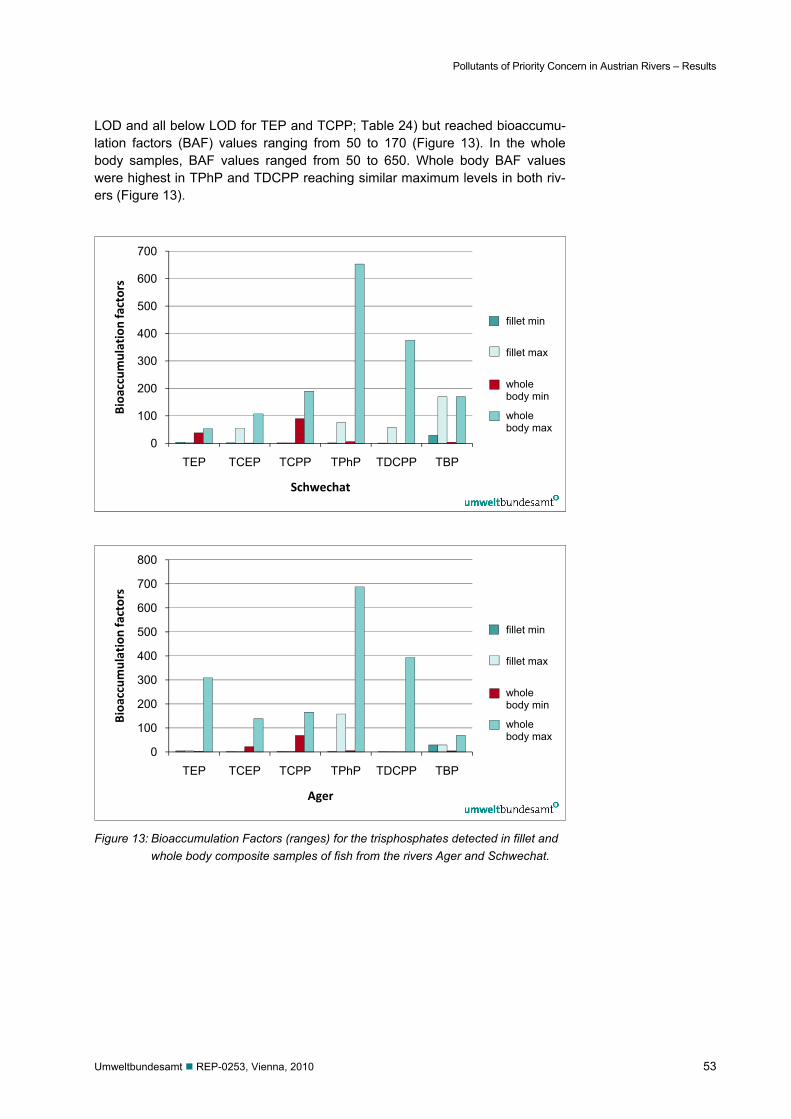
Pollutants of Priority Concern in Austrian Rivers – Results
Umweltbundesamt REP-0253, Vienna, 2010 53
LOD and all below LOD for TEP and TCPP; Table 24) but reached bioaccumu-lation factors (BAF) values ranging from 50 to 170 (Figure 13). In the whole body samples, BAF values ranged from 50 to 650. Whole body BAF values were highest in TPhP and TDCPP reaching similar maximum levels in both riv-ers (Figure 13).
Figure 13: Bioaccumulation Factors (ranges) for the trisphosphates detected in fillet and
whole body composite samples of fish from the rivers Ager and Schwechat.
0
100
200
300
400
500
600
700
TEP TCEP TCPP TPhP TDCPP TBP
Bioa
ccum
ulation factors
Schwechat
fillet min
fillet max
wholebody min
wholebody max
0
100
200
300
400
500
600
700
800
TEP TCEP TCPP TPhP TDCPP TBP
Bioa
ccum
ulation factors
Ager
fillet min
fillet max
wholebody min
wholebody max

Pollutants of Priority Concern in Austrian Rivers – Discussion
54 Umweltbundesamt REP-0253, Vienna, 2010
4 DISCUSSION
4.1 Contaminant levels compared among rivers and sampling locations
4.1.1 Mercury and methylmercury
In two Austrian rivers (Schwechat and Ager), three abiotic compartments (river water, suspended and bottom sediment) and three biotic compartments (fish, L. cephalus, whole body and fillet, and mussel D. polymorpha whole body) were compared for total mercury and methylmercury as well as trisphosphate con-tamination.
Considering the river water analyses, comparable results were observed in both river systems. Mercury was detected in both rivers at all sampling sites in con-centrations below the limit of quantification of 0.1 µg/l. Methylmercury was not detected in the investigated river water samples. These results are in agree-ment with the results observed within the Austrian Water Quality Monitoring System (AWQMS). Under this monitoring programme all measurements since 1999 have been below the limit of quantification, which was equal to 0.06 µg/l from 1996 to 2001 and equal to 0.1 from 2001–2006, depending on the labora-tory performing the analysis.
Total mercury is not easily dissolved in river water. Rather, it is sorbed on parti-cle surfaces, in particular organic complexes but also on clay minerals as well as iron oxides (SALIMINEN 2005). Therefore, mercury concentration away from mineralisations and contamination in natural water ranges from about 0.001 to 0.05 µg/l.
Whereas mercury was detected in all analysed particulate matter samples, me-thylmercury was not detected. All measurements for methylmercury were below the limit of detection of 4 µg/kg dry wt.
In the samples from the river Schwechat higher mercury concentrations were detected in suspended as well as in bottom sediment samples than in the river Ager sediments.
For mercury data are available from the AWQMS for active bottom sediments (< 40 µm) from the river Schwechat. These concentrations are documented in Figure 7 and the actual measurements fit well into the range of variation ob-served within the monitoring programme.
Mercury and methylmercury were detected in all fish composite tissue samples, from both rivers studied. Comparing between the two rivers, fish tissue levels were consistently higher in the Schwechat than in the Ager River. In the mus-sels, mercury and methylmercury were detected in all samples analysed (ex-cept methylmercury in one sample). Mussels were only available from the Ager River.
There was no indication that the sampling location influenced the fish metal le-vels in the Schwechat River. But, in the Ager River, the metal levels in both fish and mussels from the sampling location Unterachmann tended to exceed those from the Dürnau location.
Pollutants of Priority Concern in Austrian Rivers – Discussion
Umweltbundesamt REP-0253, Vienna, 2010 55
Summarising over all fish (Chub, Leuciscus cephalus) analysed in the present study, the ranges of total mercury concentrations were: for fillet 78–342 µg/kg (median: 131, mean: 192.71; dry mass) and 12–105 µg/kg (median: 24, mean; 46.57; wet mass), and for the whole body 65–276 µg/kg (median: 44, mean: 42.71; dry mass) and 18–80 µg/kg (median: 44, mean: 42.71; wet mass). These findings compared well with those reported in the literature from other recent freshwater field surveys in the region (SVOBODOVA et al. 1999; ANDREJI et al. 2005; DUSEK et al. 2005; HOUSEROVA et al. 2006; GRABER et al. 2008; KRUZIKOVA et al. 2008): For Austria, the median total mercury concentrations detected in the axial muscle of fish ranged from 42 (carp), 62.7 (perch), 68.2 (trout), to 101.8 (whitefish), and reached 299.4 in a single catfish and 339.2 in a single perch (all values µg/kg wet mass; GRABER et al. 2008). For the Czech Republic, the mean total mercury concentrations in the muscle of chub fish were 83 µg/kg (mean; no mass basis reported; SVOBODOVA et al. 1999), 70–270 µg/kg (me-dian, wet mass; KRUZIKOVA et al. 2008), and 135–962 µg/kg (mean, dry mass; HOUSEROVA et al. 2006). Total mercury levels were particularly high (2.85 ± 1.22 mg/kg wet weight) in the muscle of four common Slovak fish species (chub, barbel, roach, and perch) (ANDREJI et al. 2005).
Concentration ranges of methylmercury detected in the present study were: for fillet 41–226 µg/kg (median: 60, mean: 112.86; dry mass) and 5–62 µg/kg (me-dian: 13, mean: 27.43; wet mass), and for the whole body 35–202 µg/kg (me-dian: 52, mean: 98.14; dry mass), and 8–46 µg/kg (median: 11, mean: 23.86; wet mass). For the Czech Republic, mean methylmercury muscle levels ranged from 135–962 (dry mass; HOUSEROVA et al. 2006) and from 60 to 230 (wet mass; KRUZIKOVA et al. (2008).
In a comprehensive review, EISLER (2006) concluded that maximum concentra-tions of total mercury in shark and fish muscle usually did not exceed 2000 µg/kg (fresh mass). To put this into perspective, a large-scale survey conducted in the United States (232 sites in unmined basins, 59 sites in mined basins, overall 34 fish species; SCUDDER et al. 2009) reported total mercury in axial muscle rang-ing from 14 to 1800 (median: 165, mean: 238, sites in unmined basins), and from 20 to 1950 (median: 235, mean: 351, 59 sites in mined basins) (all values µg/kg, wet mass; SCUDDER et al. 2009).
4.1.2 Trisphosphates
River water from the river Schwechat was analysed once on organophosphorus esters. In the river Ager both sampling sites were sampled and analysed twice. No significant differences are to be observed between the two sampling sites along the river Ager. Notably higher concentrations than in the river Ager have been detected in the one sample from the river Schwechat. The measured con-centrations are in line with observations documented in the literature. According to REEMTSMA et al. (2008) most organophosphorus esters occurred at concen-trations of 10–200 ng/l in surface waters, with the highest levels being found downstream of wastewater treatment plants (WWTP) discharges.
Also in the current study, the higher trisphosphate concentrations in the river Schwechat compared to the river Ager might be attributed to the relative wastewater proportion due to discharges into the two river systems. Whereas in the river Schwechat, at the sampling point, approx. 10% of the mean daily total
Pollutants of Priority Concern in Austrian Rivers – Discussion
56 Umweltbundesamt REP-0253, Vienna, 2010
flow is discharged wastewater, this proportion is notably smaller in the river Ager. In the Ager at the estuary into the river Traun approx. less than 2% of the mean daily flow is attributable to wastewater discharges. Treated wastewater is known to be a relevant source for organophosphorus esters in surface waters and concentrations of up to several µg/l (MARTINEZ-CARBALLO et al. 2007; REEMTSMA et al. 2008)
Higher trisphosphate concentrations were detected in river Schwechat sus-pended as well as bottom sediment samples than in the particulate matter sam-ples from the river Ager. Presuming an equilibrium between solid and liquid phase, this result is attributed to the higher concentrations of organophosphorus esters due to the higher wastewater proportion in the river Schwechat.
In both the Ager and Schwechat River, the observed trisphosphate concentra-tions were lowest in the river water (and reached the highest values in the sus-pended solids). While sediment levels in the Schwechat samples tended to ex-ceed those of the Agar samples considerably, contamination of water and whole body fish pools was quite similar in both rivers (Figure 14).
Among the trisphosphates analysed in fish, TBoEP, TKP, and TEHP levels were below detection limits in all samples. Comparing between the two rivers, fish tissue levels appeared lower in the Ager River than in the Schwechat River. Mussels were not analysed for trisphosphates in this study. There was no indi-cation that sampling location influenced the concentrations of trisphosphates in fish.
Maximum trisphosphate concentrations in fish observed in the present study [whole body: TEP (1.39), TCEP (12.12); TCPP (1.45), TPhP (1.00), TDCPP (1.79), TBP (1.60); fillet: TPhP (0.23), TCEP(4.8), TBP(1.6); all values μg/kg, wet mass] matched with those reported from Norway (EVENSET et al. 2009) but were exceeded by reports Japan (reviewed in WHO 1998, 2000), and from Sweden (NATURVARDSVERKET 2009).
Thirteen organophosphorous flame retardants were analysed in samples from the marine environment (seawater, sediment, fish and seabirds) in the Norwe-gian Arctic. In addition, one freshwater fish species (Arctic char, Salvelinus alpinus) from an Arctic lake with high levels of POPs was included in this study. Five of the analytes were not detected in any of the fish samples [DPhBP (< 0.1–< 0.2), DBPhP (< 0.05–< 0.1), TBEP (< 0.2–< 0.6), ToCrP (< 0.08–< 0.2), TCrP (< 0.08–< 0.2)]; TEHP was only found in one fish sample (4.6; liver of At-lantic cod); for the Arctic char, the concentrations found in muscle were as fol-lows: TIBP (0.9–4.8), TBP (1.1–3.6), TCEP (0.5–5.0), TCPP (1.4–2.9), TDCP (< 0.3–6.7), TPhP (0.3–3.2), EHDPP (1.3–16); all values μg/kg wet mass] EVENSET ET AL. 2009).
Fish collected in Japan 1975 and 1978 contained up to 140 μg/kg TCEP and up to 25 μg/kg TDCPP (WHO 1998). Fish (salmon, hering, eel, carp) collected in Sweden were analysed for eleven organophosphorus flame retardants. Particu-larly high concentrations were reported for TCPP (150 in muscle, 4500 in fat of herring), TPP (800 in muscle, 5000 in fat of carp), and EHDPP (450 in muscle, 13500 in fat of eel) (all values μg/kg wet mass; estimated from graph; NATURVARDSVERKET 2009).
Pollutants of Priority Concern in Austrian Rivers – Discussion
Umweltbundesamt REP-0253, Vienna, 2010 57
4.2 Contaminant levels among the compartments analysed
4.2.1 Mercury and methylmercury
Whereas methylmercury was not detectable in the water samples, nearly all measurements for mercury were below the limit of quantification. In all the other compartments, wet mass based levels of the Schwechat River exceeded that of the Ager River.
Comparing the ranges of variation over the whole data set as shown in Figure 14, mercury levels were consistently higher in the sediment than in the fish samples. In contrast, methylmercury levels in fish exceeded that of the sedi-ment. Hence, our results conform with the expected, comparatively high poten-tial of the organometallic compound to bioaccumulate in organisms (and to bio-magnify in food webs). Mercury and methylmercury concentrations and Bioac-cumulation Factors reached higher levels in the fish fillet than in the whole body samples. This trend was more obvious in the overall more contaminated Schwechat river (Figure 14), which again is in accordance with information from the literature indicating that muscle concentrations of metals are particularly high for Hg and especially methylmercury after high-level, long-term exposure (e.g., NORDBERG 2007; WEISBROD et al. 2007; GRILLITSCH & SCHIESARI in press).
The mussel D. polymorpha seemed to accumulate mercury to a larger extent than methylmercury, and both metal species to a lower extent than the fish. However, samples sizes in this study were too small for thorough interspecific comparisons.
For mercury, the ranking for observed residue levels was as follows: water < bi-ota and sediments, whereas for methylmercury the level ranking was: water and sediments (all below detection limits) < biota (all fish and all but one mussel pool above the analytical limits) (summarized in Figure 14). Hence, relative to river water, accumulation in fish and mussels was obvious for both metal spe-cies at all study sites. Relative to the sediments, accumulation in the biota was obvious for methylmercury only.
Highest mercury concentrations were found in the suspended sediment com-partment whereas the methylmercury concentrations were highest in the fish fillet.
In general, 80 to 99% of the mercury in fish was present as methylmercury (HOUSEROVA 2006; SLOOF et al. 1995; EISLER 2006; KRUSE et al. 2008; SCUDDER et al. 2009) but considerable variation in the methylmercury proportion has been reported (KRUSE et al. 2008). In the present study, the methylmercury/total mer-cury proportion ranges in fish were 42–66% for fillet and 18–82% for the whole body (Figure 12). These results conform with the observations reported by KRUZIKOVA et al. (2008) for the same fish species (Leuciscus cephalus) from seven locations in the Czech Republic where in axial muscle samples, the mean methylmercury content tended to increase and variation of the methyl-mercury content to decrease with increasing size or age of the fish.

Pollutants of Pr
58
Fb-d (fish whoµg/kg, wet masanalysed); Sb-levels below an
Figure 14: CorivTaan
0
Ff-dFf-wFb-dFb-wMb-dMb-wSs-dSb-d
W
0
Ff-dFf-wFb-dFb-wMb-dMb-wSs-dSb-d
W
<
o
<
<
<
o
o
o
riority Concern i
le body, µg/kg, ss), Mb-d (muss-d (bottom sedimnalytical limits in
oncentration ravers Ager and able 13, Tablend are as deta
200
Total mer
H
200 4
Methylme
Me-
n Austrian River
dry mass); Fb-wsel whole soft bment, µg/kg, dryn all samples); o
ranges (minimSchwechat ov
e 14, Table 18 ailed in Table 9
4.2.2 Tr
Trisphosph(mussels nset, trisphand seemment fractfraction. Dare summSchwecha
400 600
rcury concentr
Hg Ager
400 600
ercury concent
-Hg Ager
rs – Discussion
w (fish whole boody, µg/kg, dry
y mass); Ss-d (so (no data avail
um-maximumver the compato 24; concen
9, Table 10 an
risphospha
hates were not analysedosphate leveed rather sition, but ran
Distribution bmarised in Fat River.
800 10
rations
800 100
trations
ody, µg/kg, wet mass); Mb-w (m
suspended sedilable)
m bars) of total artments analytrations below
nd Table 12; m
ates
detected ind). Comparinels in fish exmilar and panked generaetween com
Figure 15 fo
000
Ff-dFf-wFb-dFb-wSs-dSb-d
W
00
Ff-d
Ff-w
Fb-d
Fb-w
Ss-d
Sb-d
W
Umw
mass); Ff-d: (fismussel whole soiment, µg/kg, dry
mercury (Hg)ysed (measure
w the analyticamussels were s
n all environng the rangesxceeded thaarallel to thoally below thmpartments a
r the Ager
0 200
T
0 200
w
Meth
Me
weltbundesamt
sh fillet, µg/kg, doft body; µg/kg,ry mass); W (rive
and methylmed concentrat
al limits were ssampled in the
nmental coms of variationat of the riveose observedhose in the and the respe
River and i
400 6
Total mercury c
Hg Schwech
400 6
hylmercury con
e-Hg Schwec
REP-0253, Vi
dry mass); Ff-w wet mass); n.aer water, µg/l); <
mercury (Me-Hgtions are as deset to zero in the Ager river on
mpartments n over the wher water cond in the bottsuspended ective concein Figure 16
600 800
concentrations
at
600 800
ncentrations
chat
ienna, 2010
(fish fillet, a. (not < (residue
g) in the etailed in his graph, nly.
analysed hole data siderably tom sedi-sediment
entrations 6 for the
1000
s
1000
<
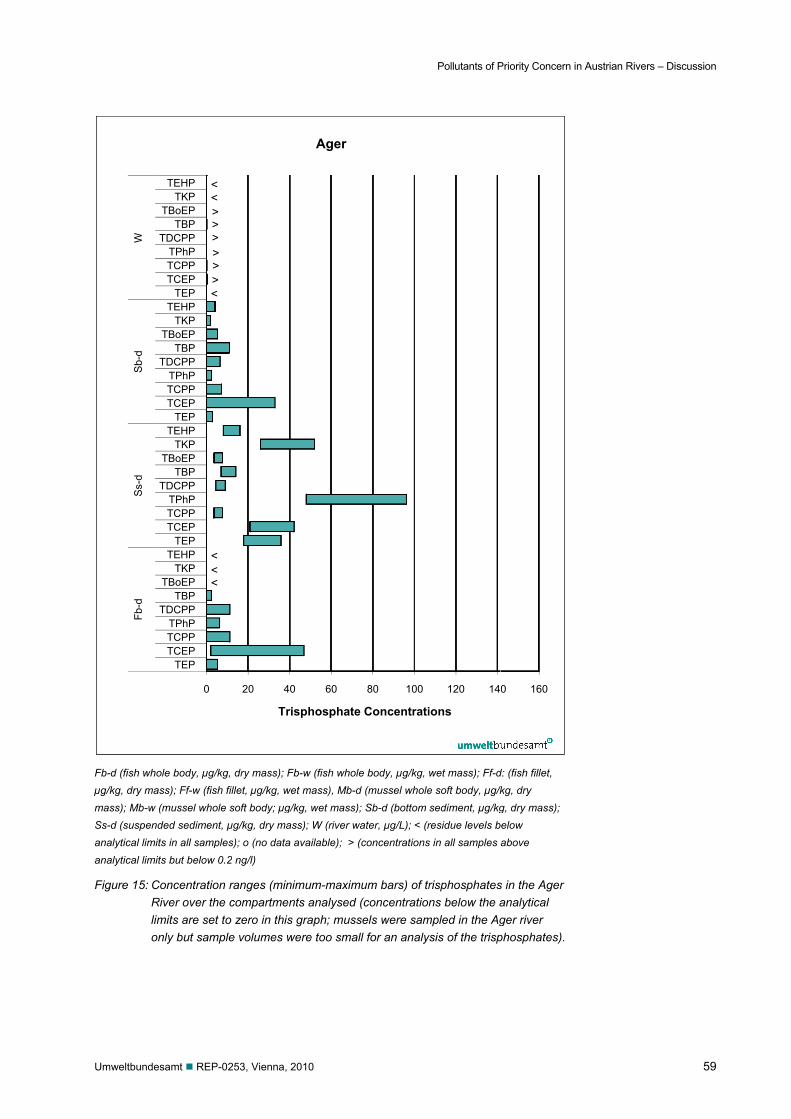
Umweltbun
Fb-d (fish µg/kg, dry mass); MbSs-d (suspanalytical lanalytical l
Figure 15
Fb-d
Ss-
dS
b-d
W
ndesamt REP
whole body, µg/mass); Ff-w (fis
b-w (mussel whopended sedimenlimits in all samplimits but below
5: ConcentratioRiver over thlimits are seonly but sam
0
TEPTCEPTCPPTPhP
TDCPPTBP
TBoEPTKP
TEHPTEP
TCEPTCPPTPhP
TDCPPTBP
TBoEPTKP
TEHPTEP
TCEPTCPPTPhP
TDCPPTBP
TBoEPTKP
TEHPTEP
TCEPTCPPTPhP
TDCPPTBP
TBoEPTKP
TEHP<<
<
>
>
>
>
<
>
<<
>
P-0253, Vienna,
/kg, dry mass); sh fillet, µg/kg, wole soft body; µgnt, µg/kg, dry mples); o (no data
w 0.2 ng/l)
on ranges (minhe compartmet to zero in thi
mple volumes
20 4
T
<<
<
>
>
>
>
<
>
<<
>
, 2010
Fb-w (fish wholwet mass), Mb-dg/kg, wet mass)ass); W (river wa available); >
nimum-maximents analysed is graph; musswere too sma
40 60
risphosphate
Ager
le body, µg/kg, d (mussel whole); Sb-d (bottom
water, µg/L); < (r(concentrations
mum bars) of tr(concentrationsels were samll for an analy
80 100
e Concentrati
Pollutants of P
wet mass); Ff-de soft body, µg/ksediment, µg/kgresidue levels bs in all samples
risphosphatesns below the a
mpled in the Agysis of the trisp
120 14
ions
Priority Concern
d: (fish fillet, /kg, dry g, dry mass);
below above
s in the Ager analytical ger river phosphates).
0 160
in Austrian Riveers – Discussion
59
n
9
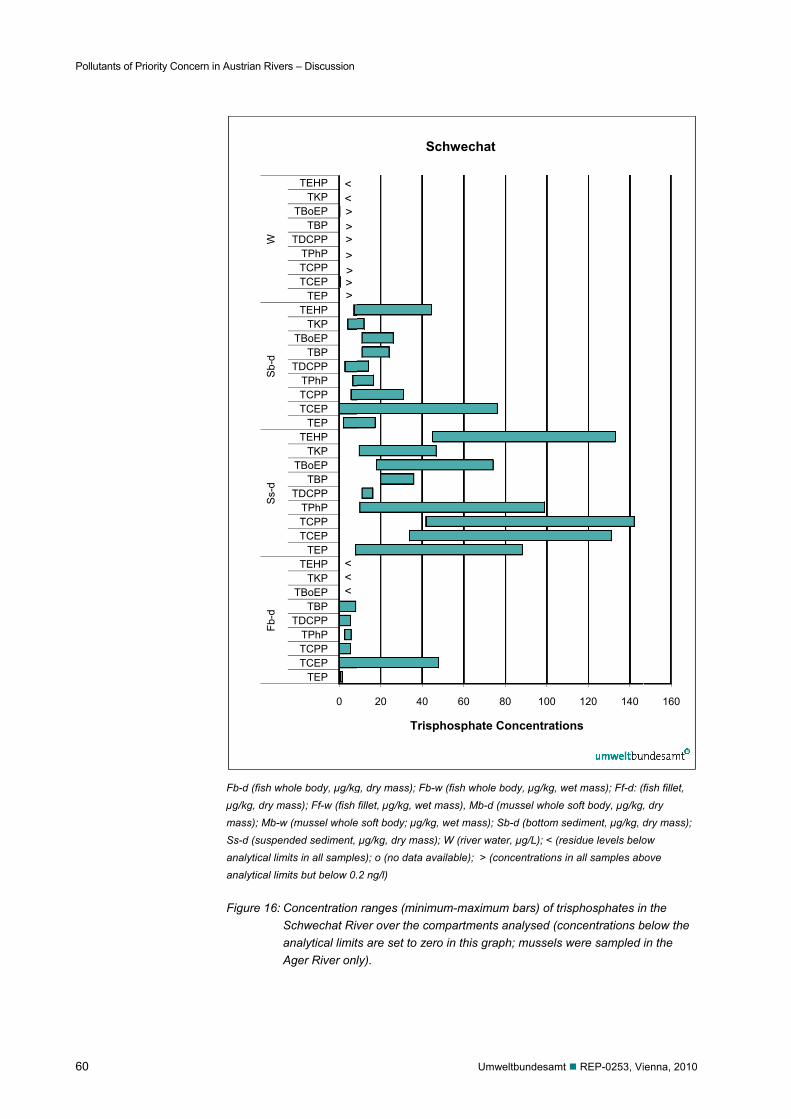
Pollutants of Pr
60
riority Concern in Austrian River
Fb-d (fish whµg/kg, dry mamass); Mb-wSs-d (suspenanalytical limanalytical lim
Figure 16: CSaA
Fb-d
Ss-
dS
b-d
W
rs – Discussion
hole body, µg/kgass); Ff-w (fish
w (mussel wholended sediment,
mits in all samplemits but below 0.
Concentration Schwechat Rivanalytical limitAger River onl
0
TEPTCEPTCPPTPhP
TDCPPTBP
TBoEPTKP
TEHPTEP
TCEPTCPPTPhP
TDCPPTBP
TBoEPTKP
TEHPTEP
TCEPTCPPTPhP
TDCPPTBP
TBoEPTKP
TEHPTEP
TCEPTCPPTPhP
TDCPPTBP
TBoEPTKP
TEHP
<<<
<<>
>
>
>
>
>
>
g, dry mass); Fbfillet, µg/kg, wet
e soft body; µg/kµg/kg, dry mas
es); o (no data a2 ng/l)
ranges (minimver over the cts are set to zely).
20 40
Tris
S
Umw
b-w (fish whole bt mass), Mb-d (m
kg, wet mass); Ss); W (river wat
available); > (co
mum-maximumompartments ero in this grap
60 8
sphosphate C
Schwechat
weltbundesamt
body, µg/kg, wemussel whole s
Sb-d (bottom seter, µg/L); < (resoncentrations in
m bars) of trisanalysed (con
ph; mussels w
80 100
Concentration
REP-0253, Vi
et mass); Ff-d: (fsoft body, µg/kg,ediment, µg/kg, dsidue levels belon all samples ab
sphosphates inncentrations b
were sampled
120 140
ns
ienna, 2010
(fish fillet, , dry dry mass); ow bove
n the below the in the
160

Pollutants of Priority Concern in Austrian Rivers – Discussion
Umweltbundesamt REP-0253, Vienna, 2010 61
4.3 Contaminant levels versus critical values/ Environmental Quality Standards
4.3.1 Environmental quality standards for water
Directive 2008/105/EC defines environmental quality standards (EQS) in the field of water policy. The EQS for mercury and mercury compounds is stabilised for biota and corresponds to 20 µg/kg wet wt. If member states do not apply this biota environmental quality standard, other standards may be defined for water which have to guarantee the same level of protection. The directive proposes 0.05 µg/l to be kept by annual average values (AA-EQS) and 0.07 µg/l as maximum value (MAC-EQS). Both EQS values refer to the dissolved fraction (EC 2008).
Comparing the measured mercury concentrations in the investigated water samples with the environmental quality standards, no evaluation can be per-formed. Besides one measurement, all results were below the limit of quantifica-tion (LOQ=0.1 µg/l) but above the limit of detection of 0.05 µg/l. The limit of de-tection corresponds to the AA-EQS and mercury has been detected in all sam-ples even if not quantifiable. Hence, the observed concentrations are higher than the respective environmental quality standard. Nevertheless prior to draw-ing further conclusions, additional measurements are required as the AA-EQS refers to annual average values based on monthly measurements.
At one sampling site during one sampling campaign mercury was detected at a concentration of 0.3 µg/l. This value is higher than the maximum allowable con-centration.
All measured mercury concentrations in fish from the river Schwechat exceeded the respective EQS of 20 µg/kg wet mass (exceedance factors: 3.1–5.3). In the river Ager, out of four measured values one matched, two marginally exceeded, and one fell slightly below this EQS (factors: 0.6–1.2; total mercury, fillet, wet mass). Hence, secondary poisoning of fish predators in the rivers that were ex-amined for this study cannot be excluded.
With respect to food safety for human consumption, the European Community allows 0.5 mg mercury/kg in fishery products (with some exceptions). The total mercury levels observed in the present study were all below this limit value (maximum factor: 0.2; total mercury, fillet, wet mass). But, considering that some of the mercury levels in fish reached this limit approximately, further stud-ies with fish species and size classes typically used for human consumption should be conducted.
No environmental quality standards are available for trisphosphates up to now.
Pollutants of Priority Concern in Austrian Rivers – LiteraturE
62 Umweltbundesamt REP-0253, Vienna, 2010
5 LITERATURE
ADAMS, W.J. & CHAPMAN, P.M. (editors) (2007): Assessing the hazard of metals and inor-ganic metal substances in aquatic and terrestrial systems. Boca Raton (FL, U.S.A.): Society of Environmental Toxicology and Chemistry (SETAC).
Andreji, J.; Stranai, I.; Massanyi, P. & Valent, M. (2005): Concentrations of selected metals in muscle of various fish species. Journal of Environmental Science and Health 40, 899–912.
Andresen, J.A.; Grundmann, A. & Bester, K. (2004): Organophosphorus flame retardants and plasticisers in surface waters, Sci. Total Environ. 332, 155–166.
Bates, R.L. & Jackson, J. A. (1980): Glossary of Geology. 751 p., Amer. Geol. Inst, Falls Church.
Chan, H.M.; Scheuhammer, A.M.; Ferran, A.; Loupelle, C.; Holloway, J. & Weech, S. (2003): Impacts of Mercury on Freshwater Fish-Eating Wildlife and Humans. Hu-man and Ecological Risk Assessment, 9(4): 867–883.
Close, B.; Banister, K.; Baumanns, V.; Bernoth, E.M.; Bromage, N.; Bunyan, J.; Erhardt, W.; Flecknell, P.; Gregory, N.; Hackbarth, H.; Morton, D. & Warwick, C. (1996): Recommendations for the Euthanasia of experimental animals: Part 1. Laboratory Animals 30, 293–316.
Close, B.; Banister, K.; Baumanns, V.; Bernoth, E.M.; Bromage, N.; Bunyan, J.; Erhardt, W.; Flecknell, P.; Gregory, N.; Hackbarth, H.; Morton, D. & Warwick, C. (1997): Recommendations for euthanasia of experimental animals: Part 2. Laboratory Animals 31, 1–32.
Dallinger, R. & Rainbow, P.S. (editors) (1993): Ecotoxicology of metals in invertebrates. Boca Raton (FL, U.S.A.): Lewis.
Dubreuil, A. (editor) (2005): Life-cycle assessment of metals: issues and research directions. Pensacola (FL, U.S.A.): Society of Environmental Toxicology and Chemistry (SETAC).
Dusek L.; Svobodova Z.; Janouskova D.; Vykusova B.; Jarkovsky J.; Smid R. & Pavlis P. (2005): Bioaccumulation of mercury in muscle tissue of fish in the Elbe River (Czech Republic): multispecies monitoring study 1991–1996. Ecotoxicology and Environmental Safety 61, 256–267.
Ec – European Commission (2003): Technical Guidance Document on Risk Assessment in support of Commission Directive 93/67/EEC on Risk Assessment for new notified substances Commission Regulation (EC) No 1488/94 on Risk Assessment for existing substances Directive 98/8/EC of the European Parliament and of the Council concerning the placing of biocidal products on the market. Part II. European Commission. Joint Research Center. Institute for Health and Consumer Protection. Brussels, Belgium.
Ec – European Commission (2004): EFSA provides risk assessment on mercury in fish: precautionary advice given to vulnerable groups. EFSA, European Food Safety Authority. Brussels, Belgium. http://www.efsa.europa.eu/EFSA/efsa_locale-1178620753812_1178620786349.htm (assessed June 2009).
Ec – European Commission (2006): Commission Regulation (EC) No 1881/2006 of 19 December 2006 setting maximum levels for certain contaminants in foodstuffs. European Commission. Brussels, Belgium.
Pollutants of Priority Concern in Austrian Rivers – LiteraturE
Umweltbundesamt REP-0253, Vienna, 2010 63
EC – EUROPEAN COMMISSION (2006): Opinion of the Scientific Panel on contaminants in the food chain [CONTAM] related to mercury and methylmercury in food. EFSA, European Food Safety Authority. Brussels, Belgium. http://www.efsa.europa.eu/EFSA/efsa_locale-1178620753812_1178620763245.htm (assessed June 2009).
Ec – EUROPEAN COMMISSION (2005): Common implementation strategy for the Water Framework Directive. Environmental Quality Standards (EQS). Substance Data Sheet. Priority Substance No. 2. Mercury and its Compounds. CAS-No. 7439-97-6. Final version. Brussels, 15 January 2005.
Ec – EUROPEAN COMMISSION (2008) Directive 2008/105/EC of the European Parliament and of the Council of 16 December 2008 on environmental quality standards in the field of water policy, amending and subsequently repealing Council Directives 82/176/EEC, 83/513/EEC, 84/156/EEC, 4/491/EEC, 86/280/EEC and amending Directive 2000/60/EC of the European Parliament and of the Council.
EC – EUROPEAN COMMISSION (2009): Mercury. http://ec.europa.eu/environment/chemicals/mercury/index.htm (assessed June 2009).
ECB – EUROPEAN CHEMICALS BUREAU (2009a): Mercury – Index number 080-001-00-0. Annex I to Directive 67/548/EEC on Classification and Labelling of Dangerous Substances, http://ecb.jrc.ec.europa.eu/classification-labelling/search-classlab/. 16.02.2009.
ECB – EUROPEAN CHEMICALS BUREAU (2009b): triethyl-phosphate – Index number 015-013-00-7. Annex I to Directive 67/548/EEC on Classification and Labelling of Dangerous Substances, http://ecb.jrc.ec.europa.eu/classification-labelling/search-classlab/. 16.02.2009.
ECB (2009c): tris(2-chloroethyl)-phosphate – Index number 015-102-00-0. Annex I to Di-rective 67/548/EEC on Classification and Labelling of Dangerous Substances, http://ecb.jrc.ec.europa.eu/classification-labelling/search-classlab/. 16.02.2009.
ECB – EUROPEAN CHEMICALS BUREAU (2009d): tributyl phosphate – Index number 015-014-00-2. Annex I to Directive 67/548/EEC on Classification and Labelling of Dangerous Substances, http://ecb.jrc.ec.europa.eu/classification-labelling/search-classlab/. 16.02.2009.
ECHA – EUROPEAN CHEMICALS AGENCY (2009): Proposals to identify Substances of Very High Concern: Annex XV reports for commenting by Interested Parties. http://echa.europa.eu/consultations/authorisation/svhc/svhc_cons_en.asp. 29.09.2009.
EISLER, R. (2006): Mercury hazards to living organisms. Boca Raton (FL, U.S.A.): CRC Press.
EISLER, R. (1987): Mercury hazards to fish, wildlife, and invertebrates: A synoptic review. US Laurel MD: Department of the Interior Fish and Wildlife Service,.Patuxent Wildlife Research Center. Biological Report 85(1.10).
Pollutants of Priority Concern in Austrian Rivers – LiteraturE
64 Umweltbundesamt REP-0253, Vienna, 2010
EVENSET, A.; LEKNES, H.; CHRISTENSEN, G.N.; WARNER, N.; REMBERGER, M. & GABRIELSEN, G.W. (2009): Screening of new contaminants in samples from the Norwegian Arc-tic. Silver, Platinum, Sucralose, Bisphenol A, Tetrabrombisphenol A, Siloxanes, Phtalates (DEHP), Phosphororganic flame retardants. Norwegian Pollution Con-trol Authority, SPFO-report: 1049/2009, TA-2510/2009, ISBN 978-82-449-0065-2, Akvaplan-niva.
EVERS, D.C. & CLAIR, T.A. (2005): Mercury in Northeastern North America: A synthesis of Existing Databases. Ecotoxicology 14: 7–14.
GOLUB, M.S. (editor) (2006): Metals, fertility and reproductive toxicity. Boca Raton (FL, U.S.A.): CRC Press.
GRABER, G.; GUNDACKER, C.; WITTMANN, K.J., KAMEL, S. & SINGER, B. (2008): Einflussfakto-ren der Quecksilber- und Selengehalte in Karpfen und Forellen aus österreichi-scher Aquakultur unter besonderer Berücksichtigung der spezifischen Fraßnahrungsketten. Schlussbericht Projekt 100214. Projektförderung: BMLFUW, BMGFJ.
GRILLITSCH, B. & SCHIESARI, L. (in press): Ecotoxicology of metals in reptiles. In: Sparling DW, Linder G, Bishop CA, editors. Ecotoxicology of amphibians and reptiles. Bo-ca Raton (FL, U.S.A.): SETAC Press.
GZÜV – GEWÄSSERZUSTANDSÜBERWACHUNGSVERORDNUNG (2009): Gewässerzustands-überwachungsverordnungs Datenbank (Austrian Water Quality database).
HÅKANSON, L. (2007): Lake Environments. In: Perry, C. & Taylor, K. (eds.), Environmental Sedimentology, 109–143, 441 p., Blackwell, Oxford.
HARRIS, R.; KIDD, K. & JAMIE SHANLEY, J. (2008): Bridging the knowledge gaps on the sources, speciation, fate and bioaccumulation of mercury in aquatic and terrestrial environments. Editorial. Environmental Pollution 154: 1–2.
HARRIS, R.; MASON, R.; KRABBENHOFT, D.P.; MICHAEL W.; MURRAY, M.W.; REASH, R. &
SALTAMANN, T. (editors) (2007): Mercury effects in aquatic and terrestrial environ-ments. CRC Press, Boca Raton, Florida, U.S.A.
HILLENBRAND, T.; MARSCHEIDER-WEIDEMANN, F.; STRAUCH, M.; HEITMANN, K. & SCHAFFRIN, D. (2007): Emissionsminderung für prioritäre und prioritäre gefährliche Stoffe der Wasserrahmenrichtlinie – Stoffdatenblätter. Forschungsbericht 203 21 280; UBA-FB 001011. Texte 29/07.
HOUSERVOVA, P.; KUBAN, V.; SPURNY, P. & HABARTA, P. (2006): Determination of total mer-cury and mercury species in fish and aquatic ecosystems of Moravia rivers. Veterinarni Medicina 51, 101–110.
JUNGWIRTH, M. & WOHLSCHLAGER, N. (1995): Fischökologische Untersuchung der Ager. Studie im Auftrag der Lenzing AG. Forschungsbericht, Expertengutachten (exter-ne Auftraggeber). https://forschung.boku.ac.at/fis.
KAWAGOSHI, Y.; NAKAMURA, S. & FUKUNAGA, I. (2002): Degradation of organophosphoric esters in leachate from a sea-based solid waste disposal site, Chemosphere 48: 219–225.
KNEPPER, T.P.; SACHER, F.; LANGE, F.T.; BRAUCH, H.J.; KARRENBROCK, F.; ROERDEN, O, &
LINDNER, K. (1999): Detection of polar organic substances relevant for drinking water. Waste Management 19: 77–99.
Pollutants of Priority Concern in Austrian Rivers – LiteraturE
Umweltbundesamt REP-0253, Vienna, 2010 65
KRALIK, M. (2005): B/ 2 Karst und Kluftgrundwasser. In: WWK/UBA – Wasserwirtschafts-kataster/Umweltbundesamt) (Hrg.): Wassergüte in Österreich – Jahresbericht 2004, 74–95, Bundesministerium für Land- und Forstwirtschaft, Umwelt und Wasserwirtschaft, 198 S., Wien. (http://www.umweltbundesamt.at /Wasser/Jahresbericht 2004).
KRALIK, M. & SAGER, M. (1987a): Schwermetalle in Donau- und Donaukanalsedimenten in und östlich von Wien – Eine Vorstudie [Heavy Metals in Danube and Danube-Channel Sediments in and East of Vienna]. Österr. Wasserwirtschaft 38: 8–14.
KRALIK, M. & SAGER, M. (1987b): Umweltindikator "Schwermetalle": Gesamtgehalte und Mobilität in österreichischen Donausedimenten [Environmental Indicator „Heavy Metals“: Total Composition and Mobility in Austrian Danube Sediments]. Mitt. Österr. Geol. Ges. 79: 77–90.
KRALIK, M. & AUGUSTIN–GYURITS, K. (1993): Feinsedimente aus dem Donaustauraum Aschach als Schad- oder Rohstoff [Fine-grained Sediments in the Danube-Reservoir Aschach: Waste or it’s Application as Raw Material]. In: Deutsch. Verb. Wasserwirt. u. Kulturbau e.V. (DVWK) (Hrsg.): Verlandung von Flußstauhaltun-gen [Sedimentation in River Reservoirs]: Morphologie, Bewirtschaftung, Umwelt-aspekte und Fallbeispiele. 300 S. (221–254), P. Parey Verl., Hamburg.
KRALIK, M. & AUGUSTIN–GYURITS, K. (1994a): Stauraumsedimente als "Geochronometer" von Schad- oder Rohstoffen: Moderne Sedimentologie, Mineralogie, Geochemie und Verwertung der Donausedimente von Aschach (Oberösterreich). In: Lobitzer, H. et al. (Hrsg.): Jubiläumsschrift 20 Jahre Geologische Zusammenarbeit Öster-reich – Ungarn, Teil 2, 437–464, Geol. Bundesanst. Wien.
KRALIK, M. & AUGUSTIN-GYURITS, K. (1994b): Umweltgeochemische Untersuchung der Bach- und Flußsedimente Niederösterreichs auf Haupt- und Spurenelemente zur Erfassung und Beurteilung geogener oder anthropogener Schadstoffbelastungen. – Unveröffentl. Bericht Österr. Forschungs- Prüfzentrum (ÖFPZ) Arsenal, Bund/Bundesländer-Projekt N-U-015/91, Bibl. d. Geol.BA./Wiss. Archiv, Wien 1994 http://www.geologie.ac.at/meta/start.htm.
KRALIK, M., MIESBAUER, H., HUMER, F. & OBERNDORFER, H. (in preparation): A New Simple Suspended-Load Sampler: Continuous Particulate Matter Collection from Rivers with Low and High Suspended Matter Load.
KRIECHBAUM, C. & MOOG, O. (1995): Auswirkungen der Abwassereinleitungen der Kläran-lage Baden auf die Schwechat – Biologische Gewässergütebeurteilung. Gutach-ten im Auftrag der Abteilung Siedlungswasserbau, BOKU Forschungsbericht, Ex-pertengutachten (externe Auftraggeber). https://forschung.boku.ac.at/fis.
KRUSE, R.; BEHRENS, S.; SOMMERFELD, C.& BARTELT, E. (2008): Klimawandel bedingte Aufnahme von toxischem Methylquecksilber über den Fischkonsum Forschungs-kennzahl 08 49 745. Niedersächsisches Landesamt für Verbraucherschutz und Lebensmittelsicherheit Institut für Fische und Fischereierzeugnisse, Cuxhaven. Bundesinstitut für Risikobewertung, Berlin. Im Auftrag des Bundesinstituts für Ri-sikobewertung. Endbericht.
KRUZIKOVA, K.; SVOBADOVA, Z.; VALENTOVA, O.; RANDAK, T. & VELISEK, J. (2008): Mercury and methylmercury in muscle tissue of chub from the Elbe River main tributaries. Czech J. Food Sci. 26, 65–70.
Pollutants of Priority Concern in Austrian Rivers – LiteraturE
66 Umweltbundesamt REP-0253, Vienna, 2010
LINDER, G & GRILLITSCH, B. (2000): Ecotoxicology of metals. In: Sparling DW, Linder G, Bishop CA, editors. Ecotoxicology of amphibians and reptiles. Boca Raton (FL, U.S.A.): SETAC Press. p 325–459.
MANCE, G. (1987): Pollution threat of heavy metals in aquatic environments. London (Great Britain): Elsevier.
MARKLUND, A.; ANDERSSON, B. & HAGLUND, P. (2005): Organophosphorus Flame Retar-dants and Plasticizers in Swedish Sewage Treatment Plants. Environ. Sci. Tech-nol. 39, 7423.
MARTINEZ-CARBALLO, E.; GONZALEZ-BARREIRO, C.; SITKA, A.; SCHARF, S.; GANS, O. (2007): Determination of selected organophosphate esters in the aquatic environment of Austria, Sci. Total Environ. 388, 290–299.
MEYER, J. & BESTER, K. (2004): Organophosphate flame retardants and plasticisers in wastewater treatment plants, J. Environ. Mon. 6, 599.
MOOG, O.; SOMMERHÄUSER, M.; ROBERT, S.; BATTISTI, T.; BIRK, S.; HERING, D.; OFENBÖCK, T.; SCHMEDTJE, U.; SCHMIDT-KLOIBER, A. & VOGEL, B. (2006): Typology of the Da-nube River based on top-down and bottom-up approaches. In: Austrian Commit-tee Danube Research / IAD, Wien (Editor): Proceedings 36th International Confe-rence of IAD, 2006. IAD, Wien: 260–264.
NATURVARDSVERKET (2009): Results from the Swedish Screening Programme 2006/2007–2008. What concentrations of hazardous substances do we find in the environment? Rapport 6301. Stockholm, Sweden.
NORDBERG, G.; FOWLER, B.; NORDBERG, M. & FRIBERG, L. (eds) (2007): Handbook on the toxicology of metals. 3rd Revised edition. San Diego (CA, U.S.A.): Academic Press/Elsevier.
OKOUCHI, S. & SASAKI, S. (1985). The 1-Octanol/Water Partitioning Coefficient of Mercury. Bull. Chem. Soc. Jpn. 38; 3401–3402.
PAQUIN, P.R.; FARLEY, K.; SANTORE, R.C.; KAVVADAS, C.D.; MOONEY, K.G.; WINFIELD, R.P.; WU, K.-B. & DI TORO, D.M. (eds) (2003): Metals in aquatic systems: a review of exposure, bioaccumulation, and toxicity models. Pensacola (FL, U.S.A.): Society of Environmental Toxicology and Chemistry (SETAC).
REEMTSMA, T.; QUINTANA, J.B.; RODIL, R.; GARCÍA-LÓPEZ, M. & RODRÍGUEZ, I. (2008): Orga-nophosphorus flame retardants and plasticizers in water and air: I. Occurrence and fate. Trend in Analytical Chemistry 27(9), 727–737.
RODIL, R.; QUINTANA, J.B. & REEMTSMA, T. (2005): Liquid Chromatography-Tandem Mass Spectrometry Determination of Non-Ionic Organophosphorus Flame Retardants and Plasticizers in Wastewater Samples, Anal. Chem. 77, 3083–3089.
ROSE, C. W. (2004): An introduction of the Environmental Physics of Soil, Water and Wa-tersheds. 441 p., Cambridge University Press.
SALMINEN, R. (2005): Geochemical Atlas of Europe. (http://www.gtk.fi/publ/foregsatlas/index.php 12.10.2009).
SCHISTERMAN, E.F.; VEXLER, A.; WHITCOMB, B.W. & LIU, A. (2006): The limitations due to exposure detection limits for regression models. American Journal of Epidemiolo-gy 163, 374–383.
Pollutants of Priority Concern in Austrian Rivers – LiteraturE
Umweltbundesamt REP-0253, Vienna, 2010 67
Schmedtje, U.; Bachmann, J.; Behrendt, H.; Birk, S.; Biza, P.; D'Eugenio, J.; Gils, J.; Grath, J.; Hamchevici, C.; Hansen, W.; Interwies, E.; Kampa, E.; Lindinger, H.; Liska, I.; Popescu, L.; Popovici, M.; Pottgiesser, T.; Sigmund, G.; Sommerhäuser, M.; Speck, S.; Stubauer, I.; Vogel, B.; Weller, P.; Winkelmann-Oei, G. & Zinke, A. (2005): Danube Basin Analysis (WFD Roof Report 2004). The Danube River Ba-sin District – River basin characteristics, impacts of human activities and econom-ic analysis required under Article 5, Annex II and Annex III, and inventory of pro-tected areas required under Article 6, Annex IV of the EU Water Framework Di-rective (2000/60/EC) – Part A – Basin-wide overview. ICPDR, Vienna: 191 pp.
SCHRECK, C.B. & MOYLE, P.B. (1990): Methods for fish biology. American Fisheries Socie-ty, Bethesda, Maryland, U.S.A.
SCHWARZENBACH, R.; GSCHWEND, P. & IMBODEN, D. (1993): Environmental Organic Che-mistry. John Wiley & Sons, Inc. New York, Chichester, Brisbane, Toronto, Singa-pore. ISBN 0-471-83941-8.
SCUDDER, B.C.; CHASAR, L.C.; WENTZ, D.A.; BAUCH, N.J.; BRIGHAM, M.E.; MORAN, P.W. &
KRABBENHOFT, D.P. (2009): Mercury in fish, bed sediment, and water from streams across the United States, 1998–2005: U.S. Geological Survey Scientific Investigations Report 2009–5109.
SIEGEL, F.R. (2002): Environmental geochemistry of potentially toxic metals. Berlin (Ger-many): Springer.
SLOOFF, W.; VAN BEELEN, P.; ANNE, J.A. & JANUS, J.A. (1995): Integrated Criteria Docu-ment Mercury, Bilthoven (NL), National Institute of Public Health and Environ-mental Protection (report for DG Environment). RIVM. No. 601014.
SORENSEN, E.M. (1991): Metal poisoning in fish. Boca Raton (FL, U.S.A.): CRC Press.
SVOBODOVA, Z.; DUSEK, L.; HEJTMANEK,M.; VYKUSOVA, B. & SMID, R. (1999): Bioaccumula-tion of mercury in various fish species from Orlik and Kamyk water reservoirs in the Czech Republic. Ecotoxicology and Environmental Safety 43, 231–240.
UK EA – UNITED KINGDOM ENVRONMENT AGENCY (2009): Mercury and its compounds. http://www.environment-agency.gov.uk/business/topics/pollution/183.aspx. 16.02.2009.
UNEP – UNITED NATIONS ENVIRONMENT PROGRAMME (2002): Global Mercury Assessment. Published by UNEP Chemicals. Geneva Switzerland. http://www.chem.unep.ch/mercury/report/Final%20report/final-assessment-report-25nov02.pdf.
US EPA – UNITED STATES ENVIRONMENTAL PROTECTION AGENCY (2000): Guidance for As-sessing Chemical Contaminant Data for Use in Fish Advisories. Volume 1: Fish Sampling and Analysis. Third Edition. United States Environmental Protection Agency, Office of Science and Technology, Office of Water. Washington, DC., U.S.A.
VALLANT, B.; KADNAR, R. & GOESSLER, W. (2007): "Development of a new HPLC method for the determination of inorganic and methylmercury in biological samples with ICP-MS detection". Journal of Analytical Atomic Spectrometry, Vol. 22, Pp. 322–325.
Pollutants of Priority Concern in Austrian Rivers – LiteraturE
68 Umweltbundesamt REP-0253, Vienna, 2010
VERBRUGGEN, E.M.J.; RILA, J.P.; TRAAS, T.P.; POSTHUMA-DOODEMAN, C.J.A.M. &
POSTHUMUS, R. (2005): Environmental Risk Limits for several phosphate esters, with possible application as flame retardant. National Institute for Public Health and the Environment, Bilthoven, the Netherlands.RIVM report 601501024/2005.
WAGNER, F. & DEUTSCH, K. (2008): GZÜV – Oberflächengewässer (Gewässerzustands-überwachungsverordnung). Bericht über das Überwachungsprogramm für die Oberflächengewässer in Österreich nach den Vorgaben der EU-Wasserrahmenrichtlinie und des Österreichischen Wasserrechtsgesetzes. Bun-desministerium für Land- und Forstwirtschaft, Umwelt und Wasserwirtschaft – Sektion VII, Wien, Austria. http://wasser.lebensministerium.at/article/articleview/68761/1/5659/
Weisbrod, A.V.; Burkhard, L.P.; Arnot, J.; Mekenyan, O.; Howard, P.H.; Russom, C.; Boethling, R.; Sakuratani, Y.; Traas, T.; Bridges, T.; Lutz, C.; Bonnell, M.; Wood-burn, K.; Parkerton, T. (2007): Workgroup report: review of fish bioaccumulation databases used to identify persistent, bioaccumulative, toxic substances. Envi-ronmental Health Perspectives 15: 255–261.
WHITE, S. (2008): Sediment Dynamics and their influence on the Design of Monitoring Programmes. IN: Quevauviller, P. et al. (eds.): The Water Framework directive: ecological and chemical status monitoring. 243–253, J. Wiley.
WHO – WORLD HEALTH ORGANIZATION (2008): Guidance for Identifying Populations at Risk from Mercury Exposure. UNEP DTIE Chemicals Branch and WHO Department of Food Safety, Zoonoses and Foodborne Diseases Geneva, Switzerland. http://www.who.int/foodsafety/publications/chem/mercury/en/
WHO – WORLD HEALTH ORGANIZATION (1998): Flame retardants: tris(chloropropyl)-phosphate and tris(2-chloroethyl)phosphate. Environmental Health Criteria 209. WHO, Geneva, Switzerland.
WHO – WORLD HEALTH ORGANIZATION (2000): Flame retardants: tris(2-butoxyethyl)phosphate, tris(2-ethylhexyl)phosphate, and tetrakis(hydroxymethyl)-phosphonium salts. Environmental Health Criteria 218. WHO, Geneva, Switzer-land.
WIENER, J.G.; KRABBENHOFT, D.P.; HEINZ, G.H. & SCHEUHAMMER, A.M. (2003): Ecotoxicol-ogy of mercury, Chapter 16 in Hoffman, D.J., Rattner, B.A., Burton, G.A. Jr., Cairns, J. Jr., Editors. Handbook of Ecotoxicology, 2nd edition. Boca Raton, Flor-ida, CRC Press, pp. 409–463.
WOLFE, M.F.; SCHWARZBACH, S. & SULAIMAN, R.A. (1998): Effects of mercury on wildlife: a comprehensive review. Environ Toxicol Chem 17:146–160.
Pollutants of Priority Concern in Austrian Rivers – Annexes
Umweltbundesamt REP-0253, Vienna, 2010 69
6 ANNEXES
Annex 1: Water, suspended sediment and bottom sediment samples in the river Schwechat at the Brauhaus-Str./Schwechat, Lower Austria
Annex 2: Water, suspended sediment and bottom sediment samples in the river Ager at the Raudaschlmühle/Schörfling at Attersee, Upper Austria
Annex 3: Water, suspended sediment and bottom sediment samples in the river Ager at the Scheiblmühle/Timelkam, Upper Austria
Pollutants of Priority Concern in Austrian Rivers – Annexes
70 Umweltbundsamt REP-0253, Vienna, 2010
Ann
ex 1
: W
ater
, sus
pend
ed s
edim
ent a
nd b
otto
m s
edim
ent s
ampl
es in
the
river
Sch
wec
hat a
t the
Bra
uhau
s-St
r./
Schw
echa
t, Lo
wer
Aus
tria
Sam
ple
No.
R
iver
Lo
ngitu
de
Latit
ude
Dat
e Ti
me
Air-
tem
pera
-tu
re
Wat
er-
tem
pera
ture
El
ectri
c co
n-du
ctiv
ity
pH
Dis
solv
ed
oxyg
en
Com
men
ts
Lo
calit
y (°
WG
S84)
(°
WG
S84)
(d
d.m
m.y
yyy)
(h
h:m
m)
(° C
) (°
C)
(µS/
cm 2
5°C)
(mg/
l)
W 0
708
3840
Sc
hwec
hat
16
°31‘
46‘‘
48°0
8‘38
‘‘ 30
.08.
2007
09
:45
15.8
17
.7
710
7.63
-
Wat
er s
ampl
e
W 0
711
5610
Sc
hwec
hat
16°3
1‘46
‘‘ 48
°08‘
38‘‘
23.1
1.20
07
81
8 9.
10
11.5
W
ater
sam
ple
W 0
708
3841
Sc
hwec
hat w
est
16°3
1‘46
‘‘ 48
°08‘
38‘‘
20.0
8.20
07
17:0
0
Susp
ende
d se
dim
ent 2
2.8
mg/
L
W 0
708
3841
Sc
hwec
hat e
ast
16°3
1‘46
‘‘ 48
°08‘
38‘‘
30.0
8.20
07
10:3
0
17.7
71
0 7.
63
- Su
spen
ded
sedi
men
t 31.
8 m
g/L
W 0
708
3842
Sc
hwec
hat c
entre
16
°31‘
46‘‘
48°0
8‘38
‘‘ 30
.08.
2007
10
:30
17
.7
710
7.63
-
Susp
ende
d se
dim
ent 2
8.0
mg/
L
W 0
708
3843
Sc
hwec
hat w
est
16°3
1‘46
‘‘ 48
°08‘
38‘‘
30.0
8.20
07
10:3
0
17.7
71
0 7.
63
- Su
spen
ded
sedi
men
t 27.
0 m
g/L
W 0
711
5611
Sc
hwec
hat e
ast
16°3
1‘46
‘‘ 48
°08‘
38‘‘
23.1
1.20
07
81
8 9.
1 11
.5
Susp
ende
d se
dim
ent 3
.9 m
g/L
W 0
711
5612
Sc
hwec
hat c
entre
16
°31‘
46‘‘
48°0
8‘38
‘‘ 23
.11.
2007
818
9.1
11.5
Su
spen
ded
sedi
men
t 8.0
mg/
L
W 0
711
5613
Sc
hwec
hat w
est
16°3
1‘46
‘‘ 48
°08‘
38‘‘
23.1
1.20
07
81
8 9.
1 11
.5
Susp
ende
d se
dim
ent 7
.1 m
g/L
S 07
09 4
011
Schw
echa
t cen
tre
16°3
1‘46
‘‘ 48
°08‘
38‘‘
20.-2
2.08
.200
7 24
.08.
2007
ca
. 200
g d
ry w
t. ye
llow
ish-
brow
n su
sp. s
edim
ent
S 07
11 5
614
Schw
echa
t cen
tre
16°3
1‘46
‘‘ 48
°08‘
38‘‘
14.-2
3.11
.200
7
ca
. 12
g dr
y w
t. s
usp.
sed
imen
t
S 07
08 3
844
Sc
hwec
hat (
W-b
ank)
16
°31‘
46‘‘
48°0
8‘38
‘‘ 30
.08.
2007
12
:00
ca
. 250
g d
ry w
t. d
ark-
grey
to m
ediu
m
brow
nish
silty
fine
-sed
imen
t. Pa
rtly
cove
red
by a
lge-
mat
s.
S 07
11 5
609
Schw
echa
t (W
-ban
k)
16°3
1‘46
‘‘ 48
°08‘
38‘‘
23.1
1.20
07
ca. 5
00 g
dry
wt.
sedi
men
t
Offi
cial
gou
ge (c
a. 0
.5 k
m b
elow
): S
chw
echa
t (H
alle
nbad
; No.
208
157)
km
10.
63km
, Alti
tude
: 154
.59
m; R
echa
rge
area
: 102
8.9
km2
Pollutants of Priority Concern in Austrian Rivers – Annexes
Umweltbundsamt REP-0253, Vienna, 2010 71
Ann
ex 2
: W
ater
, sus
pend
ed s
edim
ent a
nd b
otto
m s
edim
ent s
ampl
es in
the
river
Age
r at t
he R
auda
schl
müh
le/
Schö
rflin
g at
Atte
rsee
, Upp
er A
ustr
ia
Sam
ple
No.
R
iver
Lo
ngitu
de
Latit
ude
Dat
e Ti
me
Air-
tem
pera
-tu
re
Wat
er-
tem
pera
ture
El
ectr
ic c
on-
duct
ivity
pH
D
isso
lved
ox
ygen
C
omm
ents
Lo
calit
y (°
WG
S84)
(°
WG
S84)
(d
d.m
m.y
yyy)
(h
h:m
m)
(° C
) (°
C)
(µS/
cm 2
5°C
)
(mg/
l)
W 0
709
4771
Ag
er R
auda
schl
müh
le
(just
abo
ve th
e ba
rrier
) 13
°36’
29’’
47°5
7’07
’’ 26
.09.
2007
13
:30
13.4
15
.7
255
8.27
-
Wat
er s
ampl
e
W 0
711
5641
Ag
er
13°3
6’29
’’ 47
°57’
07’’
28.1
1.20
07
27
5 8.
15
11.3
W
ater
sam
ple
W 0
711
5638
Ag
er ri
ght
13°3
6’29
’’ 47
°57’
07’’
28.1
1.20
07
27
5 8.
15
11.3
Su
spen
ded
sedi
men
t 0.0
8 m
g/L
W 0
711
5639
Ag
er c
ente
r 13
°36’
29’’
47°5
7’07
’’ 28
.11.
2007
275
8.15
11
.3
Susp
ende
d se
dim
ent 0
.06
mg/
L
W 0
711
5640
Ag
er le
ft 13
°36’
29’’
47°5
7’07
’’ 28
.11.
2007
275
8.15
11
.3
Susp
ende
d se
dim
ent 0
.06
mg/
L
S 07
09 4
013
Ager
sou
th
13°3
6’29
’’ 47
°57’
07’’
27.0
7.-
22.0
8.20
07
ca. 1
.2 g
dry
wt.
su
sp. s
edim
ent =
ø 0
.21
mg/
L
S 08
02 0
395
Ager
sou
th
13°3
6’29
’’ 47
°57’
07’’
26.0
9.-
21.1
2.20
07
ca. 1
.5 g
dry
wt.
su
sp. s
edim
ent=
ø 0
.04
mg/
L
W 0
709
4769
Ag
er R
auda
schl
müh
le (N
-ba
nk 5
0 m
abo
ve b
uild
ing
with
ele
ctric
gen
erat
ors)
13
°36’
27’’
47°5
7’06
’’ 26
.09.
2007
14
:45
ca. 5
00 g
dry
wt.
grey
ish-
whi
te s
ilty
sedi
-m
ent (
calc
ite p
reci
pita
tion?
); pa
rtly
low
er
laye
rs d
ark.
100
m a
bove
dep
ositi
on a
rea
for w
oode
n lo
gs
B 07
11 5
637
Ager
(N-b
ank
abov
e R
auda
schl
müh
lem
ühle
) 13
°36’
27’’
47°5
7’06
’’ 28
.11.
2007
ca
. 200
g d
ry w
t. se
dim
ent
Offi
cial
gou
ge (c
a. 0
.3 k
m b
elow
): A
ger (
Rau
dasc
hl S
äge
No.
205
369)
km
33.
53km
, Alti
tude
: 466
.31
m; R
echa
rge
area
: 462
.9 k
m2
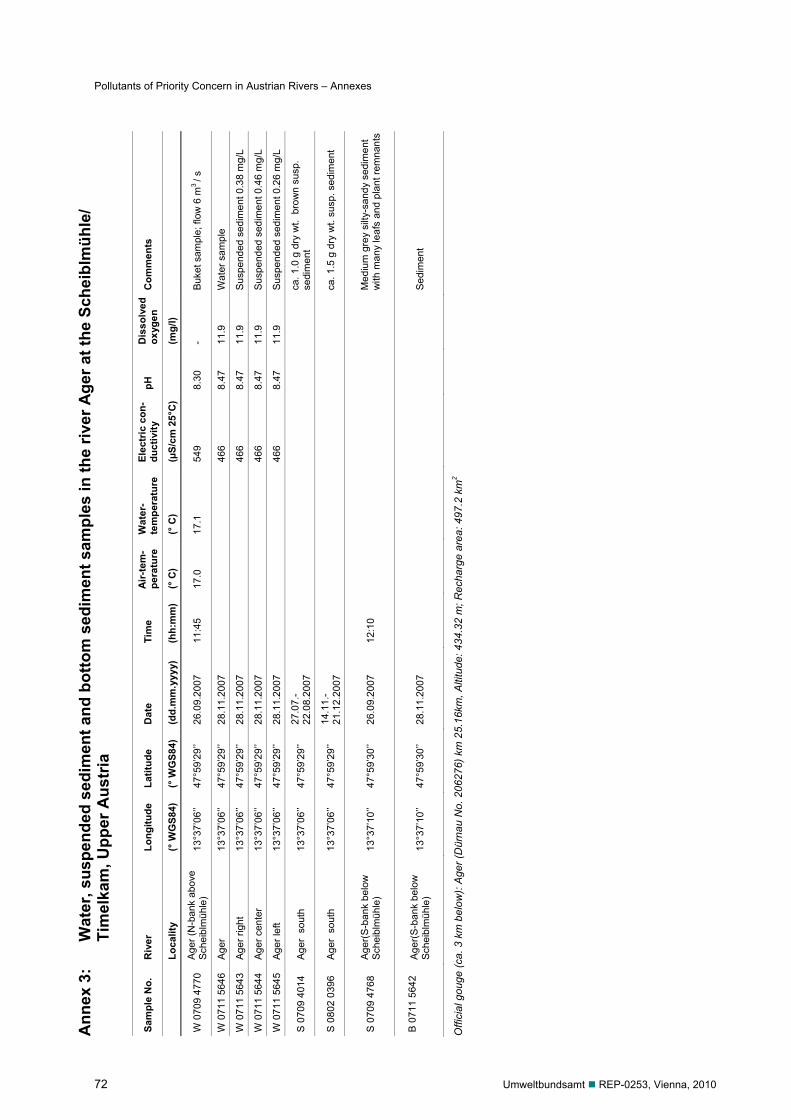
Pollutants of Priority Concern in Austrian Rivers – Annexes
72 Umweltbundsamt REP-0253, Vienna, 2010
Ann
ex 3
: W
ater
, sus
pend
ed s
edim
ent a
nd b
otto
m s
edim
ent s
ampl
es in
the
river
Age
r at t
he S
chei
blm
ühle
/ Ti
mel
kam
, Upp
er A
ustr
ia
Sam
ple
No.
R
iver
Lo
ngitu
de
Latit
ude
Dat
e Ti
me
Air-
tem
-pe
ratu
re
Wat
er-
tem
pera
ture
El
ectr
ic c
on-
duct
ivity
pH
D
isso
lved
ox
ygen
C
omm
ents
Lo
calit
y (°
WG
S84)
(°
WG
S84)
(d
d.m
m.y
yyy)
(h
h:m
m)
(° C
) (°
C)
(µS/
cm 2
5°C
)
(mg/
l)
W 0
709
4770
Ag
er (N
-ban
k ab
ove
Sche
iblm
ühle
) 13
°37’
06’’
47°5
9’29
’’ 26
.09.
2007
11
:45
17.0
17
.1
549
8.30
-
Buke
t sam
ple;
flow
6 m
3 / s
W 0
711
5646
Ag
er
13°3
7’06
’’ 47
°59’
29’’
28.1
1.20
07
46
6 8.
47
11.9
W
ater
sam
ple
W 0
711
5643
Ag
er ri
ght
13°3
7’06
’’ 47
°59’
29’’
28.1
1.20
07
46
6 8.
47
11.9
Su
spen
ded
sedi
men
t 0.3
8 m
g/L
W 0
711
5644
Ag
er c
ente
r 13
°37’
06’’
47°5
9’29
’’ 28
.11.
2007
466
8.47
11
.9
Susp
ende
d se
dim
ent 0
.46
mg/
L
W 0
711
5645
Ag
er le
ft 13
°37’
06’’
47°5
9’29
’’ 28
.11.
2007
466
8.47
11
.9
Susp
ende
d se
dim
ent 0
.26
mg/
L
S 07
09 4
014
Ager
sou
th
13°3
7’06
’’ 47
°59’
29’’
27.0
7.-
22.0
8.20
07
ca. 1
.0 g
dry
wt.
bro
wn
susp
. se
dim
ent
S 08
02 0
396
Ager
sou
th
13°3
7’06
’’ 47
°59’
29’’
14.1
1.-
21.1
2.20
07
ca. 1
.5 g
dry
wt.
susp
. sed
imen
t
S 07
09 4
768
Ager
(S-b
ank
belo
w
Sche
iblm
ühle
) 13
°37’
10’’
47°5
9’30
’’ 26
.09.
2007
12
:10
M
ediu
m g
rey
silty
-san
dy s
edim
ent
with
man
y le
afs
and
plan
t rem
nant
s
B 07
11 5
642
Ag
er(S
-ban
k be
low
Sc
heib
lmüh
le)
13°3
7’10
’’ 47
°59’
30’’
28.1
1.20
07
Sedi
men
t
Offi
cial
gou
ge (c
a. 3
km
bel
ow):
Age
r (D
ürna
u N
o. 2
0627
6) k
m 2
5.16
km, A
ltitu
de: 4
34.3
2 m
; Rec
harg
e ar
ea: 4
97.2
km
2

In this report by Umweltbundesamt (Environment Agency Austria) theoccurrence of total mercury and methylmercury as well as trisphospha-tes has been investigated in three different compartments in the aqua-tic environment: surface waters, sediments, suspended solids andbiota. Besides methylmercury, all compounds were detected in all inve-stigated matrices. Methylmercury occurred only in biota. Mercury wasfound to strongly bioaccumulate in biota and trisphosphates adsorbedpredominantly to suspended matter.
Comparing the observed mercury levels in water as well as in biota,almost all measured concentrations were higher than the respectiveenvironmental quality standards (EQS). As the evaluation is based onfew samples – whereas the EQS refer to annual average values basedon monthly sampling – further measurements are required.
ISBN 978-3-99004-054-6
Umweltbundesamt GmbHSpittelauer Lände 51090 Wien/Österreich
Tel.: +43-(o)1-313 04Fax: +43-(o)1-313 04/4500