pollutants - non-target screening approaches using ... · pollutants - non-target screening...
42
Christian Zwiener, Sylvain Merel Environmental Analytical Chemistry From accurate mass to identified water pollutants - non-target screening approaches using accurate mass, statistical analysis and compound libraries Geosciences / Environmental Analytical Chemistry E C Environmental Analytical Chemistry
Transcript of pollutants - non-target screening approaches using ... · pollutants - non-target screening...

Christian Zwiener, Sylvain Merel
Environmental Analytical Chemistry
From accurate mass to identified water
pollutants - non-target screening approaches
using accurate mass, statistical analysis and
compound libraries
Geosciences / Environmental Analytical Chemistry
E CEnvironmental
Analytical Chemistry

Outline
Introduction
Water pollutants
LC/MS screening approaches
Definitions
Harmonization of workflows
LC/MS methods and data interpretation
Application examples from the river Rhine and its tributaries
Conclusions and recommendations

Monitoring and measures to reduce contaminants and their
transformation products are needed!
Source: Helmholtz Centre for Environmental Reasearch-UFZ
Pesticides
Pharmaceuticals,
Personal care
products
Herbicides
TPs and metabolites
• Water is the prerequisite for all life
• Anthropogenic activities affect water quality
Water pollutants

Micropollutants from WWTP effluents
• PPCPs enter rivers via WWTP effluents (Benzotriazoles, PFCs, Diclofenac…)
polar POPs (PPOPs)
• Effects on aquatic ecosystems (fish: diclofenac, estrogens, neuroactive cpds.)
• WFD: improve ecological and chemical status
- eco-friendly“ chemicals
- Advanced WWT processes

Screening approaches
Target
knowns
Suspect screening
known unknowns
Nontarget screening
unknowns
• Standards
• Quantitation
• LowRes MS
• HiRes MS
• Generic methods
• Suspect list of
compounds
• HiRes MS
• Generic methods
• Data reduction
• Library search
• In-silico methods
TQ-MS HiRes MS (Q-TOF, FTICR, ...)
Screening

Nontarget screening
Nontarget screening
unknowns
• HiRes MS
• Generic methods
• Data reduction
• Library search
• In-silico methods
HiRes MS (Q-TOF, FTICR, ...)
Target Non-target
Science 291, 5007 (2001) 1221-1224

Agilent Technol. 2014; Zedda and Zwiener, Anal. Bioanal. Chem. 2012
Non-target screening
Separate and Detect
Feature Finding
Data AnalysisCompound
Identification
MH Qual or ProFinder
MP or MPP
ID Browser
(Q-TOF only)
Separate and
detect
Find peaks and
quantitate
Comparative or
multivariate
analysis
Identify
peaks

Devices: Measurement mode: Full-scan
Liquid chromatography
1260 Infinity System
(Agilent Technologies)
High-resolution mass spectrometry
6550 iFunnel Q-TOF
(Agilent Technologies)
• Electrospray-ionization (ESI)
• All ions within a defined range
(e.g. 100-1000 Da) are measured
Measurement

Generic methods
Norman Association – NTS trial
Schymanski et al. (28 authors):
Non-target screening with high resolution mass spectrometry: Critical
review using a collaborative trial on water analysis.
Anal.Bioanal. Chem. (in press)
Waterchemical Society (GDCh) – Expert group on Non-target Screening
Large volume injection (100 µL)

Column
Dim. (mm);
Particle size (µm) Solvents
Flowrate
(ml/min); Time
Agilent Poreshell HPH C18 2.1 x 150; 2.7
H2O/MeOH (FA
pos only) 0.3; 35 min
Agilent Zorbax Eclipse Plus C18 2.1 x 150; 3.5 H2O/ACN (FA) 0.3 ; 37 min
Agilent Zorbax Extend C18 2.1 x 50; 1.8 H2O/ACN (FA) 0.5 ; 46 min
Phenomenex Kinetex C18 3.0 x 100; 2.6 H2O/MeOH (FA) 0.2 ; 41 min
Thermo Hypersil Gold 2.1 x 100; 3.0 H2O/MeOH (FA) 0.2 ; 35 min
Waters Acquity UPLC BEH C18 2.1 x 100; 1.7 H2O/MeOH (FA) 0.3 ; 18 min
Waters Atlantis HSS T3 2.1 x 150; 3.5 H2O/MeOH (FA) 0.2 ; 19 min
Waters C18 BEH 2.1 x 100; 1.7
H2O/MeOH
(NH4FA, pH 5) 0.45; 13 min
LC conditions
Schymanski et al. Anal. Bioanal.Chem. 2015 (in press)
MS conditions
Parameters Set points
Scan range 100 to 1200 / 1700
Mass resolving power 20,000 to 50,000 / 100,000
Ionization Electrospray
Fragmentation CID, HCD
How much resolving power do we need?
How much mass accuracy?

Nontarget approach
Screening without
Preliminary information
LC-HRMS
Molecular formulae
Chemical structures
Marshall A., PENAS 2008
Two independent physical properties of ions:
- Exact mass of a monoisotopic ion
- Relative isotopic abundances (RIA; M+1, M+2)

Brenton & Godfrey, JASMS 2010
Accurate mass measurement
Accuracy: The proximity of the experimental
measurement to the true value (exact mass).
Precision: The repeatability of measurements
reflecting random errors.

Brenton & Godfrey, JASMS 2010; Blom, Anal. Chem. 2001
Accurate mass measurement
𝝈𝒑𝒑𝒎 =𝟏𝟎𝟔
𝑪∙𝑹∙ 𝑺
Ion statistics
Statistical
error
Instrument
constant
Resolution Number of
ions sampled
Factors for mass accuracy
- Tuning of mass axis
- Fine tuning
- Lock mass correction
- Ion statistics
- Chemical background
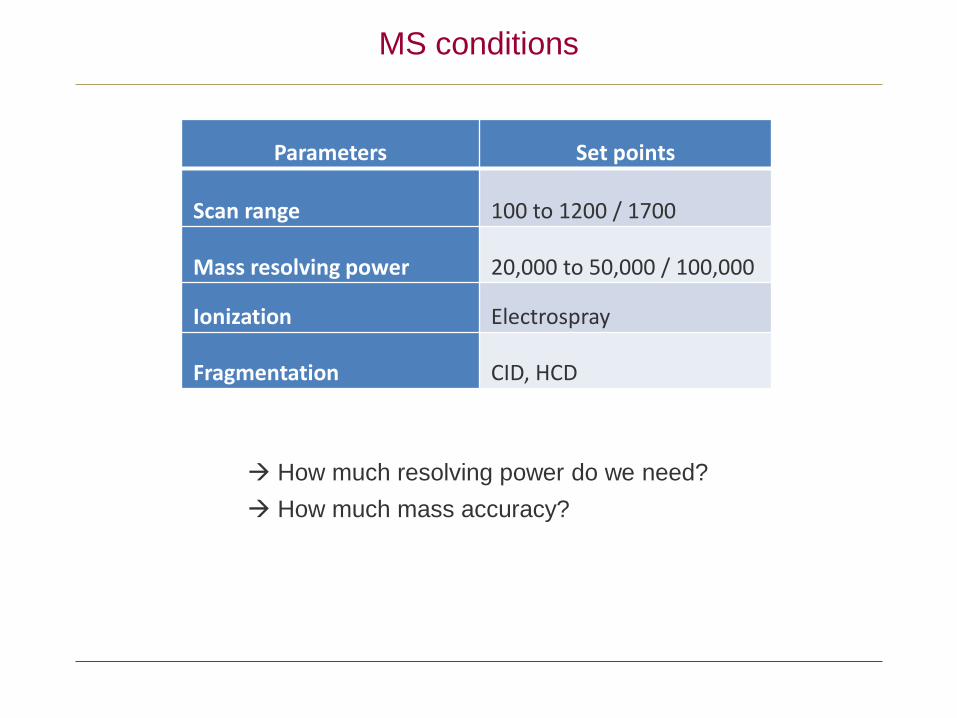
Which accuracy needed?
Grange et al. RCM 2002
Number of possible compositions
- increases exponentially with increasing mass
- increases linearly with mass error
- is a function of mass defect
CHNO: unique formula at m/z 118 34 ppm (4 mDa)
m/z 750 0.018 ppm (0.013 mDa)

Mass resolving power
Resolving mass dubletts in complex mixtures
- N2/C2H4 Dm = 25 mDa R = 20 000 (m/z 500)
- S/O2 Dm = 17.7 mDa R = 28 000 (m/z 500)
- C3/SH4 Dm = 3.4 mDa R = 147 000 (m/z 500)
isotope pattern
Marshall A., PENAS 2008
9.4-T FT-ICR-MS
R = 400 000

precursorproduct ion
1product ion
2product ion
3product ion
4product ion
5295.9572 268.9463 231.9953 204.9844 126.0116 77.9655295.9567 268.9462 231.9950 204.9841 126.0114 77.9655
4060 9902 384 9547 3134 2129319.1 46.5 1.8 44.8 14.7 100.0
-1.7 ppm -0.3 ppm -1.4 ppm -1.6 ppm -1.6 ppm -0.3 ppm
Hydrochlorothiazide
precursor product ion 1 product ion 2 product ion 3
462.9632 418.9734 218.9862 168.9894
N.A. 418.9722 218.9860 168.9894
not detected 2866 9890 14545
#VALUE! 19.7 68.0 100.0
#VALUE! -2.9 ppm -0.8 ppm 0.2 ppm
PFNA
precursor product ion 1 product ion 2 product ion 3 product ion 4 product ion 5 product ion 6748.4842 716.4580 590.3898 558.3637 158.1176 116.1070 116.0706748.4845N.A. 590.3893 558.3647 158.1171 116.1071 116.0708
1376 0 3537 998 11982 1845 196211.5 0.0 29.5 8.3 100.0 15.4 16.4
0.4 ppm #VALUE! -0.8 ppm 1.8 ppm -2.8 ppm 0.9 ppm 1.7 ppm
Clarithromycin
MS/MS mass accuracy (6550 QTOF)

Sampling sites
Small river in Southwest Germany
• Anthropogenically influenced mass fluxes
WW
TP
AMMER
Source
Sport
Upstream
downstream
80,000 PEWWTP

SPE
250 mL 0.5 mL, ENV+ (ASPEC, Gilson)
HPLC
Agilent 1290 Infinity UHPLC System
Zorbax Eclipse Plus C-18 column (160 x 2.1 mm,
1.8 µm)
Gradient: linear, water (0.1% formic acid) - methanol
MS
Agilent 6550A iFunnel Q-TOF-MS
2 GHz extended-dynamic mode
(20,000 @ m/z 650; < 1 ppm)
Mass range 100 -1600 Da
Software
Agilent Mass Hunter Qual B.06
Forensics and toxicology library (> 7000 entries; Agilent)
Pesticide database (1600 entries; Agilent)
Measurement

Suspect screening
known unknowns
• HiRes MS
• Generic methods
• Suspect list of
compounds
50 water pollutants
Suspect screening
Basepeak chromatograms
downstream of WWTP
upstream of WWTP
Compound list created in a worksheet
C10H11N3O3S 5.617 253.0521 Sulfamethoxazole
C16H25NO2 5.666 263.1885 Tramadol
C9H7Cl2N5 5.748 255.0079 Lamotrigine
C15H25NO3 5.982 267.1834 Metoprolol
C11H12N2O 6.126 188.095 Phenazone
Sum form. RT Mass Nameor import
in database
manager

Find by Formula Search (suspect list)
Formula Source: 50 WP data base (10 ppm match)
35 hits based on accurate mass and isotope pattern
Extracted ion
chromatograms
Isotope pattern for
C18H31NO4
Bisoprolol
Bisoprolol: score 83,
Dmass – 1.34 ppm

Find by Formula Search (suspect list)
EIC
Isotope pattern for
C6H12Cl3O4P
Tris-(-2-chloroethyl)
phosphate
Tris-(-2-chloroethyl) phosphate (TCEP): score 99, Dmass -1.98 ppm
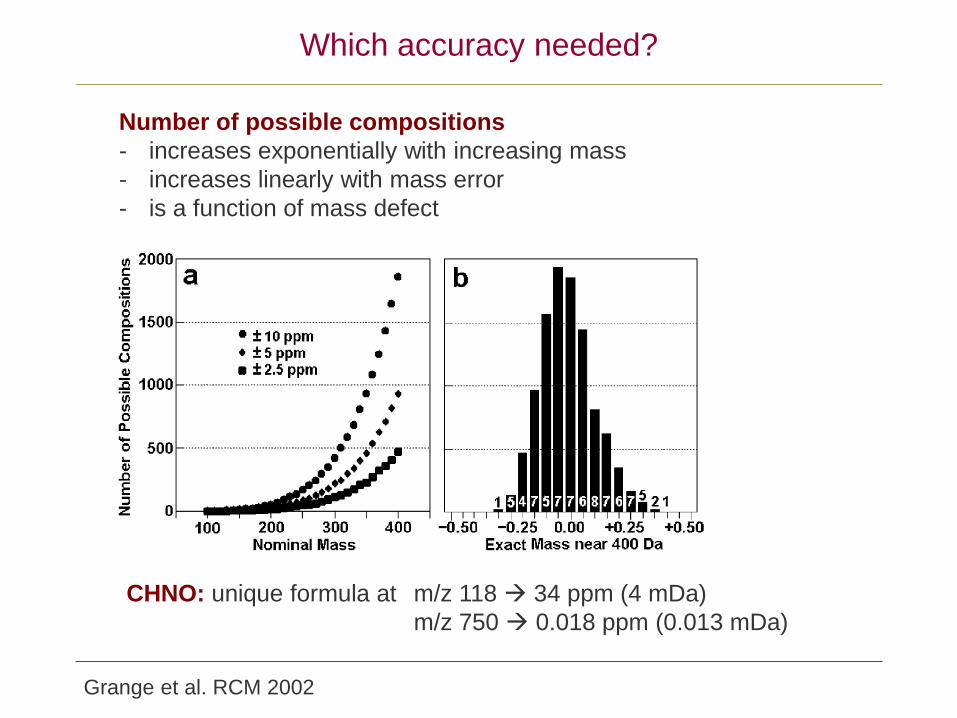
Input by WWTP?
Considerable increase of Bisoprolol and TCEP
due to input into the river from WTP effluents
TCEP
down
up
BlankBisoprolol
downstream of WWTP
up
Blank

Identification and confirmation
Schymanski et al. Anal. Bioanal. Chem. 2015 (in press)

Compound confirmation
Acquired spectrum at CE 23.6 V
Library spectrum at CE 20 V
Bisoprolol
• Pure standards (mass, retention time)
• Mass fragmentation (accurate mass)
- Targeted MS/MS run for a list of compounds
(retention time, precursor mass, CE)
- Comparison with library spectra (Agilent ForensicsTox library)

Nontarget screening
Nontarget screening
unknowns
Automated peak detection (MFE)
Molecular formula generation
MS-MS fragmentation
Accurate mass measurement
Statistical data analysis
Identification
Chemical database and
in-silico fragmentationMS/MS database
or library

Data evaluation - deconvolution
Scan 15.04 – 15.15 min
EIC m/z
237.1016Molecular feature spectrum

Data evaluation - deconvolution
Peaks in EI chromatograms
EI chromatograms
of 25 compounds
Peak deconvolution
or picking
- Thresholds
- Ranges
- Chromatographic
parameters

Peak finding (MFE)
Mass RT
(min)
113.121 5.97
114.047 4.52
114.066 5.43
114.116 0.79
114.116 0.78
115.063 0.51
115.063 0.64
116.031 0.81
116.985 0.56
117.042 5.6
117.079 0.19
Export data
Compound exchange format (cef)
Data evaluation
Mass Profiler or
Mass Profiler Professional
Peak alignment
Number of ions > 2
Filtering
frequency, n-fold change
Blank

Diclofenac-d4 in ESI Pos (m/z 300.04907)
Diclofenac_d4
Zoom in
Internal standards
100 injections

Sample 001
S1S2
S3
S4
S5
S6S7
S8S9
S10
S11
S12
S13
S14
S15
S16
S25S24
S23
S22S21
S20S19
S18
S17
Rhine sampling
• Rhine sampling campaign 08/2014
A. Fath, FH Schwenningen
• Grab samples
• Filtration 100µL injection
• LC-ESI-QTOF measurement
(3 replicates)
• MFE export to Mass Profiler
Professional

3738 compounds aligned (pos)
Filter by flag:
only compounds in at least 2 replicates 3003
Abundance > 5000 counts 2694
In at least 2 samples 2122
Up-regulated in Rhine vs. Blank 1453
Unique to Rhine 1308
MPP – Data filtering

Sample No. 1 … 25
1453 f
eatu
res
Heatmap of selected features

Boxplot of selected features

S22S18
S16
S20
S24S25S21
S23
S15
S19S17
S1S2
S3
S4 S8S6
S9S5
PCA plot

S1 S3 S4 S8S5
S14 S16 S19 S20 S24
Lamotrigine in Rhine samples

Similar behavior
Sample No. 1 … 25
Log2 (
Norm
aliz
ed
Abundance)
Similar entities 255.0077 @ 6.8 min (Lamotrigine, anticonvulsant)
Euclidean distance 0.9 <= r <= 1.0
10 compounds
Lake Constance Lahne confl.Wesel confl.

Similar behavior
Features at: 171.1259 @ 4.1min; 258.077 @ 9.6 min

Identification
Export for identification
Library search (Agilent Forensics Tox)
Accurate mass and isotope pattern Fragmentation match
Gabapentin,
anticonvulsant, analgesic

Carbamazepine
Identification

QTOF screening approaches enable to
characterize surface water quality
detect relevant pollutants
retrieve relevant metabolites (all ions)
requires
- statistical approaches to reduce data
- library data AMRT for ID
Conclusions
Sample
001