Political uncertainty and cash holdings: Evidence from...
51
1 Political uncertainty and cash holdings: Evidence from China * Kam C. Chan Gordon Ford College of Business Western Kentucky University Bowling Green, KY 42101 USA E-mail: [email protected] Qinyuan Chen School of Business Renmin University of China Beijing 100872, China E-mail: [email protected] Nianhang Xu School of Business Renmin University of China Beijing 100872, China E-mail: [email protected] This draft: January 2016 * We acknowledge the helpful comments from Ying Jiang, Zhe Shen, and seminar participants from Renmin University of China and Xiamen University. Nianhang Xu acknowledges the financial support from the National Natural Science Foundation of China (Grant Nos. 71172180), the Fok Ying Tung Education Foundation (Grant No. 141080), and the Outstanding Youth Talent Support Program by the Organization Department of the CPC Central Committee. The usual caveats apply.
Transcript of Political uncertainty and cash holdings: Evidence from...
1
Political uncertainty and cash holdings: Evidence from China*
Kam C. Chan
Gordon Ford College of Business
Western Kentucky University
Bowling Green, KY 42101
USA
E-mail: [email protected]
Qinyuan Chen
School of Business
Renmin University of China
Beijing 100872, China
E-mail: [email protected]
Nianhang Xu
School of Business
Renmin University of China
Beijing 100872, China
E-mail: [email protected]
This draft: January 2016
* We acknowledge the helpful comments from Ying Jiang, Zhe Shen, and seminar participants from Renmin
University of China and Xiamen University. Nianhang Xu acknowledges the financial support from the National
Natural Science Foundation of China (Grant Nos. 71172180), the Fok Ying Tung Education Foundation (Grant No.
141080), and the Outstanding Youth Talent Support Program by the Organization Department of the CPC Central
Committee. The usual caveats apply.
2
Political uncertainty and cash holdings: Evidence from China
Abstract
We examine the relation between political uncertainty and cash holdings for firms in China. We
document that, during the first year of a new city government official’s appointment, a firm, on
average, holds less cash, which is consistent with the grabbing hand hypothesis of politician. Our
results are robust to alternative measures of cash holdings, sub-samples without firms in four
major cities, a matched sample approach, and placebo tests. We also find that if the newly
appointed official is from a different (the same) city, a firm’s cash holdings decrease significantly
(do not change). Similarly, if the appointment is an expected (unexpected) one, a firm’s cash
holdings decrease significantly (do not change). Furthermore, we show that a firm keeps
significantly less cash in periods of political uncertainty if it faces higher political extraction risk.
In addition, after the 18th
National Congress of the Communist Party of China, the impact of the
political uncertainty on firm cash holdings becomes insignificant due to the strong
anti-corruption campaign. We report that when a firm has strong twin agency conflicts, it holds
less cash during political uncertainty periods than firms with weak agency conflicts, suggesting
that firms with bad agency problems are susceptible to political extraction. Lastly, our extended
results suggest that the market value of cash holdings is significantly negative during periods of
political uncertainty and firms hide their cash by moving it to related firms via related party
transactions.
Keywords: Political uncertainty, cash holdings, twin agency problem, China
JEL Classification: G32; G38
3
Political uncertainty and cash holdings: Evidence from China
1. Introduction
Political connections play an important role in many economic activities. While they are
not necessarily good for an economy, they are sometimes very good for a firm. A firm can use
political connections to enhance its operations and increase its value (Fisman, 2001; Faccio,
2006; Faccio et al., 2006; Bunkanwanicha and Wiwattanakantang, 2009). Specifically, emerging
market studies, such as those on China, document that a firm’s political connections are critical
for favorable decisions in corporate litigation (Firth et al., 2011), the approval and promotion of
initial public offerings (Liu et al., 2013; Piotroski and Zhang, 2014), and family firm success (Xu
et al., 2015), among other things. These studies suggest that political connections can be helpful
and play the role of a helping hand to a firm.
In contrast, political connections can sometimes harm a firm, especially in emerging
markets with weak formal institutions and high levels of corruption. The literature (e.g., Frye and
Shleifer, 1997; Shleifer and Vishny, 2002) generally describes a grabbing hand phenomenon, in
which government officials extract resources from a firm for personal gain through user fees,
taxes, regulations, and bribes or even seize all assets via nationalization. Stulz (2005) shows that,
facing expropriation by officials, firm owners will structure corporate assets to minimize the
likelihood of loss from political extraction. Studying 109 countries and using firm cash holdings
in 2005 as the dependent variable, Caprio et al. (2013) report that when a country’s corruption
level is high, a firm’s cash holdings, on average, are low and vice versa. The authors contend that
cash is the most liquid asset and government officials often target cash-rich firms for political
extraction via corruption. Hence, a firm holds less cash to minimize the risk of political
extraction. While the findings of Stulz (2005) and Caprio et al. (2013) are insightful, they focus
4
on expropriation by corrupt officials, which is the undesirable outcome of the grabbing hands
process of officials. The role of the helping hand perspective of political connections regarding a
firm’s cash holdings is unclear. In addition, the literature primarily examines the impact of
having political connections, not changes in political connections, on firm value and cash
holdings. A change in political connections due to political turnover creates political uncertainty.
The political uncertainty is a shock that enhances or weakens the firm’s existing political
connections and subsequently affects its cash holding decisions.
The objective of our study is to examine the relation between cash holdings and political
uncertainty in China. Using political uncertainty created by political turnover in a city in which a
firm located, we examine the competing helping and grabbing hand hypotheses of politicians on
cash holdings. We argue that a firm has two possible reactions to political uncertainty in its city.
Under the helping hand hypothesis, a firm considers politicians helpful. Political uncertainty
means opportunity for the firm, because the new official can help the firm to enhance its value.
Hence, the firm needs to respond aggressively to a newly appointed official’s initiatives and
policies to secure the official’s help or government resources. For instance, a newly appointed
official might want to expand a city’s economic development. It is then in the best interest of a
firm to respond positively and promptly to such an initiative to take advantage of government
subsidies in the name of economic development. By doing so, the firm will be able to obtain the
government’s help and, more importantly, can maintain or exceed its political connections
established in the previous political regime to enhance the firm’s future. Accordingly, the firm
opportunistically needs more cash in a period of political uncertainty to respond quickly to the
newly appointed official, which is similar to the speculative motive for holding cash (Almeida et
al., 2004; Francis et al., 2014). Moreover, a newly appointed official, while very friendly and
5
helpful to local firms, may take time to materialize help to firms in terms of financing. That is, a
helpful hand takes time to be effective. Thus, it is in a firm’s best interest to maintain more cash
to ease temporary financial constraints due to political uncertainty. This is a precautionary
motive for holding cash (e.g., D’Mello et al., 2008; Bates et al., 2009). Therefore, during a new
political appointee’s first year in a city, political uncertainty leads to more cash holdings for local
firms.
In contrast, under the grabbing hand hypothesis, firms expect politicians to extract
resources from them. When a political turnover occurs, the firm perceives the political
uncertainty as just another opportunity for the newly appointed official to extract its assets. The
firm considers the new official’s initiatives and policies only as means of political extraction.
Under political uncertainty and the grabbing hand assumption, it is safer for a firm to hide its
assets, especially liquid assets such as cash, to minimize loss from political extraction. The firm
will then reduce cash holdings in a period of political uncertainty. The grabbing hand hypothesis
under political uncertainty echoes the argument of Stulz (2005) and Caprio et al. (2013) that a
firm holds less cash when facing a highly corrupt government. Hence, in the first year of a new
political appointee in a city, the cash holdings of local firms are lower. All things considered,
whether firms will keep more or less cash in a period of political uncertainty is an empirical
question.
Our paper is interesting for two reasons. First, the cross-country study of Caprio et al.
(2013) specifically examines cash holdings and corruption and does not directly study cash
holdings and political uncertainty. Thus, the authors assume the grabbing hand nature of
politicians and an adverse impact of political connections (in the context of corruption) rather
than political uncertainty. Our paper fills this gap by examining political uncertainty and
6
considers both the helping and grabbing hand hypotheses. Second, the widely different cultural
and economic development among the 109 countries studied by Caprio et al. (2013) naturally
allows for only highly aggregated data in their analysis. By focusing on China, we are able to
include more firm-level control variables and moderating factors, such as politically connected
executives, firm scale, changes in corporate debt, local fiscal deficits, and changes in general
political climate to examine the relation between cash holdings and political uncertainty. That is,
by using a single-country study, we are able to control for differences in cultural and economic
impact across the country and provide additional insights on moderating factors.
China’s environment is particularly suitable for examining the helping versus the
grabbing hand hypothesis of politician and cash holdings for several reasons. First, unlike other
countries, China has rich data for analysis. It has undergone frequent political turnover because
the Chinese government has a policy of appointing new political leaders in a city every several
years to empower career politicians and prevent local officials from building up too much power.
Both officials and firms are used to the political uncertainty created by government official
turnover. Second, the compensation of Chinese officials is generally low relative to that in other
countries and relative to private industry in China.1 It is natural for officials to seek alternative
compensation in monetary and non-monetary forms. The helping hand hypothesis suggests that
officials enjoy helping firms for non-monetary rewards, such as guanxi (personal connections)
and/or better political advancement opportunities to supplement their low monetary
compensation. Alternatively, the grabbing hand hypothesis explains that officials use their
political power to engage in political extraction to enhance their low monetary compensation.
1 On April 29, 2013, the International Business Times reported that Xi Jinping, China’s president, made US$19,000
a year (compared to US President Barack Obama’s US$400,000 a year). Jiang Jianqing, chairman of the Industrial
and Commercial Bank of China, made US$185,000 a year, which is almost 10 times as much as Xi
(http://www.ibtimes.com/chinas-high-ranking-officials-businessmen-salaries-still-too-high-critics-1223295,
accessed October 29, 2015).
7
Both helping and grabbing hand phenomena are possible. Hence, China is a good testing ground
for examining political uncertainty and cash holdings. Third, China is a relational economy.
Guanxi is important for anyone to achieve a goal or task in China (Xin and Pearce, 1996; Tsang,
1998). Among the different kinds of guanxi, political connections are among the most important.
Recent evidence from Firth et al. (2011), Liu et al. (2013), and Piotroski and Zhang (2014)
illustrates the importance of political connections. When there is political uncertainty due to
government official turnover, a firm’s political connections become uncertain or even disappear.
Naturally, firms pay special attention to political uncertainty and position themselves accordingly.
Depending on whether the newly appointed official plays the role of a helping or a grabbing
hand, firms react differently in terms of cash holdings. These characteristics make China a good
environment for examining the impact of political uncertainty on cash holdings.
Our comprehensive analyses offer a number of interesting findings. First, ceteris paribus,
during the first year under new city political leadership, a firm holds less cash, which is
consistent with the political extraction explanation of Stulz (2005) and Caprio et al. (2013) and
supports the grabbing hand hypothesis of politician. The findings are robust to alternative
measures of cash holdings, sub-samples without firms in four major cities, a matched sample
approach, and placebo tests.
Second, we find that if the newly appointed official is from a different (the same) city,
firm cash holdings decrease significantly (do not change) in the first year of the new appointment.
The results suggest that if a firm is unable (able) to assess the political intention of the new
appointee, its cash holdings decrease significantly (remain stable). That is, a different city
official’s new appointment means more political uncertainty for a firm and, hence, the firm
responds by significantly lowering its cash holdings. Similarly, if the government official
8
appointment is expected (unexpected), the cash holdings decrease significantly (do not change)
in the first year of the appointment, suggesting a firm lowers (does not change) its cash holdings
if it foresees (does not foresee) a political uncertainty. These additional results collaborate with
the base finding that cash holdings will decrease when a firm faces political uncertainty.
Third, we document that, on average, a firm keeps significantly less cash in a period of
political uncertainty if it (a) does not have politically connected executives, (b) is smaller (c) has
less debt, or (d) is located in a city with a large fiscal deficit. Our findings suggest that there are
several moderating factors in the relation between cash holdings and political uncertainty. These
moderating factors are primarily related to a firm’s vulnerability to political extraction. In
addition, we find that the impact of political uncertainty on firm cash holdings becomes
insignificant for the sub-samples in 2013 and 2014. We attribute this finding to a change of
political climate after 2012. During the 18th
National Congress of the Communist Party of China
in late 2012, China President Xi Jinping made a strong emphasis on anti-corruption and put
together though rules for government officials to follow.
Fourth, we report that when a firm has strong twin agency conflicts, it holds significantly
less cash during a period of political uncertainty than those with weak twin agency conflicts,
indicating that a firm with a strong twin agency problem is susceptible to political extraction.
This finding is consistent with Stulz’s (2005) prediction. When a firm has a strong twin agency
problem, its executives and/or major shareholders have more resources (especially cash) at their
disposal in normal times. When the firm anticipates political uncertainty and believes a newly
appointed official may have a grabbing hand with regard to the firm, it reduces cash holdings as
a strategic precautionary response.
9
Lastly, our extended results suggest that the market value of cash holdings is significantly
negative during periods of political uncertainty, suggesting that the market value of cash to a firm
is lower due to the potential loss of cash to political extraction. Moreover, we document that a
firm hides its cash by moving it to related firms via related party transactions (RPTs) instead of
using it to acquire fixed assets or pay out large dividends. This finding is consistent with those of
Julio and Yook (2012) and An et al. (2015), who document that firms reduce their investments
during periods of political uncertainty, but different from that of Caprio et al. (2013), who find
firms hide cash by acquiring more fixed assets via investment and paying higher dividends.
Our paper contributes to the literature in several ways. First, our paper is related to the
work of Stulz (2005) and Caprio et al. (2013), who study the impact of political corruption on
cash holdings. Our study focuses on the impact of political uncertainty on cash holdings and
complement these authors’ findings by extending their argument of corruption to the impact of
general political uncertainty on cash holdings. Second, our findings on firms’ strong twin agency
problems and lower cash holdings support Stulz’s (2005) theoretical model. We support Stulz’s
prediction that a firm with a strong twin agency problem is susceptible to political extraction.
Third, we document that political uncertainty can affect cash holding decisions in addition to
other corporate decisions, such as investments (e.g., Julio and Yook, 2012; An et al., 2015) and
tax avoidance (Chen et al., 2015a). Lastly, we report the additional possibility of using RPTs to
hide cash in the event of political uncertainty. The use of RPTs among Chinese firms to hide cash
differs from the use of investments or paying more dividends to hide cash described in the
literature (Caprio et al., 2013).
10
2. Institutional background, literature review, and hypothesis development
2.1 Institutional background
There are five levels of political hierarchy in China: those of the central government,
provinces, cities, counties, and townships. Cities are at the third level. According to the 2014
China City Statistical Yearbook, there are 290 cities across 31 provinces and four centrally
administrated cities (Beijing, Shanghai, Tianjin, and Chongqing). The top two leaders at the city
level are the city’s Communist Party Secretary and the mayor, reflecting the dual presence of the
Communist Party and the government at each level of China’s political hierarchy (Li and Zhou,
2005). City official turnover is mainly controlled by the Organization Department of the
Provincial Party Committee. Typically, a city official’s tenure is five years2 and their turnover
occurs around the meetings of the National People’s Congress of the People’s Republic of China.
However, many city officials do not complete the five-year terms and leave for other positions.
2.2 Literature review
This section discusses three strands of the literature: political connections, political
uncertainty, and cash holdings.
2.2.1 Political connections
Fishman (2001) tracks the stock price reactions of politically connected and unconnected
firms with rumors of the Indonesian president’s health and reports that the stock prices of
politically connected firms react positively to good health rumors. Faccio (2006) examines firm
value changes when a firm’s executive is elected to an important government office. Faccio
reports that firms in highly corrupt countries experience a significant rise in value in such 2 Regarding city officials’ tenure, the Organization Department of the Central Committee of the Communist Party
of China issued the “Provisional Regulations on Terms of Cadres of the Party and Government” in August 2006,
which states that mayors and officials at the county level and above should serve five-year terms and that these
terms should be relatively stable. An added regulation also stipulates that cadres may not serve in the same position
for more than two terms (Article 6) and may not serve in positions of the same rank for more than 15 years (Article
7).
11
elections. Claessens et al. (2008) document that politically connected firms, on average, are able
to obtain more loans from banks relative unconnected firms. In a 22-country study of mergers
and acquisitions, Brockman et al. (2013) report that politically connected bidders outperform
unconnected bidders by 20% in countries with a weak legal system and high levels of corruption,
suggesting that connected bidders obtain better information about merger targets from their
political connections. Infante and Piazza (2014) document that politically connected firms in
Italy benefit from lower interest rates when their connections are at the local level and the effect
is stronger in regions with high corruption. Correia (2014) finds that a politically connected firm
is the target of less enforcement action from regulators in securities violations. In addition, the
literature suggests that political connections are critical for a firm to benefit from favorable
decisions in corporate litigation (Firth et al., 2011), the approval and promotion of initial public
offerings (Liu et al., 2013; Piotroski and Zhang, 2014), and family firm success (Xu et al., 2015),
among other things.
Besides the helping hand perspective, many studies discuss the grabbing hand of
politicians and in many cases the connection has an adverse impact on firm value. Shleifer and
Vishny (1994) study changes in firm behavior with political connections. Specifically, they
suggest that firms under the influence of political connections employ more employees and pay
them higher wages than firms without political connections. That is, political connections
encourage firms to make suboptimal decisions, which destroy firm value. The model of Stulz
(2005) and the indirect evidence of Caprio et al. (2013) suggest that politicians extract firm
assets via corruptions. A number of studies examine the adverse impact of political connections
on Chinese state-owned enterprises (SOEs). Wu et al. (2012) report that politically connected
SOEs over-invest to please politicians. Tu et al. (2013) document that politically connected SOEs
12
are more likely to engage in tunneling during firm privatization in China. In sum, political
connections can destroy firm value.
Overall, this body of literature suggests that political connections play the role of both a
helping hand and a grabbing hand for firms. We note that these studies focus on political
connections and not political uncertainty.
2.2.2 Political uncertainty
Roberts (1990) provides an early study on the impact of political uncertainty to a firm,
examining stock price reactions to the sudden death of US Senator Henry Jackson in 1983. The
author reports a general decline in stock prices for firms connected to the senator. When the
senator died, political uncertainty drove stock prices down. Bertrand et al. (2006) examine the
impact of city elections on corporate investment in France. During the politically uncertain
election period, politically connected chief executive officers (CEOs) increased their investments,
especially in politically contested cities, to help current city officials get re-elected. That is,
political uncertainty may increase corporate investment. Fan et al. (2008) examine the impact on
firm leverage and stock prices in China after the arrest of corrupt officials with political
connections to firms. After the arrests, the connected firms faced political uncertainty. They then
experienced a decline in leverage and stock price, indicating the adverse impact of political
uncertainty on firm value.
Julio and Yook (2012) study corporate investment around the time of 248 national
elections in 48 countries from 1980 to 2005. Given the political uncertainty during election years,
Julio and Yook argue that an election can have a bad outcome for a firm. Hence, there is an
option value of waiting to invest. The authors report that firms reduce their investments, on
average, by 4.8% during political uncertainty periods, after controlling for other factors. An et al.
13
(2015) study the impact of political uncertainty on firm investment and report a decrease in
investment during periods of government official turnover in cities in China. Bu et al. (2015)
examine the impact of changes of provincial officials on the accounting conservatism of firms
located in their provinces in China. The authors report that political uncertainty significantly
reduces accounting conservatism and the effects are stronger for SOEs, in regions of low
marketization, and when the incoming officials are from outside the province.
To summarize the literature, we take political uncertainty to a firm is the risk of losing
existing political connections or getting adverse impact from a new government policy due to
new local government officials. The impact of political uncertainty to a firm is real. With the
exception of the work of Bertrand et al. (2006), the findings generally suggest that political
uncertainty reduces corporate investments. In addition, some studies report lower stock prices
and decreased accounting conservatism due to political uncertainty. With respect to cash holding
decisions, it is unclear if political uncertainty leads to a firm holding more or less cash.
2.2.3 The rationale behind holding cash
There are many studies on the rationale behind holding cash. We only provide a brief
discussion here. Opler et al. (1999) summarize the tradeoff theory of holding cash. Specifically,
they suggest that holding cash can benefit a firm but also incurs opportunity costs. For instance,
Baumol (1952) suggests that when a firm holds more cash, it can reduce transaction costs by
avoiding raise funds frequently or liquidate non-cash assets for operating and financing activities.
D’Mello et al. (2008) study cash allocation in spin-offs. They report that a firm allocates more
cash to its spin-off when the spin-off is smaller and has higher R&D expense. Bates et al. (2009)
attribute the increase in cash among US firms to the growing liquidity demand to buffer against
cash flow shock. That is, cash allows a firm to maintain financial flexibility and to minimize
14
damage due to financial distress from adverse cash flow shocks. This is the precautionary motive
of holding cash.
Holding cash can also allow a firm able to promptly accepting positive net present value
projects. For instance, Almeida et al. (2004) develop a model showing that financially
constrained firms keep more cash than those of unconstrained firms, suggesting firms keep more
cash for investments. Bill et al. (2014) document that, after interstate banking deregulation in the
US, nonfinancial firms hold less cash. The needs for nonfinancial firms to promptly using cash
can be met by a more competitive banking market and therefore the need to hold more cash is
less. This group of literature suggests that holding cash for a speculative motive.
The cost of holding cash is its low return relative to other assets. In addition to tradeoff
theory, Jensen (1986), Kim et al. (1998), and Dittmar et al. (2003) provide an agency cost
perspective of cash holdings. They suggest that keeping a large amount of cash is the result of an
agency problem where executives have discretion to use cash. When cash is available, executives
are likely to spend it as part of their private benefits.
Taking together, the cash holding literature considers economic uncertainty (e.g., cash
flow shocks due to a firm’s own business operation or when a firm decides to make prompt
business decisions to use cash) and agency problem as the rationales in holding cash. This body
of literature seldom considers the impact of political uncertainty on cash holdings at firm level,
however. Our study fills this void.
2.3 Hypothesis development
Based on the literature and the helping hand hypothesis of political uncertainty, we
predict that a firm will hold more cash to take advantage of new government officials’ initiatives.
It is in the best interests of a firm to respond quickly to the new initiatives. Hence, a firm will
15
hold more cash for precautionary and speculative purposes when anticipating political
uncertainty. In contrast, the grabbing hand hypothesis of politician suggests that a new
government official is likely to extract assets from the firm. Political uncertainty creates the risk
of extraction. Among many assets, cash is the easiest to extract. Hence, it is a good strategy to
hold less cash to minimize such a risk. In sum, we do not know if the helping or the grabbing
hand hypothesis prevails. Hence, whether a firm will hold more cash under political uncertainty
is an empirical question. Our testable hypotheses are the following.
H1A: During a period of political uncertainty, a firm holds more cash.
H1B: During a period of political uncertainty, a firm holds less cash.
3. Research design
3.1 Data
We use the China Stock Market and Accounting Research (CSMAR) database and the
Wind Financial Database (WindDB) as primary sources for cash holdings, financial data, and
other basic information on Chinese public firms. We obtain RPT data from the CSMAR database.
Our sample period is from 1998 to 2014. We start with 1998 because it is the first year cash flow
statements were subject to mandatory disclosure requirements in China.
To capture the impact of local political uncertainty, we manually obtained detailed
information on mayors and Communist Party secretaries, such as their names, positions, tenure
terms, ages, and résumés, from city government official websites. These résumés also contained
detailed personal information such as education and work experience prior to the appointment. If
the information was not readily available, we hand-collected it from the Baidu search engine
(www.baidu.com), which is China's most popular search engine. After collecting the officials’
personal data, we then merged the personal data with firm data from CSMAR and WindDB by
16
matching the province, city, and fiscal year. Following the literature (e.g., Cull and Xu, 2005;
Ayyagari et al., 2010; Lin et al., 2010; Becker et al., 2011), we classified the city where a firm
belonged according to the location of the firm’s corporate headquarters.
After merging all the above data, we excluded the following: (a) firms in the financial
industry, (b) officials whose résumés were not available, and (c) firms with missing related
financial information. In addition, we manually collected information on politically connected
executives from firm prospectuses and annual reports. We also collected city data from the China
Economic Information Network (CEInet) Statistics Database, which includes the names of the
cities in each province, their gross domestic product growth rates, and their fiscal deficit data.3
Our final sample has 23,955 firm–year–official observations. In our analyses, the sample size
may vary due to missing values for some explanatory variables in different regression models.
3.2. Variable definitions
3.2.1 Dependent variables
3.2.1.1 Cash holdings
Following Opler et al. (1999), Dittmar et al. (2003), and Harford et al. (2008), we use the
logarithm of a firm’s cash ratio as the dependent variable, which is defined as the amount of cash
and cash equivalents divided by total assets net of cash and cash equivalents. In the robustness
check, we use two other measures to proxy for cash holdings. The first is a firm’s cash ratio
without cash equivalents. The second measure is excess cash holdings, defined as the difference
between actual and predicted cash holdings. We estimate predicted cash holdings using the
3 The CEInet Statistics Database includes two sub-databases: the China Economic Statistics Database and the World
Economic Statistics Database. The former consists of five sections: macro monthly data, yearly data, industry data,
custom data, and city–year data. The latter consists of two sections: Organization for Economic Co-operation and
Development monthly and yearly data.
17
method outlined by Opler et al. (1999) and Fresard and Salva (2010), presented in detail in
Appendix A.
3.2.1.2 Excess return
When we examine the market value of cash, we need to calculate a firm’s excess return.
Excess return is the firm’s stock return minus a benchmark return. We follow Faulkender and
Wang (2006) to use one of the 25 Fama–French portfolios formed on size and the book to market
(B/M) as our benchmark return. The benchmark portfolio return is a value-weighted return based
on market capitalization within each of the 25 portfolios. For each year, we group each firm into
one of 25 size and B/M portfolios based on the intersection between the size and B/M
independent sorts.
3.2.2 Main explanatory variables
3.2.2.1 Political uncertainty
We construct a dummy variable, INDUCTION, to examine how political uncertainty
influences corporate cash holdings. For each firm–year–official observation, INDUCTION takes
a value of one when the city where the firm’s headquarters are located experiences a government
official turnover (i.e., a mayor or Community Party Secretary is newly appointed) and zero
otherwise. The variable INDUCTION indicates political uncertainty for a firm. For the exact
dates of the newly appointed officials taking office, we follow Bo (1996) to construct the
INDUCTION variable. Specifically, if an official took office between January 1 and June 30,
then we define the current year as the official’s first year and INDUCTION takes the value of one.
If an official took office between July 1 and December 31, then we define the following year as
the official’s first year and INDUCTION takes the value of one For instance, Wang Qishan and
Guo Jinlong were former mayors of Beijing, appointed in April 2003 and November 2007,
18
respectively. Hence, we define 2003 as the year Wang took office. For firms located in Beijing,
INDUCTION takes a value of one whenever the firm–year observations are grouped in the year
2003. However, since Guo was appointed in the second half of the year, the next year is defined
as Guo’s induction year and INDUCTION takes a value of one for observations in 2008 for the
Beijing group.
3.2.2.2 Moderating factors
We consider a number of moderating factors on the impact of political uncertainty on
cash holdings. These moderating factors represent firm attributes that can change political
extraction risk to a firm. First, we consider politically connected executives (PC). Following
prior literature (Fan et al., 2007), executives are politically connected (PC = 1) if the CEO or
chair is a former government official, a former military officer, a member of the National
Committee of the Chinese People’s Political Consultative Conference, or a member of the
National Congress of the Communist Party of China. We expect a firm with politically connected
executives to be subject to less political extraction relative to a firm with only unconnected
executives.
Second, we follow Zimmerman (1983) and Wu et al. (2012) and use SCALE to capture a
firm’s importance in the local economy. The variable SCALE takes the value of one if the firm’s
total assets that year are greater than the median value of all firms in the same year. Stulz (2005)
explains that firm executives may invest in projects essential to the local economy and their
disruption would be costly to the city. Thus, when a firm is important and useful to a city, its risk
of political extraction is smaller.
Third, we use a firm’s change in corporate debt (DD) to capture the effect of leverage on
political extraction risk. When leverage changes, political extraction risk changes (Stulz, 2005).
19
Specifically, when a firm carries more debt, it needs more cash obligations to pay interest
expenses, subjecting the firm to lower political extraction risk during political uncertainty. The
variable DD takes a value of one when the change in the corporate debt scale that year is greater
than the median of all firms and zero otherwise.
Fourth, we use the city’s fiscal situation to proxy for expropriation risk. We expect fiscal
deficit to be positively correlated with the risk of expropriation by local government. Then, firms
will reduce cash holdings to lower such a risk. We construct a city fiscal deficit dummy,
DEFICIT, with a value of one if the fiscal deficit situation of the city where the listed firm is
located is better than average and zero otherwise.
Lastly, in the 18th
National Congress of the Communist Party of China on November 8,
2012, China President Xi Jinping emphasizes the importance of public trust and to avoid the
isolation of the Communist Party and People. President Xi begins to take strong actions against
corruption. For instance, several high profile officials, such as Zhou Yongkang4, fell from power
and later jailed under the anti-corruption campaign. Therefore, we expect the general corruption
in China level drops in 2013 and 2014. We use sub-samples on or before 2012 and on 2013 and
after to examine the impact of the change in political climate on cash holdings under political
uncertainty.
3.2.2.3 Variables that proxy for twin agency conflicts
Stulz (2005) specifically discusses the impact of twin agency conflicts on a firm’s
expropriation risk. We use three variables to capture twin agency conflicts: the control-ownership
wedge, analyst coverage, and auditor quality. We define the control-ownership wedge as a firm’s
ultimate owners’ control rights divided by their cash flow rights. The larger the
4 Zhou Yongkang was a senior leader of the Communist Party of China. He was a member of the Politurbo Standing
Committee and the Party Secretary of the Central Political and Legal Affairs Commission, which oversees all the
police and legal branches of China.
20
control-ownership wedge is, the higher the incentives for the controlling shareholder to
expropriate minority shareholders will be (e.g., Claessens et al., 2000; Lin et al., 2011). Prior
literature shows that analysts play an important role in corporate governance (Jensen and
Meckling, 1976; Healy and Palepu, 2001; Irani and Oesch, 2013; Chen et al., 2015b). Firms with
more analyst coverage face less agency conflict. We use an indicator variable, AC, that takes the
value of one if the firm has analyst coverage and zero otherwise to proxy for analyst monitoring.
Regarding auditor quality, if a firm is audited by a Big 4 international accounting firm, we
consider it to have fewer agency conflicts (Gul et al., 2010, 2011). We use BIG4, an indicator
variable that takes the value of one if the firm is audited by a Big 4 accounting firm in China and
zero otherwise, to proxy for external auditing governance.
3.3 Regression models
3.3.1 Main hypothesis
To examine the competing hypotheses H1A and H1B, we use the determinants of cash
holdings framework of Opler et al. (1999), as follows:
(1)
We follow the prior literature and use identified determinants of cash holdings variables as our
control variables (e.g., Opler et al., 1999; Dittmar and Mahrt-Smith, 2007; Caprio et al., 2013).
Specifically, these control variables include the market-to-book ratio of the firm (MB), net
working capital (NWC), firm leverage (LEVERAGE), cash flow from operating activities
(CASHFLOW), capital expenditure (CAPEXP), operating income growth rate (GROWTH), the
natural logarithm of total assets (SIZE), the largest shareholder’s shareholdings (NO1), cash flow
volatility (SIGMA), and a dummy variable for dividend payout (DIVIDEND). We scale NWC,
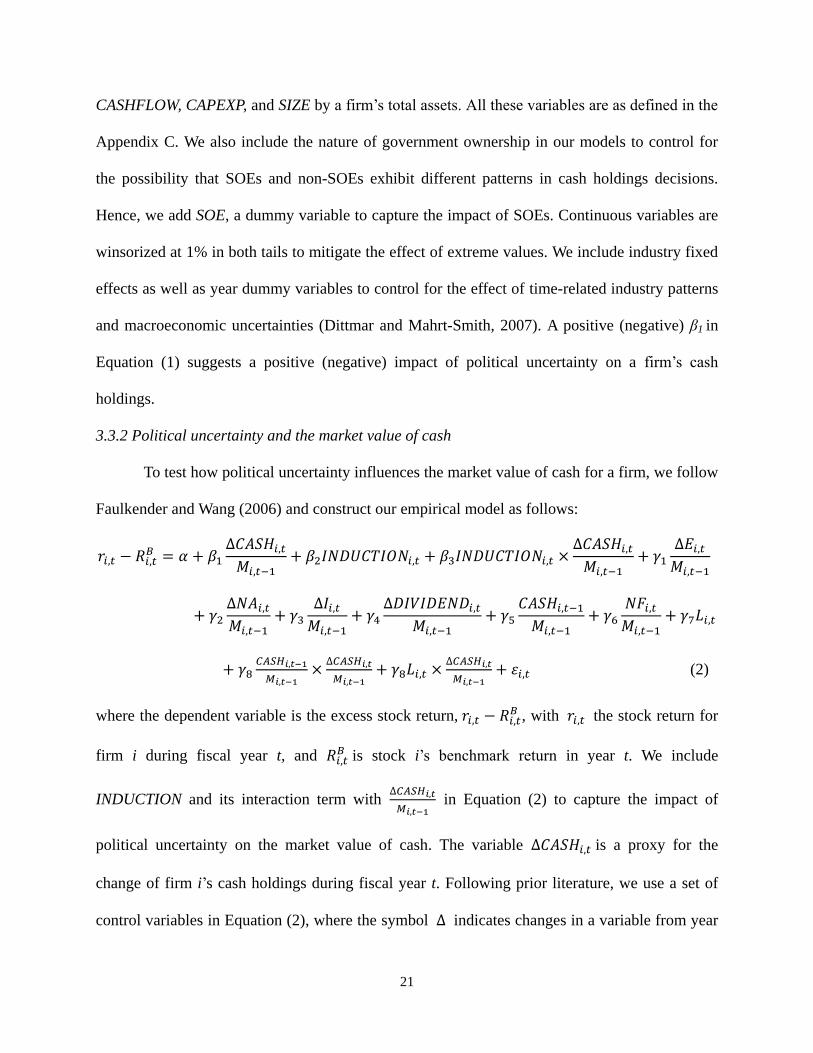
21
CASHFLOW, CAPEXP, and SIZE by a firm’s total assets. All these variables are as defined in the
Appendix C. We also include the nature of government ownership in our models to control for
the possibility that SOEs and non-SOEs exhibit different patterns in cash holdings decisions.
Hence, we add SOE, a dummy variable to capture the impact of SOEs. Continuous variables are
winsorized at 1% in both tails to mitigate the effect of extreme values. We include industry fixed
effects as well as year dummy variables to control for the effect of time-related industry patterns
and macroeconomic uncertainties (Dittmar and Mahrt-Smith, 2007). A positive (negative) β1 in
Equation (1) suggests a positive (negative) impact of political uncertainty on a firm’s cash
holdings.
3.3.2 Political uncertainty and the market value of cash
To test how political uncertainty influences the market value of cash for a firm, we follow
Faulkender and Wang (2006) and construct our empirical model as follows:
(2)
where the dependent variable is the excess stock return, , with the stock return for
firm i during fiscal year t, and is stock i’s benchmark return in year t. We include
INDUCTION and its interaction term with
in Equation (2) to capture the impact of
political uncertainty on the market value of cash. The variable is a proxy for the
change of firm i’s cash holdings during fiscal year t. Following prior literature, we use a set of
control variables in Equation (2), where the symbol indicates changes in a variable from year
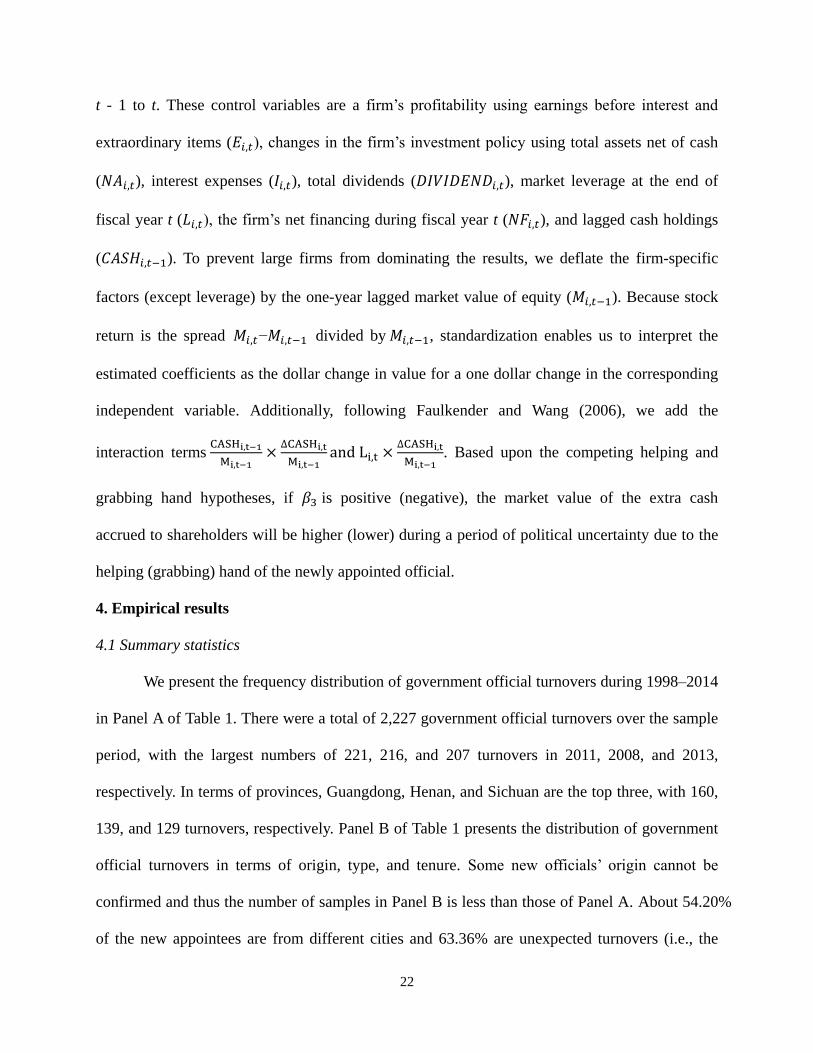
22
t - 1 to t. These control variables are a firm’s profitability using earnings before interest and
extraordinary items ( ), changes in the firm’s investment policy using total assets net of cash
( ), interest expenses ( ), total dividends ( ), market leverage at the end of
fiscal year t ( ), the firm’s net financing during fiscal year t ( ), and lagged cash holdings
( ). To prevent large firms from dominating the results, we deflate the firm-specific
factors (except leverage) by the one-year lagged market value of equity ( ). Because stock
return is the spread − divided by , standardization enables us to interpret the
estimated coefficients as the dollar change in value for a one dollar change in the corresponding
independent variable. Additionally, following Faulkender and Wang (2006), we add the
interaction terms
. Based upon the competing helping and
grabbing hand hypotheses, if is positive (negative), the market value of the extra cash
accrued to shareholders will be higher (lower) during a period of political uncertainty due to the
helping (grabbing) hand of the newly appointed official.
4. Empirical results
4.1 Summary statistics
We present the frequency distribution of government official turnovers during 1998–2014
in Panel A of Table 1. There were a total of 2,227 government official turnovers over the sample
period, with the largest numbers of 221, 216, and 207 turnovers in 2011, 2008, and 2013,
respectively. In terms of provinces, Guangdong, Henan, and Sichuan are the top three, with 160,
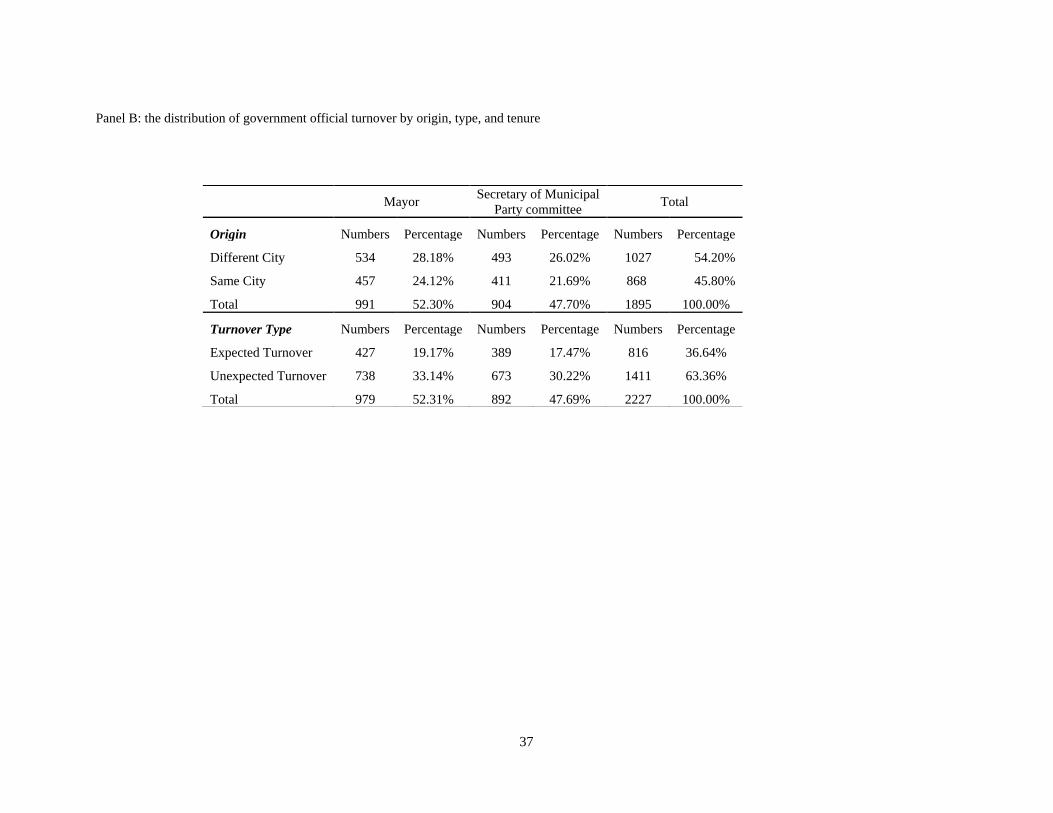
139, and 129 turnovers, respectively. Panel B of Table 1 presents the distribution of government
official turnovers in terms of origin, type, and tenure. Some new officials’ origin cannot be
confirmed and thus the number of samples in Panel B is less than those of Panel A. About 54.20%
of the new appointees are from different cities and 63.36% are unexpected turnovers (i.e., the
23
new official is taking over someone else’s position in the middle of the typical five-year
appointment). Appendix B presents the detail classification of expected and unexpected
turnovers.
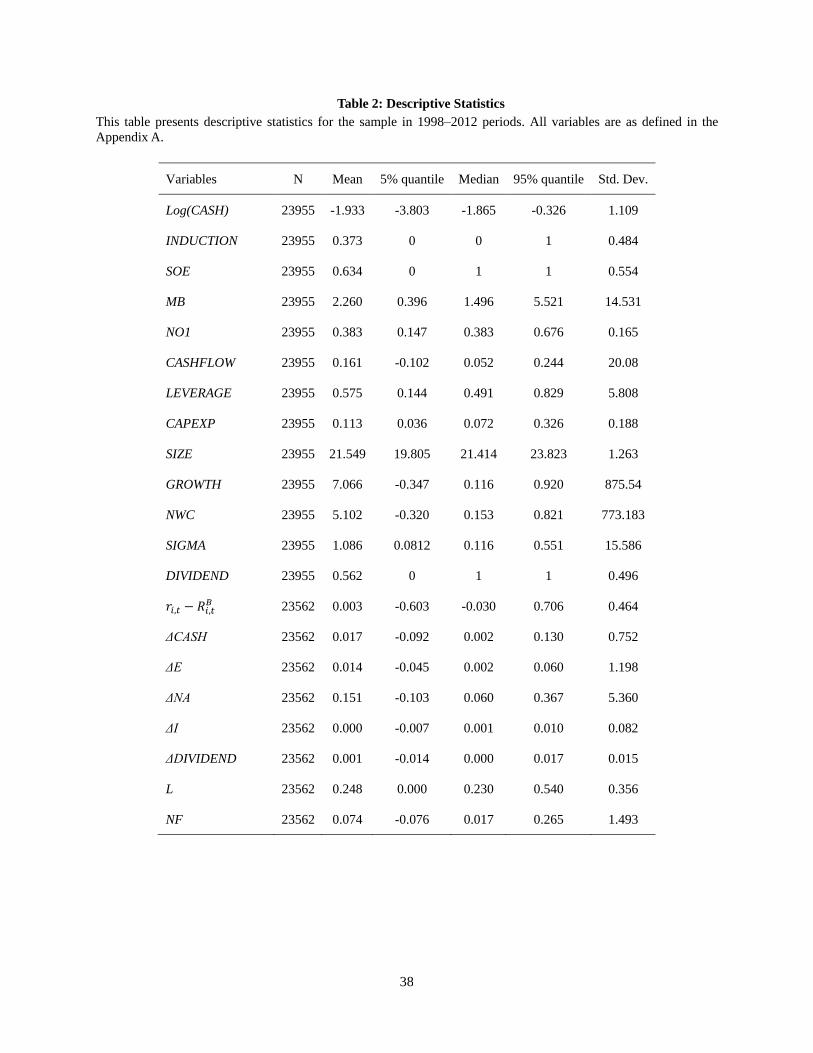
The descriptive statistics in Table 2 provide an overview of the sample. Among the
23,955 firm-year observations, 37.3% experienced a government official turnover during the
sample period. For state ownership, 63.4% of the firm–years are those of SOEs.
4.2. Effect of political uncertainty on cash holdings
4.2.1 Baseline results
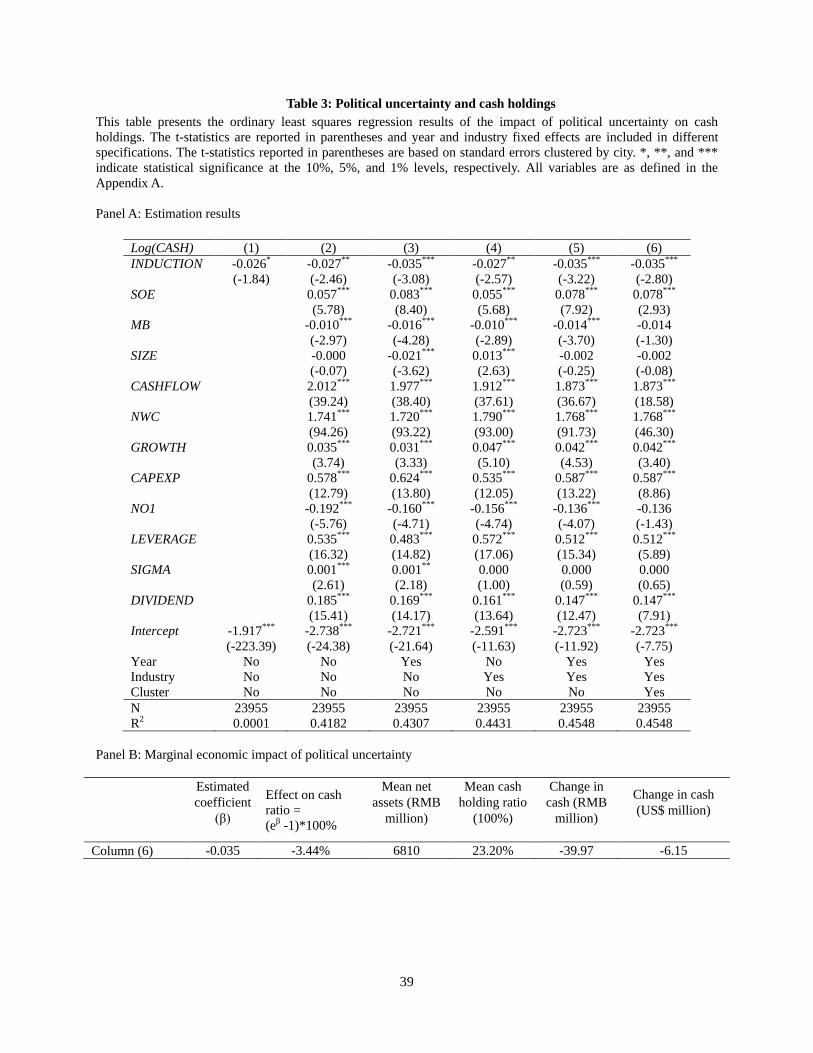
We present the results of Equation (1) in Table 3. For robustness, we use six different
empirical models to study the impact of political uncertainty on cash holdings. These models are
based on different combinations of year, industry, and cluster effects, as well as a simplified
model in Column (1). Consistently across all six models, the coefficients of INDUCTION are
negative and significant at the 1%, 5%, or 10% level, suggesting that firms hold less cash during
periods of political uncertainty. Our findings support H1B, not H1A. Politicians play a grabbing
hand to expropriate cash from firms. Other control variables, if significant, carry the expected
signs. For instance, the coefficients of SOE, CASHFLOW, NWC, CAPEXP, LEVERAGE, SIGMA,
and DIVIDEND are all positive and significant, while those of MB and NO1 are negative and
significant. The signs are consistent with intuition. For instance, when a firm is a state-owned, it
needs to respond quickly to the central government’s initiatives and therefore holds more cash as
a precaution. Similarly, when a firm has greater cash flow (CASHFLOW), net working capital
(NWC), or capital expenditures (CAPEXP) or needs to pay dividends (DIVIDEND), it holds more
cash.
24
Besides being statistically significant, the impact of political uncertainty on a firm’s cash
holdings is also economically significant. For instance, the coefficient of INDUCTION in
Column (6) is -0.035. For an average firm with 6,810 million RMB total net assets, the decrease
in cash holdings is 39.97 million RMB (or US$6.15 million) in the year of a new government
official appointment.
4.2.2 Robustness checks
4.2.2.1 Alternative measures of dependent variables and a sub-sample analysis
Panel A of Table 4 presents the results for Equation (1) using different measures for the
cash ratio: Log (CASH2), excess cash (EXCESSCASH)5, a sub-sample without firms in the four
major cities of Beijing, Shanghai, Tianjin, and Chongqing, and incorporate additional control
factors in a city economy (GDP growth, lag value of city GDP growth, and the ratio of city-level
investment to its GDP). We do not report the coefficients of the control variables in Equation (1)
for brevity. All columns show that the coefficients of INDUCTION are negative and significant at
the 5% or 1% level, suggesting that political uncertainty has a negative impact on cash holdings.
4.2.2.2 Matched sample
As a second robustness check, we use a matched sample approach. In Column (1) of
Panel B of Table 4, we match each treatment firm (a firm facing political uncertainty) with a
control firm (a firm in another city without government official turnover) with the closest market
value, return on assets, and total assets and with the same two-digit Standard Industrial
Classification industry code in the year of political uncertainty. Hence, we have two groups of
firms with similar fundamentals but the treatment firms face political uncertainty. Thus, we can
control for other factors that could affect a firm’s cash holdings. The variable MATCH is an
indicator variable equal to one if firm i is a treatment firm (with political uncertainty involved)
5 We follow the method in Opler et al. (1999) and Fresard and Salva (2010).
25
and zero if it is a control firm. The coefficients of MATCH are negative and significant at the 5%
or 1% level in all columns in Panel B, indicating that when a firm is located in a city with
political uncertainty, it reduces its cash holdings relative to a control firm.
4.2.2.3 Placebo tests
Panel C of Table 4 presents the results of placebo tests for robustness. Specifically, for
each political uncertainty event due to government official turnover, we assume that the event
recurs for the same firm in the next three years in the same city. We set up a simulated dummy
variable for each year (using the same procedure as for INDUCTION). The three dummy
variables are denoted INDUCTION1, INDUCTION2, and INDUCTION3 for years t + 1, t + 1,
and t + 3, respectively. Then, we use these simulated variables to replace INDUCTION and
conduct the regression for the main results in Table 4 for each of the three simulated variables. If
political uncertainty is the cause of the decrease in cash holdings, we expect the coefficients of
INDUCTION1, INDUCTION2, and INDUCTION3 not be significant. It is because in years t + 1,
t + 1, and t + 3, political uncertainty is no longer exists and thus the firm does not make
significant changes to its cash holdings in subsequent years. The findings in Panel C of Table 4
show that the coefficients of INDUCTION1, INDUCTION2, and INDUCTION3 are, as expected,
not significant. Hence, political uncertainty matters in cash holdings decisions.
4.2.2.4 Different forms of appointment
We examine the possible different impact in new government official appointment as
mayor only, Communist Party secretary only, or both. The results are presented in Panel D of
Table 4. The coefficients of the corresponding variables (INDUCTION_Mayor,
INDUCTION_Secretary and INDUCTION_Both) are negative and significant at 5% or 1% level,
which is consistent with those in Table 3.
26
4.3 Related results
If the grabbing hand hypothesis of politician explains a firm’s cash holding decisions, we
would expect factors that contribute to diminishing uncertainty about the new appointee to
alleviate the relation. Ceteris paribus, we expect firms to face less political uncertainty if the new
appointee is from the same city rather than from a different one. Panel A of Table 5 presents the
results for political appointees of the same versus different city. As expected, if the appointee is
from a different city (Columns (2) and (4)), INDUCTION is negative and significant. The
marginal economic effect is a decrease of 59.99 million RMB (about US$9.23 million) in cash
for mayor and a decrease of 64.39 million RMB (about US$9.91 million) for party secretary. In
contrast, the results in Columns (1) and (3) do not show a significant relation between
INDUCTION and Log (CASH) when the appointee is from the same city.
Some city officials receive their new appointments unexpectedly. Ceteris paribus,
unexpected political appointments leave a firm no time to react to the political uncertainty.
Therefore, we expect such unexpected new appointments to have no effect on a firm’s cash
holdings. In contrast, if the new appointment is expected, then the political uncertainty is also
expected. Hence, we predict that only expected new appointments will have an impact on cash
holdings. The results are presented in Panel B of Table 5. In Column (1), for an expected political
appointment of mayor, the political uncertainty variable, INDUCTION, has a negative sign and is
significant at the 1% level, while in Column (2), for an unexpected appointment of mayor, the
same variable is not significant. The marginal economic effect in Column (1) is a decrease of
66.59 million RMB (about US$10.24 million) in cash. We find qualitatively similar results for
party secretary appointment in Columns (3) and (4).
27
The findings in both Panels A and B of Table 5 suggest that political uncertainty matters.
When political uncertainty is alleviated, its impact on cash holdings becomes insignificant.
4.4 Expropriation risk, political uncertainty, and cash holdings
The robust results in Sections 4.2 and 4.3 show that the grabbing hand hypothesis
explains the negative impact of political uncertainty on cash holdings. If the grabbing hand
hypothesis prevails, we expect several expropriation risk factors in the literature (e.g., Stulz,
2005) should moderate the relation between political uncertainty and cash holdings. We partition
the full sample into sub-samples along the four expropriation risk factors (PC, SCALE, DD, and
DEFICIT) discussed in Section 3.2.2.2 and reexamine Equation (1). We expect that in
sub-samples in which (a) firms’ executives are not politically connected (PC = 0), (b) firms are
small (SCALE = 0), (c) firms have small changes in debt level (DD = 0); and (d) firms are
located in high fiscal deficit cities (DEFICIT = 0), the negative impact of political uncertainty on
cash holdings will remain strong because a firm with such characteristics face a high
expropriation risk. In contrast, for sub-samples where PC = 1, SCALE = 1, DD = 1, and
DEFICIT = 1, we expect the relation between political uncertainty and cash holdings to be
weaker due to a low expropriation risk. We present the findings in Panel A of Table 6. As
expected, for the sub-samples with PC = 0, SCALE = 0, DD = 0, and DEFICIT = 0 in Columns
(2), (4), (6), and (8), respectively, the coefficients of INDUCTION are negative and significant at
the 1% or 5% level, which is consistent with the results in Table 3. In contrast, in Columns (1),
(3), (5), and (7), the same coefficients are insignificant. In sum, these expropriation risk factors
moderate the relation between political uncertainty and cash holdings.
Similarly, when there is an exogenous political climate change, we expect the relation
between political uncertainty and cash holding changes. In the 18th
National Congress of the
28
Communist Party of China on November 8, 2012, China President Xi Jinping strongly advocated
the anti-corruption. Hence, we expect the relation between political uncertainty and cash holding
is weaker after 2012. We present the findings in Panel B of Table 6. As expected, the
coefficient of INDUCTION is negative and significant at 5% level in 2012 or early in Column (1)
but the same coefficient is insignificant in 2013 and 2014.
4.5 Twin agency problem
We use the control-ownership wedge, analyst coverage, and auditor quality to partition
the full sample into sub-samples to examine Equation (1). We expect firms with strong twin
agency conflicts (i.e., with a large control-ownership wedge, no analyst coverage, and a non-Big
4 auditor) to exhibit a negative relation between political uncertainty and cash holdings under the
grabbing hand hypothesis. These firms with bad agency conflicts have plenty of economic rent
available for political extraction. In a period of political uncertainty, these firms reduce cash
holdings to minimize the expropriation risk. The results in Table 7 show that the coefficients of
INDUCTION are, as expected, negative and significant at the 1% or 5% level in Columns (2), (4),
and (6). In contrast, the sub-samples with smaller twin agency conflicts in Columns (1), (3), and
(5) do not yield significant coefficients for INDUCTION. The marginal economic effects of
political uncertainty in Columns (2), (4), and (6) are -74.23 million RMB, -58.89 million RMB,
and -32.09 million RMB, respectively. Our findings are consistent with Stulz’s (2005) prediction.
4.6 Political uncertainty and the market value of cash holdings
We present the results on political uncertainty and the market value of cash holdings in
Panel A of Table 8 using Equation (2). Similar to Table 3, we provide four different models using
various combinations of year and industry effects. The coefficients of the interaction variable
(INDUCTION*ΔCASHt) are negative and significant at the 10% level in three out of four models,
29
suggesting changes in cash holdings during periods of political uncertainty are negatively
correlated with firm excess stock returns. That is, the market value of cash decreases with
political uncertainty, which is consistent with a grabbing hand hypothesis of politician. In terms
of economic significance in Panel B, the model in Column (4) shows that, for an average firm
facing (not facing) political uncertainty, the marginal value of cash is 0.504 (0.646) for every one
RMB.
4.7 Where does the cash go?
When a firm reduces its cash holdings, it is interesting to examine where the cash goes.
Caprio et al. (2013) show that firms in highly corrupted countries hide their cash by acquiring
more assets and/or paying out dividends. Interestingly, in contrast, Julio and Yook (2012) and An
et al. (2015) document that firms reduce their investments during periods of political uncertainty.
In addition to investments and dividend decisions, we explore a third possibility, the use of
related party transactions (RPTs), to hide cash. Specifically, we use two RPTs: (a) RPTs as a
buyer minus the amount as a seller scaled by the firm’s total assets (NETRPT) and (b) RPTs as a
buyer scaled by the firm’s total assets (BUYRPT). The variable BUYRPT measures a firm’s RPTs
without adjusting for its role as a seller, while NETRPT makes this adjustment. Within BUYRPT
and NETRPT accounting rules, Chinese firms are required to identify RPTs as involving, for
example, goods, assets, and leasing. The last RPT category is that of “others,” that is, the firm
provides no explanation of the RPT. Similar in spirit to Jiang et al. (2010), who use “other
receivables” to measure tunneling by large shareholders, we use the others category of RPTs to
gauge a firm’s intention to hide its cash holdings.
Table 9 presents the results. We find the coefficients for both RPT variables (BUYRPT
and NETRPT) in Columns (2) and (4) to be positive and significant at 1% only for the others
30
RPT category, indicating that, during political uncertainty, a firm boosts other RPTs to hide its
cash. In contrast, when we use all RPTs, the same coefficients in Columns (1) and (3) are not
significant. Similarly, the capital expenditure and dividend payout equations in Columns (5) and
(6), respectively, do not show significant coefficients of INDUCTION, suggesting that
investments and dividend payout do not change during periods of political uncertainty.
5. Conclusions
We examine the relation between political uncertainty and cash holdings for firms in
China. China’s highly political environment provides an excellent environment to study the
helping hand versus the grabbing hand hypothesis of politician on cash holdings. We document
that during a new city government official’s first year, a firm holds less cash, which is consistent
with the grabbing hand hypothesis of politician. This finding is consistent with the political
extraction explanation of Stulz (2005) and Caprio et al. (2013). Our results are robust to
alternative measures of cash holdings, sub-samples without firms in four major cities, a matched
sample approach, and placebo tests. In addition, we report that if the newly appointed official is
from a different (the same) city, firm cash holdings decrease significantly (do not change). We
infer that the appointment of a new official from a different (the same) city means greater (less)
political uncertainty for a firm and, hence, there is a need (no need) for the firm to decrease its
cash holdings. Similarly, if the appointment is expected (unexpected), the cash holdings decrease
significantly (do not change) in the first year of the appointment, suggesting firms anticipate
changes by lowering their cash levels. The additional results are consistent with the base findings
that a firm will decrease its cash holdings when it faces political uncertainty. Political uncertainty
matters.
31
Furthermore, we show that a firm facing a political extraction risk keeps significantly less
cash in a period of political uncertainty if (a) it does not have politically connected executives,
(b) it is smaller, (c) it has less debt, or (d) it is located in a city with high fiscal deficit. Our
findings suggest several moderating factors related to a firm’s vulnerability to political extraction
in the relation between cash holdings and political uncertainty. In addition, during a period of
strong anti-corruption campaign in 2013 and 2014, the relation between political uncertainty and
cash holding becomes insignificant. Consistent with Stulz’s (2005) prediction, we also report that
when a firm has strong twin agency conflicts, it holds less cash during political uncertainty
periods than firms with weak agency conflicts, suggesting that firms with bad agency problems
are susceptible to political extraction and its executives and/or major shareholders have more
resources (especially cash) at their disposal in normal times. When the firm anticipates political
uncertainty and believes the newly appointed official may extend a grabbing hand, it reduces its
cash holdings as a strategic response. Lastly, our extended results suggest that the market value
of cash holdings is significantly negative during periods of political uncertainty, suggesting that
the market value of cash to a firm is lower due to the potential loss of cash to political extraction.
We document that a firm hides its cash by moving it to related firms via RPTs instead of using it
to acquire fixed assets or pay out large dividends. Overall, our findings are consistent with the
grabbing hand hypothesis of politician. Firms reduce their cash holdings in cities with new
government official appointments.
32
References
Almeida, H., Campello, M., Weisbach, M.S., 2004. The cash flow sensitivity of cash, Journal of
Finance, 59, 1777-1804.
An, H., Chen, Y., Luo, D., Zhang, T., 2015. Political uncertainty and corporate investment:
Evidence from China. Working paper, the University of Dayton.
Ayyagari, M., Demirguc-Kunt, A., Maksimovic, V., 2010. Formal versus informal finance:
Evidence from China. Review of Financial Studies, 23, 3048–3097.
Bates, T.W., Kahle, K.M., Stulz, R.M., 2009. Why do U.S. firms hold so much more cash than
they used to? Journal of Finance, 64, 1985–2021.
Baumol, W.J., 1952. The transactions demand for cash: An inventory theoretic approach.
Quarterly Journal of Economics, 66, 545–556.
Becker, B., Ivković, Z., Weisbenner, S., 2011. Local dividend clienteles. Journal of Finance, 66,
655–684.
Bertrand, M., Karmarz, F., Schoar, A., Thesmar, D., 2006. Politicians, firms, and the political
business cycle: Evidence from France. Working paper, University of Chicago.
Bo, Z., 1996. Economic performance and political mobility: Chinese provincial leaders. Journal
of Contemporary China, 5(12), 135–154.
Brockman, P., Rui, O.M., Zou, H., 2013. Institutions and the performance of politically
connected M&As. Journal of International Business Studies, 44, 833–852.
Bu, D., Hu, F., Lin, P.T., Zhang, C., 2015. Political uncertainty, institutions, and accounting
conservatism: Evidence from the provincial official turnover in China. Working paper,
Hong Kong Polytechnic University.
Bunkanwanicha, P., Wiwattanakantang, Y., 2009. Big business owners in politics. Review of
Financial Studies, 22, 2133–2168.
Caprio, L., Faccio, M., McConnell, J.J., 2013. Sheltering corporate assets from political
extraction. Journal of Law, Economics, & Organization, 29, 332–354.
Chen, H., Tang, S., Wu, D., Yang, D., 2015a. The political dynamics of corporate tax avoidance:
The Chinese experience. Working paper, Chinese University of Hong Kong.
Chen, T., Harford, J., Lin, C., 2015b. Do analysts matter for governance? Evidence from natural
experiments. Journal of Financial Economics, 115, 383–410.
33
Claessens, S., Djankov, S., Lang, L.H.P., 2000. The separation of ownership and control in East
Asian corporations. Journal of Financial Economics, 58, 81–112.
Claessens, S., Feijen, E., Laeven, L., 2008. Political connections and preferential access to
finance: The role of campaign contributions. Journal of Financial Economics, 88,
554–580.
Correia, M.M., 2014. Political connections and SEC enforcement. Journal of Accounting and
Economics, 57, 241–262.
Cull, R., Xu, L.C., 2005. Institutions, ownership, and finance: The determinants of profit
reinvestment among Chinese firms. Journal of Financial Economics, 77, 117–146.
Dittmar, A., Mahrt-Smith, J., 2007. Corporate governance and the value of cash holdings. Journal
of Financial Economics, 83, 599–634.
Dittmar, A., Mahrt-Smith, J., Servaes, H., 2003. International corporate governance and
corporate cash holdings. Journal of Financial and Quantitative Analysis, 38, 111–33.
D’Mello, R., Krishnaswami, S., Larkin, P.J., 2008, Determinants of corporate cash holdings:
Evidence from spin-offs, Journal of Banking and Finance, 32, 1209-1220
Faccio, M., 2006. Politically connected firms. American Economic Review, 96, 369–386.
Faccio, M., McConnell, J.J., Masulis, R.W., 2006. Political connections and corporate bailouts.
Journal of Finance, 61, 2597–2635.
Fan, J., Wong, T. J., Zhang, T., 2007. Politically-connected CEOs, corporate governance and
post-IPO performance of China’s partially privatized firms. Journal of Financial
Economics, 26, 85–95.
Fan, J.P.H., Rui, O.M., Zhao, M., 2008. Public governance and corporate finance: Evidence from
corruption cases. Journal of Comparative Economics, 36, 343–364.
Faulkender, M., Wang, R., 2006. Corporate financial policy and the value of cash. Journal of
Finance, 61, 1957–1990.
Firth, M., Rui, O. M., Wu, W., 2011. Cooking the books: Recipes and costs of falsified financial
statements in China. Journal of Corporate Finance, 17, 371–390.
Fisman, R., 2001. Estimating the value of political connections. American Economic Review, 91,
1095–1102.
Francis, B., I. Hasan, and H. Wang, 2014. Banking deregulation, consolidation, and corporate
cash holdings: U.S. evidence, Journal of Banking and Finance, 41, 45-56.
34
Fresard, L., Salva, C., 2010. The value of excess cash and corporate governance: Evidence from
US cross-listings. Journal of Financial Economics, 98, 359–384.
Frye, T., Shleifer, A., 1997. The invisible hand and the grabbing hand, American Economic
Review Papers and Proceedings, 87, 354-358.
Gul, F.A., Cheng, L.T.W., Leung, T.Y., 2011. Perks and the informativeness of stock prices in the
Chinese market. Journal of Corporate Finance, 17, 1410–1429.
Gul, F.A., Kim, J.B., Qiu, A.A., 2010. Ownership concentration, foreign shareholding, audit
quality, and stock price synchronicity: Evidence from China. Journal of Financial
Economics, 95, 425–442.
Harford, J., Mansi, S.A., Maxwell, W.F., 2008. Corporate governance and firm cash holdings in
the United States. Journal of Financial Economics, 87, 535–55.
Healy, P.M., Palepu, K.G., 2001. Information asymmetry, corporate disclosure, and the capital
markets: A review of the empirical disclosure literature. Journal of Accounting and
Economics, 31, 405–440.
Infante, L., Piazza, M., 2014. Political connections and preferential lending at local level: Some
evidence from the Italian credit market. Journal of Corporate Finance, 29, 246–262.
Irani, R. M., Oesch, D., 2013. Monitoring and corporate disclosure: Evidence from a natural
experiment. Journal of Financial Economics, 109, 398–418.
Jensen, M. 1986. Agency costs of free cash flow, corporate finance, and takeovers. American
Economic Review, 76, 323–329.
Jensen, M.C., Meckling, W., 1976. Theory of the firm: Managerial behavior, agency costs and
ownership structure. Journal of Financial Economics, 3, 305–360.
Jiang, G., Lee, C.M.C., Yue, H., 2010. Tunneling through intercorporate loans: The China
experience. Journal of Financial Economics, 98, 1–20.
Julio, B., Yook, Y., 2012. Political uncertainty and corporate investment cycles. Journal of
Finance, 67, 45–83.
Kim, C.S., Mauer, D.C., Sherman, A.E., 1998. The determinants of corporate liquidity: Theory
and evidence. Journal of Financial and Quantitative Analysis, 33, 335–359.
Li, H.B., Zhou, L., 2005. Political turnover and economic performance: The incentive role of
personnel control in China. Journal of Public Economics, 89, 1743–1762.
Lin, C., Lin, P., Song, F., 2010. Property rights protection and corporate R&D: Evidence from
China. Journal of Development Economics, 93, 49–62.
35
Lin, C., Ma, Y., Malatasta, P., Xuan, Y., 2011. Ownership structure and the cost of corporate
borrowing. Journal of Financial Economics, 100, 1–23.
Liu, Q., Tang, J., Tan, G.G., 2013. Does political capital create value in the IPO market?
Evidence from China. Journal of Corporate Finance, 23, 395–413.
Opler, T., Pinkowitz, L., Stulz, R.M., Williamson, R., 1999. The determinants and implications of
corporate cash holdings. Journal of Financial Economics, 52, 3–46.
Piotroski, J.D., Zhang, T., 2014. Politicians and the IPO decision: The impact of impending
political promotions on IPO activity in China. Journal of Financial Economics, 111,
111–136.
Shleifer, A., Vishny, R.W., 1994. Politicians and firms. Quarterly Journal of Economics, 109,
995–1025.
Shleifer, A., Vishny, R.W., 2002. The grabbing hand: Government pathologies and their cures.
Harvard University Press.
Stulz, R.M., 2005. The limits of financial globalization. Journal of Finance, 60, 1595–1638.
Tsang, E.W., 1998. Can guanxi be a source of sustained competitive advantage for doing
business in China? Academy of Management Executive, 12, 64–73.
Tu, G., Lin, B., Liu, F., 2013. Political connections and privatization: Evidence from China.
Journal of Accounting and Public Policy, 32,114–135.
Wu, W., Wu, C., Zhou, C., Wu, J., 2012. Political connections, tax benefits and firm performance:
Evidence from China. Journal of Accounting and Public Policy, 31, 277–300.
Xin, K.K., J.L., 1996. Guanxi: Connections as substitutes for formal institutional support.
Academy of Management Journal, 39, 1641–1658.
Xu, N., Yuan, Q., Jiang, X., Chan, K.C., 2015. Founder’s political connections, second
generation involvement, and family firm performance: Evidence from China. Journal of
Corporate Finance, 33, 243–259.
Zimmerman, J.L., 1983. Taxes and firm size. Journal of Accounting and Economics, 5, 119–149.

36
Table 1: Distribution of municipal-level government official turnover by region and year
This table presents the distribution of government official turnover events in China by province and year over the sample period 1998–2012.
Panel A: The distribution of government official turnover by region and year
Province 1998 1999 2000 2001 2002 2003 2004 2005 2006 2007 2008 2009 2010 2011 2012 2013 2014 Total
Anhui 10 10 6 16 4 13 3 7 7 5 20 3 6 6 8 15 4 143
Beijing 1 1 2 1 1 1 7
Chongqing 2 2 1 1 1 2 9
Fujian 3 4 3 4 8 8 9 2 5 6 3 3 8 6 11 2 85
Gansu 1 2 2 4 4 1 2 6 3 1 9 3 4 9 1 5 57
Guangdong 10 2 10 10 12 10 9 8 14 5 9 2 13 27 7 4 8 160
Guangxi 10 1 4 4 10 6 1 2 6 6 12 4 2 6 8 5 87
Guizhou 1 2 3 3 1 1 1 3 1 7 6 1 8 38
Hainan 2 2 2 3 1 2 1 2 1 2 18
Hebei 4 5 3 8 8 7 3 4 15 15 1 3 8 6 16 4 110
Heilongjiang 3 2 7 2 10 6 5 1 2 4 9 1 5 6 5 1 4 73
Henan 9 3 2 21 1 11 11 2 19 1 11 2 8 15 7 15 1 139
Hubei 12 6 3 2 14 10 4 3 13 5 13 3 5 10 4 12 119
Hunan 7 4 6 4 7 3 1 8 8 14 1 10 17 2 92
Jiangsu 2 1 9 18 3 12 6 2 6 5 6 1 10 8 10 5 104
Jiangxi 3 5 2 11 2 10 1 10 8 5 8 10 1 76
Jilin 5 1 7 2 2 6 1 2 5 2 1 1 6 1 2 3 47
Liaoning 8 3 14 4 2 6 10 7 8 1 10 4 12 8 4 8 4 113
Neimenggu 4 1 2 7 1 7 3 3 6 1 7 3 11 4 2 62
Ningxia 2 1 3 1 1 2 4 1 2 3 1 21
Qinghai 2 2 1 2 2 1 4 1 1 1 17
Shandong 5 4 10 17 2 1 15 9 7 3 18 4 8 103
Shanghai 1 1 1 2 2 7
Shanxi 1 2 2 4 4 3 2 4 4 4 2 5 37
Shanxi(Jin) 5 11 9 9 2 5 13 1 12 4 1 6 8 9 2 97
Sichuan 5 5 4 16 4 11 10 9 12 5 12 3 14 7 8 4 129
Tianjin 1 1 2 1 1 6
Xinjiang 6 2 3 8 3 5 3 4 6 4 7 7 8 3 6 75
Xizang 1 1 1 1 2 3 3 2 3 1 18
Yunnan 1 1 3 6 9 2 2 7 2 7 4 6 3 1 5 4 4 67
Zhejiang 9 8 1 4 9 8 10 4 3 7 9 3 6 6 6 16 2 111
Total 130 72 105 184 141 166 100 96 183 95 216 59 85 221 106 207 61 2227
37
Panel B: the distribution of government official turnover by origin, type, and tenure
Mayor
Secretary of Municipal
Party committee Total
Origin Numbers Percentage Numbers Percentage Numbers Percentage
Different City 534 28.18% 493 26.02% 1027 54.20%
Same City 457 24.12% 411 21.69% 868 45.80%
Total 991 52.30% 904 47.70% 1895 100.00%
Turnover Type Numbers Percentage Numbers Percentage Numbers Percentage
Expected Turnover 427 19.17% 389 17.47% 816 36.64%
Unexpected Turnover 738 33.14% 673 30.22% 1411 63.36%
Total 979 52.31% 892 47.69% 2227 100.00%
38
Table 2: Descriptive Statistics
This table presents descriptive statistics for the sample in 1998–2012 periods. All variables are as defined in the
Appendix A.
Variables N Mean 5% quantile Median 95% quantile Std. Dev.
Log(CASH) 23955 -1.933 -3.803 -1.865 -0.326 1.109
INDUCTION 23955 0.373 0 0 1 0.484
SOE 23955 0.634 0 1 1 0.554
MB 23955 2.260 0.396 1.496 5.521 14.531
NO1 23955 0.383 0.147 0.383 0.676 0.165
CASHFLOW 23955 0.161 -0.102 0.052 0.244 20.08
LEVERAGE 23955 0.575 0.144 0.491 0.829 5.808
CAPEXP 23955 0.113 0.036 0.072 0.326 0.188
SIZE 23955 21.549 19.805 21.414 23.823 1.263
GROWTH 23955 7.066 -0.347 0.116 0.920 875.54
NWC 23955 5.102 -0.320 0.153 0.821 773.183
SIGMA 23955 1.086 0.0812 0.116 0.551 15.586
DIVIDEND 23955 0.562 0 1 1 0.496
23562 0.003 -0.603 -0.030 0.706 0.464
ΔCASH 23562 0.017 -0.092 0.002 0.130 0.752
ΔE 23562 0.014 -0.045 0.002 0.060 1.198
ΔNA 23562 0.151 -0.103 0.060 0.367 5.360
ΔI 23562 0.000 -0.007 0.001 0.010 0.082
ΔDIVIDEND 23562 0.001 -0.014 0.000 0.017 0.015
L 23562 0.248 0.000 0.230 0.540 0.356
NF 23562 0.074 -0.076 0.017 0.265 1.493
39
Table 3: Political uncertainty and cash holdings
This table presents the ordinary least squares regression results of the impact of political uncertainty on cash
holdings. The t-statistics are reported in parentheses and year and industry fixed effects are included in different
specifications. The t-statistics reported in parentheses are based on standard errors clustered by city. *, **, and ***
indicate statistical significance at the 10%, 5%, and 1% levels, respectively. All variables are as defined in the
Appendix A.
Panel A: Estimation results
Log(CASH) (1) (2) (3) (4) (5) (6)
INDUCTION -0.026* -0.027** -0.035*** -0.027** -0.035*** -0.035***
(-1.84) (-2.46) (-3.08) (-2.57) (-3.22) (-2.80)
SOE 0.057*** 0.083*** 0.055*** 0.078*** 0.078***
(5.78) (8.40) (5.68) (7.92) (2.93)
MB -0.010*** -0.016*** -0.010*** -0.014*** -0.014
(-2.97) (-4.28) (-2.89) (-3.70) (-1.30)
SIZE -0.000 -0.021*** 0.013*** -0.002 -0.002
(-0.07) (-3.62) (2.63) (-0.25) (-0.08)
CASHFLOW 2.012*** 1.977*** 1.912*** 1.873*** 1.873***
(39.24) (38.40) (37.61) (36.67) (18.58)
NWC 1.741*** 1.720*** 1.790*** 1.768*** 1.768***
(94.26) (93.22) (93.00) (91.73) (46.30)
GROWTH 0.035*** 0.031*** 0.047*** 0.042*** 0.042***
(3.74) (3.33) (5.10) (4.53) (3.40)
CAPEXP 0.578*** 0.624*** 0.535*** 0.587*** 0.587***
(12.79) (13.80) (12.05) (13.22) (8.86)
NO1 -0.192*** -0.160*** -0.156*** -0.136*** -0.136
(-5.76) (-4.71) (-4.74) (-4.07) (-1.43)
LEVERAGE 0.535*** 0.483*** 0.572*** 0.512*** 0.512***
(16.32) (14.82) (17.06) (15.34) (5.89)
SIGMA 0.001*** 0.001** 0.000 0.000 0.000
(2.61) (2.18) (1.00) (0.59) (0.65)
DIVIDEND 0.185*** 0.169*** 0.161*** 0.147*** 0.147***
(15.41) (14.17) (13.64) (12.47) (7.91)
Intercept -1.917*** -2.738*** -2.721*** -2.591*** -2.723*** -2.723***
(-223.39) (-24.38) (-21.64) (-11.63) (-11.92) (-7.75)
Year No No Yes No Yes Yes
Industry No No No Yes Yes Yes
Cluster No No No No No Yes
N 23955 23955 23955 23955 23955 23955
R2 0.0001 0.4182 0.4307 0.4431 0.4548 0.4548
Panel B: Marginal economic impact of political uncertainty
Estimated
coefficient
(β)
Effect on cash
ratio =
(eβ -1)*100%
Mean net
assets (RMB
million)
Mean cash
holding ratio
(100%)
Change in
cash (RMB
million)
Change in cash
(US$ million)
Column (6) -0.035 -3.44% 6810 23.20% -39.97 -6.15
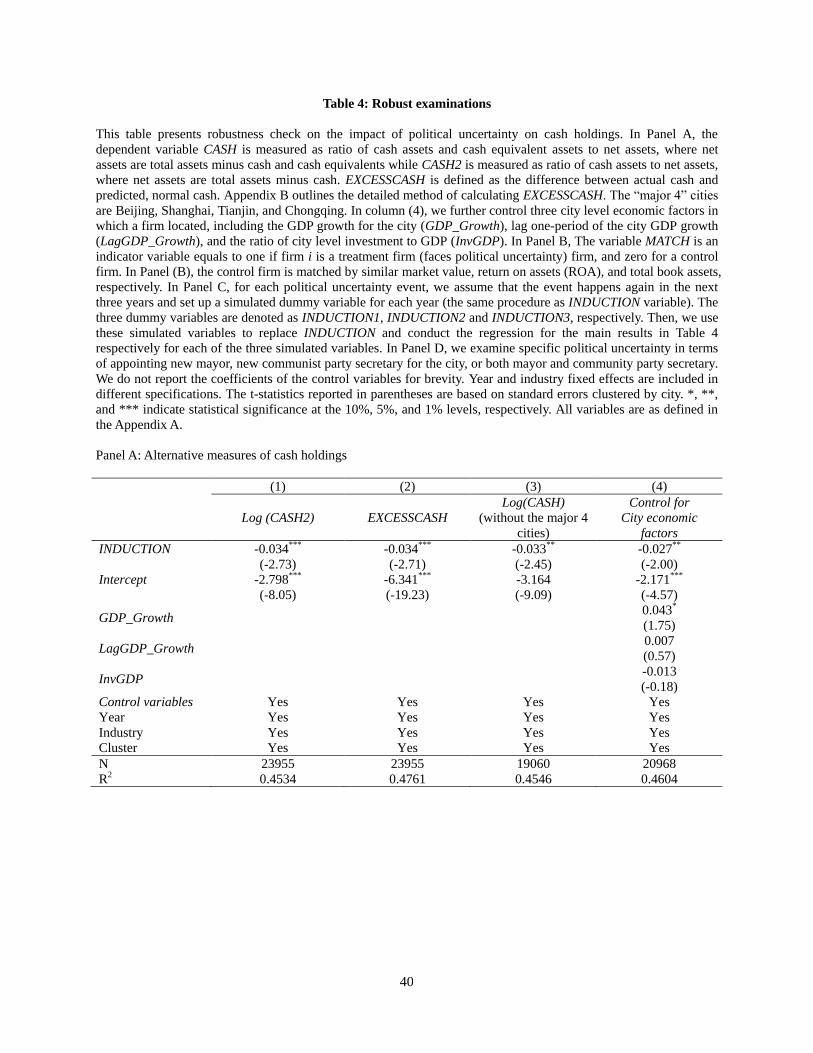
40
Table 4: Robust examinations
This table presents robustness check on the impact of political uncertainty on cash holdings. In Panel A, the
dependent variable CASH is measured as ratio of cash assets and cash equivalent assets to net assets, where net
assets are total assets minus cash and cash equivalents while CASH2 is measured as ratio of cash assets to net assets,
where net assets are total assets minus cash. EXCESSCASH is defined as the difference between actual cash and
predicted, normal cash. Appendix B outlines the detailed method of calculating EXCESSCASH. The “major 4” cities
are Beijing, Shanghai, Tianjin, and Chongqing. In column (4), we further control three city level economic factors in
which a firm located, including the GDP growth for the city (GDP_Growth), lag one-period of the city GDP growth
(LagGDP_Growth), and the ratio of city level investment to GDP (InvGDP). In Panel B, The variable MATCH is an
indicator variable equals to one if firm i is a treatment firm (faces political uncertainty) firm, and zero for a control
firm. In Panel (B), the control firm is matched by similar market value, return on assets (ROA), and total book assets,
respectively. In Panel C, for each political uncertainty event, we assume that the event happens again in the next
three years and set up a simulated dummy variable for each year (the same procedure as INDUCTION variable). The
three dummy variables are denoted as INDUCTION1, INDUCTION2 and INDUCTION3, respectively. Then, we use
these simulated variables to replace INDUCTION and conduct the regression for the main results in Table 4
respectively for each of the three simulated variables. In Panel D, we examine specific political uncertainty in terms
of appointing new mayor, new communist party secretary for the city, or both mayor and community party secretary.
We do not report the coefficients of the control variables for brevity. Year and industry fixed effects are included in
different specifications. The t-statistics reported in parentheses are based on standard errors clustered by city. *, **,
and *** indicate statistical significance at the 10%, 5%, and 1% levels, respectively. All variables are as defined in
the Appendix A.
Panel A: Alternative measures of cash holdings
(1) (2) (3) (4)
Log (CASH2) EXCESSCASH
Log(CASH)
(without the major 4
cities)
Control for
City economic
factors
INDUCTION -0.034*** -0.034*** -0.033** -0.027**
(-2.73) (-2.71) (-2.45) (-2.00)
Intercept -2.798*** -6.341*** -3.164 -2.171***
(-8.05) (-19.23) (-9.09) (-4.57)
GDP_Growth 0.043*
(1.75)
LagGDP_Growth 0.007
(0.57)
InvGDP -0.013
(-0.18)
Control variables Yes Yes Yes Yes
Year Yes Yes Yes Yes
Industry Yes Yes Yes Yes
Cluster Yes Yes Yes Yes
N 23955 23955 19060 20968
R2 0.4534 0.4761 0.4546 0.4604
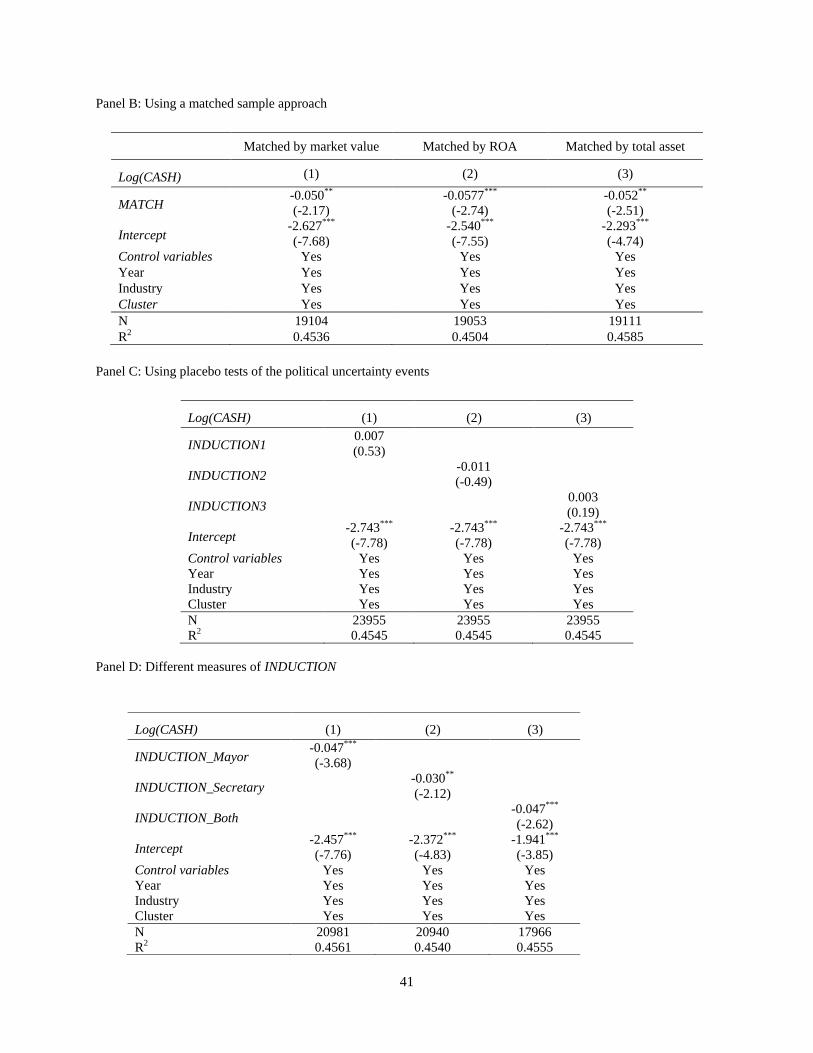
41
Panel B: Using a matched sample approach
Matched by market value Matched by ROA Matched by total asset
Log(CASH) (1) (2) (3)
MATCH -0.050** -0.0577*** -0.052**
(-2.17) (-2.74) (-2.51)
Intercept -2.627*** -2.540*** -2.293***
(-7.68) (-7.55) (-4.74)
Control variables Yes Yes Yes
Year Yes Yes Yes
Industry Yes Yes Yes
Cluster Yes Yes Yes
N 19104 19053 19111
R2 0.4536 0.4504 0.4585
Panel C: Using placebo tests of the political uncertainty events
Log(CASH) (1) (2) (3)
INDUCTION1 0.007
(0.53)
INDUCTION2 -0.011
(-0.49)
INDUCTION3 0.003
(0.19)
Intercept -2.743*** -2.743*** -2.743***
(-7.78) (-7.78) (-7.78)
Control variables Yes Yes Yes
Year Yes Yes Yes
Industry Yes Yes Yes
Cluster Yes Yes Yes
N 23955 23955 23955
R2 0.4545 0.4545 0.4545
Panel D: Different measures of INDUCTION
Log(CASH) (1) (2) (3)
INDUCTION_Mayor -0.047***
(-3.68)
INDUCTION_Secretary -0.030**
(-2.12)
INDUCTION_Both -0.047***
(-2.62)
Intercept -2.457*** -2.372*** -1.941***
(-7.76) (-4.83) (-3.85)
Control variables Yes Yes Yes
Year Yes Yes Yes
Industry Yes Yes Yes
Cluster Yes Yes Yes
N 20981 20940 17966
R2 0.4561 0.4540 0.4555
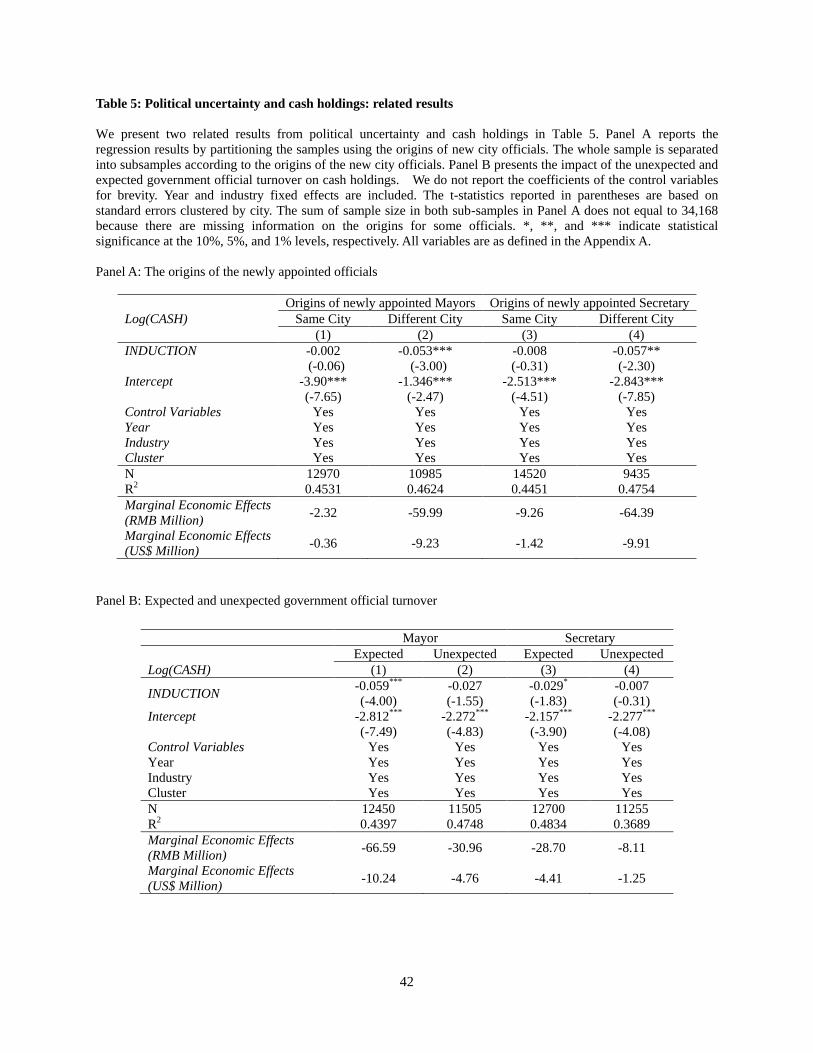
42
Table 5: Political uncertainty and cash holdings: related results
We present two related results from political uncertainty and cash holdings in Table 5. Panel A reports the
regression results by partitioning the samples using the origins of new city officials. The whole sample is separated
into subsamples according to the origins of the new city officials. Panel B presents the impact of the unexpected and
expected government official turnover on cash holdings. We do not report the coefficients of the control variables
for brevity. Year and industry fixed effects are included. The t-statistics reported in parentheses are based on
standard errors clustered by city. The sum of sample size in both sub-samples in Panel A does not equal to 34,168
because there are missing information on the origins for some officials. *, **, and *** indicate statistical
significance at the 10%, 5%, and 1% levels, respectively. All variables are as defined in the Appendix A.
Panel A: The origins of the newly appointed officials
Log(CASH)
Origins of newly appointed Mayors Origins of newly appointed Secretary
Same City Different City Same City Different City
(1) (2) (3) (4)
INDUCTION -0.002 -0.053*** -0.008 -0.057**
(-0.06) (-3.00) (-0.31) (-2.30)
Intercept -3.90*** -1.346*** -2.513*** -2.843***
(-7.65) (-2.47) (-4.51) (-7.85)
Control Variables Yes Yes Yes Yes
Year Yes Yes Yes Yes
Industry Yes Yes Yes Yes
Cluster Yes Yes Yes Yes
N 12970 10985 14520 9435
R2 0.4531 0.4624 0.4451 0.4754
Marginal Economic Effects
(RMB Million) -2.32 -59.99 -9.26 -64.39
Marginal Economic Effects
(US$ Million) -0.36 -9.23 -1.42 -9.91
Panel B: Expected and unexpected government official turnover
Mayor Secretary
Expected Unexpected Expected Unexpected
Log(CASH) (1) (2) (3) (4)
INDUCTION -0.059*** -0.027 -0.029* -0.007
(-4.00) (-1.55) (-1.83) (-0.31)
Intercept -2.812*** -2.272*** -2.157*** -2.277***
(-7.49) (-4.83) (-3.90) (-4.08)
Control Variables Yes Yes Yes Yes
Year Yes Yes Yes Yes
Industry Yes Yes Yes Yes
Cluster Yes Yes Yes Yes
N 12450 11505 12700 11255
R2 0.4397 0.4748 0.4834 0.3689
Marginal Economic Effects
(RMB Million) -66.59 -30.96 -28.70 -8.11
Marginal Economic Effects
(US$ Million) -10.24 -4.76 -4.41 -1.25
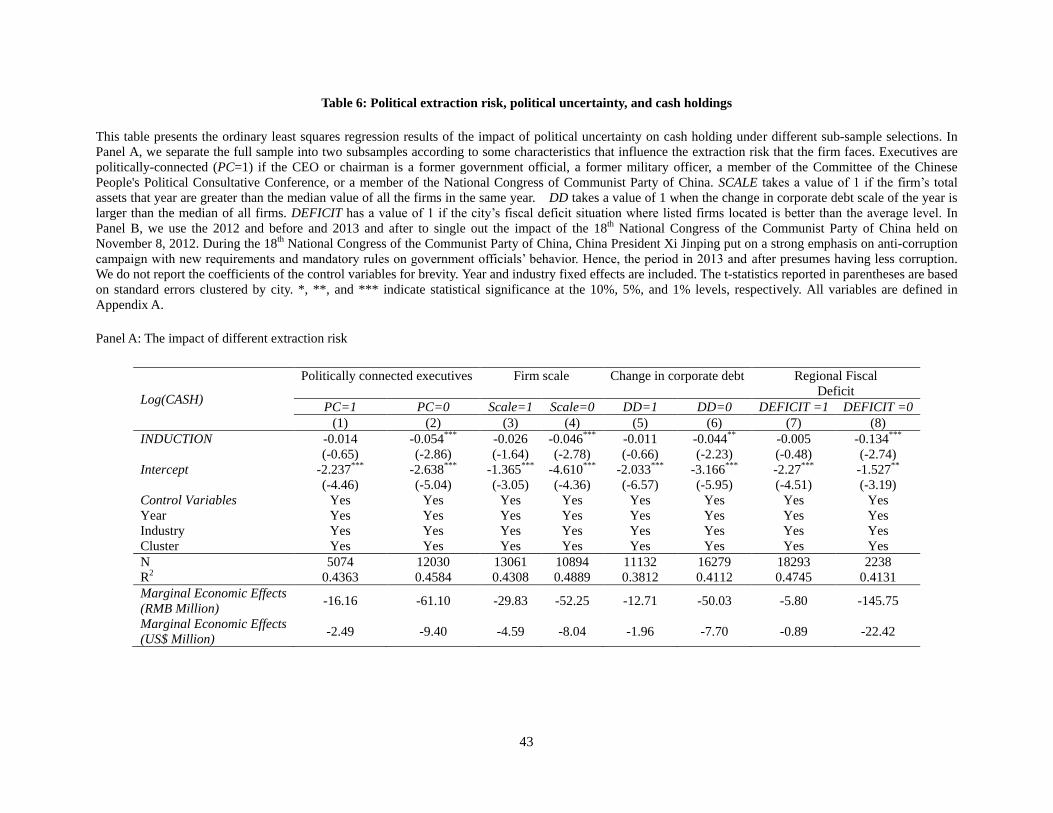
43
Table 6: Political extraction risk, political uncertainty, and cash holdings
This table presents the ordinary least squares regression results of the impact of political uncertainty on cash holding under different sub-sample selections. In
Panel A, we separate the full sample into two subsamples according to some characteristics that influence the extraction risk that the firm faces. Executives are
politically-connected (PC=1) if the CEO or chairman is a former government official, a former military officer, a member of the Committee of the Chinese
People's Political Consultative Conference, or a member of the National Congress of Communist Party of China. SCALE takes a value of 1 if the firm’s total
assets that year are greater than the median value of all the firms in the same year. DD takes a value of 1 when the change in corporate debt scale of the year is
larger than the median of all firms. DEFICIT has a value of 1 if the city’s fiscal deficit situation where listed firms located is better than the average level. In
Panel B, we use the 2012 and before and 2013 and after to single out the impact of the 18th National Congress of the Communist Party of China held on
November 8, 2012. During the 18th National Congress of the Communist Party of China, China President Xi Jinping put on a strong emphasis on anti-corruption
campaign with new requirements and mandatory rules on government officials’ behavior. Hence, the period in 2013 and after presumes having less corruption.
We do not report the coefficients of the control variables for brevity. Year and industry fixed effects are included. The t-statistics reported in parentheses are based
on standard errors clustered by city. *, **, and *** indicate statistical significance at the 10%, 5%, and 1% levels, respectively. All variables are defined in
Appendix A.
Panel A: The impact of different extraction risk
Log(CASH)
Politically connected executives Firm scale Change in corporate debt Regional Fiscal
Deficit
PC=1 PC=0 Scale=1 Scale=0 DD=1 DD=0 DEFICIT =1 DEFICIT =0
(1) (2) (3) (4) (5) (6) (7) (8)
INDUCTION -0.014 -0.054*** -0.026 -0.046*** -0.011 -0.044** -0.005 -0.134***
(-0.65) (-2.86) (-1.64) (-2.78) (-0.66) (-2.23) (-0.48) (-2.74)
Intercept -2.237*** -2.638*** -1.365*** -4.610*** -2.033*** -3.166*** -2.27*** -1.527**
(-4.46) (-5.04) (-3.05) (-4.36) (-6.57) (-5.95) (-4.51) (-3.19)
Control Variables Yes Yes Yes Yes Yes Yes Yes Yes
Year Yes Yes Yes Yes Yes Yes Yes Yes
Industry Yes Yes Yes Yes Yes Yes Yes Yes
Cluster Yes Yes Yes Yes Yes Yes Yes Yes
N 5074 12030 13061 10894 11132 16279 18293 2238
R2 0.4363 0.4584 0.4308 0.4889 0.3812 0.4112 0.4745 0.4131
Marginal Economic Effects
(RMB Million) -16.16 -61.10 -29.83 -52.25 -12.71 -50.03 -5.80 -145.75
Marginal Economic Effects
(US$ Million) -2.49 -9.40 -4.59 -8.04 -1.96 -7.70 -0.89 -22.42
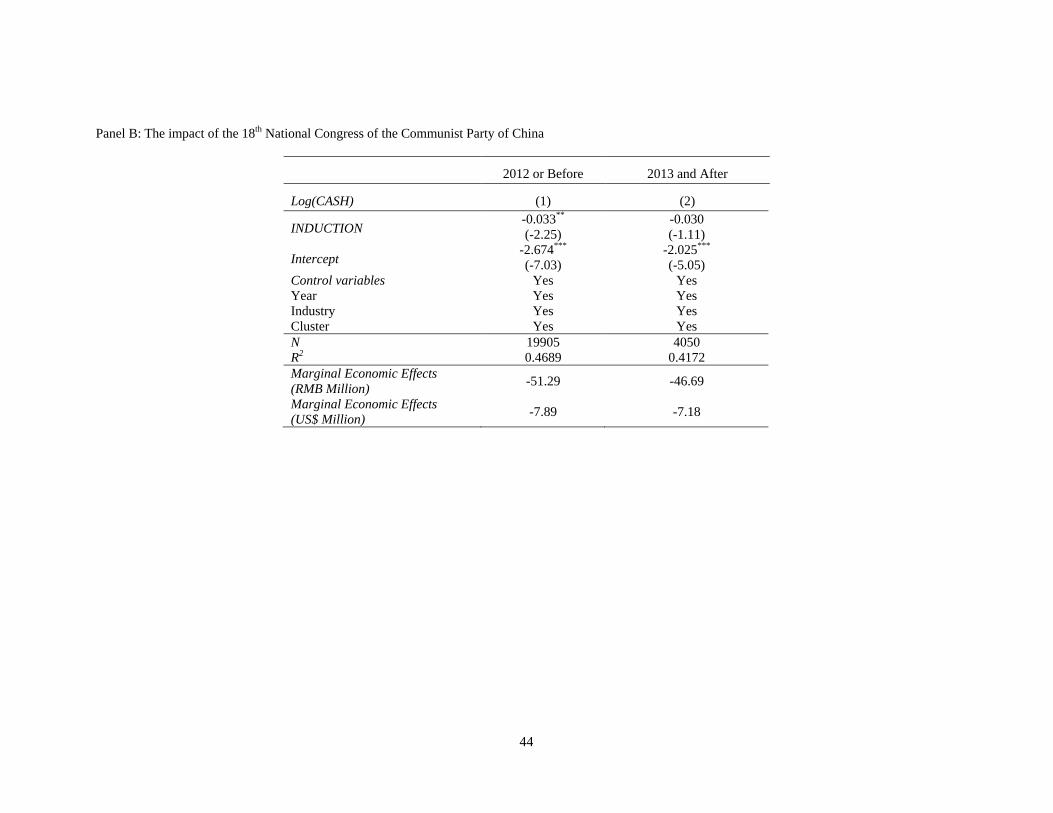
44
Panel B: The impact of the 18th National Congress of the Communist Party of China
2012 or Before 2013 and After
Log(CASH) (1) (2)
INDUCTION -0.033** -0.030
(-2.25) (-1.11)
Intercept -2.674*** -2.025***
(-7.03) (-5.05)
Control variables Yes Yes
Year Yes Yes
Industry Yes Yes
Cluster Yes Yes
N 19905 4050
R2 0.4689 0.4172
Marginal Economic Effects
(RMB Million) -51.29 -46.69
Marginal Economic Effects
(US$ Million) -7.89 -7.18
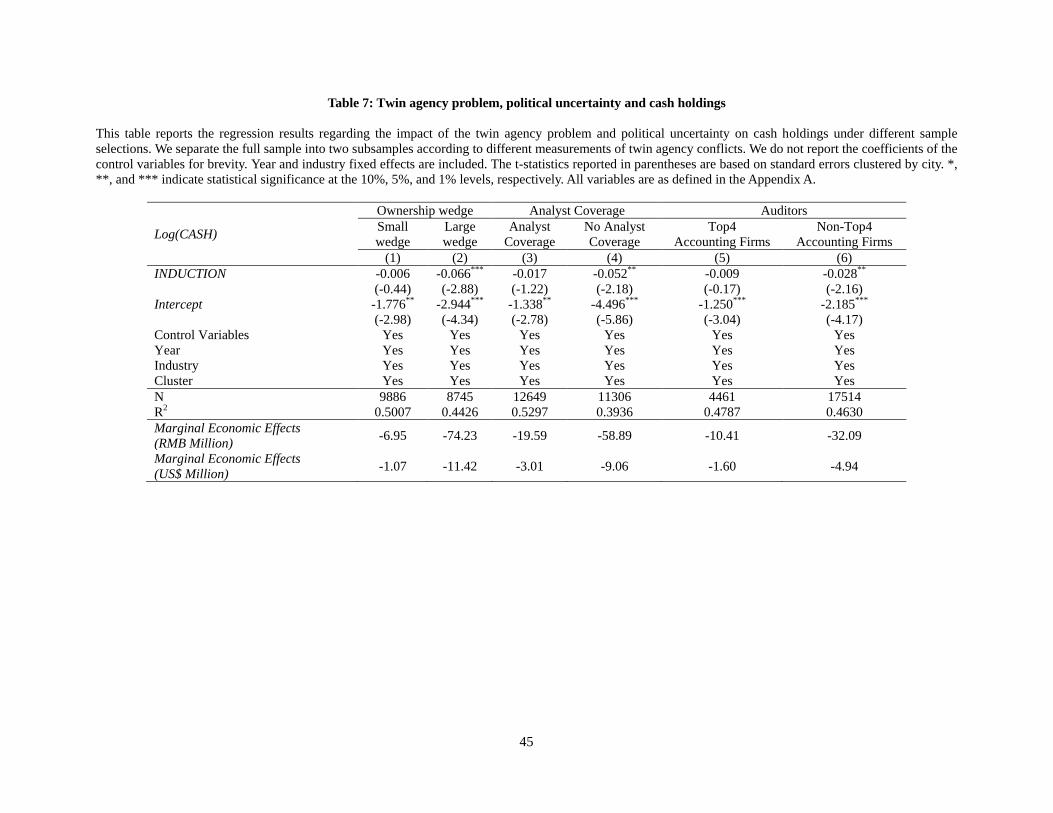
45
Table 7: Twin agency problem, political uncertainty and cash holdings
This table reports the regression results regarding the impact of the twin agency problem and political uncertainty on cash holdings under different sample
selections. We separate the full sample into two subsamples according to different measurements of twin agency conflicts. We do not report the coefficients of the
control variables for brevity. Year and industry fixed effects are included. The t-statistics reported in parentheses are based on standard errors clustered by city. *,
**, and *** indicate statistical significance at the 10%, 5%, and 1% levels, respectively. All variables are as defined in the Appendix A.
Log(CASH)
Ownership wedge Analyst Coverage Auditors
Small
wedge
Large
wedge
Analyst
Coverage
No Analyst
Coverage
Top4
Accounting Firms
Non-Top4
Accounting Firms
(1) (2) (3) (4) (5) (6)
INDUCTION -0.006 -0.066*** -0.017 -0.052** -0.009 -0.028**
(-0.44) (-2.88) (-1.22) (-2.18) (-0.17) (-2.16)
Intercept -1.776** -2.944*** -1.338** -4.496*** -1.250*** -2.185***
(-2.98) (-4.34) (-2.78) (-5.86) (-3.04) (-4.17)
Control Variables Yes Yes Yes Yes Yes Yes
Year Yes Yes Yes Yes Yes Yes
Industry Yes Yes Yes Yes Yes Yes
Cluster Yes Yes Yes Yes Yes Yes
N 9886 8745 12649 11306 4461 17514
R2 0.5007 0.4426 0.5297 0.3936 0.4787 0.4630
Marginal Economic Effects
(RMB Million) -6.95 -74.23 -19.59 -58.89 -10.41 -32.09
Marginal Economic Effects
(US$ Million) -1.07 -11.42 -3.01 -9.06 -1.60 -4.94
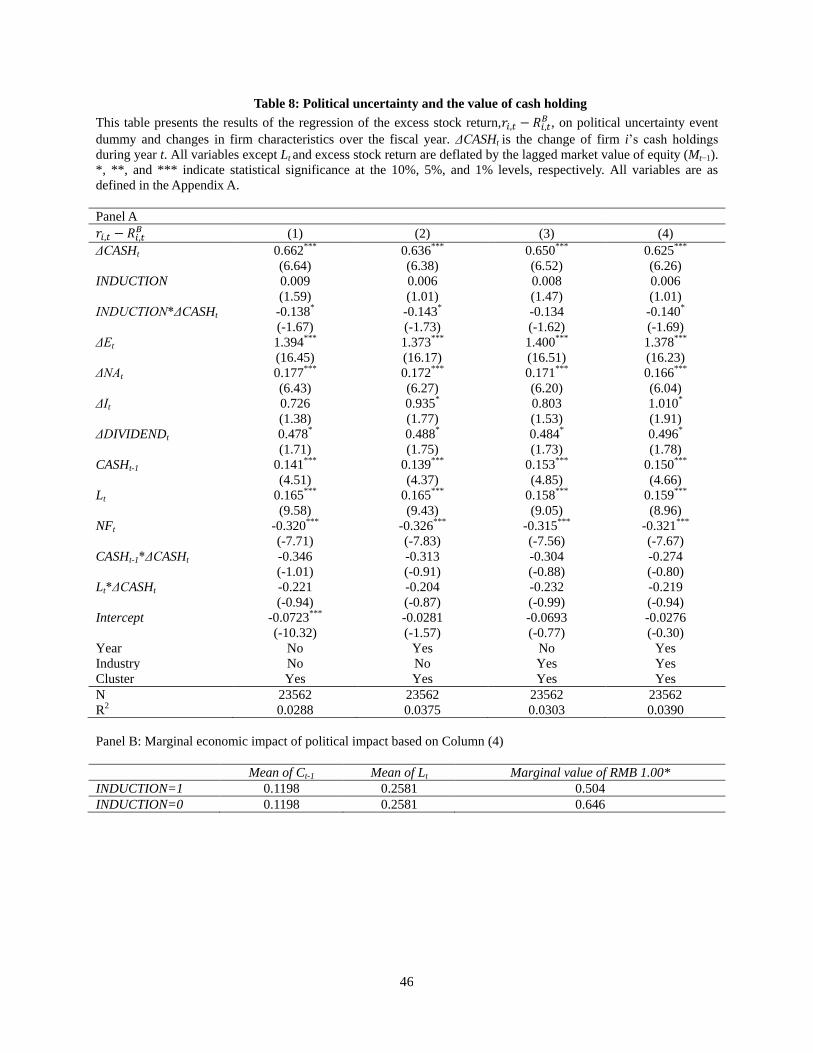
46
Table 8: Political uncertainty and the value of cash holding
This table presents the results of the regression of the excess stock return, , on political uncertainty event
dummy and changes in firm characteristics over the fiscal year. ΔCASHt is the change of firm i’s cash holdings
during year t. All variables except Lt and excess stock return are deflated by the lagged market value of equity (Mt−1).
*, **, and *** indicate statistical significance at the 10%, 5%, and 1% levels, respectively. All variables are as
defined in the Appendix A.
Panel A
(1) (2) (3) (4)
ΔCASHt 0.662*** 0.636*** 0.650*** 0.625***
(6.64) (6.38) (6.52) (6.26)
INDUCTION 0.009 0.006 0.008 0.006
(1.59) (1.01) (1.47) (1.01)
INDUCTION*ΔCASHt -0.138* -0.143* -0.134 -0.140*
(-1.67) (-1.73) (-1.62) (-1.69)
ΔEt 1.394*** 1.373*** 1.400*** 1.378***
(16.45) (16.17) (16.51) (16.23)
ΔNAt 0.177*** 0.172*** 0.171*** 0.166***
(6.43) (6.27) (6.20) (6.04)
ΔIt 0.726 0.935* 0.803 1.010*
(1.38) (1.77) (1.53) (1.91)
ΔDIVIDENDt 0.478* 0.488* 0.484* 0.496*
(1.71) (1.75) (1.73) (1.78)
CASHt-1 0.141*** 0.139*** 0.153*** 0.150***
(4.51) (4.37) (4.85) (4.66)
Lt 0.165*** 0.165*** 0.158*** 0.159***
(9.58) (9.43) (9.05) (8.96)
NFt -0.320*** -0.326*** -0.315*** -0.321***
(-7.71) (-7.83) (-7.56) (-7.67)
CASHt-1*ΔCASHt -0.346 -0.313 -0.304 -0.274
(-1.01) (-0.91) (-0.88) (-0.80)
Lt*ΔCASHt -0.221 -0.204 -0.232 -0.219
(-0.94) (-0.87) (-0.99) (-0.94)
Intercept -0.0723*** -0.0281 -0.0693 -0.0276
(-10.32) (-1.57) (-0.77) (-0.30)
Year No Yes No Yes
Industry No No Yes Yes
Cluster Yes Yes Yes Yes
N 23562 23562 23562 23562
R2 0.0288 0.0375 0.0303 0.0390
Panel B: Marginal economic impact of political impact based on Column (4)
Mean of Ct-1 Mean of Lt Marginal value of RMB 1.00*
INDUCTION=1 0.1198 0.2581 0.504
INDUCTION=0 0.1198 0.2581 0.646
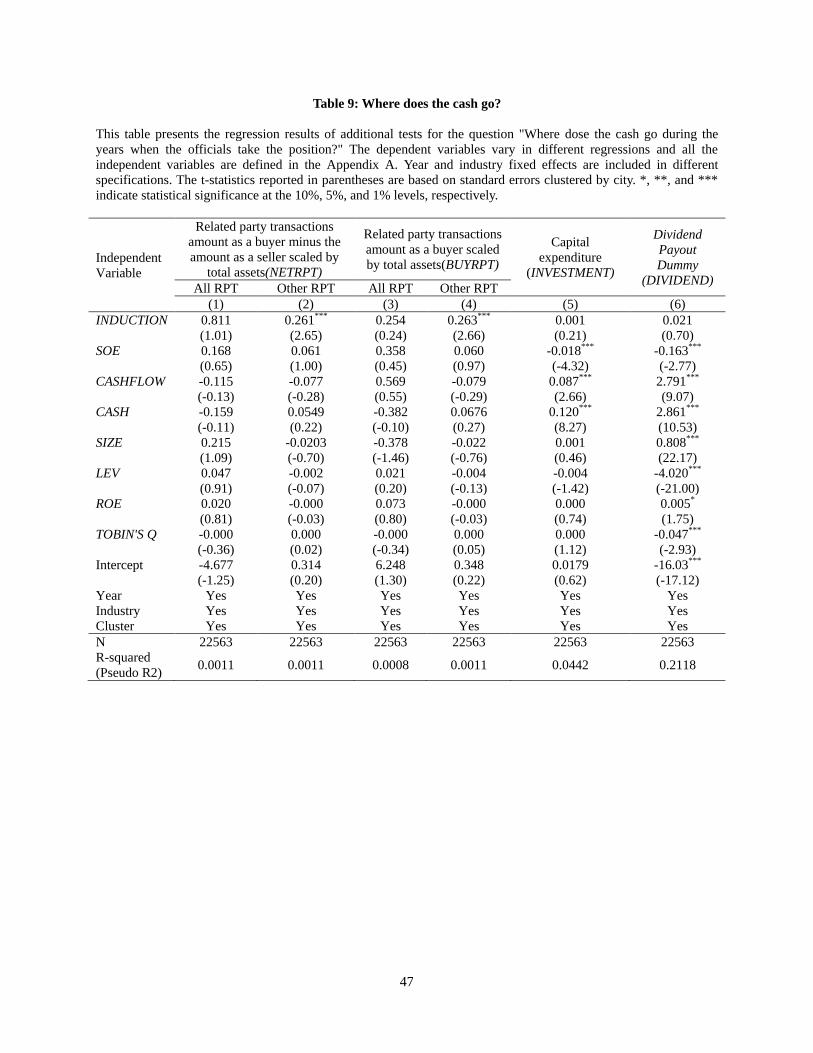
47
Table 9: Where does the cash go?
This table presents the regression results of additional tests for the question "Where dose the cash go during the
years when the officials take the position?" The dependent variables vary in different regressions and all the
independent variables are defined in the Appendix A. Year and industry fixed effects are included in different
specifications. The t-statistics reported in parentheses are based on standard errors clustered by city. *, **, and ***
indicate statistical significance at the 10%, 5%, and 1% levels, respectively.
Independent
Variable
Related party transactions
amount as a buyer minus the
amount as a seller scaled by
total assets(NETRPT)
Related party transactions
amount as a buyer scaled
by total assets(BUYRPT)
Capital
expenditure
(INVESTMENT)
Dividend
Payout
Dummy
(DIVIDEND) All RPT Other RPT All RPT Other RPT
(1) (2) (3) (4) (5) (6)
INDUCTION 0.811 0.261*** 0.254 0.263*** 0.001 0.021
(1.01) (2.65) (0.24) (2.66) (0.21) (0.70)
SOE 0.168 0.061 0.358 0.060 -0.018*** -0.163***
(0.65) (1.00) (0.45) (0.97) (-4.32) (-2.77)
CASHFLOW -0.115 -0.077 0.569 -0.079 0.087*** 2.791***
(-0.13) (-0.28) (0.55) (-0.29) (2.66) (9.07)
CASH -0.159 0.0549 -0.382 0.0676 0.120*** 2.861***
(-0.11) (0.22) (-0.10) (0.27) (8.27) (10.53)
SIZE 0.215 -0.0203 -0.378 -0.022 0.001 0.808***
(1.09) (-0.70) (-1.46) (-0.76) (0.46) (22.17)
LEV 0.047 -0.002 0.021 -0.004 -0.004 -4.020***
(0.91) (-0.07) (0.20) (-0.13) (-1.42) (-21.00)
ROE 0.020 -0.000 0.073 -0.000 0.000 0.005*
(0.81) (-0.03) (0.80) (-0.03) (0.74) (1.75)
TOBIN'S Q -0.000 0.000 -0.000 0.000 0.000 -0.047***
(-0.36) (0.02) (-0.34) (0.05) (1.12) (-2.93)
Intercept -4.677 0.314 6.248 0.348 0.0179 -16.03***
(-1.25) (0.20) (1.30) (0.22) (0.62) (-17.12)
Year Yes Yes Yes Yes Yes Yes
Industry Yes Yes Yes Yes Yes Yes
Cluster Yes Yes Yes Yes Yes Yes
N 22563 22563 22563 22563 22563 22563
R-squared
(Pseudo R2) 0.0011 0.0011 0.0008 0.0011 0.0442 0.2118
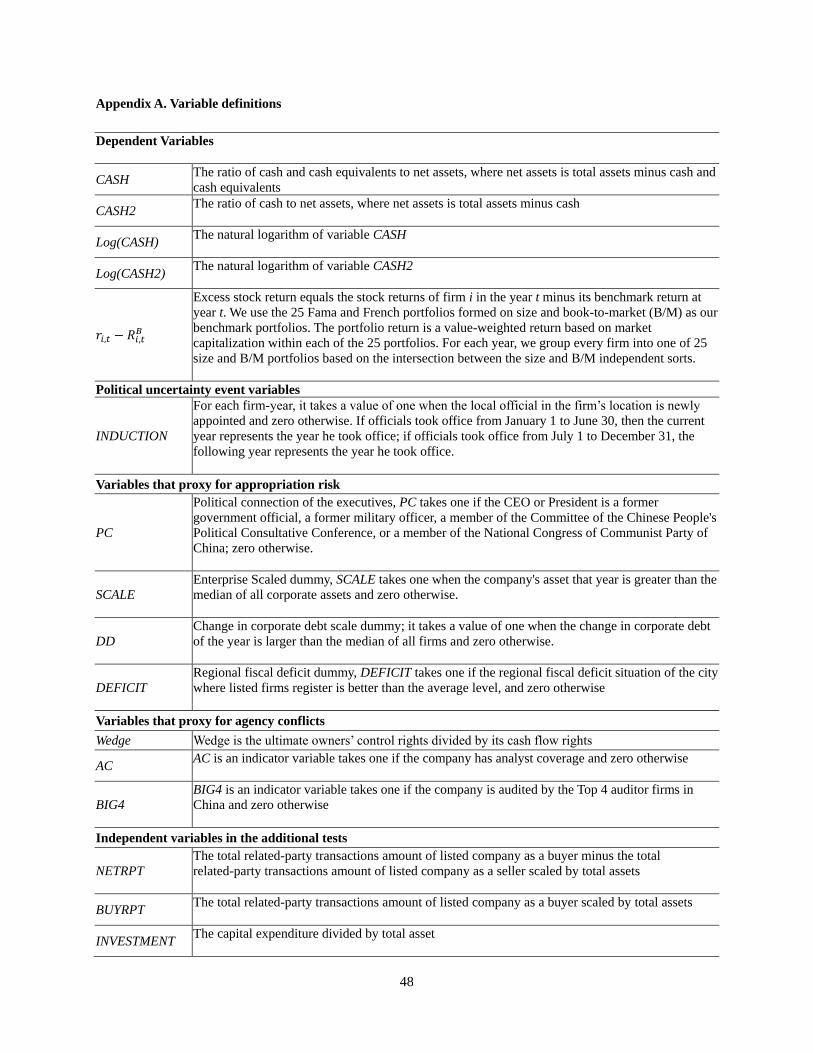
48
Appendix A. Variable definitions
Dependent Variables
CASH The ratio of cash and cash equivalents to net assets, where net assets is total assets minus cash and
cash equivalents
CASH2 The ratio of cash to net assets, where net assets is total assets minus cash
Log(CASH) The natural logarithm of variable CASH
Log(CASH2) The natural logarithm of variable CASH2
Excess stock return equals the stock returns of firm i in the year t minus its benchmark return at
year t. We use the 25 Fama and French portfolios formed on size and book-to-market (B/M) as our
benchmark portfolios. The portfolio return is a value-weighted return based on market
capitalization within each of the 25 portfolios. For each year, we group every firm into one of 25
size and B/M portfolios based on the intersection between the size and B/M independent sorts.
Political uncertainty event variables
INDUCTION
For each firm-year, it takes a value of one when the local official in the firm’s location is newly
appointed and zero otherwise. If officials took office from January 1 to June 30, then the current
year represents the year he took office; if officials took office from July 1 to December 31, the
following year represents the year he took office.
Variables that proxy for appropriation risk
PC
Political connection of the executives, PC takes one if the CEO or President is a former
government official, a former military officer, a member of the Committee of the Chinese People's
Political Consultative Conference, or a member of the National Congress of Communist Party of
China; zero otherwise.
SCALE
Enterprise Scaled dummy, SCALE takes one when the company's asset that year is greater than the
median of all corporate assets and zero otherwise.
DD
Change in corporate debt scale dummy; it takes a value of one when the change in corporate debt
of the year is larger than the median of all firms and zero otherwise.
DEFICIT
Regional fiscal deficit dummy, DEFICIT takes one if the regional fiscal deficit situation of the city
where listed firms register is better than the average level, and zero otherwise
Variables that proxy for agency conflicts
Wedge Wedge is the ultimate owners’ control rights divided by its cash flow rights
AC AC is an indicator variable takes one if the company has analyst coverage and zero otherwise
BIG4
BIG4 is an indicator variable takes one if the company is audited by the Top 4 auditor firms in
China and zero otherwise
Independent variables in the additional tests
NETRPT
The total related-party transactions amount of listed company as a buyer minus the total
related-party transactions amount of listed company as a seller scaled by total assets
BUYRPT The total related-party transactions amount of listed company as a buyer scaled by total assets
INVESTMENT The capital expenditure divided by total asset
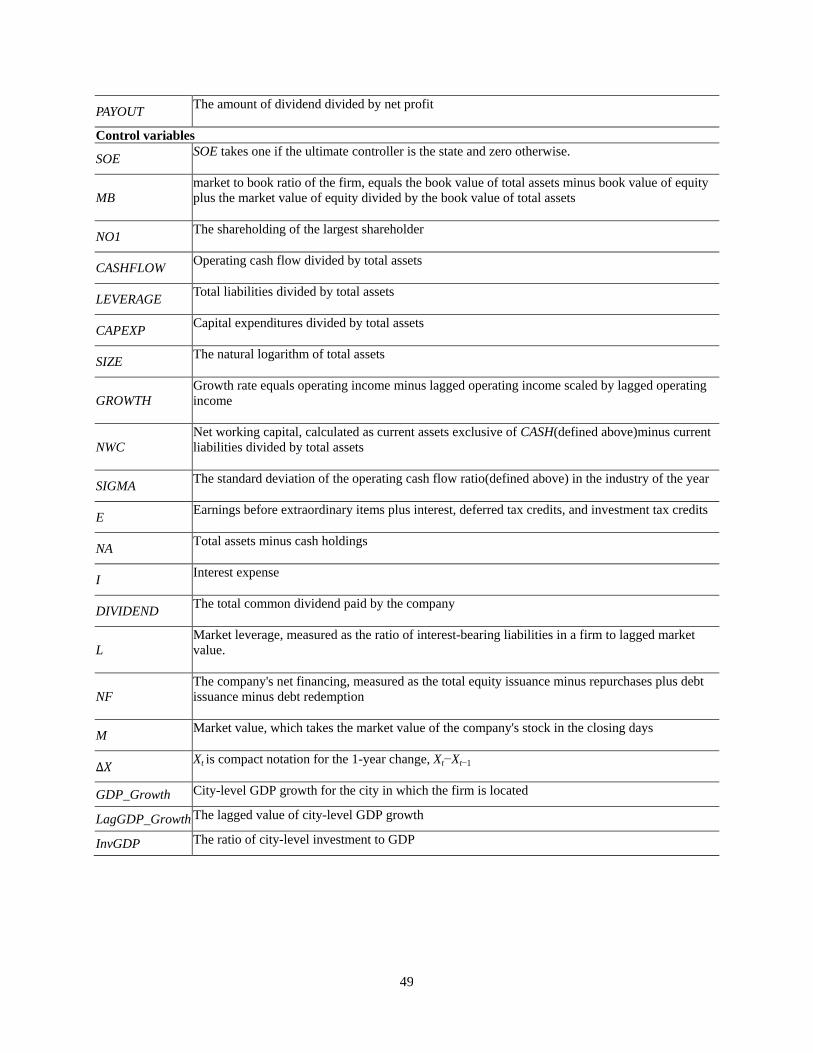
49
PAYOUT The amount of dividend divided by net profit
Control variables
SOE SOE takes one if the ultimate controller is the state and zero otherwise.
MB
market to book ratio of the firm, equals the book value of total assets minus book value of equity
plus the market value of equity divided by the book value of total assets
NO1 The shareholding of the largest shareholder
CASHFLOW Operating cash flow divided by total assets
LEVERAGE Total liabilities divided by total assets
CAPEXP Capital expenditures divided by total assets
SIZE The natural logarithm of total assets
GROWTH
Growth rate equals operating income minus lagged operating income scaled by lagged operating
income
NWC
Net working capital, calculated as current assets exclusive of CASH(defined above)minus current
liabilities divided by total assets
SIGMA The standard deviation of the operating cash flow ratio(defined above) in the industry of the year
E Earnings before extraordinary items plus interest, deferred tax credits, and investment tax credits
NA Total assets minus cash holdings
I Interest expense
DIVIDEND The total common dividend paid by the company
L
Market leverage, measured as the ratio of interest-bearing liabilities in a firm to lagged market
value.
NF
The company's net financing, measured as the total equity issuance minus repurchases plus debt
issuance minus debt redemption
M Market value, which takes the market value of the company's stock in the closing days
Xt is compact notation for the 1-year change, Xt−Xt−1
GDP_Growth City-level GDP growth for the city in which the firm is located
LagGDP_Growth The lagged value of city-level GDP growth
InvGDP The ratio of city-level investment to GDP

50
Appendix B. Measuring EXCESSCASH
This appendix describes the methodology for estimating excess cash holdings. We first estimate a
regression to establish the normal cash holdings for a firm. This step is based on the work of Opler et al. (1999) and
Fresard and Salva (2010). Excess cash is then defined as the difference between actual cash and predicted, normal
cash. In other words, it is the residual of a cash levels regression.
We use several specifications to estimate normal cash, and none of our eventual conclusions about the
effect of corporate governance on the value and the use of excess cash are affected materially by the choice. The
following regression equation represents our main specification; its residuals (including firm fixed effects) are used
to calculate excess cash:
Where FCF is Operating Income minus Interest minus Taxes over year t divided by net assets. All the other
variables are defined in Appendix A.
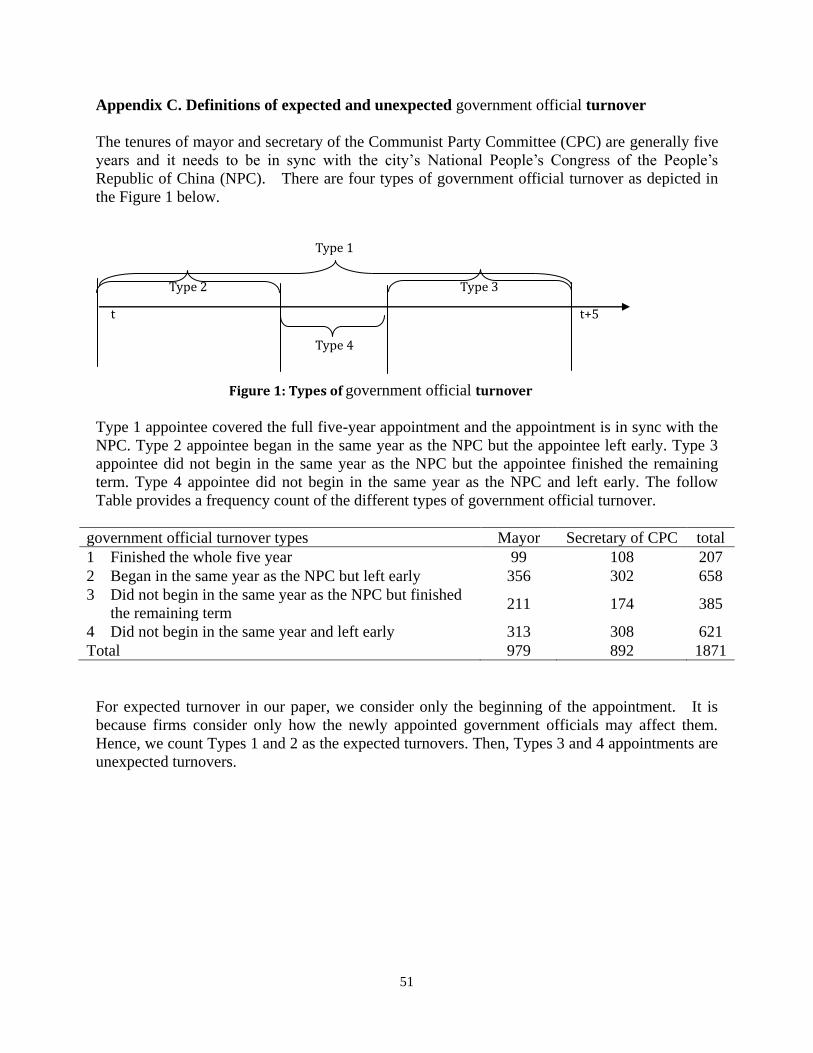
51
Appendix C. Definitions of expected and unexpected government official turnover
The tenures of mayor and secretary of the Communist Party Committee (CPC) are generally five
years and it needs to be in sync with the city’s National People’s Congress of the People’s
Republic of China (NPC). There are four types of government official turnover as depicted in
the Figure 1 below.
Type 1
Type 2 Type 3
t t+5
Type 4
Figure 1: Types of government official turnover
Type 1 appointee covered the full five-year appointment and the appointment is in sync with the
NPC. Type 2 appointee began in the same year as the NPC but the appointee left early. Type 3
appointee did not begin in the same year as the NPC but the appointee finished the remaining
term. Type 4 appointee did not begin in the same year as the NPC and left early. The follow
Table provides a frequency count of the different types of government official turnover.
government official turnover types Mayor Secretary of CPC total
1 Finished the whole five year 99 108 207
2 Began in the same year as the NPC but left early 356 302 658
3 Did not begin in the same year as the NPC but finished
the remaining term 211 174 385
4 Did not begin in the same year and left early 313 308 621
Total 979 892 1871
For expected turnover in our paper, we consider only the beginning of the appointment. It is
because firms consider only how the newly appointed government officials may affect them.
Hence, we count Types 1 and 2 as the expected turnovers. Then, Types 3 and 4 appointments are
unexpected turnovers.