Political ideology, quality at entry and the success of ... filePolitical ideology, quality at entry...
34
Political ideology, quality at entry and the success of economic reform programs Lodewijk Smets a,* , Stephen Knack b , Nadia Molenaers a a Institute of Development Policy and Management, University of Antwerp, Belgium b World Bank, Washington DC Abstract This study investigates how government ideology matters for the success of World Bank economic policy loans, which typically support market-liberalizing reforms. A simple model predicts that World Bank staff will invest more effort in designing an economic policy loan when faced with a left-wing government. Empirically, estimates from a Heckman selection model show that the quality at entry of an economic policy loan is significantly higher for governments with a left-wing party orientation. This result is robust to changes in the sample, alternative measures of ideology, different estimation techniques and the inclusion of additional control variables. Next, robust findings from estimating a recursive triangular system of equations indicate that leftist governments comply more fully with loan agreements. Results also suggest that World Bank resources are more productive – in terms of reform success – in the design of policy operations than in their supervision. Anecdotal evidence from several country cases is consistent with the finding that left-wing governments receive higher quality loans. Keywords: development policy lending, World Bank, political ideology, Heckman selection model, triangular system of equations JEL codes : C24, C30, O16, O19 1. Introduction In 1980 the World Bank launched its first non-project lending instrument to support policy change in recipient countries. At that time, top management was dissatisfied with the limited influence of the Bank’s normal project lending on policies of borrowing gov- ernments. Therefore structural adjustment lending was conceived, a new lending program with which the Bank would help countries to tackle important policy deficiencies. In its early years adjustment lending mainly emphasized economic stabilization and correction of balance of payments distortions (Kapur et al., 1997). These loans, now called development * Corresponding author Email addresses: [email protected] (Lodewijk Smets), [email protected] (Stephen Knack), [email protected] (Nadia Molenaers)
Transcript of Political ideology, quality at entry and the success of ... filePolitical ideology, quality at entry...

Political ideology, quality at entry and the success of economic
reform programs
Lodewijk Smetsa,∗, Stephen Knackb, Nadia Molenaersa
aInstitute of Development Policy and Management, University of Antwerp, BelgiumbWorld Bank, Washington DC
Abstract
This study investigates how government ideology matters for the success of World Bankeconomic policy loans, which typically support market-liberalizing reforms. A simple modelpredicts that World Bank staff will invest more effort in designing an economic policyloan when faced with a left-wing government. Empirically, estimates from a Heckmanselection model show that the quality at entry of an economic policy loan is significantlyhigher for governments with a left-wing party orientation. This result is robust to changesin the sample, alternative measures of ideology, different estimation techniques and theinclusion of additional control variables. Next, robust findings from estimating a recursivetriangular system of equations indicate that leftist governments comply more fully withloan agreements. Results also suggest that World Bank resources are more productive –in terms of reform success – in the design of policy operations than in their supervision.Anecdotal evidence from several country cases is consistent with the finding that left-winggovernments receive higher quality loans.
Keywords: development policy lending, World Bank, political ideology, Heckmanselection model, triangular system of equationsJEL codes : C24, C30, O16, O19
1. Introduction
In 1980 the World Bank launched its first non-project lending instrument to supportpolicy change in recipient countries. At that time, top management was dissatisfied withthe limited influence of the Bank’s normal project lending on policies of borrowing gov-ernments. Therefore structural adjustment lending was conceived, a new lending programwith which the Bank would help countries to tackle important policy deficiencies. In itsearly years adjustment lending mainly emphasized economic stabilization and correction ofbalance of payments distortions (Kapur et al., 1997). These loans, now called development
∗Corresponding authorEmail addresses: [email protected] (Lodewijk Smets), [email protected] (Stephen
Knack), [email protected] (Nadia Molenaers)

policy loans (DPLs), have become an important component in the financing of develop-ment operations. For instance, in fiscal year 2008 they accounted for 6.6 billion USD or 27percent of total World Bank commitments. Currently, policy lending covers a wide rangeof thematic areas, from economic policy to public sector governance.
In this study we investigate whether and how the ideology of the ruling party in govern-ment matters for the success of World Bank economic policy loans. In contrast with otherstudies on the performance of policy based lending, we consider both donor and recipientfactors at four different stages of the lending process: program quality at entry, WorldBank supervision during implementation, borrower compliance, and the overall outcomeof the program. We specifically focus on the World Bank effort in ensuring quality at entry.
We begin by reviewing the related literature on the impact of ideology on economicpolicy choice, and on the relevant strands of research investigating World Bank lendingdecisions and their outcomes. In Section 3 we present a simple model predicting thatWorld Bank staff exert more effort on average when faced with a left-wing government,which (we assume) tends to be more skeptical of the benefits of market-liberalizing reformssupported by economic policy loans. This prediction is empirically tested in section 4 wherewe estimate a Heckman selection model using a dataset of 182 (uncensored) observationsrunning from 1985 until 2008. We find robust evidence that the quality at entry of economicpolicy loans is significantly higher for countries with left-wing governments. Incumbenttenure is also positively associated with quality at entry. Geopolitical motives also appearto matter, as countries voting in line with the G-7 in the UN General Assembly (UNGA)tend to receive more and higher-quality programs. In the selection model voting congruenceis associated with a higher likelihood of receiving an economic policy loan. Moreover, wefind evidence that the loans these countries receive are rated more highly on quality atentry. In Section 4 we also examine how political ideology and quality at entry affectthe other stages of an economic policy loan. Estimating a recursive triangular system ofregression equations, we find that left-wing governments tend to comply more fully withloan arrangements. Looking at overall outcomes of reform programs, we find that short-term growth and initial macroeconomic conditions influence reform success. In addition tothese recipient country variables, quality at entry and World Bank supervision also matter.Higher quality at entry is positively associated with ratings on quality of supervision,borrower compliance and overall outcome success. To a lesser extent, supervision ratingsare positively related to reform success.
In Section 5 we discuss several illustrative country cases that are consistent with theargument that World Bank staff need to invest more effort preparing and negotiatingan economic policy loan when working with left-wing governments. Evidence on thesecountry cases was gathered through structured interviews with World Bank team taskleaders who managed economic policy loans in Mozambique, Zambia, Mexico and Malawi1.The Mozambican case points to cognitive processes and attitude change – in addition toinformational asymmetries and political economy considerations – as a way of explainingincreased compliance by left-wing borrowers. Finally, Section 6 summarizes and concludes.
1Interviews were conducted in August 2011 at the World Bank Headquarters in Washington D.C.
2

2. Related Literature
In examining the effect of ideology on reform, our study is related to the political econ-omy of policy change. Much work in this field2 investigates the impact of party orientationon economic policy choice. Predictions range from equilibria where parties are locked intheir ideological position (e.g. Glazer and Grofman, 1989) to studies indicating that incertain circumstances policy switches occur, i.e. the implementation of policies by partieswhose ideological position runs against such policies. For instance, Cukierman and Tom-masi (1998) show that under certain conditions a left-wing government is more likely toimplement a right-wing reform since the public has less reason to suspect that ideologicalpreferences are determining policy choice. The empirical literature3 on the associationbetween political ideology and economic outcomes concerns mainly – but not exclusively –developed countries. Most findings are consistent with the view that governments pursuepolicies in line with their ideological preferences.
If we consider economic ideology as an interconnected set of beliefs on the functioningof the economy, this paper is also associated with the growing body of literature thatlinks (cognitive) characteristics of political leaders with economic and policy outcomes.For instance, Jones and Olken (2005) find that unexpected changes in leadership affectmonetary policy as well as economic growth rates. Besley et al. (2011) provide evidencethat more educated leaders are associated with higher growth rates. Dreher et al. (2009a)show that market-liberalizing economic reforms are more likely to occur during the tenure ofa chief executive who is a former entrepreneur - particularly if he or she heads a left-winggovernment - suggesting that personal capabilities matter for reform success. Meseguer(2006) empirically demonstrates that country leaders learn from others as well as pastexperience in determining economic policy. Chai (1998) offers an interesting insight inhow beliefs affect economic policy choice in developing countries by relating the formationof ideology to cognitive dissonance4. He argues that in Western colonies indigenous pro-independence elites internalized oppositional ideology – i.e. socialism – as a way of reducingcognitive dissonance aroused by engaging in conflict with colonial rulers.
By investigating the determinants of successful development policy operations, thispaper is also related to the aid effectiveness literature. Several authors have pointed out
2A number of interesting studies in this respect are Wittman (1983), Alesina (1988), Glazer and Grof-man (1989), Alesina and Cukierman (1990), Roemer (1997), Roemer (1999), Terai (2006). Both Drazen(2000) and Persson and Tabellini (2000) provide an extensive overview on the political economy of economicreform.
3A partial listing includes Beck (1982), Bjornskov (2005), Bjornskov (2008), Bortolotti and Pinotti(2008), Dutt and Mitra (2005), Dutt and Mitra (2006) Frey and Schneider (1978), Hibbs (1977), Pitlik(2007), Potrafke (2010).
4According to the theory of cognitive dissonance, a person who behaves in a way contrary to his beliefsis motivated by resulting discomfort or anxiety to reduce this “cognitive dissonance”, e.g. by changing hisbeliefs. Cognitive dissonance theory has been widely applied in social science research. For applicationsin the field of economics, see among other Akerlof and Dickens (1982) and Gilad et al. (1987). Hirschman(1965) and James and Gutkind (1985) have applied it to claim that the coercive nature of conditional aidhinders reform.
3

that without the commitment of the recipient country the implementation of conditional aidprograms is bound to fail (see among other Dijkstra, 2002; Killick, 1997; Murshed, 2009;Svensson, 2000, 2003). With a more specific focus on recipient country characteristics,Dollar and Svensson (2000) assert that successful reform is associated with democraticallyelected governments and non-linearly with the time an incumbent has been in power andethnic fractionalization. Noorbakhsh and Paloni (2007) provide evidence that initial macro-economic conditions and economic performance during the reform program influence theprobability of compliance with World Bank conditionality. In contrast with Dollar andSvensson (2000), Malesa and Silarszky (2005) claim that factors under donor control alsomatter, and find that devoting more resources to the preparation of a development policyloan raises the probability of success. Note that the findings on the determinants of DPLsuccess are generally confirmed by the literature investigating the success factors of allWorld Bank operations, whether investment projects or adjustment programs. For anoverview of that literature, see Denizer et al. (2011).
Finally, another related literature examines the influence of powerful donors on WorldBank decision making. For instance, Dreher et al. (2009b) demonstrate that countrieswith a temporary seat in the UN Security Council receive a higher number of World Bankprojects on average. Kilby (2011) finds that project preparation time tends to be shorter forprojects in strategically important countries, potentially at the expense of project quality.Furthermore, Andersen et al. (2006) find evidence that IDA countries voting in line with theU.S. in the UN General Assembly receive higher aid volumes on average. Similarly Kilby(2009) asserts that DPL disbursements are less dependent on macroeconomic outcomesfor countries ‘friendly’ with the United States. The above findings suggest that importantdonors use the Bank’s resources to seek support of strategically relevant countries. In thenext section we elaborate on the design process of policy lending and provide a simpleformalization on how political ideology affects the quality at entry of economic reformprograms.
3. A Simple Model
In the case of World Bank development policy lending, the extension of a loan is pre-ceded by a process of identification, preparation, appraisal and negotiation. At the startof a development policy operation a consultation round is held where the IMF, relevantBank units, key donors and the concerned regional development bank discuss the policyobjectives of the borrowing country with a World Bank task team. Afterwards a conceptdocument is drafted explaining the rationale for the proposed operation. The program out-line is discussed with recipient government officials and after an internal review a programdocument is prepared. It sets out the objectives of the policy loan in terms of the specificoutcomes and design provisions. During an appraisal mission, the task team assesses theadequacy of the proposed program to achieve its stated objectives. Afterwards World Bankstaff sit together with recipient government officials to discuss and negotiate the differentloan modalities. It is only after the representatives of the borrower have signed the loanagreement that a development policy loan becomes effective. During the implementation
4

process Bank staff supervise the progress of the operation by preparing ImplementationSupervision Reports on a frequent basis5. Within six months after completion of the op-eration an initial evaluation takes place.
In this section we adapt the model from Wane (2004) to formalize the design process ofan economic policy loan. Wane showed in a two-period setup that the quality at entry ofa project is endogenous to the staff incentive system in the World Bank on the one handand the government’s capacity – i.e. its ability to screen projects – and accountabilityon the other. In adapting this model we abstract from government capacity and electoralaccountability and focus instead on another characteristic of government, namely economicideology. Specifically, we assume that ruling parties and executives associated with thepolitical “left” are more skeptical (compared to those further to the “right”) of the benefitsof market-liberalizing reforms supported by economic policy loans.
Our model, like Wane’s, is based on a two-period game where a World Bank staffteam is matched6 with a government with reservation utility U i. In the first period thestaff team designs the economic reform program which the recipient country can acceptor decline. In the second period the staff’s promotion is decided upon and the recipientcountry implements the program, if accepted.
We model the borrowing government to be one of two different types, L or R. Thegovernment will sign the loan agreement if the net benefit of the program, π(e), is at leastas high as the government’s reservation utility U i, with i = L,R. We assume that thereservation utility for a government of type i is drawn from a Normal distribution, i.e.
UL ∼ N (µL, σ) and UR ∼ N (µR, σ) with E[UL] > E[UR] > 0 (3.1)
According to 3.1, governments of type L have on average a higher reservation utility foraccepting the economic reform program. This is interpreted as reflecting their policypreferences/beliefs towards the adjustment operation. Intuitively, World Bank staff mustwork harder to “sell” an economic policy loan to government officials that tend to be moreskeptical regarding the likelihood of favorable impacts from market-liberalizing reforms.
By exerting costly effort e in designing the program, World Bank staff is able to affectthe net benefit of the DPL:
π(e) = g(e).(B − C) (3.2)
with 0 ≤ e ≤ 1, g(0) = 0, g(1) = 1 and g(e) an invertible and concave function on theinterval [0, 1]. We model the incentive system for promotion of World Bank staff based on
5For multi-tranche operations a Tranche Release Document is prepared on the basis of which thedecision is taken to release subsequent tranches.
6A DPL task team leader interviewed for this study suggested that matching World Bank staff withgovernments might not be random; for example, more capable staff members might be assigned to workwith more ‘difficult’ governments. On the other hand, to the extent higher-quality staff have more leveragein choosing their assignments, they might opt to work with less difficult governments, where their adviceis more welcome. Data limitations prevent us from measuring staff quality. Denizer et al. (2011) controlfor the impact of task leader fixed effects on project success, but our sample of policy loans is too small toimplement this approach.
5

acceptance of a loan agreement, i.e. staff will receive a salary7 S > s in period 2 if:
g(e∗).(B − C) ≥ U i (3.3)
The salary increase is assumed to be high enough for the staff to be willing to exertmaximum effort if it entails promotion8. Following Wane (2004), the staff team aims forpromotion and maximizes:
maxe{u(s) + δ[u(S).I(g(e).(B−C) ≥ U i) + u(s).(1− I(g(e).(B−C) ≥ U i)]−ψ(e)} (3.4)
with u(.) a concave utility function, s the entry salary, δ a discount rate, I(.) a 0-1 indicatorfunction and ψ(.) a convex function representing the disutility from exerting effort.
Based on 3.2, 3.3 and 3.4 the staff team exerts effort e∗ in equilibrium:
e∗ =
{g−1(
U i
B−C ) if (B − C) ≥ U i > 0
0 if (B − C) < U i or U i ≤ 0(3.5)
Proposition 1. On average, World Bank staff exerts higher effort in designing a programwhen faced with governments of type L for which (B − C) ≥ U i.
Proof. This result follows directly from 3.1 and 3.5.
Note that when (B − C) < U i World Bank staff exerts 0 effort and the governmentdeclines the program9. In other words, proposition 1 states that, for all accepted economicpolicy loans, left-wing governments on average end up with higher quality programs. Inthe next section we test this prediction.
4. Statistical Testing
4.1. Models and data
To assess the effect of political ideology on quality at entry of economic policy loans,we first estimate the following selection equation (Heckman, 1979):
P (z∗i,t > 0) = Φ(γ′wi,t) (4.1)
with z∗i,t the latent selection variable, wi,t a vector of factors influencing the access to aDPL and Φ(.) the standard normal distribution. As selection covariates10 we have included
7The salary incentive can be generalized to non-pecuniary sources of utility, such as the utility WorldBank staff receive from continued policy dialogue with high-level government officials. Arguably, the policydialogue with a left-wing government would be damaged more by a failed policy reform program, so staffhave an added incentive to design a higher-quality loan.
8This assumption holds if u(s) + δ.u(S)− ψ(1) > 0.9A case in point is post-apartheid South Africa, where the COSATU-backed ANC government for a
long time disagreed with the World Bank’s lending proposals.10We have also included party orientation as a selection variable, yet it did not turn out to influence
receipt of DPL.
6

a variable indicating the extent to which a country voted in line with the G-7 on key issuesthe year prior to selection, the inflation rate the year before selection into the program, thelogartihm of outstanding World Bank debt the year before the program became effective,the overall CPIA score11, the logarithm of population, GDP per capita. As an additionalexclusion restriction - so we are not relying only on nonlinearity of the selection model foridentification - we use distance of the country’s capital to the World Bank’s headquartersin Washington D.C. Distance is commonly found to affect aid Stromberg (2007) and hasbeen used as an exogenous instrument for aid by Chauvet et al. (2006) and Knack (2012)among others.
The coefficients of equation 4.1 were obtained by maximum likelihood estimation usingdataset running from 1985 until 2008 that contains 1966 censored and 182 uncensoredobservations. The selection variable zi,t is coded 1 if country i received an economic policyloan in year t. World Bank DPLs also support reform in other policy areas, but we excludethem from the analysis as they are less strongly identified than economic policy withleft-right ideological distinctions. Specifically, we examined the sectoral codings of DPLsand retained economic policy, private sector development and financial sector loans, whiledropping loans in other sectors such as education or health. The analysis thus focuses onreform programs targeting economic policy issues such as privatization, macroeconomicmanagement, debt reduction and financial and private sector development, i.e. the so-called “Washington Consensus” set of policies (Williamson, 1994). In robustness tests,we both expanded the sample to include loans in other policy areas, and, alternatively,restricted it to include only economic policy loans.
The outcome equation is specified as:
E[qi,t|zi,t = 1] = x′β + ρσeλ(γ′w) (4.2)
with qi,t the quality at entry, x a vector of covariates and λ the non-selection hazard com-puted as φ(γ′wi,t)/Φ(γ′wi,t). The dependent variable of the outcome equation, quality at entry,is derived from the assessment of the World Bank’s Independent Evaluation Group (IEG).The IEG rates performance at each stage of a program – Bank quality at entry, Banksupervision, borrower compliance and overall outcome – into one of six categories, rang-ing from highly unsatisfactory to highly satisfactory12. This provides us with a six-pointordered indicator for quality at entry (see table B.1 in Appendix for a detailed definition
11The Country Policy and Institutional Assessments (CPIA) are subjective ratings of 16 indicatorsupdated annually by World Bank staff, and used for allocating IDA loans.
12Although the validity of these measures might be questioned, we follow the convincing argument ofDollar and Svensson (2000, pp. 897-899) and Denizer et al. (2011, pp. 7-10) as to why the IEG outcomeassessments are acceptable measures of program success. The following arguments have been put forth: (i)the IEG is independent of the Bank’s senior management; (ii) the outcome variables are highly correlatedwith improvements in observed economic performance; (iii) IEG ratings do not significantly differ from themore in-depth and detailed “Project Performance Audit Reports”. Unfortunately, the latter ratings areavailable only for a very limited sample of DPLs. While there surely is still remaining measurement error,there is no reason to believe the IEG ratings are biased, particularly with respect to government ideology.This view is supported by interviews of experienced IEG staff members.
7

of the IEG ratings). From this information a binary indicator of program quality can beconstructed, to ensure that findings are not overly sensitive to subjective and possible un-reliable distinctions between (for example) “satisfactory”, “moderately satisfactory” and“highly satisfactory”.
The key independent variable in the outcome equation is the executive party’s orienta-tion with respect to economic policy. As a source we have used the Database of PoliticalInstitutions (DPI) (Beck et al., 2001). The authors identify the party orientation eitheras “Left”, “Center”, “Right” or “Other/No information” – coded respectively as 3, 2, 1and 0 – based on different criteria including cross-checking with multiple sources. Usingthis variable we created a dummy coded one if the party orientation of the executive partywas rated as left-wing and zero for right and center governments. As a robustness test wealso considered the three-point categorical version as well as an index of political ideologycreated by Bjornskov (2005). Other political covariates include a dummy for democracyand the time the incumbent has been in power. As a proxy for political favoritism, we haveadded a variable indicating whether the country voted in line with the G-7 in the UNGAon key issues the year prior to selection into the program13. We include the log of theloan amount to control for any effect of loan size on program quality. Finally, we includeda time trend, the log of population, the log of GDP per capita and regional dummiesas supplementary controls. As a robustness test we added the current account balance,inflation rate, ethnic fractionalization, and CPIA score at the start of the program as ad-ditional controls. The coefficients of equation 4.2 were estimated with OLS and standarderrors were adjusted for country clustering of observations. Variable definitions, sourcesand summary statistics are found in the Appendix.
In order to test how party orientation and quality at entry matter at the other stagesof an economic policy loan, we have estimated a recursive14 triangular system of regressionequations:
y1 = qδ1 + x′β1 + ε1
y2 = y1β12 + qδ2 + x′β2 + ε2
y3 = y1β13 + y2β23 + qδ3 + x′β3 + ε3
(4.3)
with q quality at entry, y1 quality of loan supervision, y2 borrower compliance and y3 overalloutcome of the program15. Next to the abovementioned covariates, we followed Noorbakhshand Paloni (2007) and included the growth rate the year after the loan agreement was
13Following Dreher and Sturm (2012), we consider the G-7 as a country group. The variable reflects theaverage G-7 vote by weighing each G-7 countries’ vote with its quota in the IMF.
14For the triangular model to be fully recursive, we assume a diagonal variance covariance matrix Σ.It is conceivable that this assumption is violated as an omitted variable may simultaneously affect theleft-hand side variables. However, a likelihood ratio test of uncorrelated errors yields a χ2 statistic of 2.87with corresponding p-value of 0.4123.
15Triangular systems assume a certain ordering of endogenous variabes in a sense that the ith equationmay contain endogenous variables whose position is lower than i (Lahiri and Schmidt, 1978). As the WorldBank formulates monitoring and evaluation arrangements in the preparation stage of the program, theysignal their supervision intentions before the start of the program. Next, part of the supervision effortincludes an evaluative review to identify problems during implementation and recommendations to resolve
8

signed, to test whether initial growth affects our outcome measures. We included theestimated nonselection hazard as an additional control. The coefficients of model 4.3 wereestimated with maximum likelihood using a dataset of 161 observations running from 1985until 2007. Standard errors were adjusted for country clustering of observations. In theremainder of this section we present our empirical findings.
4.2. Political ideology and quality at entry
In table 1, the coefficients of most included selection covariates come in significantlywhen estimating equation 4.1. Countries voting in line with the G7 have a higher proba-bility of receiving World Bank policy lending. This finding is consistent with the literatureon donor influence in international organizations. Table 1 also shows that countries withhigher outstanding World Bank debt are more likely to receive financial assistance throughpolicy lending. This result is in line with the earlier findings of Svensson (2003) and reflectsthe reasoning of Mosley et al. (1991) who claim that policy-based lending also serves toprevent default on outstanding obligations. Countries with macroeconomic distortions aremore likely to receive an economic policy loan as the coefficient on the inflation rate is sig-nificantly positive. The positive coefficient on the CPIA score is consistent with the viewthat aid is more effective in better policy environments. Table 1 also indicates that richercountries are less likely to engage with the World Bank for policy support. Finally, theexcluded instrument, distance from a country’s capital to Washington D.C., is associatedwith a significantly lower likelihood of selection, as expected.
Table 2 presents estimation results of the outcome equation. Equation 1 shows thatthe quality at entry of an economic policy loan is significantly related to ideology of thegoverning party. The quality-at-entry rating is .42 points higher (on the 1-6 scale) onaverage for left-wing governments.
Incumbent tenure also enters the model significantly, as higher-quality loans are associ-ated with longer time in office. In terms of the above model, long-lived regimes on averagehave a higher reservation utility for engaging in policy reform. A variety of reasons couldserve to explain this result16. As leadership tenure also captures the ability to build firmpolitical networks and transfer mechanisms to remain in power (Bienen and Van De Walle,1989; Bueno de Mesquita et al., 2002), negotiating costly policy reform with such regimescould require substantial time and resources.17
The proxy for donor influence is also associated with quality at entry: countries thatvoted in line with the G7 on key issues received higher quality loans on average. This result
them. For these reasons we include Bank supervision on the right hand side of the second (compliance)equation. On the other hand, it is standard operating procedure to supervise loan agreements irrespectiveof the extent of borrower compliance. Furthermore, Malesa and Silarszky (2005) find no evidence thatsupervision costs (and other donor variables) are endogenous to the probability of DPL success and explainthis by the fact that the resources for supervision are budgeted in advance. That is why we have opted toexclude compliance from the first (quality-at-entry) equation.
16See Besley and Case (2003) for a detailed literature review on how political factors affect (economic)policy choice.
17Dreher et al. (2009a) find that market-liberalizing policy reforms are inversely related to the chiefexecutive’s time in office.
9

appears to conflict with Kilby (2011), who finds that project preparation time is shorterin such countries, possibly to the detriment of project quality. However, Kilby (2011) doesnot directly test for links between project preparation time and project quality. Moreover,the samples in the two studies differ: we consider only DPLs, while DPLs comprise onlyabout one-fifth of the projects in Kilby (2011).
We tested the stability of our results in several ways. First, we checked whether resultsare robust to changes in the sample of DPLs. We restricted the sample by dropping allprivate sector and financial sector loans, leaving only the 115 observations coded as eco-nomic policy loans - i.e. those arguably most associated with ideological differences. Table2, equation 2 shows that the effect of left-wing ideology on quality at entry remains signif-icant and positive, with a larger coefficient than in equation 1. As a second modificationwe expanded the sample by adding loans from other economic sectors: agriculture, energyand mining, transport and urban development. This change increased the sample size to215 observations. For this expanded sample of loans, the coefficient for the left-ideologydummy remains positive and significant (at the 5 % level).
The association of ideology and quality at entry is also robust to alternative constructsof our ideology variable. In place of our binary variable for left-wing governments, wetested an index of political ideology, created by Bjornskov (2005). The index is constructedby considering the three largest government parties, instead of only the chief executive’sparty, and weighing their ideology with the share of seats they hold in parliament. Theresulting variable is distributed between -1 and 1, with negative values indicating a moreleft-wing party orientation. Equation 4 of table 2 indicates that high quality loans remainpositively correlated with left-wing party orientation: one standard deviation decrease inthe Bjornskov index (towards the left) is associated with an average increase of .324 pointsin quality at entry. Testing our model with DPI’s three point categorical variable did notaffect our results as equation 5 shows. As a third robustness test we constructed binaryversions of the dependent variable. Specifically, we collapsed the three lowest-performancecategories “highly unsatisfactory”, “unsatisfactory” and “moderately unsatisfactory” intoone, and similarly for the three highest-performance categories. Using this informationwe estimated equation 4.2 as a probit model. As shown in equation 6 of table 2 theresult for political ideology remains unchanged. A marginal effects analysis reveals thatthe likelihood a DPL is well-designed is 18 percent higher, other things equal, for left-winggovernments.
Finally, our results are robust to the inclusion of several additional control variables.Added regressors include ethnic fractionalization, the current account balance (as % ofGDP), inflation of consumer prices (annual %) and the overall CPIA score at the startof the program. The latter three variables collectively control for the stage of a country’sreform process, which otherwise could bias the relationship between quality at entry andpolitical ideology. In the early stages of reform, economic deficiencies are more apparentand programs are fairly straightforward to design – e.g. privatization of state-owned en-terprises, removal of trade barriers, etc. – resulting in loans with higher quality at entry.At later stages, additional reforms are likely to be more complex. If left-wing governmentsare more prevalent in the early stages of economic reform, when state control over the
10

economy remains high, the coefficient on left ideology would be biased upward. Equation7 shows that the coefficient for left ideology remains positive and significant at the 5 %level, controlling for stage of reform. Table 2 also confirms the role of tenure and donorinfluence as determinants of loan quality. In the next subsection we discuss how politicalideology and quality at entry affect the other stages of a reform program.
4.3. Ideology, quality at entry and the success of economic policy lending
Results for model 4.3 are presented in table 3. Equation 1 shows that quality at entryis positively associated with quality of World Bank supervision. A possible explanation isthat World Bank staff may be more committed to keeping a DPL on track after havinginvested substantial time and resources in preparing the program18. Other than quality atentry, none of the other covariates enter significantly.
Turning to borrower compliance (table 3, equation 2), both quality at entry and su-pervision quality are positively related to the recipient country’s effort in complying withloan agreements. Equation 2 also shows that left-wing governments comply more fullywith DPL provisions. This result is in line with the prediction of Cukierman and Tommasi(1998) that under certain circumstances19 left-wing governments enjoy more leeway in im-plementing market reforms. Other examples of ‘policy reversals’ by left-wing governments(most notably the economic reforms in Spain during 1982-1986) are found in Haggard andWebb (1994).
Equation 3 presents the coefficient estimates of the overall outcome equation. Theincluded covariates are able to explain more than 60 percent of the variation in reformoutcome. The results provide further evidence that donor effort does matter for reformsuccess: a decomposition-of-effects analysis reveals that a one point increase in qualityat entry increases the overall outcome rating more than half a point (0.574) on average.Similarly, a one point jump in quality of Bank supervision (indirectly) augments the overalloutcome by a fifth of a point (0.225) on average. These estimates suggest that the payoff –in terms of reform success – is greater in investing scarce resources in project identificationand preparation rather than in supervision of a DPL. For a given level of total resourcesinvested, overall outcome ratings for DPLs could be improved by shifting resources atthe margin from supervision to preparation. Unsurprisingly, borrower compliance alsocontributes to successful reform. Income growth in the year following DPL approval is alsopositively associated with DPL success. This finding is in line with Noorbakhsh and Paloni(2007), who argue that short term economic success helps increase credibility of the reformsand sustain adjustment programs by generating additional resources and muting political
18However, an omitted variable such as staff capacity may well affect quality at entry and supervisionin the same way. Yet, it is not uncommon in World Bank practice to have various staff teams working onthe different stages of one DPL.
19The authors identify three conditions for such a policy switch to occur: firstly, the desirability of thepolicy switch should be considerable and relatively rare. Second, policy reversals are more prone to occurwhen voters are uncertain about the government’s preferences. Finally, the outcomes of the policies underconsideration take place in the future. However, Cowen and Sutter (1998) have shown that similar policyreversals also hold under less stringent conditions.
11

opposition. The time trend variable in equation 3 is significantly negative, suggesting thatit has become increasingly difficult to achieve the major objectives of economic policy loans.The political difficulties and increasing complexity of second-generation reforms vis-a-visthe more self-implementing first generation programs provides a possible explanation forthis result (see Navia and Velasco, 2003; Rodrik, 2006). Finally, equation 3 shows that thenonselection hazard comes in significantly negative, indicating that there are unobservedfactors for which countries are selected into the program which negatively affect the overalloutcome of the program.
Tables 4 through 9 present the results from applying the abovementioned robustnesstests to the triangular model. Generally, findings from the base model are confirmed:higher quality at entry is positively associated with ratings on quality of supervision, bor-rower compliance and overall outcome success; left-wing governments comply more fullywith loan arrangements; and overall outcomes of reform are positively related to short-termgrowth and negatively affected by increasing complexity – as proxied by the time trend –and unobserved selection factors. In four of the robustness tests supervision quality comesin significantly positive in the overall outcome equation. Notice that three out of the sixrobustness tests show that the World Bank puts in more effort on average supervisingloan agreements in long-lived regimes. Also, table 9 indicates that the coefficient for theCPIA score is significantly negative in the supervision equation. This negative effect maybe explained as a substitution of World Bank supervision by partner country institutions.That is, when operating in a country where Bank staff rate policies and institutions morefavorably, they may be more inclined to trust country systems to implement loan agree-ments instead of investing heavily in supervision activities (Knack, 2012). Finally, table 9supports the view that deteriorating economic conditions can motivate governments to re-form (see e.g. Krueger, 1993; Ranis and Mahmood, 1992), as the coefficient on the currentaccount balance comes in significantly negative in the compliance and outcome equations.
5. Anecdotal Evidence
In this section we present concrete examples – based on interviews with World Bankteam task leaders managing economic policy loans – consistent with the above econometricfinding that World Bank staff put in more effort designing an economic policy loan whenfaced with a left-wing government. We describe two cases where the World Bank was facedwith a left-wing government (Mozambique and Zambia) and two cases of economic policyreform with governments without an outspoken leftist ideology (Mexico and Malawi) 20.
A first telling case concerns the successful privatization of the telecommunications sec-tor in Mozambique. Analytical work during the mid 1990s indicated a clear need for
20In three other cases, interviews suggested that ideology was less salient. The four cases discussed, andthe 7 selected in total, are not necessarily representative of all DPLs. A form of “convenience sampling”was employed, in which the authors selected task team leaders who were judged mostly likely to respondfavorably to interview requests. Whether representative or not, the cases are illustrative of the mainarguments and intuition behind the model.
12

privatizing the telecommunication sector: by the year 2000 there were 85,000 landlinesand 51,000 cellphones in Mozambique with high telephone charges and poor quality cell-phones (World Bank, 2005). Faced with the Marxism-Leninism inspired FRELIMO21, atthat time led by former pro-independence crusader Joaquim Chissano, it took the WorldBank considerable effort to convince the Ministry of Planning to allow a second playerinto the telecommunications market. A number of political advisors to the Minister ofPlanning openly questioned the benefits of privatization and claimed that only a statemonopoly would serve the people. An extensive World Bank staff team – 12 World Bankstaff members were involved in the negotiation process including the country director, thecountry economist, a World Bank telecommunications expert and a number of economistswith experience in Mozambique – succeeded in convincing the Mozambican governmentofficials. The then team task leader recalls that a presentation showing the positive impactof telecom privatization – with examples all over the globe – was instrumental in shiftingthe mindset. Also, in-country analytical work and a fine-tuning of conditionality servedto convince the Government of Mozambique to sign the loan agreement. According to thetask leader, after the negotiations the government of Mozambique expressed a clear andfirm commitment to implement the program: it created an independent regulatory body,revised the telecommunications sector law and attracted a new mobile operator. By 2005there were 800,000 mobile phone subscribers and the quality of service improved substan-tially (World Bank, 2005). This case provides another reason – in addition to informationalasymmetries and political economy considerations – why leftist governments perform betteron DPL compliance: the extensive negotiation and preparation process clearly facilitatedattitude change22 concerning the benefits of market reform with increased commitment asa consequence (Hirschman, 1965; James and Gutkind, 1985).
Another case in point involves the restructuring of state-owned non-bank financialinstitutions in Zambia. The early 1970s nationalization programs by Kenneth Kuandaleft Zambia with a number of insolvent non-bank financial institutions (NBFIs). A 2004World Bank economic policy loan aimed to address the weaknesses in those enterprises.However, public opinion was opposed to further market reforms: when the World Bankstaff team came to negotiate the loan, an editorial in an influential Zambian newspapertitled ‘The Devils of Washington have arrived’. Nor was the center-left government party,the Movement for Multi-party Democracy, convinced of the benefits of privatization23. Inthis context the World Bank had to come well-prepared to the negotiation table: 92.5 staff
21Note that at that time FRELIMO already discarded its radical Marxist-Leninist ideology – yet stillsituated firmly on the left – which allowed the World Bank the opportunity to discuss market reforms.
22During the interviews a team task manager mentioned that attitude change was also crucial in suc-cessfully supporting the economic reform programs in Vietnam.
23Within the MMD there were outspoken differences concerning the impact of market reforms. PresidentLevy Mwanawasa opposed privatization arguing that market policies “had brought untold suffering to theworkers” while his Finance Minister Emmanuel Kasonde maintained that it was inevitable to redressthe situation where state-owned enterprises continue to depend on the state for subventions. Followingthese differences over privatization, Emmanuel Kasonde was relieved of his ministerial position by theMwanawasa Government (World Bank, 2004).
13

weeks – at an estimated cost of $ 547,000 – were spent preparing the economic reformprogram. Furthermore, the Bank had to invest considerable resources to conclude the loanagreement. The then team task leader recalled that much back and forth was requiredto meet the Government of Zambia’s demands. Only after 8 months of negotiating andfine-tuning prior actions was it agreed that the non-bank financial institutions would fallunder the supervision of the Bank of Zambia and that the operations of the NBFIs wererestricted until they were sufficiently privatized.
The fiscal reform program in Mexico provides an example of the World Bank engagingwith a right-wing government. After ruling Mexico for more than 70 years, the InstitutionalRevolutionary Party lost the presidency in 2000 to Vincente Fox, a member of the NationalAction Party (PAN). During the Fox administration much emphasis was put on market-based approaches in economic policy making (Shirk, 2004). The PAN-led government alsosucceeded in bringing down inflation to a record low of 3.6%. With the support of the WorldBank, the government decided in 2001 to engage in a tax reform program in order to reduceits dependence on the oil sector. The reform program was quickly prepared – in less thantwo months – as the policy objectives of the Mexican government were in line with WorldBank prescriptions. The initial setup was based on a World Bank study (World Bank,2002) and suggested tax reform in five areas – Value Added Tax, Personal Income Tax,Corporate Income Tax, Excise Tax and federalization of fiscal revenues – with the reformsto the VAT envisioned to bring the most additional resources. However, due to staunchopposition in Congress and lack of public support the VAT reforms were abandoned (Shirk,2004). As a consequence the scope, funding and relevance of the program were considerablyreduced.
The economic reforms in Malawi during the 1990s offer a second illustration of the WorldBank supporting policy change in a country with no outspoken leftist ideology. Prior to1994, Malawi’s economy was highly regulated with a few publicly financed conglomeratesdominating production. In 1994 Bakili Muluzi from the United Democratic Front (UDF)rose to power. The reform strategy of the newly elected government included privatizationand deregulation as well as an increased focus on the poor (IEG, 2006). The World Bankaimed to support these reforms with a series of economic policy loans. In 1998, the secondFiscal Restructuring and Deregulation program (FRDP II) sought to address a number ofbottlenecks: reducing the fiscal deficit and strengthening budget discipline, privatizing apublicly owned agricultural conglomerate (ADMARC), reducing government interventionsin the maize market, reforming tax and utility policy reform. However, the outcome of mostof these reforms remained below expectations. For instance, the fiscal deficit increased from9.0 percent in 1997 to 12.4 percent in 1999 and during the implementation of FRDP II thegovernment backtracked on the privatization of ADMARC (IEG, 2006, pp. 31-32). Thethen team task leader concurred that the Malawian government had difficulties stronglyenforcing conditionalities. An assessment by the Bank’s Independent Evaluation Grouprated the quality at entry as inadequate and concluded that the program design was toobroad in scope without taking into account the lessons learned from past experience (IEG,2006, p. xiii).
14

6. Summary and Conclusion
In this paper we investigated how party orientation matters at the different stages ofeconomic reform programs. We find robust evidence that World Bank staff put in moreeffort designing an economic policy loan when faced with a left-wing government. Weexplain this result in terms of the interaction between the prevailing staff incentive systemin the World Bank and the (initial) partner country skepticism towards reform. In additionto party orientation, incumbent tenure is also positively associated with quality at entry.Results from estimating a triangular system of equations show that left-wing governmentsalso comply more fully with loan arrangements. Although political economy considerationsand informational asymmetries offer a reasonable explanation, interviews with team taskleaders also point to cognitive processes and attitude change as a way of interpreting thisfinding.
Looking at the overall outcome of a reform program, we find that short-term growthand initial macroeconomic conditions influence reform success. In addition to recipientcountry variables, donor effort matters as well. For instance, ensuring a high quality atentry increases supervision, borrower compliance and overall outcome. To a lesser extent,higher-quality supervision of the implementation of loan covenants positively affects reformsuccess. Finally, geopolitical motives appear to matter, as countries voting in line withthe G-7 in the UN General Assembly are favored in two ways. First, the selection modelindicates that such countries have easier access to DPL financing. Second, we find evidencethat loans to countries voting in line with the G-7 tend to receive higher quality-at-entryratings.
What can be learned from this study? In line with previous papers, our findingspoint to the importance of domestic political variables for successful reform. On the otherhand, factors under donor control also matter. Our estimates suggest that the returns toresources invested at the design stage exceed the returns to supervision in developmentpolicy operations. A re-allocation of resources at the margin can potentially increase thenumber of successful DPOs for a given level of total resources devoted to design andsupervision. As the World Bank’s country units tend to design higher-quality economicreform programs for leftist governments, the lending reviews conducted by the Bank’scentral units and Executive Board should devote extra scrutiny to DPLs proposed forother borrowers. Our analysis considered only policy lending conducted by the WorldBank. We would welcome similar studies of lending and aid programs intended to promotepolicy reform, by the regional development banks or large bilateral donors, using theirown internal datasets where available. Ideology of government parties may conceivablyhave a differing effect on design quality, when countries work with other agencies that arenot so strongly identified as the World Bank is with “Washington Consensus” or market-liberalizing policies.
Acknowledgement
We would like to thank the DPL team task leaders for making time available for theinterviews, Peter Moll and Adam Wagstaff for valuable comments, Vincenzo Verardi for
15

helpful conversations, Christian Bjornskov for sharing his data and Tim De Vaan and ReneVandendries for providing insight in the IEG ratings. Lodewijk Smets is also indebted tothe Institute of Development Policy and Management(IOB) for providing a research grant.
References
Akerlof, G. A., Dickens, W. T., 1982. The economic consequences of cognitive dissonance. The AmericanEconomic Review 72 (3), pp. 307–319.
Alesina, A., 1988. Credibility and policy convergence in a two-party system with rational voters. TheAmerican Economic Review 78 (4), pp. 796–805.
Alesina, A., Cukierman, A., 1990. The politics of ambiguity. The Quarterly Journal of Economics 105 (4),829–850.
Andersen, T. B., Hansen, H., Markussen, H., 2006. Us politics and world bank ida-lending. The Journalof Development Studies 42 (5), 772–794.
Beck, N., 1982. Parties, administrations, and american macroeconomic outcomes. The American PoliticalScience Review 76 (1), pp. 83–93.
Beck, T., Clarke, G., Groff, A., Keefer, P., Walsh, P., 2001. New tools in comparative political economy:The database of political institutions. The World Bank Economic Review 15 (1), pp. 165–176.
Besley, T., Case, A., 2003. Political institutions and policy choices: Evidence from the united states.Journal of Economic Literature 41 (1), 7–73.
Besley, T., Montalvo, J. G., Reynal-Querol, M., 2011. Do educated leaders matter? Economic Journal121 (554), F205–F227.
Bienen, H., Van De Walle, N., 1989. Time and power in africa. The American Political Science Review83 (1), pp. 19–34.
Bjornskov, C., 2005. Does political ideology affect economic growth? Public Choice 123, 133–146.Bjornskov, C., 2008. The growth-inequality association: Government ideology matters. Journal of Devel-
opment Economics 87 (2), 300–308.Bortolotti, B., Pinotti, P., 2008. Delayed privatization. Public Choice 136 (3), 331–351.Bueno de Mesquita, B., Morrow, J. D., Siverson, R. M., Smith, A., 2002. Political institutions, policy
choice and the survival of leaders. British Journal of Political Science 32 (4), pp. 559–590.Chai, S.-K., 1998. Endogenous ideology formation and economic policy in former colonies. Economic
Development and Cultural Change 46 (2), 263–90.Chauvet, L., Collier, P., Fuster, A., 2006. Supervision and project performance: a principal-agent approach.
Centre for the Study of African Economies, University of Oxford.Cheibub, J., Gandhi, J., Vreeland, J., 2010. Democracy and dictatorship revisited. Public Choice 143 (1),
67–101.Cowen, T., Sutter, D., 1998. Why only nixon could go to china. Public Choice 97 (4), pp. 605–615.Cukierman, A., Tommasi, M., 1998. When does it take a nixon to go to china? American Economic Review
88, 180–197.Denizer, C., Kaufmann, D., Kraay, A., 2011. Good countries or good projects ? macro and micro correlates
of world bank project performance. Policy Research Working Paper Series 5646, The World Bank.Dijkstra, G. A., 2002. The effectiveness of policy conditionality: Eight countries experiences. Development
and Change 33 (2), 307–334.Dollar, D., Svensson, J., 2000. What explains the success or failure of structural adjustment programmes?
The Economic Journal 110, 894–917.Drazen, A., 2000. Political Economy in Macroeconomics. Princeton University Press, New Jersey.Dreher, A., Lamla, M. J., Lein, S. M., Somogyi, F., 2009a. The impact of political leaders’ profession and
education on reforms. Journal of Comparative Economics 37 (1), 169–193.Dreher, A., Sturm, J.-E., 2012. Do the imf and the world bank influence voting in the un general assembly?
Public Choice 151 (1), 363–397.
16

Dreher, A., Sturm, J.-E., Vreeland, J. R., 2009b. Development aid and international politics: Does mem-bership on the un security council influence world bank decisions? Journal of Development Economics88 (1), 1–18.
Dutt, P., Mitra, D., 2005. Political ideology and endogenous trade policy: An empirical investigation. TheReview of Economics and Statistics 87 (1), 59–72.
Dutt, P., Mitra, D., 2006. Labor versus capital in trade-policy: The role of ideology and inequality. Journalof International Economics 69 (2), 310–320.
Frey, B. S., Schneider, F., 1978. An empirical study of politico-economic interaction in the united states.The Review of Economics and Statistics 60 (2), pp. 174–183.
Gilad, B., Kaish, S., Loeb, P. D., 1987. Cognitive dissonance and utility maximization: A general frame-work. Journal of Economic Behavior and Organization 8 (1), 61–73.
Glazer, A., Grofman, B., 1989. Why representatives are ideologists though voters are not. Public Choice61 (1), pp. 29–39.
Gleditsch, K., 2011. Distance between capital cities data.URL http://privatewww.essex.ac.uk/ ksg/index.html
Haggard, S., Webb, S. (Eds.), 1994. Voting for Reform: Democracy, Political Liberalisation, and EconomicAdjustment. Oxford University Press.
Heckman, J. J., 1979. Sample selection bias as a specification error. Econometrica 47 (1), 153–61.Hibbs, D. A., 1977. Political parties and macroeconomic policy. The American Political Science Review
71 (4), pp. 1467–1487.Hirschman, A. O., 1965. Obstacles to development: a classification and a quasi-vanishing act. Economic
Development and Cultural Change 13 (4), 385.IEG, 2006. Project Performance Assessment Report Malawi. World Bank.James, J., Gutkind, E., 1985. Attitude change revisited: Cognitive dissonance theory and development
policy. World Development 13 (10-11), 1139–1149.Jones, B. F., Olken, B. A., 2005. Do leaders matter? national leadership and growth since world war ii.
The Quarterly Journal of Economics 120 (3), 835–864.Kapur, D., Lewis, J. P., Webb, R., 1997. The World Bank: Its first half century. Volume 1. History.
Brookings Institution Press, Washington, D.C.Kilby, C., 2009. The political economy of conditionality: An empirical analysis of world bank loan dis-
bursements. Journal of Development Economics 89 (1), 51–61.Kilby, C., 2011. The political economy of project preparation: An empirical analysis of world bank projects.
Villanova School of Business Department of Economics and Statistics Working Paper Series 14, VillanovaSchool of Business Department of Economics and Statistics.
Killick, T., 1997. Principals, agents and the failings of conditionality. Journal of International Development9 (4), 483–495.
Knack, S., 2012. When do donors trust recipient country systems ? Policy Research Working Paper Series6019, The World Bank.
Krueger, A. O., 1993. Political economy of policy reform in developing countries. The MIT Press, Cam-bridge, MA and London.
Lahiri, K., Schmidt, P., 1978. On the estimation of triangular structural systems. Econometrica 46 (5),1217–21.
Malesa, T., Silarszky, P., 2005. Does World Bank Effort Matter for Success of Adjustment Operations?Conditionality Revisited: Concepts, Experiences, and Lessons. World Bank, Washington, D.C., pp.127–141.
Meseguer, C., 2006. Learning and economic policy choices. European Journal of Political Economy 22 (1),156–178.
Mosley, P., Harrigan, J., Toye, J., 1991. Aid and Power: The World Bank and policy-based lending Volume1. Analysis and policy proposals. Routledge, London and New York.
Murshed, S. M., 2009. On the non-contractual nature of donor-recipient interaction in development assis-tance. Review of Development Economics 13 (s1), 416–428.
17

Navia, P., Velasco, A., 2003. The politics of second-generation reforms. In: Kuczynski, P.-P., Williamson,J. (Eds.), After the Washington Consensus: Restarting Growth and Reform in Latin America. Institutefor International Economics.
Noorbakhsh, F., Paloni, A., 2007. Learning from structural adjustment: Why selectivity may not be thekey to successful programmes in africa. Journal of International Development 19 (7), 927–948.
Persson, T., Tabellini, G., 2000. Political Economics, Explaining Economic Policy. The MIT Press, Cam-bridge, Massachusetts.
Pitlik, H., 2007. A race to liberalization? diffusion of economic policy reform among oecd-economies.Public Choice 132 (1), 159–178.
Potrafke, N., 2010. Does government ideology influence deregulation of product markets? empirical evi-dence from oecd countries. Public Choice 143 (1), 135–155.
Ranis, G., Mahmood, S. A., 1992. The political economy of development policy change. Basil Blackwell,Cambridge, MA and Oxford.
Rodrik, D., 2006. Goodbye washington consensus, hello washington confusion? Journal of EconomicLiterature 44 (4), 973–987.
Roeder, P. G., 2001. Ethnolinguistic fractionalization indices, 1961 and 1985.Roemer, J. E., 1997. Politicaleconomic equilibrium when parties represent constituents: The unidimen-
sional case. Social Choice and Welfare 14, 479–502.Roemer, J. E., 1999. The democratic political economy of progressive income taxation. Econometrica
67 (1), pp. 1–19.Shirk, D. A., 2004. Mexico’s New Politics: the PAN and Democratic Change. Lynne Riener.Stromberg, D., 2007. Natural disasters, economic development, and humanitarian aid. Journal of Economic
Perspectives 21 (3), 199–222.Svensson, J., 2000. When is foreign aid policy credible? aid dependence and conditionality. Journal of
Development Economics 61 (1), 61–84.Svensson, J., 2003. Why conditional aid does not work and what can be done about it? Journal of
Development Economics 70 (2), 381–402.Terai, K., 2006. Parties with policy preferences and uncertainty over voter behavior. Social Choice and
Welfare 27, 155–172.Wane, W., 2004. The quality of foreign aid : country selectivity or donors incentives? Policy Research
Working Paper Series 3325, The World Bank.Williamson, J., 1994. The Political Economy of Policy Reform. No. 68 in Peterson Institute Press: All
Books. Peterson Institute for International Economics.Wittman, D., 1983. Candidate motivation: A synthesis of alternative theories. The American Political
Science Review 77 (1), pp. 142–157.World Bank, 2002. Mexico Country Economic Memorandum: Challenges and prospects for Tax Reform.
World Bank, Washington, D.C.World Bank, 2004. Zambia Country Economic Memorandum: Policies for Growth and Diversification.
World Bank, Washington, D.C.World Bank, 2005. Mozambique Country Economic Memorandum: Sustaining growth and reducing
poverty. World Bank, Washington, D.C.
18

Table 1: Heckman model, selection equation
Variable Coefficient (Std. Err.)distance to Washington D.C. (in 100 km) -0.002∗ (0.001)voting in line with G7 t-1 0.591∗∗∗ (0.203)inflation t-1 .00008∗ (.00004)log of World Bank debt t-1 0.214∗∗∗ (0.057)GDP per capita (PPP) -.00003∗∗ (.00001)log of population -0.079 (0.053)CPIA score 0.182∗∗ (0.074)Intercept -5.092∗∗∗ (0.601)N 2148LR statistic 58.73Pseudo R2 0.053
Significance levels : ∗ : 10% ∗∗ : 5% ∗ ∗ ∗ : 1%
19

Tab
le2:
Hec
km
an
mod
el,
ou
tcom
eeq
uati
on
equat
ion
no.
(1)
(2)
(3)
(4)
(5)
(6)
(7)
vari
atio
nbas
em
odel
sam
ple
Isa
mple
IIb
jorn
skov
3-p
oint
var.
pro
bit
contr
ols
left
-win
gid
eolo
gy.4
21.5
98.4
61-.
400
.237
.874
.432
(.232)∗
(.328)∗
(.230)∗∗
(.216)∗
(.121)∗
(.358)∗∗
(.215)∗∗
year
.034
.026
.037
.045
.033
.057
.032
(.026)
(.032)
(.026)
(.028)
(.025)
(.031)∗
(.027)
log
oflo
anam
ount
-.05
1-.
083
-.02
9.0
29-.
055
-.08
5.0
10(.
134)
(.177)
(.175)
(.158)
(.136)
(.181)
(.140)
dem
ocr
acy
.281
.692
-.00
2.7
63.2
831.
035
.023
(.382)
(.628)
(.374)
(.482)
(.379)
(.434)∗∗
(.385)
tenure
.073
.092
.068
.090
.074
.107
.053
(.025)∗∗∗
(.037)∗∗
(.024)∗∗∗
(.031)∗∗∗
(.025)∗∗∗
(.034)∗∗∗
(.026)∗∗
log
ofp
erca
pit
aG
DP
.272
.614
.229
.290
.294
.325
.087
(.301)
(.367)∗
(.275)
(.294)
(.297)
(.363)
(.358)
log
ofp
opula
tion
.124
.234
.088
.142
.129
.253
.065
(.158)
(.170)
(.167)
(.176)
(.155)
(.201)
(.156)
voti
ng
inline
wit
hG
7t-
11.
557
.807
1.29
91.
483
1.58
11.
361
1.75
7(.
632)∗∗
(.788)
(.672)∗
(.665)∗∗
(.620)∗∗
(.737)∗
(.716)∗∗
CP
IAsc
ore
..
..
..
.141
(.368)
Curr
ent
acco
unt
bal
ance
..
..
..
.011
(.023)
inflat
ion
..
..
..
.000
08(.
0008)
EL
F85
..
..
..
-.74
9(.
764)
regi
onal
fixe
deff
ects
yes
yes
yes
yes
yes
yes
yes
No.
ofunce
nso
red
obse
rvat
ions
182
115
215
161
182
177
167
R2
.209
.208
.131
.238
.21
.259
.211
*si
gn
ifica
nce
at
10%
;**
sign
ifica
nce
at
5%
;***
sign
ifica
nce
at
1%
;co
nst
ant
not
rep
ort
ed.
20

Table 3: triangular system, base model
Variable Coefficient (Std. Err.)
Equation 1 : banksupervisionquality at entry 0.508∗∗∗ (0.096)left -0.035 (0.229)growth t+1 0.021 (0.028)year -0.003 (0.022)log of loan amount -0.041 (0.094)democratic regime -0.019 (0.282)incumbent tenure 0.034 (0.024)log of GDP per capita (PPP) -0.008 (0.199)log of population 0.096 (0.116)voting in line with G7 t-1 -0.564 (0.700)nonselection hazard 0.053 (0.417)regional fixed effects yes -
Equation 2 : borrcompliancebank supervision 0.239∗ (0.126)quality at entry 0.369∗∗∗ (0.106)left 0.330∗ (0.177)growth t+1 0.035 (0.026)year -0.010 (0.024)log of loan amount -0.110 (0.107)democratic regime -0.261 (0.340)incumbent tenure 0.020 (0.025)log of GDP per capita (PPP) -0.030 (0.196)log of population 0.093 (0.108)voting in line with G7 t-1 -0.249 (0.635)nonselection hazard -0.697 (0.502)regional fixed effects yes -
Equation 3 : outcomebank supervision 0.143 (0.093)borrower compliance 0.343∗∗∗ (0.089)quality at entry 0.334∗∗∗ (0.102)left -0.108 (0.154)growth t+1 0.043∗∗ (0.019)year -0.042∗∗∗ (0.013)log of loan amount -0.194 (0.129)democratic regime 0.212 (0.234)incumbent tenure 0.001 (0.017)log of GDP per capita (PPP) 0.086 (0.172)
Continued on next page...
21

... table 3 continued
Variable Coefficient (Std. Err.)log of population 0.061 (0.102)voting in line with G7 t-1 -0.216 (0.390)nonselection hazard -0.824∗ (0.444)regional fixed effects yes -N 161Log-likelihood -2904.116R2 equation 1 0.382R2 equation 2 0.394R2 equation 3 0.603
Significance levels : ∗ : 10% ∗∗ : 5% ∗ ∗ ∗ : 1% ; no intercept reported.
Table 4: triangular system, reduced sample
Variable Coefficient (Std. Err.)
Equation 1 : banksupervisionquality at entry 0.441∗∗∗ (0.108)left 0.108 (0.289)growth t+1 0.015 (0.035)year 0.008 (0.028)log of loan amount -0.063 (0.129)democratic regime 0.113 (0.381)incumbent tenure 0.042 (0.031)log of GDP per capita (PPP) -0.102 (0.220)log of population 0.025 (0.137)voting in line with G7 t-1 -1.353∗ (0.767)nonselection hazard -0.727 (0.768)regional fixed effects yes -
Equation 2 : borrcompliancebank supervision 0.372∗∗∗ (0.142)quality at entry 0.309∗∗∗ (0.115)left 0.280 (0.245)growth t+1 0.069∗∗ (0.028)year -0.024 (0.026)log of loan amount -0.129 (0.149)democratic regime -0.106 (0.488)incumbent tenure 0.001 (0.035)log of GDP per capita (PPP) 0.374 (0.265)
Continued on next page...
22

... table 4 continued
Variable Coefficient (Std. Err.)log of population 0.175 (0.115)voting in line with G7 t-1 -0.795 (0.901)nonselection hazard -1.088 (0.824)regional fixed effects yes -
Equation 3 : outcomebank supervision 0.235∗∗ (0.118)borrower compliance 0.239∗∗ (0.097)quality at entry 0.346∗∗∗ (0.114)left 0.007 (0.177)growth t+1 0.072∗∗∗ (0.026)year -0.075∗∗∗ (0.020)log of loan amount -0.209 (0.128)democratic regime 0.121 (0.215)incumbent tenure -0.014 (0.018)log of GDP per capita (PPP) 0.510∗∗ (0.219)log of population 0.088 (0.095)voting in line with G7 t-1 -0.326 (0.515)nonselection hazard -1.678∗∗ (0.699)regional fixed effects yes -
N 103Log-likelihood -1803.271Significance levels : ∗ : 10% ∗∗ : 5% ∗ ∗ ∗ : 1% ; no intercept reported.
Table 5: triangular system, expanded sample
Variable Coefficient (Std. Err.)
Equation 1 : banksupervisionquality at entry 0.423∗∗∗ (0.069)left 0.113 (0.225)growth t+1 0.029 (0.024)year -0.006 (0.018)log of loan amount -0.067 (0.098)democratic regime 0.134 (0.274)incumbent tenure 0.037∗ (0.022)log of GDP per capita (PPP) -0.054 (0.187)log of population 0.113 (0.121)
Continued on next page...
23

... table 5 continued
Variable Coefficient (Std. Err.)voting in line with G7 t-1 -0.578 (0.654)nonselection hazard 0.060 (0.400)regional fixed effects yes -
Equation 2 : borrcompliancebank supervision 0.305∗∗ (0.119)quality at entry 0.353∗∗∗ (0.086)left 0.366∗∗ (0.175)growth t+1 0.032 (0.024)year -0.010 (0.023)log of loan amount -0.188∗ (0.114)democratic regime -0.161 (0.314)incumbent tenure 0.015 (0.026)log of GDP per capita (PPP) -0.193 (0.176)log of population 0.154 (0.117)voting in line with G7 t-1 0.180 (0.594)nonselection hazard -0.482 (0.498)regional fixed effects yes -
Equation 3 : outcomebank supervision 0.166∗∗ (0.071)borrower compliance 0.338∗∗∗ (0.074)quality at entry 0.343∗∗∗ (0.076)left -0.033 (0.131)growth t+1 0.042∗∗ (0.016)year -0.045∗∗∗ (0.010)log of loan amount -0.145 (0.097)democratic regime 0.165 (0.189)incumbent tenure -0.009 (0.016)log of GDP per capita (PPP) 0.067 (0.153)log of population 0.022 (0.082)voting in line with G7 t-1 -0.279 (0.385)nonselection hazard -0.598∗ (0.306)regional fixed effects yes -
N 191Log-likelihood -3487.396Significance levels : ∗ : 10% ∗∗ : 5% ∗ ∗ ∗ : 1% ; no intercept reported.
24
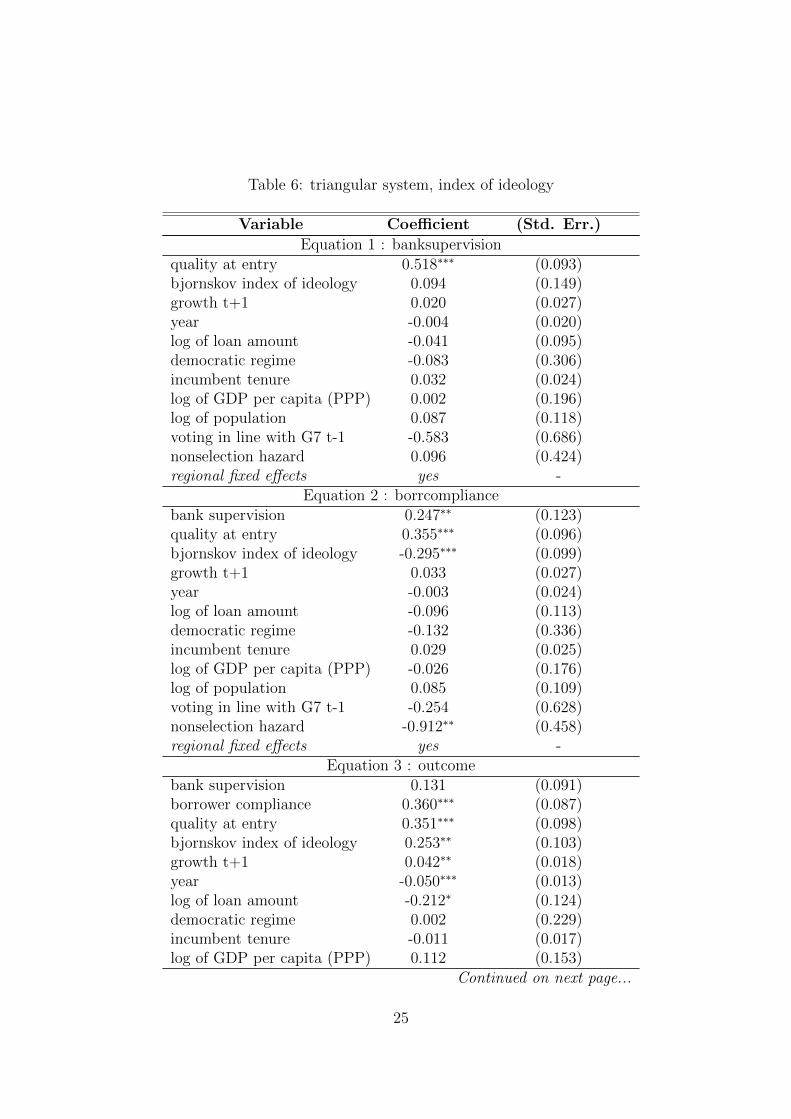
Table 6: triangular system, index of ideology
Variable Coefficient (Std. Err.)
Equation 1 : banksupervisionquality at entry 0.518∗∗∗ (0.093)bjornskov index of ideology 0.094 (0.149)growth t+1 0.020 (0.027)year -0.004 (0.020)log of loan amount -0.041 (0.095)democratic regime -0.083 (0.306)incumbent tenure 0.032 (0.024)log of GDP per capita (PPP) 0.002 (0.196)log of population 0.087 (0.118)voting in line with G7 t-1 -0.583 (0.686)nonselection hazard 0.096 (0.424)regional fixed effects yes -
Equation 2 : borrcompliancebank supervision 0.247∗∗ (0.123)quality at entry 0.355∗∗∗ (0.096)bjornskov index of ideology -0.295∗∗∗ (0.099)growth t+1 0.033 (0.027)year -0.003 (0.024)log of loan amount -0.096 (0.113)democratic regime -0.132 (0.336)incumbent tenure 0.029 (0.025)log of GDP per capita (PPP) -0.026 (0.176)log of population 0.085 (0.109)voting in line with G7 t-1 -0.254 (0.628)nonselection hazard -0.912∗∗ (0.458)regional fixed effects yes -
Equation 3 : outcomebank supervision 0.131 (0.091)borrower compliance 0.360∗∗∗ (0.087)quality at entry 0.351∗∗∗ (0.098)bjornskov index of ideology 0.253∗∗ (0.103)growth t+1 0.042∗∗ (0.018)year -0.050∗∗∗ (0.013)log of loan amount -0.212∗ (0.124)democratic regime 0.002 (0.229)incumbent tenure -0.011 (0.017)log of GDP per capita (PPP) 0.112 (0.153)
Continued on next page...
25

... table 6 continued
Variable Coefficient (Std. Err.)log of population 0.064 (0.098)voting in line with G7 t-1 -0.207 (0.407)nonselection hazard -0.666∗ (0.361)regional fixed effects yes -
N 159Log-likelihood -2920.272Significance levels : ∗ : 10% ∗∗ : 5% ∗ ∗ ∗ : 1% ; no intercept reported.
Table 7: triangular system, 3-point categorical variable
Variable Coefficient (Std. Err.)
Equation 1 : banksupervisionquality at entry 0.512∗∗∗ (0.096)ideology -0.048 (0.139)growth t+1 0.020 (0.028)year -0.003 (0.022)log of loan amount -0.040 (0.094)democratic regime -0.050 (0.283)incumbent tenure 0.033 (0.024)log of GDP per capita (PPP) -0.004 (0.195)log of population 0.092 (0.116)voting in line with G7 -0.569 (0.709)nonselection hazard 0.044 (0.423)regional fixed effects yes -
Equation 2 : borrcompliancebank supervision 0.243∗ (0.127)quality at entry 0.360∗∗∗ (0.104)ideology 0.219∗∗ (0.103)growth t+1 0.036 (0.027)year -0.009 (0.024)log of loan amount -0.112 (0.108)democratic regime -0.221 (0.345)incumbent tenure 0.023 (0.025)log of GDP per capita (PPP) -0.023 (0.188)log of population 0.101 (0.105)voting in line with G7 -0.225 (0.637)
Continued on next page...
26

... table 7 continued
Variable Coefficient (Std. Err.)nonselection hazard -0.688 (0.505)regional fixed effects yes -
Equation 3 : outcomebank supervision 0.143 (0.093)borrower compliance 0.342∗∗∗ (0.089)quality at entry 0.333∗∗∗ (0.102)ideology -0.047 (0.088)growth t+1 0.044∗∗ (0.019)year -0.042∗∗∗ (0.013)log of loan amount -0.194 (0.129)democratic regime 0.225 (0.234)incumbent tenure 0.001 (0.018)log of GDP per capita (PPP) 0.078 (0.176)log of population 0.061 (0.104)voting in line with G7 -0.220 (0.392)nonselection hazard -0.819∗ (0.448)regional fixed effects yes -
N 161Log-likelihood -2997.979Significance levels : ∗ : 10% ∗∗ : 5% ∗ ∗ ∗ : 1% ; no intercept reported.
Table 8: triangular system, binary LHS variables
Variable Coefficient (Std. Err.)
Equation 1 : banksupervisiondummy bankquality 0.442∗∗∗ (0.089)left 0.033 (0.068)growth t+1 0.006 (0.007)year 0.004 (0.007)log of loan amount -0.025 (0.028)democratic regime 0.079 (0.077)incumbent tenure 0.016∗∗∗ (0.006)log of GDP per capita (PPP) -0.026 (0.049)log of population 0.042 (0.032)voting in line with G7 t-1 -0.182 (0.204)nonselection hazard 0.050 (0.122)
Continued on next page...
27

... table 8 continued
Variable Coefficient (Std. Err.)regional fixed effects yes -
Equation 2 : dummy borrcompliancedummy supervision 0.140 (0.126)dummy bankquality 0.386∗∗∗ (0.098)left 0.074 (0.049)growth t+1 0.010 (0.008)year 0.002 (0.007)log of loan amount -0.020 (0.033)democratic regime -0.125 (0.103)incumbent tenure 0.005 (0.007)log of GDP per capita (PPP) -0.044 (0.059)log of population 0.013 (0.034)voting in line with G7 t-1 -0.074 (0.200)nonselection hazard -0.193 (0.160)regional fixed effects yes -
Equation 3 : dummy outcomedummy supervision 0.311∗∗∗ (0.114)dummy compliance 0.271∗∗ (0.109)dummy bankquality 0.184∗ (0.100)left 0.011 (0.046)growth t+1 0.010∗ (0.005)year -0.009∗ (0.005)log of loan amount -0.034 (0.046)democratic regime 0.006 (0.093)incumbent tenure -0.002 (0.006)log of GDP per capita (PPP) -0.066 (0.050)log of population -0.003 (0.034)voting in line with G7 t-1 0.042 (0.152)nonselection hazard -0.303∗∗ (0.143)regional fixed effects yes -
N 161Log-likelihood -2144.738Significance levels : ∗ : 10% ∗∗ : 5% ∗ ∗ ∗ : 1% ; no intercept reported.
28

Table 9: triangular system, additional covariates
Variable Coefficient (Std. Err.)
Equation 1 : banksupervisionquality at entry 0.459∗∗∗ (0.067)left -0.016 (0.190)growth t+1 0.041∗ (0.022)year 0.012 (0.018)log of loan amount -0.119 (0.150)democratic regime 0.203 (0.309)incumbent tenure 0.044∗ (0.024)log of GDP per capita (PPP) 0.154 (0.238)log of population 0.138 (0.122)voting in line with G7 t-1 -0.885 (0.580)nonselection hazard -0.228 (0.516)CPIA score -0.360∗ (0.214)Current account balance (% of GDP) -0.003 (0.017)Inflation, consumer prices (annual %) -0.001 (0.001)ELF85 (Roeder) 0.169 (0.431)regional fixed effects yes -
Equation 2 : borrcompliancebank supervision 0.171∗ (0.092)quality at entry 0.375∗∗∗ (0.086)left 0.317 (0.212)growth t+1 0.055∗∗ (0.025)year -0.012 (0.020)log of loan amount -0.254 (0.167)democratic regime 0.133 (0.344)incumbent tenure 0.042 (0.027)log of GDP per capita (PPP) 0.303 (0.266)log of population 0.238∗ (0.137)voting in line with G7 t-1 0.022 (0.652)nonselection hazard -0.034 (0.575)CPIA score 0.155 (0.241)Current account balance (% of GDP) -0.061∗∗∗ (0.019)Inflation, consumer prices (annual %) 0.001 (0.001)ELF85 (Roeder) 0.255 (0.481)regional fixed effects yes -
Equation 3 : outcomebank supervision 0.148∗∗ (0.069)borrower compliance 0.323∗∗∗ (0.061)
Continued on next page...
29

... table 9 continued
Variable Coefficient (Std. Err.)quality at entry 0.365∗∗∗ (0.068)left -0.147 (0.159)growth t+1 0.052∗∗∗ (0.019)year -0.033∗∗ (0.015)log of loan amount -0.226∗ (0.125)democratic regime 0.184 (0.257)incumbent tenure -0.001 (0.020)log of GDP per capita (PPP) 0.307 (0.199)log of population 0.077 (0.103)voting in line with G7 t-1 -0.446 (0.485)nonselection hazard -0.848∗∗ (0.428)CPIA score -0.191 (0.179)Current account balance (% of GDP) -0.035∗∗ (0.015)Inflation, consumer prices (annual %) 0.001 (0.001)ELF85 (Roeder) -0.063 (0.358)regional fixed effects yes -
N 147Log-likelihood -579.011
Significance levels : ∗ : 10% ∗∗ : 5% ∗ ∗ ∗ : 1% ; no intercept reported.Model estimated with FGLS due to maximization problems with MLE.
30

Appendices
Appendix A. Descriptive Statistics
Table A.1: Summary statistics outcome model
Variable Mean Std. Dev. Min. Max.quality at entry 4.495 1.329 1 6
left 0.484 0.501 0 1
bjornskov index -0.045 0.811 -1 1
3-point variable 2.088 0.936 1 3
year 1997.588 5.617 1985 2008
log of loan amount 4.726 1.096 2.303 7.834
democratic regime 0.676 0.469 0 1
incumbent tenure 7.912 5.841 1 32
log of per capita GDP (PPP) 8.036 0.911 5.931 9.475
log of population 16.558 1.577 12.91 20.827
voting in line with G7 t-1 0.54 0.221 0 1
CPIA score 3.458 0.52 2 4.4
Current account balance (% of GDP) -3.666 7.055 -44.841 17.605
Inflation, consumer prices (annual %) 26.541 86.537 -1.167 1058.374
ELF85 (Roeder) 0.515 0.255 0.05 0.984
31

Table A.2: Summary statistics selection model
Variable Mean Std. Dev. Min. Max.selection dummy 0.072 0.258 0 1
distance from Washington D.C. (in 100 km) 89.935 38.314 22.86 163.37
voting in line with G7 t-1 0.478 0.231 0 1
inflation t-1 59.537 636.282 -13.057 23773.131
log of World Bank debt t-1 19.823 1.953 9.903 24.189
GDP per capita (PPP) 4076.83 3486.904 185.299 19652.381
log of population 15.809 1.996 10.6 21.004
CPIA score 3.265 0.714 1 5.5
32

Appendix B. Variable Definition and Sources
variable definitionQuality at entry The extent to which the World Bank identified, facilitated preparation of
and appraised the operation to achieve relevant development outcomes.The following criteria are taken into account: Bank inputs and processes,strategic relevance and approach, macro and socio-economic aspects, im-plementation arrangements, M&E arrangements, institutional and fidu-ciary aspects.
Bank supervision The extent to which the World Bank proactively identified and resolvedthreats to the achievement of relevant development outcomes. The fol-lowing criteria are taken into account: focus on development impact andfiduciary aspects, adequacy of supervision and quality of performancereporting.
Borrower compliance The extent to which the borrower complied with covenants and agree-ments. The following criteria are taking into account: government owner-ship and commitment to achieving objectives, adequacy of stakeholder in-volvement, timely resolution of implementation issues, adequacy of M&Earrangements and relationship with donors/partners.
Outcome The extent to which the operation’s major relevant objectives areachieved. Shortcomings in objectives have to do with either the numberof objectives and/or the extent to which one or more objectives are notachieved. Shortcomings in relevance have to do with the extent to whichthe operation is inconsistent with the country’s development priorities.
Table B.1: IEG performance ratings
33

vari
able
defi
nit
ion
sourc
edis
tance
toW
ashin
gton
D.C
.dis
tance
toW
ashin
gton
D.C
.in
100
km
Gle
dit
sch
(201
1)vo
ting
inline
wit
hG
7t-
1fr
acti
onof
vote
son
key
issu
esal
igned
wit
hth
eG
-7th
eye
arpri
orto
sele
ctio
nD
reher
and
Stu
rm(2
012)
inflat
ion
t-1
inflat
ion
inco
nsu
mer
pri
ces
(annual
%)
the
year
pri
orto
sele
ctio
nW
orld
Dev
elop
men
tIn
dic
ator
s(W
DI)
log
ofW
orld
Ban
kdeb
tt-
1lo
gari
thm
ofIB
DR
loan
san
dID
Acr
edit
sth
eye
arpri
orto
sele
ctio
nW
DI
GD
Pp
erca
pit
a(P
PP
)G
DP
per
capit
a,P
PP
(con
stan
t20
05in
tern
atio
nal
USD
)W
DI
log
ofp
opula
tion
loga
rith
mof
pop
ula
tion
WD
IC
PIA
scor
eas
sess
men
tof
the
qual
ity
ofa
countr
y’s
pol
icy
and
inst
ituti
onal
fram
e-w
ork
Wor
ldB
ank
left
dum
my
coded
1if
the
econ
omic
par
tyor
ienta
tion
ofth
eex
ecuti
vepar
tyis
consi
der
edle
ft-w
ing
Bec
ket
al.
(200
1)
Bjo
rnsk
ovin
dex
ofid
eolo
gyw
eigh
ted
index
ofgo
vern
men
tid
eolo
gyB
jorn
skov
(200
5)id
eolo
gyth
ree
poi
nt
cate
gori
cal
vari
able
ofex
ecuti
vepar
tyid
eolo
gyB
eck
etal
.(2
001)
year
the
year
the
loan
bec
ame
effec
tive
Wor
ldB
ank
log
ofG
DP
per
capit
a(P
PP
)lo
gari
thm
ofG
DP
per
capit
a,P
PP
(con
stan
t20
05in
tern
atio
nal
USD
)W
DI
grow
tht+
1G
DP
grow
th(a
nnual
%)
the
year
afte
rth
elo
anb
ecam
eeff
ecti
veW
DI
log
oflo
anam
ount
loga
rith
mof
loan
size
(curr
ent
million
USD
)W
orld
Ban
kdem
ocr
atic
regi
me
dum
my
coded
1if
the
countr
yre
gim
ecl
assi
fies
asdem
ocr
atic
Chei
bub
etal
.(2
010)
incu
mb
ent
tenure
tota
lnum
ber
ofye
ars
the
effec
tive
hea
dof
gove
rnm
ent
isin
pow
erC
hei
bub
etal
.(2
010)
curr
ent
acco
unt
bal
ance
Curr
ent
acco
unt
bal
ance
as%
ofG
DP
WD
Iin
flat
ion
inflat
ion
inco
nsu
mer
pri
ces
(annual
%)
WD
IE
LF
85et
hnol
ingu
isti
cfr
acti
onal
izat
ion
1985
Roed
er(2
001)
Tab
leB
.2:
vari
ab
led
efin
itio
ns
an
dso
urc
es
34