Political Economy of the United States How Economics and Politics Affect Each Other.
78
Political Economy of the United States How Economics and Politics Affect Each Other
-
Upload
avice-joy-dalton -
Category
Documents
-
view
215 -
download
0
Transcript of Political Economy of the United States How Economics and Politics Affect Each Other.

Political Economy of the United States
How Economics and Politics Affect Each Other

I. Why study political economy?A. Politics Defined: Who Gets What? – or “The
authoritative allocation of resources and values.”
1. Implication: Politics creates winners and losers
2. Key Terms: a. Authority: Government has a monopoly on the legitimate
use of force, so it is the only one with the authority to allocate.
b. Resource Allocation: Money, labor, and even commodities
c. Allocation of Values: Deciding between incompatible moral or ethical principles

B. Political Economy1. Definition: The effect of politics on the economy
and of the economy on politics2. Economic effects of politics:
Will more government spending help the economy? Does the law reward productive activity? Does defense spending reduce growth? Is dictatorship necessary for development?
3. Political effects of the economy: Do people vote based on their pocketbooks? Is economic growth the key to military dominance? Who wins and loses when free trade pacts are
signed?

II. A model of politics: How are resources authoritatively allocated?

A. Agenda-Setting
Proposing alternatives to the status quo Status Quo: The way things are (the current
system)

1. Individuals

1. Individuals

1. Individuals -- Powerless alone

2. Unorganized Groups

2. Unorganized Groups -- Must be considered, but cannot set agenda

3. Organized groups

3. Organized groups -- Set agenda and shape citizen response

4. Benefits of Organization
a. Credible Commitment -- Conditional support
b. Outreach -- Publicity, Money, Media Access
c. Persuasion -- Information to representatives

5. How to Initiate Change in the USa. Representatives: The Elected
• Use Money, Votes, Publicity• Math for politicians:• Anything + Money = Anything Else
b. Bureaucrats: Experts and Career Officials• Use Information, Targeted Ads
c. Appointees: Judges, Cabinet, etc.• Indirect: Target Appointers• Direct: Information, Lobbying, or Lawsuits
d. ALL: Illegal bribes, Influence Peddling, etc.

B. Government Action1. Legislation
a. Logrolling: You scratch my back, I’ll scratch yours
b. Partisanship
From the early American practice of neighbors gathering to help clear land by rolling off and burning felled timber.

2. Bureaucratic Change
a. Enforcement of laws• Example: Equal
employment opportunity for women
b. Regulation• Example: Wireless Internet

3. Judicial Change
a. Judicial Review: Power of courts to review laws Examples: Income tax, child
labor, regulatory “takings,” and the “switch in time that saved nine”
b. Economic regulation: Chevron deference

C. Citizen Response1. The Media
a. Economic Ideology: Generally “conservative” – both owners and reporters critical of deficits, taxes, wasteful spending, limits on trade and immigration, etc.
b. Citation Bias: Fox (Right), Other Broadcast Networks (Left)


C. Citizen Response1. The Media
a. Economic Ideology: Generally “conservative” – both owners and reporters critical of deficits, taxes, wasteful spending, limits on trade and immigration, etc.
b. Citation Bias: Fox (Right), Other Broadcast Networks (Left)
c. Effect of Bias: Remarkably small, due to self-selection by voters

2. Economic Votinga. Prospective voting:
Voting based on expectations of policy/outcomes
Examples:• McKinley 1896: “The Full
Dinner Pail”
• 2008: From Obama and McCain

b. Retrospective Voting
1932: FDR against Hoover 1952: Eisenhower asks,
Who Raised Prices? 1984: The Train:
Retrospective success 1992: How Ya Doin’?
Retrospective Failure
IN GENERAL: Retrospective economic voting overwhelms prospective economic voting
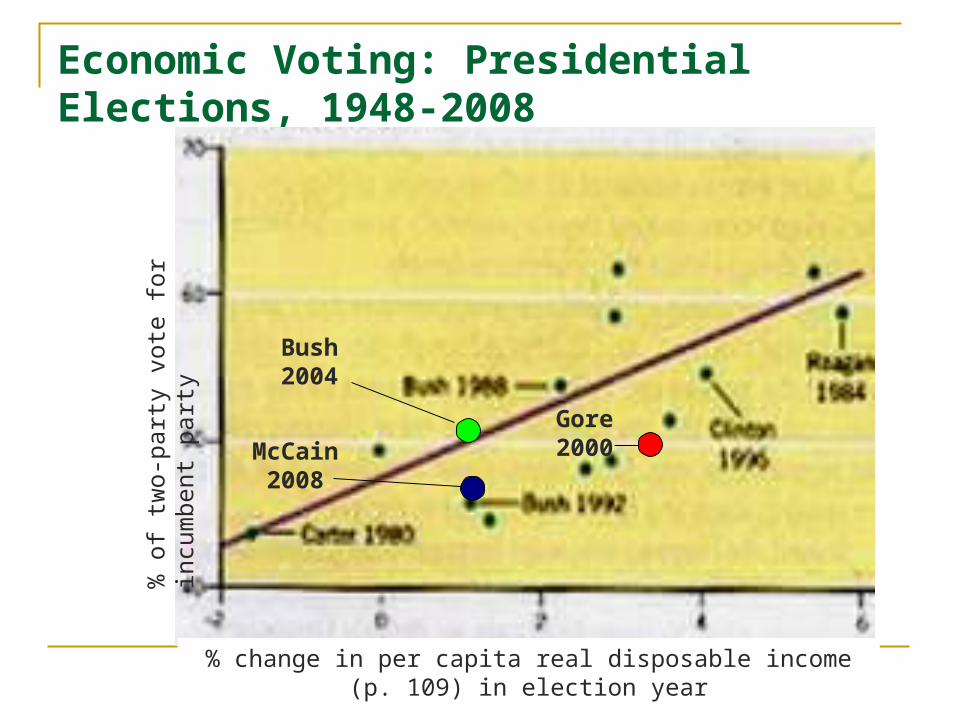
Economic Voting: Presidential Elections, 1948-2008
Gore 2000
Bush 2004
McCain 2008
% change in per capita real disposable income (p. 109) in election year
% o
f tw
o-pa
rty
vote
for
incu
mbe
nt p
arty

2008

3. Behaviora. Protest: “Bonus Marchers,” “Battle of
Seattle,” “Tea Parties”
b. Non-compliance: Tax Evasion, Failure of “WIN” Campaign
III. The Federal Budget: An Overview
Who pays? Who gets what?

A. Revenues: Microeconomic Effects (Who pays?)
1. Tax code is best place for political favors.
Why?
a. Permanence -- Tax law remains unless someone repeals it. Spending requires reauthorization every year.
b. Less visible -- Public doesn’t understand tax code

2. Class differencesa. Progressive taxes (Wealthy pay higher % of
income) Income Tax: Tax on earned income. Does not
apply to investments. Capital-Gains Tax: Tax on investment income. Estate Tax: Tax on wealth over $2 million ($4
million if married) after death (2009 figures)

b. Regressive taxes (Poor pay higher % of income)
Excise Taxes: Tobacco, Alcohol, Gasoline, etc.


b. Regressive taxes (Poor pay higher % of income)
Excise Taxes: Tobacco, Alcohol, Gasoline, etc. State Taxes:
Sales tax (poor consume larger fraction of income) Property tax: Effect on rent tends to make tax regressive
(poor pay larger share of income for housing)

State and Local Taxes: Regressive

b. Regressive taxes (Poor pay higher % of income)
Excise Taxes: Tobacco, Alcohol, Gasoline, etc. State Taxes:
Sales tax (poor consume larger fraction of income) Property tax: Effect on rent tends to make tax regressive
(poor pay larger share of income for housing) Payroll Taxes (depends on definition): Social Security
and Medicare taxes. Paid only on the first $90,000 of wages. Not paid on investments or on wages over $90,000 (2005 figure).

c. Flat Taxes
Also known as Proportional Taxation Definition: Everyone pays same % of income, regardless of
source US System
Consists of progressive and regressive taxes Federal taxes > State taxes Only moderately progressive: Middle income range is
nearly “flat” If progressive taxes become flat taxes, overall
system becomes regressive


Is the US Tax System Flat?

d. Which federal taxes are most important?

B. Spending: Who gets what?

1. Categories of Spending Mandatory –
About 2/3 of the Budget
Discretionary – About 1/3 of the budget

a. “Mandatory” Spending Some laws commit Congress to spend
money in the future. These programs get funding each year if Congress does nothing: Social Security Medicare Medicaid Income Security Interest

Mandatory Income Security, 2002:

Mandatory Spending Increases Every Year…

…partly due to new benefits…

…but mostly due to an aging population…

…and increasing health care costs.

Net Interest Increases as Deficits Increase – But Interest Rates are Unpredictable 1998-2007 data and 2008-2010 projections
0
50
100
150
200
250
1998 1999 2000 2001 2002 2003 2004 2005 2006 2007 2008 2009 2010

b. Discretionary Spending
i. Must be renewed by Congress or funding ceases
ii. Defense is largest discretionary expenditure

iii. Defense Spending: Stability and Change
Defense Spending Since 1940 (Including FY2010 Request)
0
100
200
300
400
500
600
700
800
1940
1943
1946
1949
1952
1955
1958
1961
1964
1967
1970
1973
1976
1979
1982
1985
1988
1991
1994
1997
2000
2003
2006
2009
Fiscal Year
Co
nst
ant
Do
llars
(20
00)

0 50 100 150 200 250 300 350 400 450 500
Next 50
USA
China Russia Japan UK France Italy India Israel Iran North Korea
Germany S. Arabia S. Korea Syria
iv. USA vs. Everyone Else (2007)
Next 50
USA: $586.25 billion in FY 2007 ($666 b in 2008)
0 50 100 150 200 250 300 350 400 450 500 550

C. Programs of Interest
These are already included in the earlier figures
BUT These programs have generated public and
Congressional debate out of proportion to their budgets

2006 2007 2008 2009
1. Programs of Interest: Homeland Security (Including FY 2010 Request)

a. Department Creation = “Must Pass” – Perfect for Interest GroupsUnrelated Amendments:
Eli Lilly: Immunizes drug makers from lawsuits over vaccines
Allows formerly American companies that move to foreign tax havens like the Cayman Islands to win federal contracts
Who were the winners and losers?

b. Large Increases in Funding = Further Opportunities for Interest Groups Authorized in the FY2004 budget:
$2,000,000 to the Great Lakes Region to purchase an Icebreaker so that commercial ships can go through during the winter
$2.5 billion for “highway security,” which consists of building and improving roads.
$70,000,000 for the Homeland Security Fellowship Program for students and universities.
$6,400,000 for the Intellectual Property Rights Center in the FBI. The center’s focus is to combat intellectual property crime – the RIAA and MPAA lobbied strongly for this provision.

2. Programs of Interest: Welfarea. No budget for “welfare”
Social welfare programs include Social Security, Medicare, Medicaid, many others
Most people mean cash, food, and medical aid to the poor: “Means-Tested Assistance”
b. Jointly funded: States pay about one-third

c. Welfare Reform: Cases have gone down….

…and more single mothers are working outside the home….

…but putting them to work is expensive!

d. Where does TANF money go?-- Less cash than AFDC, more Child Care and Work

e. TANF State flexibility: Many states spend money on unique programs

3. Programs of Interest: Foreign Aid


a. US Gives Low % of GDP for development…

…but still manages to be the largest donor

b. Top Three Recipients of US Aid: FY 2001 – FY 2009 (And 2010 Request)
2001 2002 2003 2004 2005 2006 2007 2008 2009 2010
1st Israel Israel Iraq Iraq Iraq Iraq Iraq Israel Israel Israel
2nd Egypt Egypt Israel Israel Israel Afgh Afgh Egypt Egypt Afgh
3rd Jord Pak Egypt Afgh Afgh Israel Israel Afgh Afgh Egypt
Israel and Egypt were the top two from 1979 to 2002 and in the top five ever since 9/11 (along with Iraq, Afghanistan, and Pakistan – countries where US forces have been fighting). Why?

4. Programs of Interest: Research

D. One-Time Expenses: TARP and the 2009 Stimulus Bill (American Recovery and Reinvestment Act of 2009)
1. Unusual for sheer size: $700 Billion for TARP, $800 billion for Stimulus Bill
TARP + Stimulus

2. Stimulus Components (from Recovery.gov)

Seven major slices account for most of the pie

3. Timeline: Actual Spending is staggered over several fiscal years
FY 2010 begins Oct 1, 2009

E. Budget Deficits
Definition: Spending > Revenue Balanced Budget = No Budget Deficit
Technically, no surplus either, but no one objects to a little surplus.

1. Effects of Budget Deficitsa. Interest payments – If economy grows slower than
interest paid on debt, interest becomes larger fraction of GDP requires future spending
b. Increased interest rates – Government borrowing raises the cost of borrowing for everyone else slows growth and increases net interest payments
c. Less investment – Government investment may “crowd out” private investment lower future growth
d. Decreased unemployment and increased inflation – more government spending (or personal consumption from tax cuts) means higher demand should lead to higher employment and rising prices

2. Recent History: Brief Surplus Followed By Deep Budget Deficits


3. The National Debt: Accumulated Deficits


4. Who Does the US Owe?

5. Public OpinionLow Salience: Balanced Budgets Don’t Win Elections