Political dynasties and poverty: Resolving the “chicken or the egg ...
41
Munich Personal RePEc Archive Political dynasties and poverty: Resolving the “chicken or the egg” question Ronald Mendoza and Edsel Beja Jr and Victor Venida and David Yap II Asian Institute of Management, Ateneo de Manila University 1. February 2014 Online at http://mpra.ub.uni-muenchen.de/53361/ MPRA Paper No. 53361, posted 4. February 2014 16:06 UTC
Transcript of Political dynasties and poverty: Resolving the “chicken or the egg ...
MPRAMunich Personal RePEc Archive
Political dynasties and poverty:Resolving the “chicken or the egg”question
Ronald Mendoza and Edsel Beja Jr and Victor Venida and
David Yap II
Asian Institute of Management, Ateneo de Manila University
1. February 2014
Online at http://mpra.ub.uni-muenchen.de/53361/MPRA Paper No. 53361, posted 4. February 2014 16:06 UTC
Political dynasties and poverty: Resolving the “chicken or the egg” question
Ronald U. Mendoza,a Edsel L. Beja Jr.,b Victor S. Venidab , and David B. Yapa
aAsian Institute of Management (AIM) Policy Center, Makati City, Philippines 1229b Department of Economics, Ateneo de Manila University, Quezon City, Philippines 0917
Abstract
Political dynasties—members of the same family occupying elected positions sequentially for
the same position or simultaneously across different positions—have become a common feature
in many developing countries with democratic political systems. In the Philippines, for instance,
political dynasties are prevalent in poorer regions, which lead to the following query: does
poverty bring about political dynasties, or do political dynasties engender poverty? Using an
instrumental variable technique to analyze metrics on political dynasties, we find strong evidence
that poverty entrenches political dynasties but weak evidence that political dynasties reduce or
exacerbate poverty.
JEL Codes: D70; I39; O53; P16
Keywords: democracy; political dynasty; inclusive growth; political equality; social inequality
Corresponding author:
Ronald U. MendozaAsian Institute of ManagementMakati CityPhilippines 1229 Tel: +632-892-4011. Fax: +632-465-2863. E-mail: [email protected]
2
1. Introduction
“Political dynasty” refers to the situation wherein members of the same family are occupying
elected positions sequentially for the same position or simultaneously across different positions.
Industrial countries also have their political dynasties; however, the phenomenon seems most
prevalent in still developing and fairly “younger” democracies.
Many politicians in the developing areas have since taken over the reins of power from their
fathers, husbands, or brothers. For instance, Thailand’s PM Yingluck Shinawatra is a sister of
former PM Thaksin Shinawatra. The Philippines’ former President Gloria Macapagal Arroyo is a
daughter of former President Diosdado Macapagal; and President Benigno Simeon Aquino III is
the son of former President Corazon Aquino. Malaysia’s PM Najib Razak is son of former PM
Abdul Razak. South Korea’s President Park Geun-hye is daughter of former President Park
Chung-hee.1
The political science literature maintains that political dynasties, notably at the local government
level, contribute to the deterioration of political competition and, consequently, contribute to
poor socioeconomic outcomes. And there are several reasons that back up such a conclusion. For
instance, political dynasties can be effective in preventing the people from communicating their
real needs to their government. Political dynasties can weaken existing governance and
1 Other examples include India’s Jawaharlala Nehru, daughter Indira Gandhi, her son Rajiv and daughter-in-law
Sonia; Sri Lanka's Solomon and wife Sirimavo Bandaranaike and daughter Chandrika Kumaratunga; Bangladesh’s
Mujibur Rahman and daughter Sheikh Hasina, as well as Ziaur Rahman and wife Khaleda Zia; Pakistan's Zulfikar
Bhutto, daughter Benazir and her husband Asif Ali Zardari; and Argentina’s Cristina Fernandez, wife of Nestor
Kirchner.
3
accountability mechanisms to secure their positions. More specifically, they can take advantage
of state power for self-serving interests without fear of replacement or administrative sanctions.
They can also use state power to influence the selection of political leaders, thereby favoring
individuals (who are often relatives) with political influence and preventing the best and the
brightest from serving in the government, as well as biasing policies in favor of certain elite
groups. Finally, the concentration of power is tantamount to a non-competitive political system,
which development and political analysts view as a major obstacle hindering growth- and equity-
enhancing as well as poverty-reducing reforms.2
However, recent economic development literature also notes that political dynasties imply
extended time horizons for socio-economic reforms and enable adequate planning and
implementation of policies with long-term goals. Politicians with short and/or tenuous tenures
tend to shun the difficult but necessary reforms that pay-off in the future, instead yielding to
populist demands in order to improve their chances of re-election. The extended time horizons of
political dynasties—notably in the local government and in a highly decentralized governance
context—afford them the longer reform runways necessary to pursue policies and programs that
are critical to sustained, robust, and inclusive economic growth (c.f., Acemoglu and Robinson
2006; Rodrik 2007). It is also possible that legacy-related goals linked to their political
jurisdictions drive the behavior of dynastic politicians. Thus, the longer their tenure is, the more
they tend to care about long term outcomes.
2 See, for example, Lacey (1993), Cullinane (1994), McCoy (1994a; 1994b), Sidel (1997), Coronel (1998; 2007),
Hutchcroft (1998), Hutchcroft and Rocamora (2003), Manacsa and Tan (2005), Teehankee (2007), Curato (2012),
Mendoza (2012), and David (2013).
4
Given both sets of arguments above, the net impact of political dynasties on social and economic
outcomes remains an empirical question. Do political dynasties exacerbate poverty, or does
poverty escalate political dynasties? So which one is the “chicken,” and which one is the “egg”?
This paper develops a pioneering dataset in the Philippines in order to analyze the links between
political dynasties and poverty. It presents perhaps the first, and to our knowledge most
comprehensive, data gathering effort to map the landscape of political dynasties at the local
government (i.e. province) level in the Philippines.3 Even if this study covers a specific country,
the findings are still relevant to other developing countries that are similarly experiencing
decentralization in the context of a developing democracy.
Our results provide strong evidence that poverty lead to more political dynasties. It is possible
that poor economic conditions and the lack of viable economic opportunities reinforce existing
systems of patronage politics. The poor, in essence, exchange their political capital for economic
favors. Similarly, high levels of income and political inequality could prevent the majority of the
population from posing any genuine competition to incumbent dynasties. Moreover, non-
dynasties may not be offering viable alternatives for reform, an interpretation that is consistent
with anecdotal evidence that the existing political “rules of the game” are in part perpetuating
traditional patron-client relationships, thus, ensuring the survival of existing political dynasties
and encouraging the emergence of new political dynasties. On the other hand, the empirical
findings herein also suggest that political dynasties, on average, do not seem to increase or
decrease poverty.
3 Other empirical studies in the Philippines have not yet reflected the full mapping of political dynasties at the level
of the local government (i.e. province). See, for example, Balisacan and Fuwa (2004), Querrubin (2010; 2011), and
Mendoza et al (2012) that look at political dynasties in the country at the aggregate level.
5
The rest of the paper has four sections. Following the introduction, Section 2 presents a brief
review of the literature on the relationship between political dynasties and socioeconomic
outcomes. Section 3 describes the methodology and the data used in the analysis. Section 4
elaborates on the findings. The last section presents the implications of the findings and then
concludes the discussion.
2. Review of Related Literature
There is an extensive literature on political dynasties per se. However, few studies examine the
impact of political dynasties on socio-economic outcomes. The bottom line questions pertain to
causality: Are political dynasties responsible for persistent poverty (i.e., perpetuating the status
quo, weakening democratic competition and accountability, and undermining meritocracy and
competitiveness); or, does poverty generate political dynasties (i.e., strengthening patron-client
relations defined by a dependence of the poor on political patrons and preventing the emergence
of new leaders with possibly better skills)? In this section, we briefly discuss three sets of
literature, covering political self-perpetuation, the links between political dynasties and
socioeconomic outcomes, and the role played by education and media in politics. Taken together,
these studies piece together a framework on how to tackle the questions posed earlier.
2.1 Self-perpetuation
Political dynasties exist in many democracies, and there appears to be strong evidence on elected
officials’ ability to self perpetuate. Dal Bo et al. (2009) examine data on the Congress of the
United States since its establishment in 1789 to uncover the forces that bring about political
6
dynasties. They hypothesize that (1) political dynasties emerge because some families possess
certain characteristics (like political ambition and acuity), giving them persistent advantages in
the political arena and; (2) political dynasties emerge because it is possible to accumulate and
bequeath political capital and influence to family members. Their study shows a large decline in
political dynasties in the US Congress over time: from 12 percent of legislators that were
dynastic between 1789 and 1858 to six percent after 1966. Using regression discontinuity as an
identification strategy, they find a causal link between longer tenures in the US Congress and the
likelihood that relatives also successfully enter the Congress.4 This finding suggests that a
politician’s time in office could help build a strong image or trusted “brand” that further
contributes to the success of family members who might later also run for office.
Dal Bo et al. (2009) also find an inverse relationship between the presence of a political dynasty
and the degree of political competition within their jurisdictions. One explanation, they posit, is
that under intense political competition, political parties end up fielding non-dynastic and more
talented candidates over dynastic candidates. If longer Congressional tenure increases the
probability of an official establishing a dynasty, then the transmission of the office to another
member of the family may be due not so much to the newer officials' personal qualities valued
by voters (such as experience or human capital) but more due to connections with a stronger
party machinery. This setup is therefore a possible explanation why dynasties prevail in states
where political competition is weaker.
4 The authors compared legislators who barely won and barely lost their electoral campaigns: those who barely won
their first re-election were more likely to have a relative entered Congress than those who barely lost their first re-
election.
7
In addition, Rossi (2009) examines the persistence of political dynasties using data on both
houses of the Argentine Congress. He turns to a dummy variable to proxy for a political dynasty,
taking a value of one if the legislator had a relative who also served in the Argentine Senate. In
order to deal with the endogeneity issue (i.e. of tenure and elected official’s characteristics),
Rossi leverages a natural experimental setting in Argentina in 1983 when shorter and longer
tenures in the Senate (as mandated by the new constitution) were randomly assigned.5 Similar to
Dal Bo et al. (2009), this study by Rossi (2009) in Argentina also finds evidence that a longer
tenure in office is positively associated with having a relative serving in the same office in the
future. Longer tenure increases the probability of a relative in a future Congress. Name
recognition is an important asset in the perpetuation of a political dynasty and, in fact, a common
surname dominates the advantage of a longer tenure in raising the probability of establishing a
dynasty.
Furthermore, Asako et al. (2010) develop a theoretical model of the behavior of dynastic
politicians with inherited political advantages. They predict that, first, dynastic candidates
possess an electoral advantage over non-dynastic candidates and, second, dynastic politicians
pursue distributional programs but do not promote sustained growth because spending on
redistribution programs tend to be small.6 These authors attempt to validate their theoretical
5 Previously, Argentine Senators had nine-year terms. The Argentine Constitution required the renewal of a third of
the chamber every three years. In order to accomplish this, they randomly allocated one third of the senators elected
in 1983 to three-year terms and another one third to six- year terms. This exogenous assignment of terms is not
associated with the characteristics of the Senators, hence serving as a viable identification strategy.6 These results are consistent Solon et al. (2009), who studied the public education and health spending of Philippine
Governors elected in 1992, 1995 and 1998. Solon et al. (2009) found evidence that incumbent governors improve
their re-election chances with higher spending on economic development services. Yet this increase in spending
does not necessarily mean that total human capital investments are adequate compared to the scale of need.
8
model using data on the National Diet of Japan. To deal with the endogeneity problem, Asako et
al. use the number of male children of previous lawmakers as an instrumental variable for
dynastic rule, since Japanese lawmakers passed on their political seat primarily to their male
children.7 Their results indicate that districts electing dynastic legislators tend to enjoy larger
intergovernmental transfers, yet they display weaker economic performance. The authors argue
that this pattern is largely due to the type of spending these leaders prefer, which typically focus
on much smaller groups, even as they tend to bring more transfers to their districts.
Recent empirical analyses on political dynasties in the Philippine Congress arrive at similar
results on self-perpetuation. Defining dynasties in a similar way as the earlier studies above,
Querubin (2010a) finds that over 50 percent of legislators in the Philippine Congress and
governors have a relative who was also in Congress or served as governor in the previous 20
years. He estimates that the capacity for self-perpetuation of Filipino legislators is three times
higher than that of legislators in the United States (i.e. Dal Bo et al. 2009). Furthermore,
Mendoza, et al. (2012) uncovers evidence that political dynasties in the 15th Congress won by
much larger margins of victory, and tended to be wealthier. Nevertheless, they also find that
Philippine provinces with higher levels of political dynasties also display higher levels of
poverty and weaker indicators of human development. That study sheds light on the correlation
between political dynasties and poverty while not yet ascertaining the direction of causality.
Like Dal Bo et al. (2009) and Rossi (2006), Solon et al. (2009) estimates the probability of re-
7 During the period between 1996 and 2007, over 90 percent of Japanese politicians are male. Daughters are unlikely
to form part of political dynasties. Of over 120 Japanese politicians described as dynastic, only 3 are women (Asako
et al. 2010).
9
election, and in this case using a logit framework and panel data on Philippine governors for
1992-1998. Their results suggest that an increase in development-oriented projects (specifically
expenditures on health care and public works) would tend to increase the probability of re-
election, especially in the lower income provinces.8 Interestingly, provincial per capita income
tends to grow less in the provinces with weaker political competition, whether among rival
dynasties, or between dynastic and non-dynastic candidates. This latter conclusion seems to
confirm a result of Dal Bo et al. (2009) mentioned earlier.
Schaffer (2002) also studies the practice of vote buying in the Philippines, and his analysis
reveals how low-income voters tend to prefer candidates and political groups that show respect
and a degree of compassion to the low-income population. Thus, the advocacies of middle class
groups and stakeholders that have used advertisements and leaflets to advocate against vote-
selling are often regarded as patronizing by low income voters. Indeed, as Schaffer (2002)
argues, these voters do not see themselves as selling their votes. It is possible that political
dynasties successfully establish themselves as the patrons to poor and vulnerable communities,
while still showing a measure of respect and compassion that low-income voters appreciate. And
so the manner in which a candidate interacts with voters has strong influence on the outcome of
an election. In other words, political dynasties have succeeded in developing, or even perfecting,
the means to cultivate familiarity, or even dependence, among voters. This view is in sharp
8 Similarly, Capuno et al. (2012) analyze a panel dataset of municipalities and cities in three election years in the
Philippines. They find evidence that yardstick competition in social insurance provision (i.e. more subsidized
insurance coverage for the poor in neighbouring local governments) leads to an increase in coverage offered by
incumbent politicians. They interpret the situation as a strategy to secure political support during elections. Analysts
contend that the use of the so-called “pork barrel” funds help in increasing the chances of re-election and in
perpetuating the hold on political office (e.g. Parreño 1998; Ravanilla 2012).
10
contrast to those of the non-dynastic and progressive groups, which typically advance the
messages of empowerment, self-help, accountability, and voter responsibility.
More recently, Ravanilla (2012) finds evidence that political dynasties may use public funds to
support allies and their clan members. His analysis of the disbursement of the constituent
development fund (CDF) of legislators—the so-called “pork barrel”—tends to favor local
patrons, particularly mayoral partisan allies in their districts. Such a skewed allocation of
resources could also potentially weaken the chances to attain policy objectives such as poverty
reduction, as argued by Mendoza, et al. (2012). Hence, self-perpetuation and (less robust)
poverty reduction outcomes appear linked to each other, even as it appears that political patrons
are trying to spend public funds in a “pro-poor” way.
2.2 Political dynasties and poverty
There are few rigorous empirical studies on the causal links between political dynasties and
poverty as well as other socio-economic outcomes (e.g., Asako et al. 2010; Balisacan and Fuwa
2004). In the Philippines, Balisacan and Fuwa (2004) study economic growth and poverty
reduction in the provinces between 1988 and 1997, examining a number of possible factors
behind this, which includes the prevalence of political dynasties at the provincial level. They
interpret political dynasties (measured as the proportion of provincial officials related to each
other by blood or affinity) as a proxy for political competition, i.e. there is lack of political
competitiveness if there are more dynasties. Among the initial economic conditions in their
regression framework, they find a negative association between the initial level of human capital
stock (as measured by the child mortality rate) and provincial consumption per capita.
11
Moreover, Balisacan and Fuwa (2004) also find a positive link between initial inequality and
land distribution to income growth. Their political dynasty variable is associated with a
statistically significant negative effect on subsequent per capita income growth. Their result, they
argue, is in line with the literature on Philippine politics, asserting that the Philippines’
uncompetitive political system has become one of the major factors behind poor policies and
lackluster economic performance. However, these same authors find very little evidence of a link
between political dynasties and poverty at the provincial level.9 The authors note that there is
much scope for improving on their empirical analysis, considering that the construction of their
political dynasty variable relied on interviews rather than from actual identification of political
dynasties using a clear-cut definition.
2.3 Education and media
The political science literature also helps shed light on some of the possible reasons behind these
empirical results. Teehankee (2007), for example, argues that the emergence and persistence of
political dynasties stems from the highly unequal socio-economic structure of Philippine society
and the failure of the country to develop a truly democratic electoral and party system. Weak
institutions and their associated outcomes—such as poor education attainment—also contribute
in enhancing the political strength of small elite groups. The inability of the majority to contest
the elite sets the stage for the emergence of numerous political dynasties.
9 There was minimal reduction in poverty levels in the 1960s and the 1970s. Poverty reduction was below
international standard even when poverty reduction was at its highest pace in the 1980s and the 1990s. Poverty
levels in the 2000s appear to be relatively stagnant.
12
The above view emphasizes how poverty and inequality operate to generate a demand for
patrons. In an environment beset with aggregate economic shocks and crises, and absent a strong
social safety net (e.g. unemployment insurance, health insurance, redistributive transfers), the
poor have little recourse but to seek support from local patrons. This situation helps in
entrenching personality-based politics and governance. Hence, political dynasties may be a
manifestation of economic inequalities in the political sphere (Mendoza 2012).
Meanwhile, Coronel (2007) suggests that a combination of factors like wealth, popularity,
political machinery, alliances, myth, and violence contribute to the formation of political
dynasties.10 In addition, Sidel (1997) notes that Philippine politicians have to spend an inordinate
amount of money to have an effective campaign because of the need to combat and/or engage in
vote buying, electoral fraud, and coercion.11 In turn, access to elected office opens opportunities
and resources to enable political dynasties to consolidate and expand their economic and power
bases (McCoy 1994a, 1994b).12 Coronel also argues that popularity often plays a prominent role
in the establishment of political dynasties in the country, especially for national-level politics.
Media thus plays an important role in promoting certain “personalities”, helping to solidify name
recall among the electorate. Teehankee (2007) posits that the primacy of the media in elections
has enabled a number of politicians to build the foundations of their dynasties upon their
projected public images. Name recall and recognition serve to cultivate the image of a candidate,
10 The annex of this paper contains selected examples of Philippine political dynasties and a schematic mapping of
one political clan.11 Querubin (2010) finds that dynastic incumbents were about 50 percent richer than non-dynastic ones.12 Filipino elite families succeeded in transforming their entrepreneurial success as political success in both the local
and national level, or vice versa. See, for example, McCoy (1994a).
13
reinforce political viability, and facilitate the emergence of a political dynasty. Most analysts
also concede that this has created strong incentives for politicians to promote name recognition
through various means, including by seeking to “label” programs and projects like infrastructure
(schools, health centers, and roads) and transportation (ambulances and utility vans).
Indeed, the work of Schaffer (2002) underscores the importance of understanding the perspective
of the poor as regards to the role of elections and voting. In what seems to be an understudied
phenomenon, Schaffer utilizes focused group discussions (FGDs) and interviews among low-
income voters in a few communities and notes the disparity in attitudes and presuppositions
between the poor and the reform-minded, generally non-dynastic political organizations like the
National Citizens’ Movement for Free Elections and the Parish Pastoral Council for Responsible
Voting in the Philippines. He further observes that many of the information and advertising
materials seem quite patronizing to the poor, many of whom claim to be offended by the
presumption that the poor are willing to sell their votes. Indeed, the study participants insist that
they would like a measure of respect and compassion shown to them, by way of the candidates’
manner of dealing with voters, their political slogans and statements, and their demeanor toward
the poor. Perhaps, these political interactions which are more agreeable to voters are more easily
adopted and developed over time among the dynastic groups (who enjoy the benefit of extensive
inter-generational political experience); and much less likely so for the non-dynastic groups. It is
also likely, in our view, that reform-minded politicians will face challenges in changing mindsets
as far as patron-client relationships are concerned. Indeed, attempts to correct these long-
engrained relationships appear insensitive to the conditions of the poor (Clarke and Sison, 2003).
Sidel (1997) also notes that several dynasties owe their success to their close affiliation with
14
more powerful political entities, while Coronel (2007) argues that political dynasties often
consolidate their power through mergers. Further, the consolidation of power and influence is
most apparent among political clans who seek to occupy several elected positions
simultaneously. These strategies enable prospective political dynasties to draw upon larger pools
of resources and broaden their political influence.13 Take for instance the widely known boxer-
turned-legislator, Emmanuel "Manny" Pacquiao, who ran unopposed as Congressman in the
Philippines during the May 2013 elections, while his brother Rogelio also ran for Congressman
(of another district), and his wife Jinkee ran for Vice-Governor of Sarangani Province. Similar
actions of non-dynastic leaders lead to the same pattern of political consolidation.
3. Methodology and Data
In this paper, we juxtapose two regression models in order to examine the relationship between
political dynasties and poverty with the Philippines as a case study. Briefly, the first model takes
on a standard neoclassical growth setup and the other relies on the political science variables
concerning the development and persistence of political dynasties. The juxtaposition of the two
models enables us to do a more comprehensive test on the direction of causality between
political dynasties and socio-economic outcomes.
Our analysis in particular leverages a particularly rich dataset at the sub-national level. We take
this strategy in order to ensure comparability of income and poverty at the same level of
aggregation, control for aspects of the political system like degree of competitiveness among
13 Gerring et al. (2005) examine the relationship of economic growth and democracy among several countries over a
long period and argue that democracy is more of a stock variable rather than a flow variable.
15
political actors, and account for bias due to the correlation between initial income level and
unobserved individual (province level) specific effects. This strategy indirectly also corrects for
unobserved characteristics. Provincial-level data likewise controls for differences in geographic,
and to some extent, cultural and ethnographic characteristics. Accordingly, we circumvent any
heterogeneity brought about by, say, technology and preferences (c.f., Balisacan and Fuwa
2004).
3.1 Factors behind poverty, including indicators of political dynasties
The first regression model essentially follows the setup in Balisacan and Fuwa (2004). Thus,
(1)
where is the change in headcount poverty between 2003 and 2006 in province i with
2002 and/or 2003 as initial condition; is the level of per capita expenditures for
province i in 2003 as initial condition; is a set of determinants of the steady-state income
level consisting of initial conditions and time-varying policy variables; and is the error term.
Moreover, Xik includes measures of human capital (child mortality and literacy), institutions
(agricultural area under irrigation, change in agricultural terms of trade, access to electricity, road
density, and land covered by agrarian reform), and political dynasties (proportion of provincial
officials related to each other by blood relations or affinity).
Specifically, the indicators of political dynasties are:
16
DYNSHA: This builds on the dynasty indicator used in Balisacan and Fuwa
(2004) by defining and encoding the actual number of dynasties (and not just the
approximated share based on experts’ opinions). For the analysis of the impact of
political dynasties on outcomes, dynasties are defined as those elected officials in
2004 with relatives in 2004 and in 2001; and then the actual number of dynasties
encumbering the top local government positions are more precisely measured, and
covering the following positions: governor, vice-governor, mayor, vice-mayor,
district based representatives and provincial board members. (Thus, the political
dynasties variable covers the preceding period under examination.) DYNSHA
measures the share of dynasties in all these positions for each province.
DYNLAR: In order to account for the potentially large size of particular clans—
or the presence of “fat” dynasties—DYNLAR indicates the number of positions
encumbered by the largest political dynasty in each province. A simple thought
experiment demonstrates the relevance of DYNLAR. Suppose in province A, for
example, there are ten elected positions occupied by eight dynastic officials but
each is not a relative to the other. That is, they are from eight distinct political
clans, but they each have relatives in past elected positions in the province. In
province B, also with ten elected positions available, there are eight dynastic
officials and all are relatives. That is, they come from one political clan and they
all have a family member serving in an elected position in the past. The
DYNSHA indicator will be the same value of eight, for provinces A and B.
However, the DYNLAR indicator will reflect the value one for province A and
the value eight for province B. DYNLAR therefore captures the possible effect of
17
more concentrated political power even among political dynasties.
DYNHERF: Another way to capture the presence of “fat” dynasties is to draw on
the industrial regulation literature and use a variant of the Hirschman-Herfindahl
index applied to political dynasties at the provincial level. Essentially, DYNHERF
is the sum of squared shares of the total positions of each political clan in each
province. Hence, if there are 10 elected positions in province A, and there are
three political clans, with family members elected to three positions for clan-1,
two positions for clan-2 and one position for clan-3, and the five other elected
positions are non-dynasties, then DYNHERF will take the value 14—that is,
32+22+12. DYNHERF is a more nuanced indicator of the concentration of political
power because it puts greater weight on those political clans with larger shares of
the total positions (while also considering the other “fat” dynasties in the
province). In the Philippines, this nuance is important because some provinces are
dominated by just one large clan, while in others, several medium-sized clans are
present.
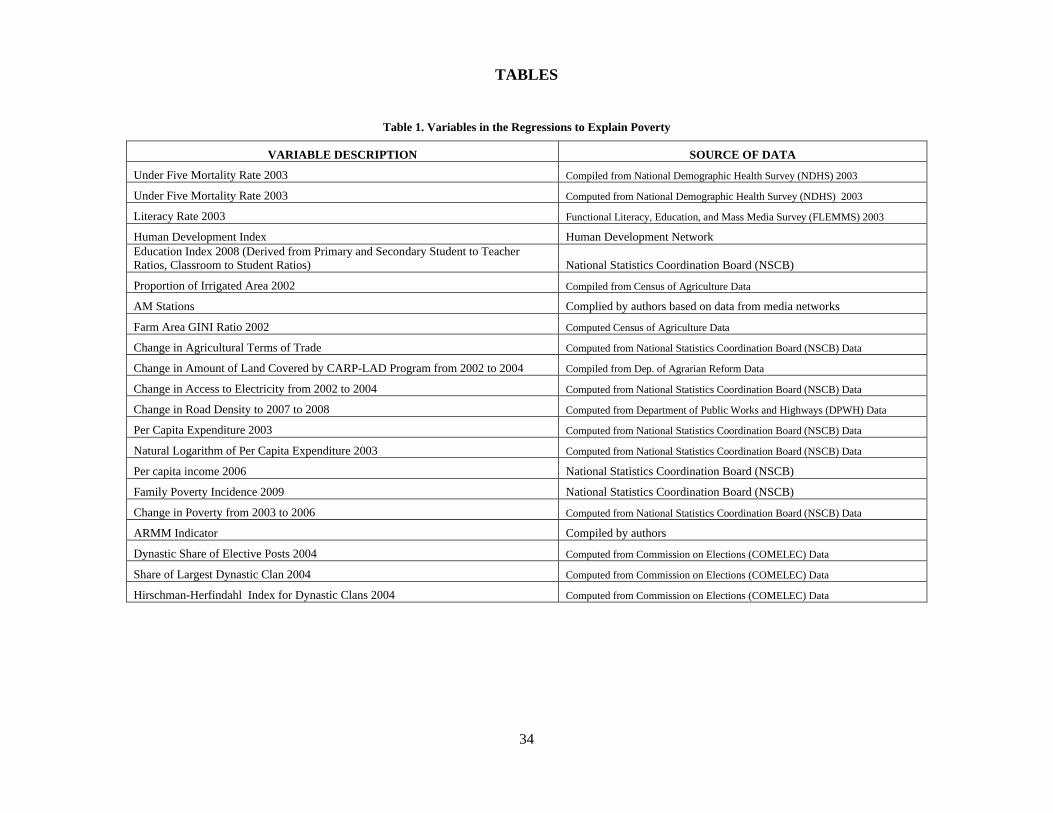
Table 1 is a summary of the variables, including their definitions and sources. The expected
result from Equation 1 is as follows. First, political dynasties could have a strong positive
association with poverty incidence. This expectation draws from the view that an increase in
political dynasties implies a decrease in political competition, in turn reflecting a tendency for
weaker accountability. On the other hand, political dynasties might also possess a long runway
for reform, as well as legacy motivations, in turn suggesting a negative relationship with poverty.
That is, due to their long runway for policy reforms, political dynasties could be more successful
18
in reducing poverty.
In addition, we expect the lagged measures of human capital to be negatively associated with
poverty incidence. Higher levels of human capital are associated with better access to a wider
array of socioeconomic opportunities and outcomes. Furthermore, higher scores on institutional
variables translate into lower levels of poverty incidence.
[INSERT TABLE 1 HERE]
3.2 Factors behind political dynasties, including poverty
The second regression model identifies the possible factors that influence the prevalence of
political dynasties as described in the economics and political science literature (refer again to
Section 2). However, the possibility of endogeneity between poverty and political dynasties
necessitates the use of instrumental variables in the regression analysis. Specifically, we use the
average annual rainfall in each province and the distance of a province to the capital city, Manila,
as instruments for poverty. In this case, the pattern of regional economic development in the
Philippines reflects the positive correlation between rainfall and distance from the capital city,
with poverty. More importantly, rainfall is a useful instrument for our analysis because it has no
association whatsoever with election outcomes since Philippine elections take place in the
middle of the dry season and voters would not be expected to attribute the average level of
rainfall to incumbent officials. In addition, given that elections are held during the summer in the
Philippines, voter turnout is not expected to be affected by inclement weather. While it can be
argued that climatic shocks such as severe droughts and typhoons could dramatically decrease
19
agricultural output, aggravate poverty in agricultural communities, and consequently, reinforce
patron-client relationships, the instrumental variable under consideration is the average rainfall
and not the minimum or the maximum amount of rainfall. These instruments are thus not
expected to be associated with dynastic prevalence in the country.14 Furthermore, no statistically
significant relationships were found upon regressing the dynasty variables against the chosen
instruments.
Our regression model is thus:
(2)
where the dynasty indicators include DYNSHA, DYNLAR, and DYNHERF and the right-hand
side indicators represent factors that contribute to the prevalence of political dynasties.15 The
dynasty indicators under consideration in this section (as distinct from the previous regression
model) were generated from official election data for the 2010 elections (c.f., Section 2.1). More
specifically, dynastic officials refer to those officials elected in 2010 with relatives in 2010 and
2007—that is, we turn to a different period for the dynasty variable in order for it to cohere with
the period of the explanatory variables being utilized in the analysis.
14 These instruments are common in the literature that examines poverty and income, as both tend to be endogenous
with other contextual variables (e.g., Acemoglu and Robinson 2006).15 It is possible that for contiguous provinces a positive correlation in political competition exists (e.g., Capuno et al.
2012). We thus re-estimate Equation 2 with a contiguity matrix to control for common border effects. The findings,
however, are not qualitatively different from those that excluded a continuity matrix. The results are available upon
request.
20
FAMPOVINC09 refers to the estimates of family poverty incidence in 2009 at the provincial
level generated from the first stage of the instrumental variable regression procedure. It is
possible that more families mired in poverty in a province perpetuate the prevailing patron-client
relationships that help to protect poor families from income shocks and poverty and thus keep
political clans in power. AMS refers to the number of AM Radio Stations operating in each
province. This indicator is a proxy variable to capture the relative strength of the media, which
could help level the playing field by helping to temper excesses of those in power, as well as
providing a platform for civil society and non-dynastic leaders to engage the public and
electorate. Then ARMM is a dummy variable for the Autonomous Region of Muslim Mindanao.
It takes a value of one for a province belonging in the ARMM and zero otherwise. The ARMM
indicator seeks to capture the different leadership pattern in this area given its distinct historical
and cultural background. (Christianity is the predominant religion in much of the Philippines,
except in ARMM where there are many Muslim Filipinos.) Because contiguous provinces can
exhibit higher levels of political competition (c.f., Capuno et al. 2012), we control for it by
introducing a contiguity matrix in Equation 2.
We also introduce other controls to test the robustness of the poverty-dynasty relationship. They
include a measure of human development (HDI1), education using primary and secondary
student to teacher ratios (EDUC08), and average per capita income in 2006 (PCI06). Higher
average income, human development and education could mean a reduced demand for protection
and support from a patron and, as consequence, new leaders emerge, leading to the creation of a
more competitive political environment.
Again, Table 1 presents a summary of the definition of variables and their sources. The expected
21
result from Equation 2 is as follows. Higher poverty incidence is likely to be associated with the
prevalence of political dynasties. A greater proportion of the electorate living below the poverty
line provides political dynasties more opportunities to engage in transactional politics, possibly
exploiting the absence of a social safety net and the poor people’s need for protection and
support.
We also introduce a variable representing the number of AM Radio Stations in a province taking
from the argument that a stronger media presence in a province helps in leveling the political
playing field, which contributes to the decrease political dynasties. A stronger media would
afford the electorate (1) more opportunities to promote transparency and (2) provide a viable
means to hold errant officials accountable. The variable ARMM is a control for the socio-
political structure and history that include hereditary and hierarchical leadership structures (e.g.
sultanates) in southern Philippines. Finally, the measures of human development such as
education, HDI, and per capita income can lead to a decline in political dynasties because they
help weaken patron-client relationships and systems of transactional politics.
4. Results
4.1 Do political dynasties cause more poverty?
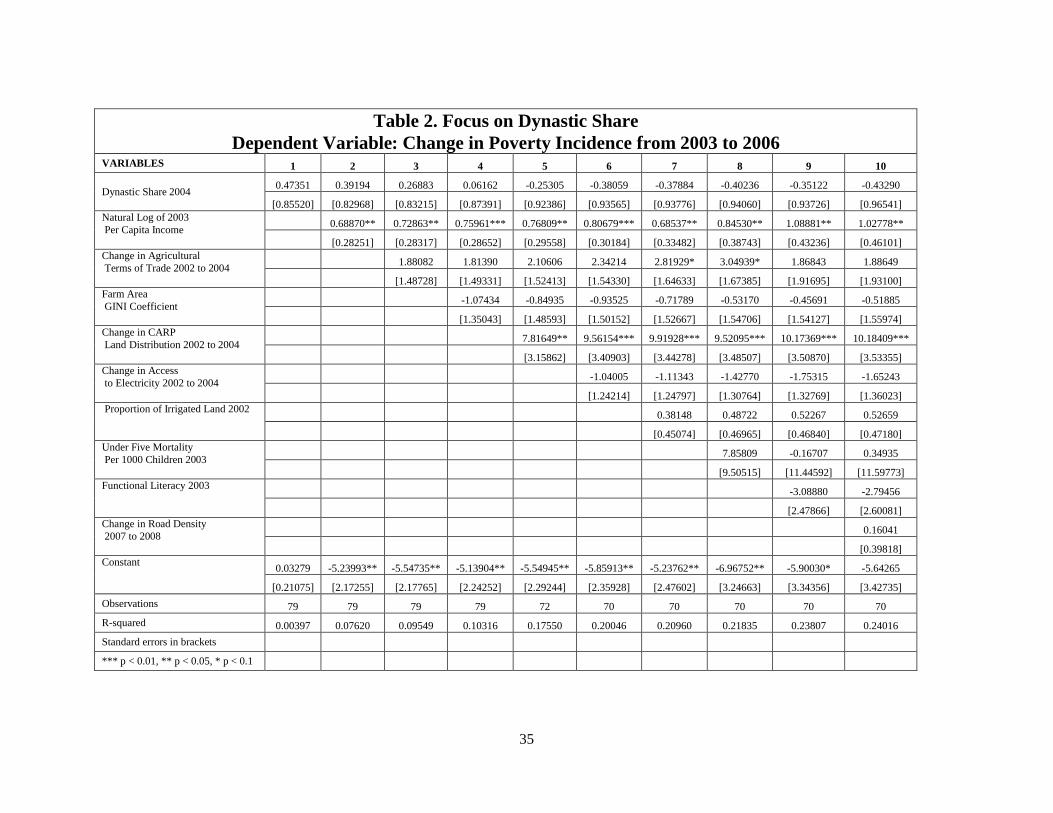
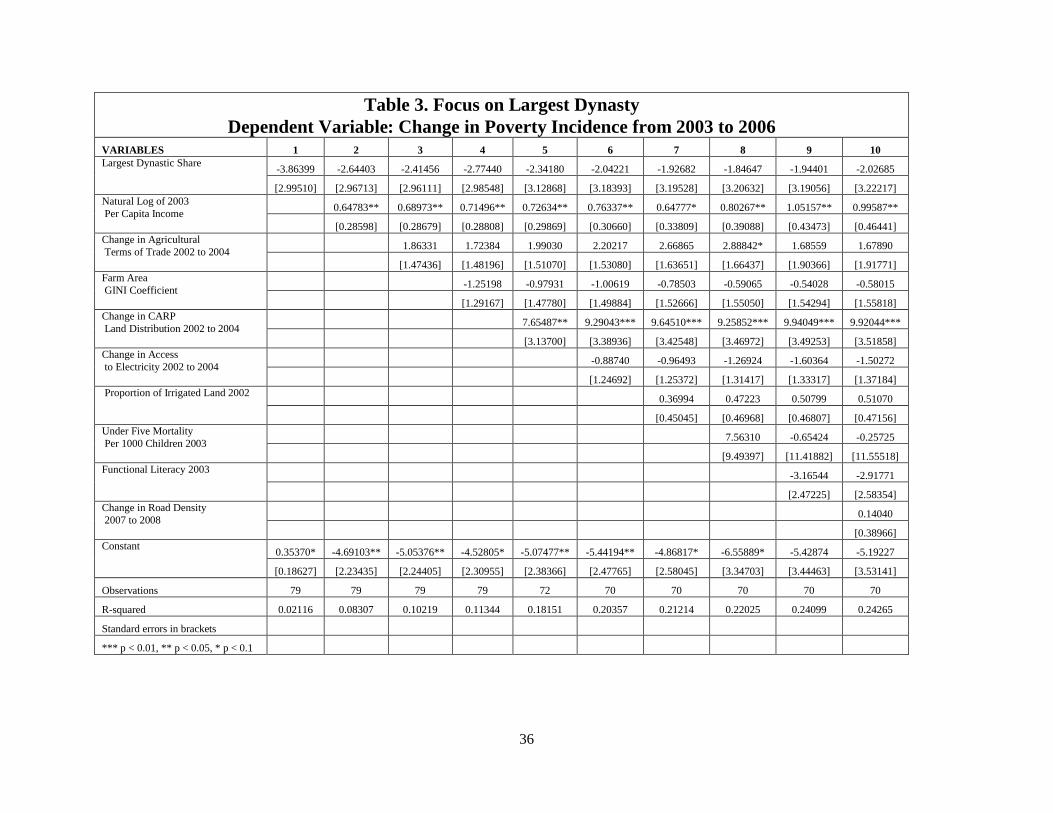
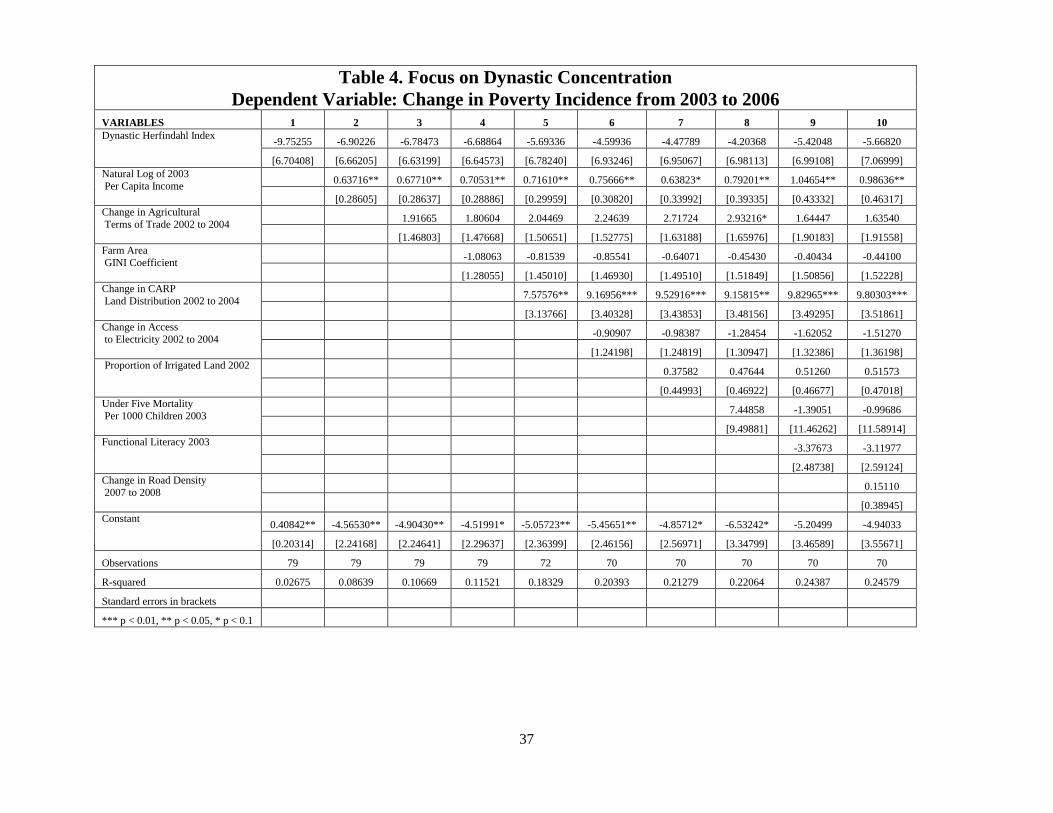
Tables 2 to 4 present the regression results for Equation 1. Similar to Balisacan and Fuwa (2004),
we also find evidence that the initial per capita expenditure is positively associated with the
change in average poverty headcount (p < 0.05). Notice, though, that the size of the coefficient
on the initial per capita expenditure is increasing when there are additional variables in the
22
model. This pattern not only reveals a strong poverty hysteresis in the Philippines but also
bolsters our findings on the reverse causality of political dynasty (below). As with Balisacan and
Fuwa (2004), too, agrarian reform is positively associated with the change in average poverty
headcount (p < 0.01). This result confirms the argument that land distribution is fundamental for
poverty reduction in the country. The coefficient on agricultural terms of trade turns out to have
no statistical effect on poverty reduction, a finding that diverges from Balisacan and Fuwa
(2004).16
[INSERT TABLES 2 TO 4 HERE]
The results for DYNSHA, DYNLAR, and HYNHERF indicate no statistical significance at all,
albeit the estimated coefficients all have negative signs. The results suggest that political
dynasties and poverty are independent processes, especially when compared to non-dynasties.
Conversely, the results also suggest that the non-dynasties are not offering a “better” alternative
in terms of reducing poverty. Indeed, this interpretation coheres with the observation that most
political parties in the Philippines are not strong platforms for promoting and sustaining policies
that benefit the poor. Instead these parties are viewed by some analysts are more interested in
introducing policies that entrench political dynasties. Even some non-traditional and non-
dynastic politicians elected to office appear to be evolving as traditional politicians and forming
their own political dynasties.17
16 This finding is possibly due to the slightly different period under analysis.17 See, among others, Coronel (1998; 2007), Manacsa and Tan (2005), McCoy (1994a; 1994b), and Teehankee
(2007).
23
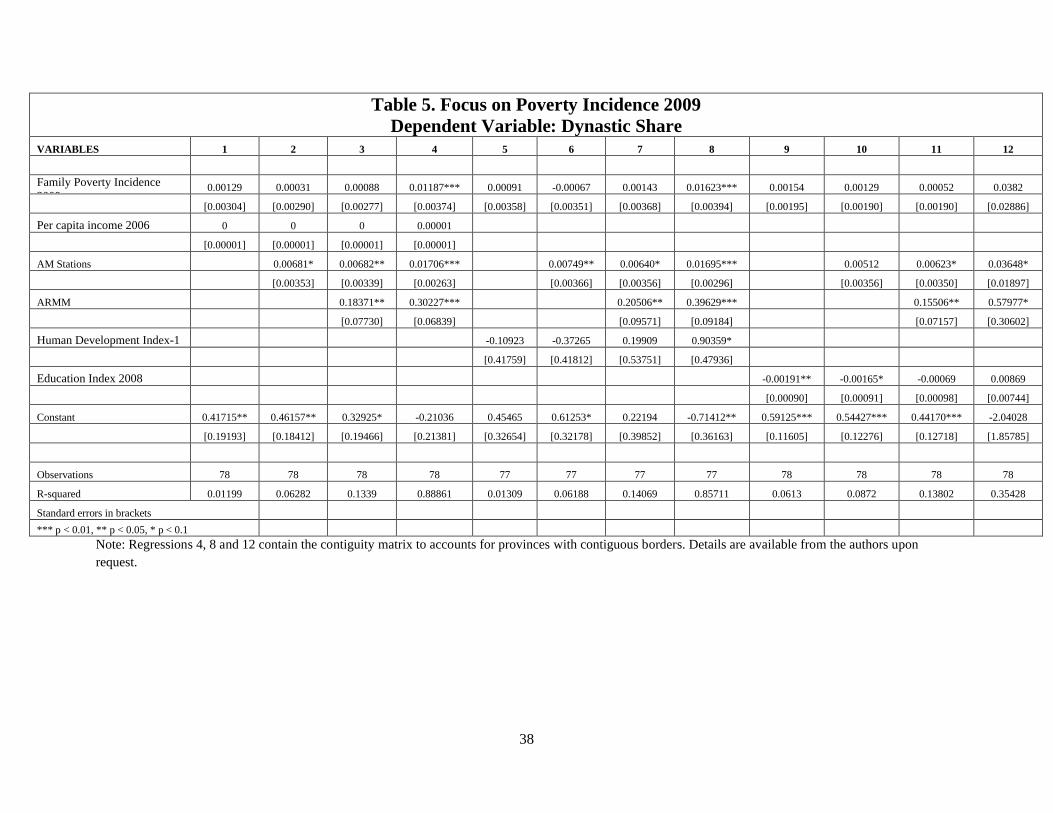
4.2 Does poverty create more dynasties?
Next, Tables 5 to 7 summarize the regression results for Equation 2. Columns 1 to 4 in each table
represent the equations using per capita income as an additional right-hand-side variable with
poverty. Columns 5 to 8 use the human development indicator per province. Then, Columns 9 to
12 use an education indicator.
[INSERT TABLES 5 TO 7 HERE]
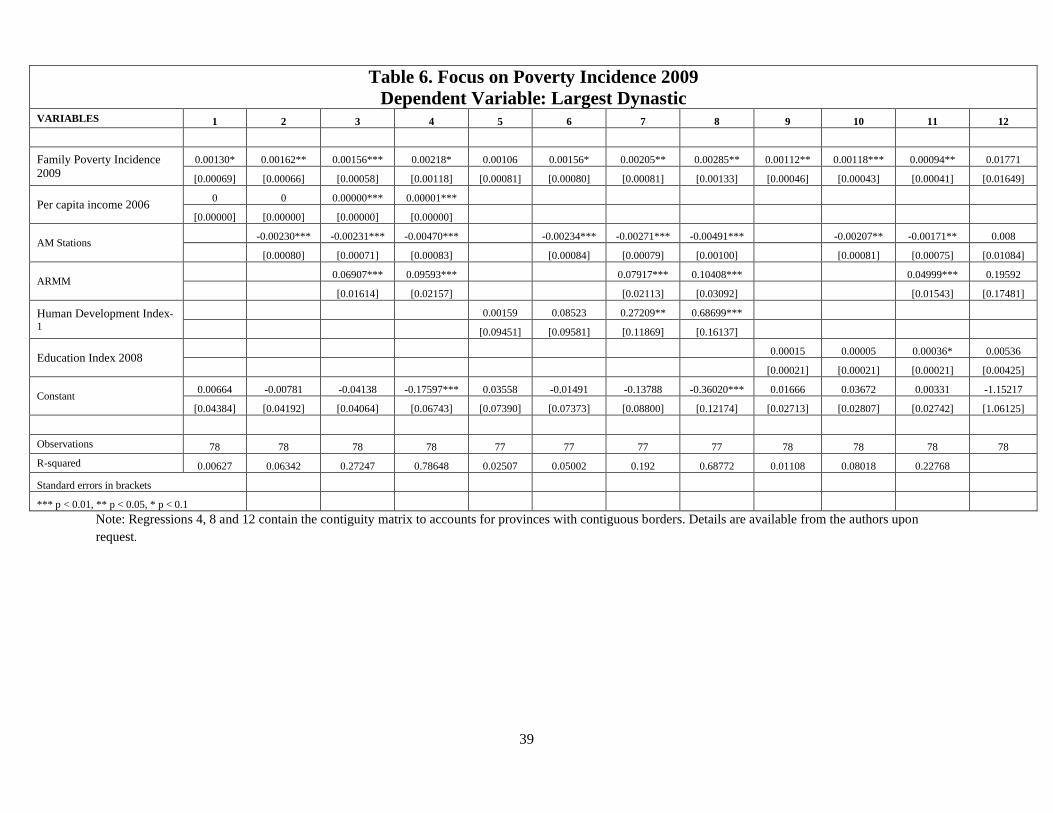
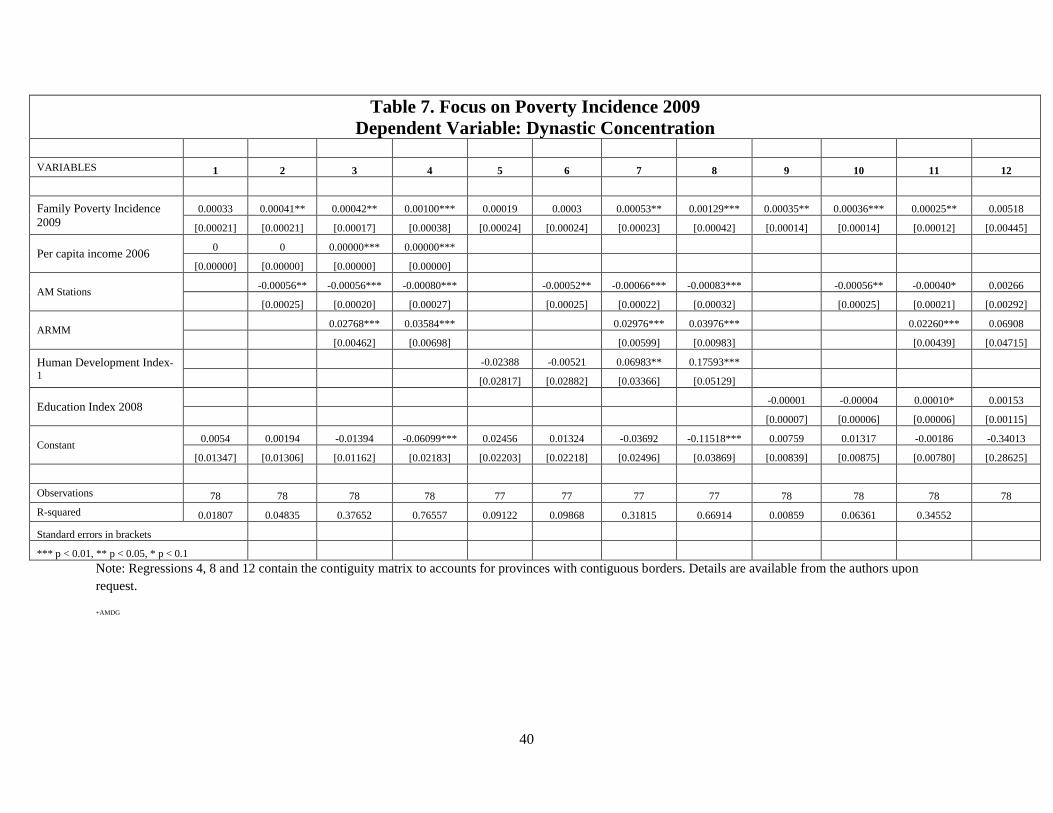
The results indicate that both poverty incidence and per capita income are not determinants of
DYNSHA (both p = n.s.) but they are determinants of DYNLAR and of DYNHERF (both p <
0.05). These findings suggest that increased income poverty does not cause political dynasties to
emerge; but, rather, it contributes to the expansion of the largest and strongest political dynasties.
Given that the poor are vulnerable to political patronage and manipulation, worsening, if not
unchanging, poverty can turn out to be beneficial to political dynasties. Since the largest political
dynasties are generally those that have cultivated the most extensive networks of patronage,
accumulated the most political and financial capital, and have the access to the better organized
political machineries, they are therefore in the best position to exploit the vulnerable sectors.
Underpinning this patron-client relationship is a complex set of interactions that benefit dynastic
politicians and their progeny. We thus surmise that political dynasties have mastered the art of
interacting with voters in a respectful and compassionate manner as well as the art of displaying
a facade of identification with the poor. In our own assessment, the next generation politicians
actually learn this art from the older generations of politicians through exposure and participation
24
(with some starting at a very young age). In addition, a history of violence and intimidation help
create an impression that patrons ensure peace and order in the locality, or prevent even more
injustice and poverty from taking place. It is, of course, usual to see for voters in conflict-prone
areas of the Philippines to favor “strongmen” and their progeny in order to prevent more
“competitive” but potentially more violent elections from taking place (c.f., Sidel, 1994; Beckett
1994; Bentley 1994).
Arguably, then, improvements in the economic conditions of Filipinos do not necessarily lead to
the dissolution of political dynasties or prevent the emergence of new political dynasties. Real
economic improvement can nevertheless help weaken political dynasties in the long run by
preventing them from further entrenching themselves in elective positions and subordinating
government institutions to political agendas of their families.
While poverty incidence and per capita income explain DYNLAR and DYNHERF, the size of
the coefficients is small to indicate significant impact. We thus argue that economic interventions
have to generate dramatic increases in income in order to obtain meaningful decreases in the
influence of the largest and strongest political dynasties. This view is consistent with the notion
that the development interventions in the short run must also focus on improving political
democracy—that is, strengthening democratic institutions and encouraging more active citizen
participation in democratic processes—rather than just targeting poverty (even as the latter is
important).
Moreover, we find the variable AM Radio Stations is a determinant of DYNSHA, DYNLAR,
DYNHERF (at least p < 0.10 for all), with a positive coefficient on DYNSHA but negative on
25
both DYNLAR and DYNHERF. We argue that AM Radio Stations cultivate an environment that
is conducive to the emergence of new political dynasties that represent alternatives to the larger
and stronger political dynasties but nonetheless maintaining the political environment controlled
by elites. Increases in the number of AM Radio Stations, therefore, promote political competition
but only amongst the political dynasties. Still, we also argue that this situation may be an artifact
of the poor development of political party system in the Philippines that political dynasties
regardless of their size are able to exploit (c.f., Manacsa and Tan 2005; Teehankee 2007).
Education is significant but only in regressions that include AM Radio Stations (p < 0.10). The
coefficients are positive involving DYNLAR and DYNHERF but negative involving DYNSHA.
A possible explanation for this pattern involves the influence of political dynasties in the local
public education system, which offers numerous opportunities to cultivate patronage through the
granting of scholarships and infrastructure expenditure support. Indeed, as noted by Solon et al.
(2009), the social spending in the Philippines has become a means for securing political support
and votes. The dominant political dynasty can thus channel resources into education projects and
programs that identify their members as politicians with only the interest of the locals in their
hearts. (It is not uncommon in the Philippines for politicians to place their names prominently in
physical infrastructure and public works projects.)
Likewise, Ravanilla (2012) finds evidence of such pattern—that is, legislators use their pork
barrel to benefit political allies and to those that can readily assign credit to the source of funds.
Given strong norms for reciprocity and personal indebtedness, the increased investments in the
local public education system help strengthen further the dominant political dynasties. Indeed,
this view runs counter to the position that an education program for the electorate can translate
26
into more informed choices and less political dynasties elected into office.
Finally, the coefficients of ARMM are positive and significant across all the regressions (p <
0.05). The findings are consistent with view that the distinct configuration of leadership and
social dynamics within the region allows for the emergence and success of large and strong
political dynasties (Beckett, 1994; Bentley, 1994).
5. Conclusion
Political dynasties co-exist with weak political competition, poor accountability, concentration of
political power, and perpetuation of patron-client relations and traditional politics. Under such
conditions, political dynasties contribute to persistent—or in some cases even worse—poverty
conditions in a country. On the other hand, it is also true that poor people, who constitute large
segments of the voting population, are likely to support political patrons who provide them
support that seem difficult to obtain from government. This pattern takes place under conditions
of poverty and extreme vulnerability, further exacerbated by the lack of a social safety net. The
self-perpetuation of political dynasties is thus understandable when patron-client relationships
characterize politics. This complex relationship suggests that political dynasties play a role in
exacerbating poverty, or poverty itself enables the self-perpetuation of political dynasties.
In this paper, we construct metrics of political dynasties in the Philippines and analyze them
using regression analysis. Our findings indicate strong evidence that severe poverty leads to the
prevalence of political dynasties. We argue that patron-client relationships are the recourse of the
poor and, in turn, reinforce the self-perpetuation of political dynasties. In fact, the evidence also
27
suggests that areas with more poor people tend to have many political dynasties as well.
Yet, we also find evidence that the presence of political dynasties per se may not necessarily be
causing poverty. That is, political dynasties neither reduce nor increase poverty. We argue that
this pattern is an indication that the non-dynasties are not offering a better alternative to political
dynasties. In other words, it is difficult to recognize whether the approach of political dynasties
to reform benefit the poor in the end. As such, given the choice between dynasties and non-
dynasties, the poor choose the former because, at least, they receive very tangible support that
government failed to provide. Indeed, anecdotal and other evidence indicate that the political
“rules of the game” continue to perpetuate patron-client relationships (or at least fail to correct
these with alternative models). The proliferation of new political dynasties thus takes place. It is
also likely that reform-minded non-dynastic politicians are unable to make a dent on poverty
considering that the political status quo remains unchanged. In this environment, it would not be
surprising if the poor become less and less attracted to non-dynasties.
The empirical findings in this paper therefore suggest that comprehensive poverty reduction and
social protection programs are crucial for building an inclusive democratic structure in the
Philippines. Addressing the structural dependence of the electorate is a step toward changing the
patron-client environment to one wherein voters are less dependent on patrons or political
dynasties. Indeed, studies have shown that the share of dynastic leaders decline over time as a
country reaches higher level of economic development (Dal Bo et al. 2009). Nevertheless, sub-
national efforts to push reforms may produce highly uneven results, and may not necessarily be
compatible with the incentives of political dynasties that seek to tighten their grip on local
politics. These reforms must leverage the media to the extent that they contribute to leveling the
28
political playing field while, at the same time, promoting stronger accountability and better
governance.
In addition to poverty reduction, political reforms are also very critical in helping families and
communities break out of the dynasty-poverty trap. Alternative political candidates need the
support of genuine political parties so they have a platform to convey their message of reform
and non-traditional politics, built on empowerment, participation and accountability against
patron-client relationships that thrive on poverty and inequality. Once elected, the same leaders
also need genuine political parties in order to accomplish their reform agenda, if they are to win
hearts and minds on lasting reform.
29
References
Acemoglu, D. and J. Robinson (2006). Economic origins of dictatorship and democracy,
Cambridge: Cambridge University Press.
Asako, Y., T. Iida, T. Matsubayashi, and M. Ueda (2010). “Dynastic legislators: Theory and
evidence from Japan,” Mimeo. [http://www.psci.unt.edu/~tmatsubayashi/ research/ seshu.pdf]
Balisacan, A. and N. Fuwa (2004) “Going beyond cross-country averages: Growth, inequality
and poverty reduction in the Philippines,” World Development 32(11):1891-907.
Beckett, J. (1994) “Political families and family politics among the Muslim Maguindanaon of
Cotabato” in A. McCoy (Ed.), An anarchy of families: State and family in the Philippines,
Manila: Ateneo de Manila University Press.
Bentley, G. (1994). “Mohamad Ali Dimaporo: A modern Maranao Datu,” in A. McCoy (Ed.), An
anarchy of families: State and family in the Philippines. Manila: Ateneo de Manila University
Press.
Capuno, J., S. Quimbo, A. Kraft, C. Tan, and V. Fabella (2012). “The effects of term limits and
yardstick competition on local government provision of health insurance and other public
services: The Philippine case,” Discussion Paper 2012-01, University of the Philippines School
of Economics [http://www.econ.upd.edu.ph/dp/index.php/dp/article/view/684].
30
Clarke, G. and M. Sison. (2003). “Voices from the top of the pile: Elite perceptions of poverty
and the poor in the Philippines,” Development and Change 34(2):215-242.
Coronel, S. (1998). “Monopoly” in S. Coronel (Ed.), Pork and other perks: Corruption and
governance in the Philippines, Manila: Philippine Center for Investigative Journalism.
Coronel, S. (2007). The seven Ms of dynasty building, Internet article [http://pcij.org/stories/the-
seven-ms-of-dynasty-building].
Cullinane, M. (1994). “Patron as client: Warlord politics and the Duranos in Danao,” in A.
McCoy (Ed.), An anarchy of families: State and family in the Philippines, Manila: Ateneo de
Manila University Press.
Curato, N. (2012). “What is wrong with political dynasties?,” Internet article, GMA News
Online. [http://www.gmanetwork.com/news/story/276345/opinion/what-is-wrong-with-political-
dynast-ies].
Dal Bo, E., P. Dal Bo, and J. Snyder (2009). “Political Dynasties,” Review of Economic Studies
76(1):115-142.
David, R. (2013). “Dynasties and democracy,” Opinion article, Philippine Daily Inquirer.
[http://opinion. inquirer.net/46389/dynasties-and-democracy].
Gerring, J., P. Bond, W. Barndt, and C. Moreno (2005). “Democracy and economic growth: A
31
historical perspective,” World Politics 57(3): 323-364.
Hutchcroft, P. (1998). Booty capitalism, the politics of banking in the Philippines, Quezon City
and Ithaca: Ateneo de Manila University Press and Cornell University Press.
Hutchcroft, P. and J. Rocamora (2003). “Strong demands and weak institutions: The origins and
evolution of the democratic deficit in the Philippines,” Journal of East Asian Studies 3(2003):
259-292.
Lacey, R. (1983). Aristocrats, London: Hutchinson and Co.
Manacsa, R. and A. Tan. (2005). “Manufacturing parties,” Party Politics 11(6):748-765.
McCoy, A. (1994a). “Rent-seeking families and the Philippine state: A history of the Lopez
family,” in A. McCoy (Ed.), An anarchy of families: State and family in the Philippines. Manila:
Ateneo de Manila University Press.
McCoy, A. (1994b). An anarchy of families: State and family in the Philippines, Manila: Ateneo
de Manila University Press.
Mendoza, R., E. Beja, V. Venida, and D. Yap. 2012. “Inequality in democracy: Insights from an
empirical analysis of political dynasties in the 15th Philippine Congress,” Philippine Political
Science Journal 33(2):132-145.
32
Mendoza, R. (2012). “Dynasties in democracies: The Political Side of Inequality.” Internet
article, VoxEU.org. [http://www.voxeu.org/article/dynasties-democracies-political-side-inequa-
lity].
Parreño, E. (1998). “Pork,” in S. Coronel (Ed.), Pork and other perks: Corruption and
governance in the Philippines, Pasig: Philippine Center for Investigative Journalism
Querubin, P. (2010). “Family and politics: Dynastic persistence in the Philippines.” Mimeo.
Massachusetts Institute of Technology. [http://economics.mit.edu/files/6365].
Querubin, P. (2011). “Political reform and elite persistence: Term limits and political dynasties
in the Philippines.” Mimeo. Massachusetts Institute of Technology. [http://www.econ.yale.edu/
conference/neudc11/papers/paper_242.pdf].
Ravanilla, N. (2012). “Passing pork to patrons: Legislator-Mayor linkage of distributive politics
in the Philippines.” Mimeo. University of Michigan.
Rodrik, D. (2007). One economics many recipes: Globalization, institutions and economic
growth, Princeton: Princeton University Press.
Rossi, M. (2009). “The causes of political dynasties in democratic countries.” Mimeo. [http://
economia.uniandes.edu.co/content/.../29957/.../Political_Dynasties_Rossi.pdf].
Schaffer, F. (2002). “Disciplinary reactions: Alienation and the reform of vote buying in the
33
Philippines.” Mimeo. [http://web.mit.edu/cis/pdf/Schaffer%20-%20Disciplinary%20Reactions.
pdf].
Sidel, J. (1994). “Walking in the shadow of the big man: Justiniano Montano and failed dynasty
building in Cavite, 1935-1972,” in A. McCoy (Ed.), An anarchy of families: State and family in
the Philippines, Manila: Ateneo de Manila University Press.
Sidel, J. (1997). “Philippine politics in town, district, and province: Bossism in Cavite and
Cebu,” Journal of Asian Studies 56(4): 947-966.
Solon, O, R. Fabella, and J. Capuno (2009). “Is local development good politics? Local
government expenditures and the re-election of governors in the Philippines in the 1990s,” Asian
Journal of Political Science 17(3): 265-284.
Teehankee, J. (2007). “And the clans play on,” Internet article, Philippine Center for Investigative
Journalism. [http://pcij.org/stories/and-the-clans-play-on/].
34
TABLES
Table 1. Variables in the Regressions to Explain Poverty
VARIABLE DESCRIPTION SOURCE OF DATA
Under Five Mortality Rate 2003 Compiled from National Demographic Health Survey (NDHS) 2003
Under Five Mortality Rate 2003 Computed from National Demographic Health Survey (NDHS) 2003
Literacy Rate 2003 Functional Literacy, Education, and Mass Media Survey (FLEMMS) 2003
Human Development Index Human Development NetworkEducation Index 2008 (Derived from Primary and Secondary Student to Teacher Ratios, Classroom to Student Ratios) National Statistics Coordination Board (NSCB)
Proportion of Irrigated Area 2002 Compiled from Census of Agriculture Data
AM Stations Complied by authors based on data from media networks
Farm Area GINI Ratio 2002 Computed Census of Agriculture Data
Change in Agricultural Terms of Trade Computed from National Statistics Coordination Board (NSCB) Data
Change in Amount of Land Covered by CARP-LAD Program from 2002 to 2004 Compiled from Dep. of Agrarian Reform Data
Change in Access to Electricity from 2002 to 2004 Computed from National Statistics Coordination Board (NSCB) Data
Change in Road Density to 2007 to 2008 Computed from Department of Public Works and Highways (DPWH) Data
Per Capita Expenditure 2003 Computed from National Statistics Coordination Board (NSCB) Data
Natural Logarithm of Per Capita Expenditure 2003 Computed from National Statistics Coordination Board (NSCB) Data
Per capita income 2006 National Statistics Coordination Board (NSCB)
Family Poverty Incidence 2009 National Statistics Coordination Board (NSCB)
Change in Poverty from 2003 to 2006 Computed from National Statistics Coordination Board (NSCB) Data
ARMM Indicator Compiled by authors
Dynastic Share of Elective Posts 2004 Computed from Commission on Elections (COMELEC) Data
Share of Largest Dynastic Clan 2004 Computed from Commission on Elections (COMELEC) Data
Hirschman-Herfindahl Index for Dynastic Clans 2004 Computed from Commission on Elections (COMELEC) Data
35
Table 2. Focus on Dynastic ShareDependent Variable: Change in Poverty Incidence from 2003 to 2006
VARIABLES 1 2 3 4 5 6 7 8 9 10
Dynastic Share 2004 0.47351 0.39194 0.26883 0.06162 -0.25305 -0.38059 -0.37884 -0.40236 -0.35122 -0.43290
[0.85520] [0.82968] [0.83215] [0.87391] [0.92386] [0.93565] [0.93776] [0.94060] [0.93726] [0.96541]Natural Log of 2003 Per Capita Income
0.68870** 0.72863** 0.75961*** 0.76809** 0.80679*** 0.68537** 0.84530** 1.08881** 1.02778**
[0.28251] [0.28317] [0.28652] [0.29558] [0.30184] [0.33482] [0.38743] [0.43236] [0.46101]Change in AgriculturalTerms of Trade 2002 to 2004
1.88082 1.81390 2.10606 2.34214 2.81929* 3.04939* 1.86843 1.88649
[1.48728] [1.49331] [1.52413] [1.54330] [1.64633] [1.67385] [1.91695] [1.93100]Farm Area GINI Coefficient
-1.07434 -0.84935 -0.93525 -0.71789 -0.53170 -0.45691 -0.51885
[1.35043] [1.48593] [1.50152] [1.52667] [1.54706] [1.54127] [1.55974]Change in CARP Land Distribution 2002 to 2004
7.81649** 9.56154*** 9.91928*** 9.52095*** 10.17369*** 10.18409***
[3.15862] [3.40903] [3.44278] [3.48507] [3.50870] [3.53355]Change in Access to Electricity 2002 to 2004
-1.04005 -1.11343 -1.42770 -1.75315 -1.65243
[1.24214] [1.24797] [1.30764] [1.32769] [1.36023]Proportion of Irrigated Land 2002
0.38148 0.48722 0.52267 0.52659
[0.45074] [0.46965] [0.46840] [0.47180]Under Five MortalityPer 1000 Children 2003
7.85809 -0.16707 0.34935
[9.50515] [11.44592] [11.59773]Functional Literacy 2003
-3.08880 -2.79456
[2.47866] [2.60081]Change in Road Density2007 to 2008
0.16041
[0.39818]Constant
0.03279 -5.23993** -5.54735** -5.13904** -5.54945** -5.85913** -5.23762** -6.96752** -5.90030* -5.64265
[0.21075] [2.17255] [2.17765] [2.24252] [2.29244] [2.35928] [2.47602] [3.24663] [3.34356] [3.42735]
Observations 79 79 79 79 72 70 70 70 70 70
R-squared 0.00397 0.07620 0.09549 0.10316 0.17550 0.20046 0.20960 0.21835 0.23807 0.24016
Standard errors in brackets
*** p < 0.01, ** p < 0.05, * p < 0.1
36
Table 3. Focus on Largest DynastyDependent Variable: Change in Poverty Incidence from 2003 to 2006
VARIABLES 1 2 3 4 5 6 7 8 9 10Largest Dynastic Share
-3.86399 -2.64403 -2.41456 -2.77440 -2.34180 -2.04221 -1.92682 -1.84647 -1.94401 -2.02685
[2.99510] [2.96713] [2.96111] [2.98548] [3.12868] [3.18393] [3.19528] [3.20632] [3.19056] [3.22217]Natural Log of 2003 Per Capita Income
0.64783** 0.68973** 0.71496** 0.72634** 0.76337** 0.64777* 0.80267** 1.05157** 0.99587**
[0.28598] [0.28679] [0.28808] [0.29869] [0.30660] [0.33809] [0.39088] [0.43473] [0.46441]Change in AgriculturalTerms of Trade 2002 to 2004
1.86331 1.72384 1.99030 2.20217 2.66865 2.88842* 1.68559 1.67890
[1.47436] [1.48196] [1.51070] [1.53080] [1.63651] [1.66437] [1.90366] [1.91771]Farm Area GINI Coefficient
-1.25198 -0.97931 -1.00619 -0.78503 -0.59065 -0.54028 -0.58015
[1.29167] [1.47780] [1.49884] [1.52666] [1.55050] [1.54294] [1.55818]Change in CARP Land Distribution 2002 to 2004
7.65487** 9.29043*** 9.64510*** 9.25852*** 9.94049*** 9.92044***
[3.13700] [3.38936] [3.42548] [3.46972] [3.49253] [3.51858]Change in Access to Electricity 2002 to 2004
-0.88740 -0.96493 -1.26924 -1.60364 -1.50272
[1.24692] [1.25372] [1.31417] [1.33317] [1.37184]Proportion of Irrigated Land 2002
0.36994 0.47223 0.50799 0.51070
[0.45045] [0.46968] [0.46807] [0.47156]Under Five MortalityPer 1000 Children 2003
7.56310 -0.65424 -0.25725
[9.49397] [11.41882] [11.55518]Functional Literacy 2003
-3.16544 -2.91771
[2.47225] [2.58354]Change in Road Density2007 to 2008
0.14040
[0.38966]Constant
0.35370* -4.69103** -5.05376** -4.52805* -5.07477** -5.44194** -4.86817* -6.55889* -5.42874 -5.19227
[0.18627] [2.23435] [2.24405] [2.30955] [2.38366] [2.47765] [2.58045] [3.34703] [3.44463] [3.53141]
Observations 79 79 79 79 72 70 70 70 70 70
R-squared 0.02116 0.08307 0.10219 0.11344 0.18151 0.20357 0.21214 0.22025 0.24099 0.24265
Standard errors in brackets
*** p < 0.01, ** p < 0.05, * p < 0.1
37
Table 4. Focus on Dynastic ConcentrationDependent Variable: Change in Poverty Incidence from 2003 to 2006
VARIABLES 1 2 3 4 5 6 7 8 9 10Dynastic Herfindahl Index
-9.75255 -6.90226 -6.78473 -6.68864 -5.69336 -4.59936 -4.47789 -4.20368 -5.42048 -5.66820
[6.70408] [6.66205] [6.63199] [6.64573] [6.78240] [6.93246] [6.95067] [6.98113] [6.99108] [7.06999]Natural Log of 2003 Per Capita Income
0.63716** 0.67710** 0.70531** 0.71610** 0.75666** 0.63823* 0.79201** 1.04654** 0.98636**
[0.28605] [0.28637] [0.28886] [0.29959] [0.30820] [0.33992] [0.39335] [0.43332] [0.46317]Change in AgriculturalTerms of Trade 2002 to 2004
1.91665 1.80604 2.04469 2.24639 2.71724 2.93216* 1.64447 1.63540
[1.46803] [1.47668] [1.50651] [1.52775] [1.63188] [1.65976] [1.90183] [1.91558]Farm Area GINI Coefficient
-1.08063 -0.81539 -0.85541 -0.64071 -0.45430 -0.40434 -0.44100
[1.28055] [1.45010] [1.46930] [1.49510] [1.51849] [1.50856] [1.52228]Change in CARP Land Distribution 2002 to 2004
7.57576** 9.16956*** 9.52916*** 9.15815** 9.82965*** 9.80303***
[3.13766] [3.40328] [3.43853] [3.48156] [3.49295] [3.51861]Change in Access to Electricity 2002 to 2004
-0.90907 -0.98387 -1.28454 -1.62052 -1.51270
[1.24198] [1.24819] [1.30947] [1.32386] [1.36198]Proportion of Irrigated Land 2002
0.37582 0.47644 0.51260 0.51573
[0.44993] [0.46922] [0.46677] [0.47018]Under Five MortalityPer 1000 Children 2003
7.44858 -1.39051 -0.99686
[9.49881] [11.46262] [11.58914]Functional Literacy 2003
-3.37673 -3.11977
[2.48738] [2.59124]Change in Road Density2007 to 2008
0.15110
[0.38945]Constant
0.40842** -4.56530** -4.90430** -4.51991* -5.05723** -5.45651** -4.85712* -6.53242* -5.20499 -4.94033
[0.20314] [2.24168] [2.24641] [2.29637] [2.36399] [2.46156] [2.56971] [3.34799] [3.46589] [3.55671]
Observations 79 79 79 79 72 70 70 70 70 70
R-squared 0.02675 0.08639 0.10669 0.11521 0.18329 0.20393 0.21279 0.22064 0.24387 0.24579
Standard errors in brackets
*** p < 0.01, ** p < 0.05, * p < 0.1
38
Table 5. Focus on Poverty Incidence 2009Dependent Variable: Dynastic Share
VARIABLES 1 2 3 4 5 6 7 8 9 10 11 12
Family Poverty Incidence 2009
0.00129 0.00031 0.00088 0.01187*** 0.00091 -0.00067 0.00143 0.01623*** 0.00154 0.00129 0.00052 0.0382
[0.00304] [0.00290] [0.00277] [0.00374] [0.00358] [0.00351] [0.00368] [0.00394] [0.00195] [0.00190] [0.00190] [0.02886]
Per capita income 2006 0 0 0 0.00001
[0.00001] [0.00001] [0.00001] [0.00001]
AM Stations 0.00681* 0.00682** 0.01706*** 0.00749** 0.00640* 0.01695*** 0.00512 0.00623* 0.03648*
[0.00353] [0.00339] [0.00263] [0.00366] [0.00356] [0.00296] [0.00356] [0.00350] [0.01897]
ARMM 0.18371** 0.30227*** 0.20506** 0.39629*** 0.15506** 0.57977*
[0.07730] [0.06839] [0.09571] [0.09184] [0.07157] [0.30602]
Human Development Index-1 -0.10923 -0.37265 0.19909 0.90359*
[0.41759] [0.41812] [0.53751] [0.47936]
Education Index 2008 -0.00191** -0.00165* -0.00069 0.00869
[0.00090] [0.00091] [0.00098] [0.00744]
Constant 0.41715** 0.46157** 0.32925* -0.21036 0.45465 0.61253* 0.22194 -0.71412** 0.59125*** 0.54427*** 0.44170*** -2.04028
[0.19193] [0.18412] [0.19466] [0.21381] [0.32654] [0.32178] [0.39852] [0.36163] [0.11605] [0.12276] [0.12718] [1.85785]
Observations 78 78 78 78 77 77 77 77 78 78 78 78
R-squared 0.01199 0.06282 0.1339 0.88861 0.01309 0.06188 0.14069 0.85711 0.0613 0.0872 0.13802 0.35428
Standard errors in brackets
*** p < 0.01, ** p < 0.05, * p < 0.1
Note: Regressions 4, 8 and 12 contain the contiguity matrix to accounts for provinces with contiguous borders. Details are available from the authors upon request.
39
Table 6. Focus on Poverty Incidence 2009Dependent Variable: Largest Dynastic
VARIABLES 1 2 3 4 5 6 7 8 9 10 11 12
Family Poverty Incidence 2009
0.00130* 0.00162** 0.00156*** 0.00218* 0.00106 0.00156* 0.00205** 0.00285** 0.00112** 0.00118*** 0.00094** 0.01771
[0.00069] [0.00066] [0.00058] [0.00118] [0.00081] [0.00080] [0.00081] [0.00133] [0.00046] [0.00043] [0.00041] [0.01649]
Per capita income 20060 0 0.00000*** 0.00001***
[0.00000] [0.00000] [0.00000] [0.00000]
AM Stations-0.00230*** -0.00231*** -0.00470*** -0.00234*** -0.00271*** -0.00491*** -0.00207** -0.00171** 0.008
[0.00080] [0.00071] [0.00083] [0.00084] [0.00079] [0.00100] [0.00081] [0.00075] [0.01084]
ARMM0.06907*** 0.09593*** 0.07917*** 0.10408*** 0.04999*** 0.19592
[0.01614] [0.02157] [0.02113] [0.03092] [0.01543] [0.17481]
Human Development Index-1
0.00159 0.08523 0.27209** 0.68699***
[0.09451] [0.09581] [0.11869] [0.16137]
Education Index 20080.00015 0.00005 0.00036* 0.00536
[0.00021] [0.00021] [0.00021] [0.00425]
Constant0.00664 -0.00781 -0.04138 -0.17597*** 0.03558 -0.01491 -0.13788 -0.36020*** 0.01666 0.03672 0.00331 -1.15217
[0.04384] [0.04192] [0.04064] [0.06743] [0.07390] [0.07373] [0.08800] [0.12174] [0.02713] [0.02807] [0.02742] [1.06125]
Observations 78 78 78 78 77 77 77 77 78 78 78 78
R-squared 0.00627 0.06342 0.27247 0.78648 0.02507 0.05002 0.192 0.68772 0.01108 0.08018 0.22768
Standard errors in brackets
*** p < 0.01, ** p < 0.05, * p < 0.1
Note: Regressions 4, 8 and 12 contain the contiguity matrix to accounts for provinces with contiguous borders. Details are available from the authors upon request.
40
Table 7. Focus on Poverty Incidence 2009Dependent Variable: Dynastic Concentration
VARIABLES 1 2 3 4 5 6 7 8 9 10 11 12
Family Poverty Incidence 2009
0.00033 0.00041** 0.00042** 0.00100*** 0.00019 0.0003 0.00053** 0.00129*** 0.00035** 0.00036*** 0.00025** 0.00518
[0.00021] [0.00021] [0.00017] [0.00038] [0.00024] [0.00024] [0.00023] [0.00042] [0.00014] [0.00014] [0.00012] [0.00445]
Per capita income 20060 0 0.00000*** 0.00000***
[0.00000] [0.00000] [0.00000] [0.00000]
AM Stations-0.00056** -0.00056*** -0.00080*** -0.00052** -0.00066*** -0.00083*** -0.00056** -0.00040* 0.00266
[0.00025] [0.00020] [0.00027] [0.00025] [0.00022] [0.00032] [0.00025] [0.00021] [0.00292]
ARMM0.02768*** 0.03584*** 0.02976*** 0.03976*** 0.02260*** 0.06908
[0.00462] [0.00698] [0.00599] [0.00983] [0.00439] [0.04715]
Human Development Index-1
-0.02388 -0.00521 0.06983** 0.17593***
[0.02817] [0.02882] [0.03366] [0.05129]
Education Index 2008-0.00001 -0.00004 0.00010* 0.00153
[0.00007] [0.00006] [0.00006] [0.00115]
Constant0.0054 0.00194 -0.01394 -0.06099*** 0.02456 0.01324 -0.03692 -0.11518*** 0.00759 0.01317 -0.00186 -0.34013
[0.01347] [0.01306] [0.01162] [0.02183] [0.02203] [0.02218] [0.02496] [0.03869] [0.00839] [0.00875] [0.00780] [0.28625]
Observations 78 78 78 78 77 77 77 77 78 78 78 78
R-squared 0.01807 0.04835 0.37652 0.76557 0.09122 0.09868 0.31815 0.66914 0.00859 0.06361 0.34552
Standard errors in brackets
*** p < 0.01, ** p < 0.05, * p < 0.1
Note: Regressions 4, 8 and 12 contain the contiguity matrix to accounts for provinces with contiguous borders. Details are available from the authors upon request.
+AMDG