Political Contributions To Influence Consumers: The ... · Anne Boring Université Paris-Dauphine,...
27
UMR DIAL 225 Place du Maréchal de Lattre de Tassigny 75775 • Paris Cedex 16 •Tél. (33) 01 44 05 45 42 • Fax (33) 01 44 05 45 45 • 4, rue d’Enghien • 75010 Paris • Tél. (33) 01 53 24 14 50 • Fax (33) 01 53 24 14 51 E-mail : [email protected] • Site : www.dial.prd.fr DOCUMENT DE TRAVAIL DT/2010-03 Political Contributions To Influence Consumers: The Example Of The U.S. Drug Reimportation Debate Anne BORING
Transcript of Political Contributions To Influence Consumers: The ... · Anne Boring Université Paris-Dauphine,...

UMR DIAL 225 Place du Maréchal de Lattre de Tassigny 75775 • Paris Cedex 16 •Tél. (33) 01 44 05 45 42 • Fax (33) 01 44 05 45 45
• 4, rue d’Enghien • 75010 Paris • Tél. (33) 01 53 24 14 50 • Fax (33) 01 53 24 14 51 E-mail : [email protected] • Site : www.dial.prd.fr
DOCUMENT DE TRAVAIL DT/2010-03
Political Contributions To InfluenceConsumers: The Example Of The U.S. Drug Reimportation Debate
Anne BORING
POLITICAL CONTRIBUTIONS TO INFLUENCE CONSUMERS: THE EXAMPLE OF THE U.S. DRUG REIMPORTATION DEBATE
Anne Boring
Université Paris-Dauphine, LEDa, F-75016 Paris, France IRD, UMR225-DIAL, F-75010 Paris, France
Document de travail DIAL Janvier 2010
Abstract
To reduce pharmaceutical prices, some legislators have been trying to pass bills authorizing the reimportation of prescription drugs to the United States. Pharmaceutical companies oppose reimportation, by elaborating a message (foreign drugs are of lower quality than domestic drugs) to influence legislators and their constituents. The industry gives contributions to legislators to spread its anti-reimportation message. The amount it gives depends on legislators’ and constituents’ characteristics. The legislators who receive the most are those whose constituents are most likely to oppose reimports. Key words: political contributions, lobbying, drug reimportation, pharmaceutical industry, protectionism Résumé
Afin de réduire les prix des produits pharmaceutiques, des législateurs tentent depuis plusieurs années de faire passer des lois qui autoriseraient la ré-importation de médicaments aux Etats-Unis. Les entreprises pharmaceutiques s’opposent aux ré-importations en élaborant un argument pour influencer les législateurs et leurs électeurs. Ici, l’argument est que les médicaments vendus à l’étranger sont de moins bonne qualité que ceux vendus aux Etats-Unis. L’industrie pharmaceutique finance les législateurs américains pour diffuser ce message contre les ré-importations. Le montant qu’elle donne dépend des caractéristiques des législateurs et de leurs électeurs. Les législateurs qui reçoivent le plus de financement sont ceux dont les électeurs ont le plus de chances d’être opposés aux ré-importations. Mots clés : financement politique, lobbying, ré-importations, médicaments, industrie pharmaceutique, protectionnisme JEL Classification: D72, F14, L65
2
1. INTRODUCTION
Over the past years, some legislators have been trying to pass bills that would
authorize wholesalers and pharmacists to reimport drugs to the United States. Since the
Prescription Drug Marketing Act of 1987, only manufacturers are allowed to import drugs to
the United States, which enables pharmaceutical companies to set higher prices on the
American market. For instance, Paris and Docteur (2007) estimate that the prices of patented
drugs in the United States are between 35% and 45% higher than in Canada, on average. If
reimports were allowed, pharmacists and wholesalers could purchase a drug from a foreign
country which sets price controls on pharmaceuticals, and sell it on the American market
without the authorization of the company that owns the intellectual property right on the drug
in the United States. This measure could bring pharmaceutical prices down.
The pharmaceutical industry is a strong opponent of reimports. The main interest
group representing the American pharmaceutical industry, Pharmaceutical Research and
Manufacturers of America (PhRMA), argues that drug reimports are dangerous1, because fake
and bad quality drugs could enter the United States. To justify trade restrictions, PhRMA uses
the precautionary principle: as long as the drugs that would be imported are not proven to be
safe, pharmacists and wholesalers should not be allowed to import them. This argument may
be justified, but it also enables the pharmaceutical industry to create differences in the way
Americans perceive the quality of the domestic drug and the drug that would be imported
from a foreign country. If the industry can earn higher profits when reimports are prohibited,
it will invest in a campaign against reimports. This campaign includes contributions to
legislators to multiply the number of people who campaign against reimports, and persuade
consumers that foreign drugs are potential threat to their health.
1http://www.phrma.org/taxonomy/term/92.

3
The model described in the following sections offers a perspective on the role played
by contributions and the way an industry decides to allocate contributions to legislators. An
interest group representing an industry can provide legislators with arguments and funds to
influence voters. In the case of the drug reimportation debate, the content of the message the
lobby conveys is the most important factor for obtaining favorable policies. Contributions are
funds distributed by the industry to legislators who spread the message that foreign drugs are
unsafe. The industry gives the largest amount of contributions to legislators whose
constituents are most likely to be sensitive to the drug safety argument.
The paper is organized as follows. After a short review of literature in section 2, a
vertical differentiation model is developed in section 3 to show that the pharmaceutical
industry will manage to maintain a ban on reimports only if it can convince voters that foreign
drugs are of poorer quality on average. Section 4 discusses the data that can be used to test the
theoretical model. It also gives the results of an OLS estimation of contributions to House
members during the 2003-2004 election cycle, which confirms the conclusions of the
theoretical model. Section 5 discusses the validity of the safety message. Section 6 concludes.
2. REVIEW OF LITERATURE
It is often believed that an industry can buy policies which are in its interest thanks to
political contributions. A large part of the economic literature develops the idea that
contributions are designed to influence policies or electoral outcomes (e.g. Che and Gale,
1998; Baldwin and Magee, 2000). In these articles, campaign contributions are seen as
investments in a political marketplace, with lobbies expecting a return on their investment
thanks to favorable votes from politicians (Ansolabehere et al., 2003). A common explanation
as to why free-trade, the consumer welfare maximizing solution, does not exist in practice is
that legislators cater to lobbies’ interests (Gawande and Krishna, 2003). Hillman (1982, 1989)
4
and Grossman and Helpman (1994) study the trade-off legislators make between the interests
of lobbies and the welfare of voters. In particular, Grossman and Helpman’s (1994)
Protection for sale model, considers that the legislator’s objective function is a weighted sum
of aggregate social welfare and contributions from industrial lobbies.
Some economists have offered alternatives to the classical view that contributions are
investments in a political market. Ansolabehere et al. (2003) for instance believe that
individual and interest group contributions are a type of consumption good. Levitt (1994) also
shows that the image and message a legislator gives out to constituents are essential for his or
her reelection, more so than contributions. John Wright (2004) shows that the tobacco
industry obtained legislative successes because of representatives’ characteristics more than
PAC money. Some authors have also demonstrated that contributions are a means of
obtaining access to legislators, and interest groups provide information to legislators (e.g.
Austen-Smith, 1995; Ainsworth and Sened, 1993). Hall and Deardorff (2006) suggest that
lobbying provides a service to legislators by giving them policy information, political
intelligence and legislative labor.
The ongoing debate concerning the legalization of drug reimports to the United States
can help develop the research which argues that contributions do not buy votes directly.
3. THE MODEL
The model takes into account four different decision-makers: a unique pharmaceutical
company, a foreign government, consumers of the domestic market and a legislator in the
domestic market.
The pharmaceutical company has a monopoly on the sale of a drug, which it
distributes at a regulated price on the foreign market and at an unregulated monopoly price
in the United States, with . A ban on reimports means that the company can
5
discriminate between consumers of the two markets, setting on the foreign market and a
higher price on the domestic market, to maximize its profit. If the legislator authorizes
reimports, then pharmacists and wholesalers will reimport the drug to sell it at on both
markets (with transport costs equal to zero). The pharmaceutical company would then have to
apply the foreign regulated price on the domestic market.
The foreign government regulates the price of the drug sold on its market to
maximize its consumers’ welfare. It therefore negotiates a price ceiling for the drug, which
is high enough for the company to sell the drug on the foreign market. The price which would
maximize the company’s profit is . So that it makes sense for the foreign government to set
a price ceiling, the model assumes that , such that the company sells the drug on the
foreign market at the price .
The legislator, who votes on only one issue, decides on whether to authorize or
maintain a ban on the reimport of prescription drugs. The legislator does not regulate prices
directly, but sets trade policies for the pharmaceutical industry, which generate a price for the
drug that is sold on the domestic market. The legislator has in mind the maximization of
consumers’ welfare and has an objective function such as in Grossman and Helpman (2002,
chap.4):
² . (1)
The company’s campaign expenses against reimports are , which is the sum of
contributions it gives to the legislator to take a public stand against reimports, and its other
expenses (i.e. TV advertisements, web pages explaining that foreign drugs are unsafe, the
financing of studies that oppose reimports, etc.). Contributions are viewed here as a way for
legislators to finance advertising campaigns to explain their ideologies, as in Coate (2004).
But the company does not depend solely on the legislator to diffuse the anti-reimport
6
arguments. In order to be reelected, the legislator’s goal is to vote for a trade policy which
will yield ; , the price favored by the median voter.
Consumers from the domestic market are defined by their tastes and their
perception of the drug’s quality, as in the vertical differentiation model described by
Bresnahan (1987) and Tirole (1988, chap.7)2. A consumer buys one or zero unit of the drug.
Each consumer is characterized by his or her utility of the drug per unit of quality, , which is
uniformly distributed with density one on the interval 0, . Consumers elect their legislator.
The median voter, who is also the average voter, is .
The drug sold on the domestic market is defined by its perceived quality . As is the
case in the United States, consumers trust the domestic drug, whose quality the Food and
Drug Administration is supposed to guarantee, but they may be unsure about the quality of the
foreign drug, which could be a counterfeit. If consumers think that the quality of the drug sold
on the foreign market is the same as the one sold on the domestic market, those who do not
benefit from full health coverage will want to pay the lowest price for the drug. The other
consumers may be indifferent to prices. In this case, the legislator takes no risk of losing votes
in the next election, and authorizes reimports so that consumers can benefit from the lower
price.
The company’s goal is to find a credible argument that the legislator can give voters to
justify a ban on reimports. Without such an argument, the legislator will not vote against
reimports. The company therefore launches a campaign to send out the message that the
quality of the foreign drug, , is on average lower than the quality of the domestic drug. This
campaign can work, because consumers have no way to check on their own whether the
imported drug is really the same as the domestic good. Even the use of tamper-proof
packaging methods cannot guarantee that a drug is not a counterfeit. Therefore, when 2 For related models applied to the pharmaceutical industry, see Donald Wright (2004) on pharmaceutical regulation in Australia, and Anis and Wen (1998) on the regulation of pharmaceutical prices in Canada.

7
reimports are allowed, consumers cannot tell the difference between a domestic and a foreign
drug. Consumers’ perception of the foreign drug’s quality is a function of campaign efforts
against reimports, such that
1 . . (2)
In (2), represents the consumers’ sensitivity to a campaign against reimports, with
0 1. The higher is, the more sensitive consumers are to the campaign, and the less
the company needs to spend on its campaign (increase t) to reduce the perceived quality of the
foreign drug. Equation (2) means that efficient campaign efforts against reimports can
decrease consumers’ perception of the foreign drug’s quality. and can be interpreted
as the perceived quality of the average drug sold on the market when reimports are
respectively banned and authorized.
A consumer from the domestic market has a utility function, such as in Mussa and
Rosen (1978), with
. (3)
In (3), x is the consumer’s consumption of other goods and ; depending on whether
reimports are banned or authorized.
The demand on the domestic market when reimports are banned is
. (4)
The company’s profit function is then
. . (5)
where F is fixed cost and c constant marginal cost of producing the drug.
The domestic price which maximizes the company’s profit is
. . (6)
8
The consumer surplus is equal to the difference between the utility derived from the
consumption of one unit of the drug and the price paid for the consumption of the drug:
. . (7)
. . (8)
The more the company scares consumers ( decreases), the more consumers are
willing to pay a higher price for the domestic drug they perceive as being of higher quality.
When the company manages to create a difference in the perceived quality of the two drugs,
i.e. , the legislator may decide to ban reimports. Indeed, if , then
or . With the safety issue, the company found a credible argument to justify a ban on
reimports.
The consumer who is indifferent between the two options is such that
. (9)
A consumer whose utility for the drug is higher than wants for the legislator to
maintain the ban on reimports, while a consumer whose utility for the drug is below
prefers for the legislator to vote for reimports. The lobby will therefore invest in its campaign
to make sure that enough consumers oppose reimports, i.e. such that increases to
the point where . That point is:
(10)
where is a small positive number.
Replacing and by their values from (2) and (6) in (10) yields
.
. (11)
where is the company’s optimal amount of campaign spending against reimports when it
maximizes its profits. Equation (11) shows that the more sensitive to the anti-reimportation

9
campaign consumers are, the less the company needs to invest in its campaign for it to be
efficient.
Proposition 1: The amount of money that the company is willing to spend on a campaign
against reimports depends on the median voter’s type, which depends on the constituency’s
characteristics. It probably also depends on the legislator’s own characteristics, because the
company will want to give more money to “powerful” legislators, i.e. those whose opinions
are more likely to influence consumers.
However, the company will only invest in to make reimports illegal, if it can
maximize its profit by doing so. The demand on the foreign market takes the general form:
. . (12)
As was shown in the previous section, if 0 then the legislator authorizes reimports,
such that . Therefore, the demand on the domestic market when 0 and
reimports are allowed is
0 . (13)
The company’s profit function when it doesn’t invest in advertizing efforts against reimports
is such that
0 . 0 . (14)
The company’s profit function when reimports are banned is
. . . (15)
The condition 0 yields the following requirement for the company to
spend money on an anti-reimportation campaign
(16)
10
when 0. Only when this condition is met, can the
company earn higher profits with a ban on reimports. However, this condition is not always
met, so it can be in the company’s interest to refrain from investing in a campaign against
reimports. Equation (16) shows that if consumers are not very sensitive to a campaign against
reimports, i.e. is very low, then the amount the company would have to spend on its
campaign might be too high to make it worth it. Therefore, according to condition (16), the
company should give contributions to the legislators who are the most inclined to voting
against reimports, because their constituents are sensitive to the anti-reimports campaign.
Spending the amount necessary to influence voters who are not very sensitive to the campaign
could result in a drop in the company’s profit. This could explain why there is so little money
in politics (Tullock, 1972).
Proposition 2: Because it would be too expensive to spend the necessary amount to influence
those who are the least sensitive to its arguments, an industry will give funds to the legislators
who are the most likely to vote for its interests.
The following empirical analysis will test this proposition after confirming that voters’
and legislators’ characteristics influence contributions.
4. EMPIRICAL ANALYSIS
Proposition 1 suggests that the amount the company spends on campaign contributions
depends on legislators’ characteristics and constituencies. The following OLS regressions test
this proposition.
The issue of drug reimports has been discussed several times in Congress over the past
few years, but the Pharmaceutical Market Access Act of 2003 was the only time a bill was
debated in itself. The Pharmaceutical Market Access Act (H.R. 2427) would have allowed
pharmacists and wholesalers to purchase pharmaceuticals from 26 developed countries,
11
including Canada. The bill passed in the House (243 voted for, 186 against and 6 did not
vote), but eventually died in the Senate Committee on Health, Education, Labor, and
Pensions. Gokcekus et al. (2006) study how the Pharmaceutical Market Access Act managed
to pass the House in 2003 despite the pharmaceutical industry’s heavy lobbying efforts. They
found that a vote in favor of the bill depended on several factors regarding representatives’
characteristics (gender, party affiliation, as well as ideology regarding free-trade and
subsidies) and constituencies (senior population, number of pharmaceutical employees and
proximity to Canada or Mexico). The following regressions will test whether these variables
and a few others are determinants of the pharmaceutical industry’s contributions to
legislators, as the theoretical model suggests. The approach differs from Gokcekus et al.
(2006), whose goal was to study the determinants of votes, and who found that contributions
had a positive impact on votes. Here, the goal is to study the determinants of pharmaceutical
contributions.
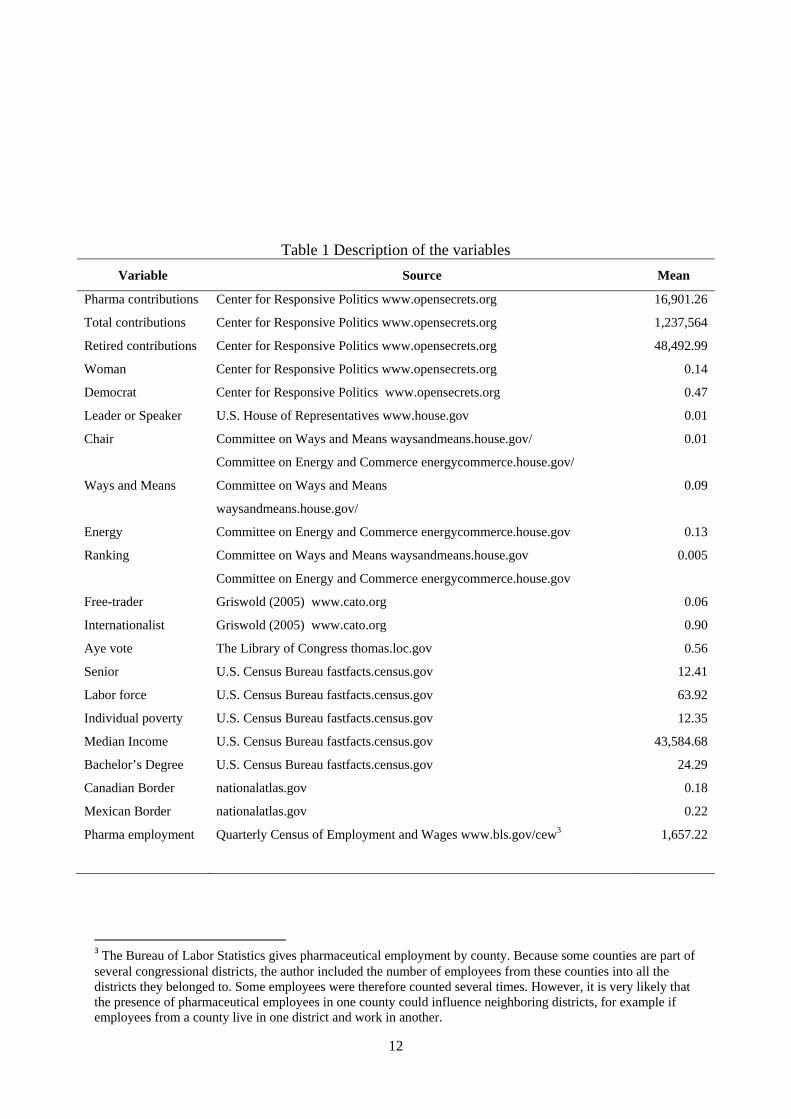
Table 1 presents the sources and mean values of the variables included in the
regressions to test the determinants of pharmaceutical contributions to House members from
409 congressional districts. 26 districts were eliminated because the data on contributions was
not available: the incumbent had either retired at the end of the legislature, had run for
governor during the election cycle or had been defeated in primary elections. The dependant
variable is the total sum of contributions the pharmaceutical and health industry gave to
House members during the 2003-2004 election cycle, when the Pharmaceutical Market
Access Act was debated.
12
Table 1 Description of the variables Variable Source Mean
Pharma contributions Center for Responsive Politics www.opensecrets.org 16,901.26
Total contributions Center for Responsive Politics www.opensecrets.org 1,237,564
Retired contributions Center for Responsive Politics www.opensecrets.org 48,492.99
Woman Center for Responsive Politics www.opensecrets.org 0.14
Democrat Center for Responsive Politics www.opensecrets.org 0.47
Leader or Speaker U.S. House of Representatives www.house.gov 0.01
Chair Committee on Ways and Means waysandmeans.house.gov/
Committee on Energy and Commerce energycommerce.house.gov/
0.01
Ways and Means Committee on Ways and Means
waysandmeans.house.gov/
0.09
Energy Committee on Energy and Commerce energycommerce.house.gov 0.13
Ranking Committee on Ways and Means waysandmeans.house.gov
Committee on Energy and Commerce energycommerce.house.gov
0.005
Free-trader Griswold (2005) www.cato.org 0.06
Internationalist Griswold (2005) www.cato.org 0.90
Aye vote The Library of Congress thomas.loc.gov 0.56
Senior U.S. Census Bureau fastfacts.census.gov 12.41
Labor force U.S. Census Bureau fastfacts.census.gov 63.92
Individual poverty U.S. Census Bureau fastfacts.census.gov 12.35
Median Income U.S. Census Bureau fastfacts.census.gov 43,584.68
Bachelor’s Degree U.S. Census Bureau fastfacts.census.gov 24.29
Canadian Border nationalatlas.gov 0.18
Mexican Border nationalatlas.gov 0.22
Pharma employment Quarterly Census of Employment and Wages www.bls.gov/cew3 1,657.22
3 The Bureau of Labor Statistics gives pharmaceutical employment by county. Because some counties are part of several congressional districts, the author included the number of employees from these counties into all the districts they belonged to. Some employees were therefore counted several times. However, it is very likely that the presence of pharmaceutical employees in one county could influence neighboring districts, for example if employees from a county live in one district and work in another.

13
The independent variable “Total contributions” is the sum of contributions the
representative received during the cycle. It captures the degree of electoral competition as
well as district specificities regarding money spent in electoral campaigns. On average,
pharmaceutical contributions represented 1.33% of legislators’ total contributions. There
should be a positive relationship between total contributions and contributions from the
pharmaceutical industry: the more contributions a legislator receives from all industries, the
more he or she should receive from the pharmaceutical industry. “Retired contributions” is the
total of contributions candidates received from retired citizens. On one hand, retirees may
choose to give contributions to oppose reimports because of the quality issue: people’s health
tends to deteriorate with age, so retirees are likely to be sensitive to the quality issue related to
prescription drugs. On the other hand, a high amount of contributions from retirees could
offset, and therefore discourage, contributions from the pharmaceutical industry: retirees may
oppose the ban on reimports because many seniors did not have access to prescription drug
coverage in 2003 (i.e. before the Medicare Prescription Drug Improvement and
Modernization Act which increased access to seniors starting in 2006).
Several independent variables are used to take into account representatives’
characteristics. Gokcekus et al. (2006) find that the vote on the Pharmaceutical Market
Access Act was essentially a partisan vote, with Republicans voting against and Democrats for
the bill (see Table 2). They also find that women in the House are more likely to support
reimports. The variables “Woman”, which equals one if the member is a woman, and
“Democrat”, which equals one if the member is part of the Democratic Party, should therefore
bear a negative sign: the pharmaceutical industry will unlikely give large contributions to
representatives who have high chances of being in favor of reimports, and who would require
very large amounts of contributions to change their vote. Gokcekus et al. (2006) also find that
free-traders (i.e. House representatives who oppose trade barriers and subsidies) are more
14
likely to vote for the bill, while internationalists (i.e. House representatives who oppose trade
barriers but support subsidies) are more likely to vote against it. There should therefore be a
negative relationship between pharmaceutical contributions and the “Free-trader” variable,
and a positive one between contributions and the “Internationalist” variable.
The second set of independent variables defines a House member’s power. An
influential legislator will probably receive more contributions than one who does not have
very much power in Congress. The representatives who have the most power in Congress on
issues related to the pharmaceutical industry are those who belong to the Committee on Ways
and Means or the Committee on Energy and Commerce. The Chairs of these committees are
probably those who should receive the most money from the pharmaceutical industry.
Ranking members may also receive some money from the industry, though probably less
since they belong to the minority party: their influence on the general population and other
legislators might be less important.
Finally, several variables are used to define constituents’ characteristics. The “Senior”
variable represents the percentage of the population within the district that is 65 years and
over. For the same reasons as the “Retired contributions” variable, seniors may oppose or
favor reimports, but are probably sensitive to the issue. The variable “Labor force” represents
the percentage of the population (16 years and older) that is working. The industry should
give more money to representatives from districts with a high percentage of workers. Such a
population should oppose reimports, since they are more likely to be covered by a medical
insurance policy than the unemployed, and are less likely to fall sick than the elderly. They
probably prefer to have access to “safe” drugs, even if they are more expensive. The variable
“Individual poverty” represents the percentage of individuals who are below poverty level and
the variable “Median income” is the median household income in 1999 dollars in the
member’s district. Poor people should be more sensitive to the price aspect of the debate,

15
because it is probably better to risk taking an affordable reimported drug, than to not be able
to buy an expensive safe drug. The more there are poor people in the district, the less likely
the industry should give high contributions to its representative. However, representatives
from rich districts could receive high levels of contributions, because their constituents are
more likely to be willing to pay high prices for drugs they think are of higher quality,
especially since they are more likely to have some type of health insurance. The variables
“Median income” and “Individual poverty” are complementary because the percentage of
poor individuals can vary for a given level of median income. The variable “Bachelor’s
degree” is the percentage of the district’s population that holds a bachelor’s degree or higher.
More educated constituents may be more skeptical of the industry’s safety argument, and
could favor reimports. Their representatives should therefore receive less money from the
pharmaceutical industry. The variable “Pharma employment” represents the number of
individuals employed in pharmaceutical and medicine manufacturing in the member’s district.
This variable should be positively correlated to pharmaceutical contributions: pharmaceutical
employees are more likely to oppose reimports because they want for their companies to earn
high profits or because they actually believe that foreign drugs are a health hazard. The two
last variables used to define constituencies’ characteristics are “Canadian border” and
“Mexican border”. They equal one if the member’s state shares a land border with Canada or
Mexico, respectively. Representatives from these districts should receive less money from the
industry, because their constituents are probably more aware of the price and quality of a drug
in the foreign market, and are less likely to believe that foreign drugs are unsafe.
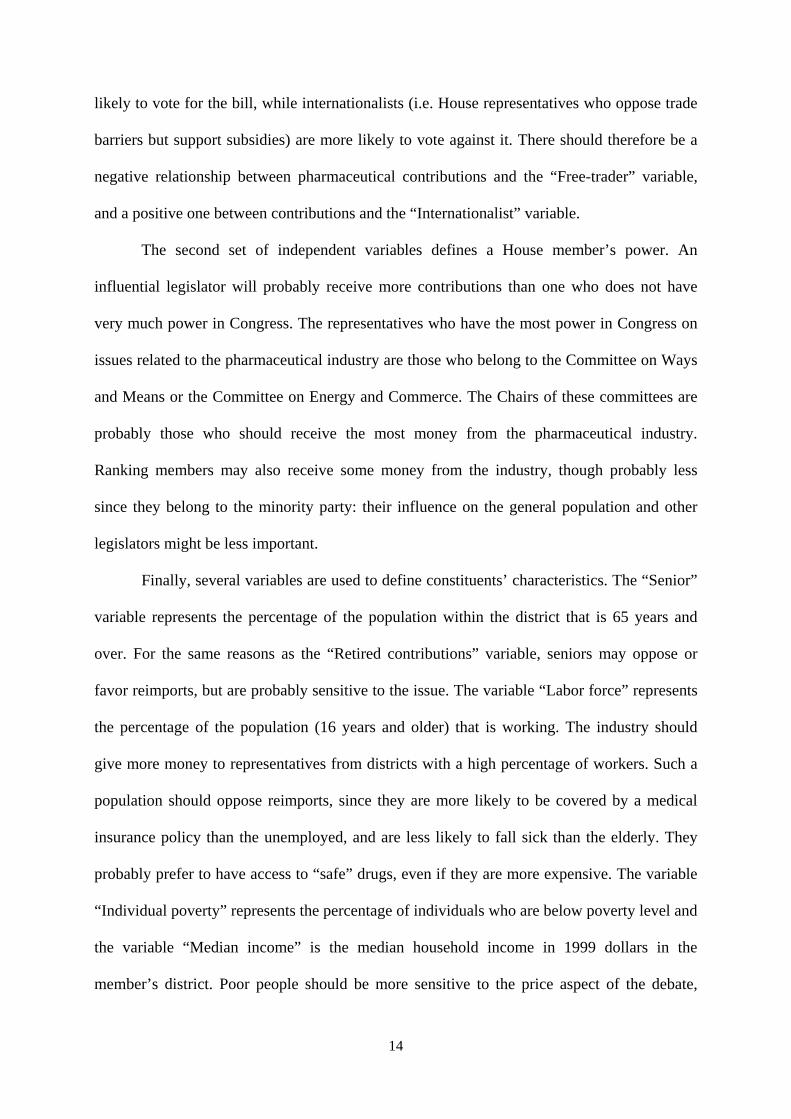
Finally, the effect of the actual vote of a House member on the Pharmaceutical
Market Access Act is measured with the variable “Aye”, which is equal to one if the member
voted for the bill. Because a positive vote would lead to a legalization of reimports, members
who voted against reimports should have received more contributions than those who voted
16
for. Those who voted against are also those who need the industry’s funds to justify their
position on the issue. More than a reward for a positive vote, the theoretical model suggests
that members should have received more contributions when voting against reimports because
the industry wanted to give funds to these House members to speak out against reimports.
This is confirmed by Table 2, which shows the voting decisions of legislators according to
their own or their constituents’ types. A large majority of those who received above average
levels of contributions from the pharmaceutical industry voted against the bill. Table 2 also
confirms that a majority of women and Democrats voted for the bill. Of the members of the
Committee on Energy and Commerce, 61% voted against, while only a small majority of the
Committee on Ways and Means also voted against. Members whose constituencies had above
average levels of seniors voted for the bill in majority, as well as members from poor or more
educated districts. Those from districts in states bordering Canada or Mexico also voted
against reimports.
Table 2 Voting decisions by types of legislators and constituents Legislator/constituents’ type Aye vote No vote Didn’t vote Above average pharma contributions 19.66% 78.63% 1.71% Above average total contributions 50.78% 48.44% 0.78% Above average retired contributions 55.83% 44.17% - Woman=1 71.93% 28.07% - Democrat=1 75.77% 22.16% 2.06% Leader or Speaker=1 33.33% 66.67% - Chair=1 - 100% - Ways and Means=1 50.00% 47.22% 2.78% Energy=1 38.89% 61.11% - Ranking=1 50.00% 50.00% - Free-trader=1 60.87% 39.13% - Internationalist=1 54.86% 43.78% 1.35% Above average senior 59.90% 39.58% 0.52% Above average labor force 51.39% 48.15% 0.46% Above average individual poverty 61.67% 35.93% 2.40% Above average median income 51.44% 47.98% 0.58% Above average Bachelor’s degree 56.65% 42.77% 0.58% Canadian Border=1 69.44% 30.56% - Mexican Border=1 57.14% 41.76% 1.10% Above average pharma employment 53.76% 44.09% 2.15%
Column (1) in Table 3 shows the results of the full model, which tests the impact of
representatives’ characteristics and power, as well as constituents’ characteristics. Column (2)

17
gives the results of the regression using only constituents’ characteristics, while column (3)
displays the results of the regression using only representatives’ characteristics and power.
Finally the impact of a vote in favor of the Pharmaceutical Market Access Act on
contributions is added to the full model in column (4).
Most variables are significant and show the expected sign. Total contributions have a
significant positive impact on pharmaceutical contributions: the more a House member raises
money during the cycle, the higher the contributions he will receive from the pharmaceutical
industry. However, there is no significant correlation between contributions and being a
woman or a Democrat in the model that takes into account votes on the Pharmaceutical
Market Access Act. This result can be explained by the fact that women and Democrats voted
in majority for the bill. In the regressions that do not take votes into account, the Democrat
variable is significant: a Democrat will receive nearly 10,000 dollars in contributions less than
a Republican. A member’s power in the House is an important determinant of contributions
from the pharmaceutical industry. A Leader or Speaker of the House receives an increase in
pharmaceutical contributions of more than 50,000 dollars. The increase is around 60,000
dollars for a Chair of the Committee on Ways and Means or the Committee on Energy and
Commerce, more than 17,000 dollars for a member of the Committee on Ways and Means,
and more than 20,000 dollars for a member of the Committee on Energy and Commerce.
However, being a Ranking member of one of these committees, a free-trader or an
internationalist does not have a significant impact on contributions.
House members with older constituents receive more money from the pharmaceutical
industry, whereas those who receive a lot of contributions from retirees obtain fewer
contributions from the pharmaceutical industry. This result is probably due to the fact that
groups that lobby on the behalf of retirees, such as the AARP4, are in favor of reimports,
4 http://assets.aarp.org/www.aarp.org_/articles/international/ReimportationQA.pdf.
18
especially from Canada. Representatives from districts with a high percentage of seniors are
not necessarily those who receive the largest contributions from retirees. The pharmaceutical
industry may therefore give more contributions to House members from districts with a large
population of seniors, but where senior interest groups are not necessarily well organized.
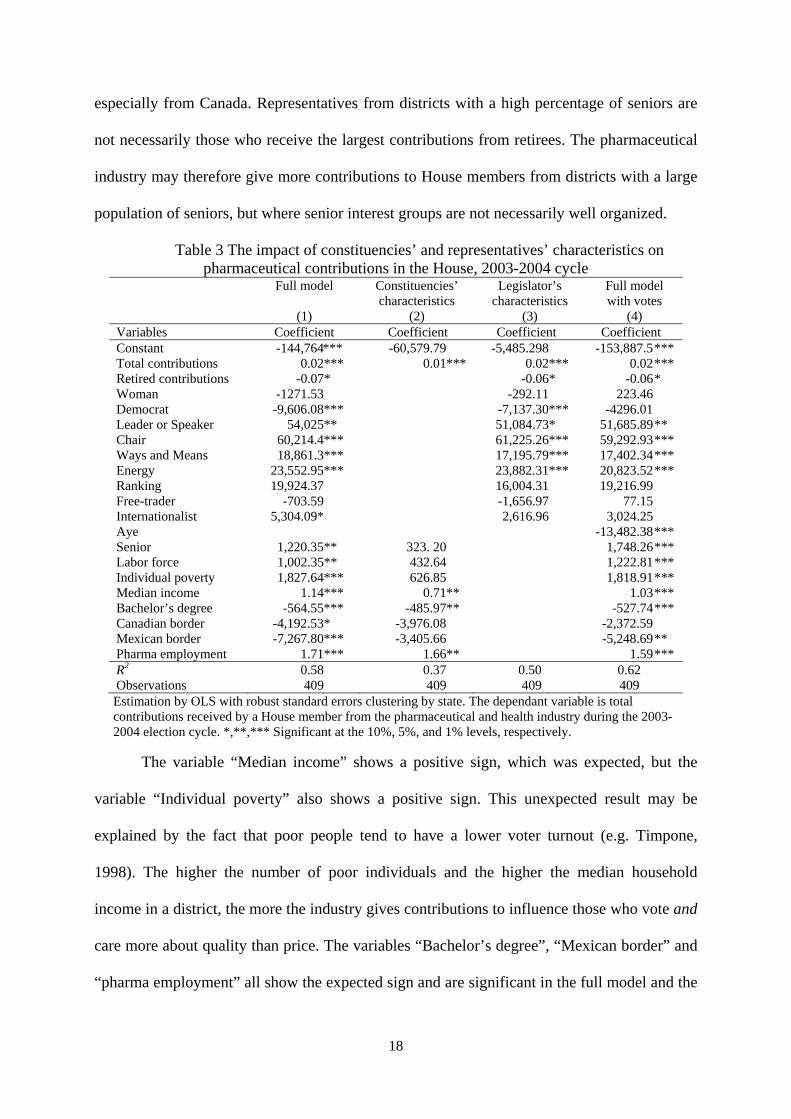
Table 3 The impact of constituencies’ and representatives’ characteristics on pharmaceutical contributions in the House, 2003-2004 cycle
Full model
(1)
Constituencies’ characteristics
(2)
Legislator’s characteristics
(3)
Full model with votes
(4) Variables Coefficient Coefficient Coefficient Coefficient Constant -144,764*** -60,579.79 -5,485.298 -153,887.5 *** Total contributions 0.02*** 0.01*** 0.02*** 0.02 *** Retired contributions -0.07* -0.06* -0.06 * Woman -1271.53 -292.11 223.46 Democrat -9,606.08*** -7,137.30*** -4296.01 Leader or Speaker 54,025** 51,084.73* 51,685.89 ** Chair 60,214.4*** 61,225.26*** 59,292.93 *** Ways and Means 18,861.3*** 17,195.79*** 17,402.34 *** Energy 23,552.95*** 23,882.31*** 20,823.52 *** Ranking 19,924.37 16,004.31 19,216.99 Free-trader -703.59 -1,656.97 77.15 Internationalist 5,304.09* 2,616.96 3,024.25 Aye -13,482.38 *** Senior 1,220.35** 323. 20 1,748.26 *** Labor force 1,002.35** 432.64 1,222.81 *** Individual poverty 1,827.64*** 626.85 1,818.91 *** Median income 1.14*** 0.71** 1.03 *** Bachelor’s degree -564.55*** -485.97** -527.74 *** Canadian border -4,192.53* -3,976.08 -2,372.59 Mexican border -7,267.80*** -3,405.66 -5,248.69 ** Pharma employment 1.71*** 1.66** 1.59 *** R2 0.58 0.37 0.50 0.62 Observations 409 409 409 409 Estimation by OLS with robust standard errors clustering by state. The dependant variable is total contributions received by a House member from the pharmaceutical and health industry during the 2003-2004 election cycle. *,**,*** Significant at the 10%, 5%, and 1% levels, respectively.
The variable “Median income” shows a positive sign, which was expected, but the
variable “Individual poverty” also shows a positive sign. This unexpected result may be
explained by the fact that poor people tend to have a lower voter turnout (e.g. Timpone,
1998). The higher the number of poor individuals and the higher the median household
income in a district, the more the industry gives contributions to influence those who vote and
care more about quality than price. The variables “Bachelor’s degree”, “Mexican border” and
“pharma employment” all show the expected sign and are significant in the full model and the

19
full model with votes. The variable “Canadian border” shows the expected sign but is not
significant in the full model with votes.
Finally, a vote for the Pharmaceutical Market Access Act reduces the amount of
contributions from the pharmaceutical industry, by 13,482 dollars. The model suggests that
contributions do not buy votes, but are meant to help House members express their opposition
to reimports. The industry will therefore give more money before the vote to members who
are most likely to vote against, and after the vote to members who actually voted against
reimports. A legislator who voted against reimports may need contributions even after the
vote to convince constituents that he or she made the right decision. Table 4 shows that, on
average, the legislators who voted against reimports received 30,204 dollars during the 2003-
2004 election cycle, while those who voted for reimports received only 6,445 dollars.
Table 4 Summary statistics by vote Nay or abstention Aye
Variables Mean Std Mean Std Pharma contributions 30,203.83 38,805.56 6,445.10 12,881.63 Total contributions 1,386,300 1,305,290 1,120,654 971,861.1 Retired contributions 51,156.79 85,460.5 46,399.17 78,336.41 Woman 0.09 0.29 0.18 0.38 Democrat 0.26 0.44 0.64 0.48 Leader or Speaker 0.01 0.11 0.00 0.07 Chair 0.02 0.13 0 0 Ways and Means 0.1 0.30 0.08 0.27 Energy 0.18 0.39 0.09 0.29 Ranking 0.01 0.07 0.00 0.07 Free-trader 0.05 0.22 0.06 0.24 Internationalist 0.93 0.26 0.89 0.32 Senior 11.94 3.10 12.78 3.12 Labor force 64.46 4.88 63.50 5.14 Individual poverty 11.61 5.44 12.93 5.96 Median Income 45,064.81 11,710.21 42,421.26 10,414.58 Bachelor’s Degree 24.48 8.95 24.13 9.31 Canadian Border 0.12 0.33 0.22 0.41 Mexican Border 0.22 0.41 0.23 0.42 Pharma employment 1,942.06 4,117.07 1,433.33 2,772.56 Observations 180 229
While deciding to whom it will give money after the vote is easy, the industry needs to
go through a selection process before the vote. The selection is based on House members’

20
characteristics and power, as well as on constituents’ characteristics. The company faces four
cases:
(i) The legislator and consumers probably favor reimports. The company should not give
any money to the legislator on the reimports issue, since it is not in the legislator’s
interest to take a public stand against reimports. The legislator would probably use the
funds for other purposes than diffusing the anti-reimports arguments.
(ii) The legislator probably opposes reimports, but consumers probably favor reimports.
The legislator needs the contributions to convince voters that reimports should be
banned. For instance, the legislator may not want to take the responsibility of voting
for reimports if he or she thinks that people may die because of counterfeit drugs. But
voters might favor reimports despite contributions. The company may decide to not
waste resources on a legislator who would vote for reimports to be reelected.
(iii) The legislator probably favors reimports, but consumers are probably sensitive to the
anti-reimports campaign. In this case, the legislator’s objective function suggests he or
she should vote against reimports to be reelected. However, the legislator may not
want to speak out against reimports.
(iv) The legislator thinks that reimports should be banned and consumers are probably
sensitive to the anti-reimports campaign. The legislator does not need contributions to
vote against reimports. The company could nonetheless give a high amount of
contributions to a legislator in this case, to speak-up against reimports and influence
legislators or constituents from other congressional districts.
Figure 15 gives the estimated amount of contributions the pharmaceutical industry
gives to legislators, according to these four cases.
5 See appendix for details on the values used for this simulation.
21
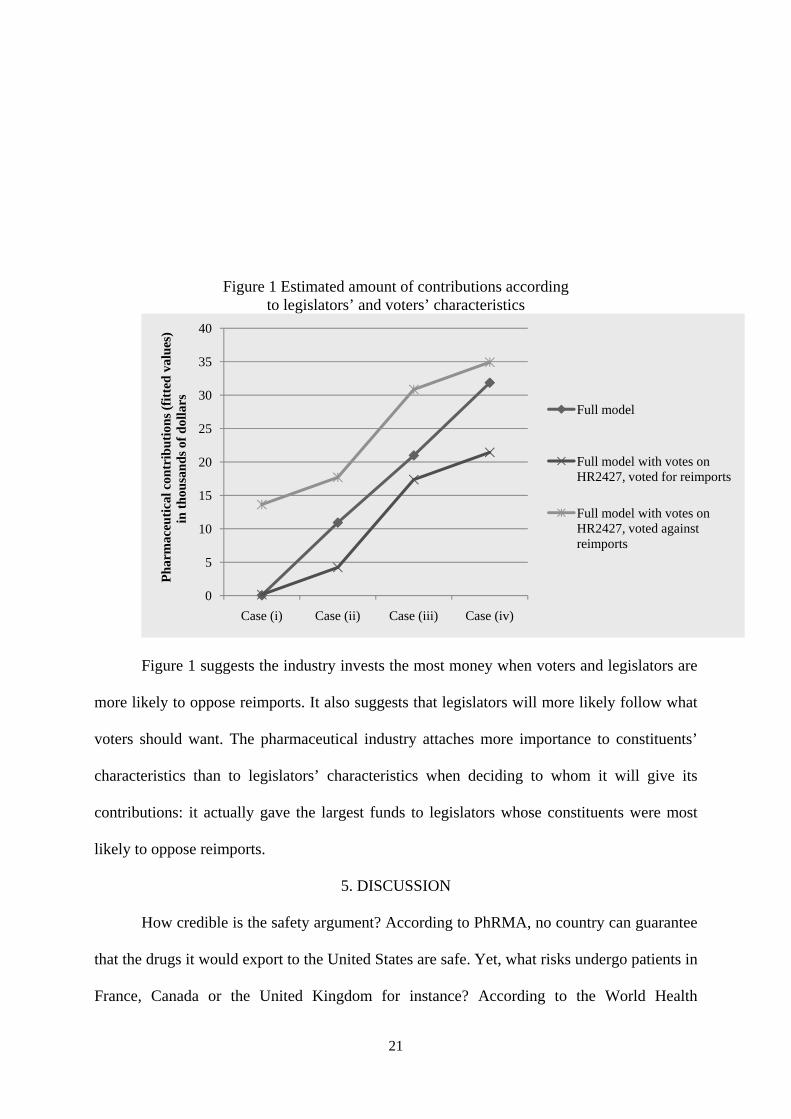
Figure 1 Estimated amount of contributions according to legislators’ and voters’ characteristics
Figure 1 suggests the industry invests the most money when voters and legislators are
more likely to oppose reimports. It also suggests that legislators will more likely follow what
voters should want. The pharmaceutical industry attaches more importance to constituents’
characteristics than to legislators’ characteristics when deciding to whom it will give its
contributions: it actually gave the largest funds to legislators whose constituents were most
likely to oppose reimports.
5. DISCUSSION
How credible is the safety argument? According to PhRMA, no country can guarantee
that the drugs it would export to the United States are safe. Yet, what risks undergo patients in
France, Canada or the United Kingdom for instance? According to the World Health
0
5
10
15
20
25
30
35
40
Case (i) Case (ii) Case (iii) Case (iv)
Phar
mac
eutic
al c
ontr
ibut
ions
(fitt
ed v
alue
s)in
thou
sand
s of d
olla
rs Full model
Full model with votes on HR2427, voted for reimports
Full model with votes on HR2427, voted against reimports
22
Organization, most developed countries (e.g. USA, most of EU, Australia, Canada, Japan, and
New Zealand) have less than 1% of market value6 of counterfeit drugs in the market.
Furthermore, pharmaceutical companies in the United States oppose pharmacists’ and
wholesalers’ right to import drugs, but many companies outsource a large part of their
production overseas. In 2007, the United States imported nearly 49 billion dollars worth of
pharmaceutical products, from 84 countries according to data from the U.S. Census Bureau7.
According to Bart Stupak, Chairman of the Oversight & Investigations Subcommittee of the
House Committee on Energy and Commerce (2007), at least 80% of the active
pharmaceutical ingredients in pharmaceuticals sold in the United States are imported from
abroad. He adds that the FDA is unable to guarantee the quality of all the drugs that
manufacturers import to the United States, because it is unable to effectively inspect foreign
drug-making facilities. Following the introduction on the U.S. market of contaminated lots of
the blood-thinner heparin manufactured in China, which caused several deaths, John Dingell,
Chairman of the Committee on Energy and Commerce, confirmed in March 2008 that the
FDA was unable to control the facilities that manufacture overseas the drugs that are sold on
the U.S. market.8
Yet, drugs currently sold in the United States seem to be quite safe, a part from drugs
bought by consumers from abroad on the Internet. Legislators and consumers can therefore
hold legitimate doubts on the quality of foreign drugs.
Recently, the reimportation issue has been discussed twice in the Senate as
amendments of major bills. The first time was in May 2007 during the debate on the Food and
Drug Administration Revitalization Act: the authorization of reimports was included in a first
version of the bill, but an amendment removed the clause from the bill. The second time was
in December 2009 during the debate on the Healthcare Reform Bill: an amendment for a 6 http://www.who.int/mediacentre/factsheets/fs275/en/. 7 US Bureau of the Census: Foreign Trade Division, 2008. 8 http://energycommerce.house.gov/index.php?option=com_content&task=view&id=274&Itemid=106.

23
clause authorizing reimports failed to pass. Both times, Senators who favored reimports voted
against to avoid the main text from failing to pass. President George Bush had threatened to
veto any bill which would legalize drug reimports9, and President Barack Obama apparently
did not want to risk losing a precious vote for the bill on the reform of healthcare. If Senators
voted on a bill whose sole object was reimports, the bill could pass. Another econometric
estimation could then be performed to confirm the results of the present model.
6. CONCLUSION
The model shows that the quality of the message the interest group gives out is
essential in obtaining votes. Contributions enable the interest group to outsource part of the
campaign efforts against reimports; they are not directly meant to buy the interest group’s
preferred trade policy. The pharmaceutical industry gives contributions to legislators who are
most likely to vote for its interests, and therefore does not buy votes. The more legislators
take public stands in favor of the industry’s interest, the more the industry’s message becomes
credible. The vertical differentiation model implies that an interest group’s “power” resides in
its ability to publicize a forceful message. If the interest group only has contributions to give
to legislators and no powerful message, then chances are it will not get a favorable vote from
legislators, especially on an important topic such as the prices of pharmaceuticals.
ACKNOWLEDGMENTS
The author wishes to thank Bernard Guillochon, Agnès Gramain, Edward Tower,
Henry Chappell, Paul Pecorino, Arye Hillman as well as anonymous referees for valuable
comments and suggestions. The author would also like to thank seminar participants from the
Université Paris Dauphine, the Public Choice Society’s 2009 conference and the 18th
9 This probably explains why the 2003 Pharmaceutical Market Access Act died in the Senate Committee on Health, Education, Labor, and Pensions.

24
Silvaplana Workshop in Political Economy for valuable comments on an earlier version of
this paper.
APPENDIX – Values used for the estimation of Graph1
Fitte
d V
alue
Wom
an
Dem
ocra
t
Seni
or
Labo
r for
ce
Indi
vidu
al p
over
ty
Med
ian
Inco
me
Can
adia
n B
orde
r
Phar
ma
empl
oym
ent
Mod
el
Case (i) 481.35 1 1 13 62 13 40,000 1 1,500
Full model Case (ii) 11,358.96 0 0 13 62 13 40,000 1 1,500Case (iii) 20,975.30 1 1 11 67 11 50,000 0 5,000Case (iv) 31,852.92 0 0 11 67 11 50,000 0 5,000Case (i) 149.52 1 1 13 62 13 40,000 1 1,500
Full model, voted yes
Case (ii) 4,222.07 0 0 13 62 13 40,000 1 1,500Case (iii) 17,364.53 1 1 11 67 11 50,000 0 5,000Case (iv) 21,437.08 0 0 11 67 11 50,000 0 5,000Case (i) 13,631.90 1 1 13 62 13 40,000 1 1,500
Full model, voted noCase (ii) 17,704.45 0 0 13 62 13 40,000 1 1,500Case (iii) 30,846.91 1 1 11 67 11 50,000 0 5,000Case (iv) 34,919.46 0 0 11 67 11 50,000 0 5,000For all: - Total contributions: 1,250,000 dollars - Retired contributions: 46,000 dollars - Leader or speaker: 0 - Chair: 0 - Ways and Means: 0 - Energy: 0 - Ranking: 0 - Free-trader: 0 - Internationalist: 1 - Bachelor’s Degree: 23% - Mexican border: 0 REFERENCES
Ainsworth, S. and I. Sened, 1993, The role of lobbyists: entrepreneurs with two audiences. American Journal of Political Science 37, 834–866. Anis, A.H. and Q. Wen, 1998, Price regulation of pharmaceuticals in Canada. Journal of Health Economics 17, 21–38.

25
Ansolabehere, S., J. M. de Figueiredo, and J. M. Snyder Jr., 2003, Why is there so little money in U.S. politics? Journal of Economic Perspectives 17, 105–130. Austen-Smith, D., 1995, Campaign contributions and access. American Political Science Review 89, 566–581. Baldwin, R. E. and C.S. Magee, 2000, Is trade policy for sale? Congressional voting on recent trade bills. Public Choice 105, 79–101. Bresnahan, T., 1987, Competition and collusion in the American automobile industry: the 1955 price war. The Journal of Industrial Economics 35, 457–482. Coate, S., 2004, Political competition with campaign contributions and informative advertising. Journal of the European Economic Association 2, 772–804. Che, Y.-K. and I. L. Gale, 1998, Caps on political lobbying. American Economic Review 88, 643–651. Gawande, K. and P. Krishna, 2003, The political economy of trade policy: empirical approaches, in: E. K. Choi and J. Harrigan, eds., The Handbook of International Trade (Basil Blackwell Publishing) 213–250. Gokcekus, O., M. Adams, H. Grabowski, and E. Tower, 2006, How did the 2003 prescription drug re-importation bill pass the House? Economics & Politics 18, 27–45. Griswold, D., 2005, Free trade, free markets: rating the 108th Congress. Cato Institute Trade Policy Analysis Papers 28 (http://www.cato.org/pub_display.php?pub_id=6799). Grossman, G. M. and E. Helpman, 1994, Protection for sale. American Economic Review 84, 833–850. Grossman, G. M. and E. Helpman, 2002, Special Interest Politics (MIT Press, Cambridge, MA, and London, UK). Hall, R. L. and A. V. Deardorff, 2006, Lobbying as legislative subsidy. American Political Science Review 100, 69–84. Hillman, A. L., 1982, Declining industries and political support protectionist motives. American Economic Review 72, 1180–1187. Hillman, A. L., 1989, The Political Economy of Protection (Harwood Academic Publishers, London, UK). Levitt, S. D., 1994, Using repeat challengers to estimate the effect of campaign spending on election outcomes in the U.S. House. Journal of Political Economy 102, 777–798. Mussa, M. and S. Rosen, 1978, Monopoly and product quality. Journal of Economic Theory 18, 301–317.

26
Paris, V. and E. Docteur, 2007, Pharmaceutical pricing and reimbursement policies in Canada. OECD Health Working Papers, no. 24, Paris. Available online at: http:// www.oecd.org/dataoecd/21/40/37868186.pdf. Timpone, R., 1998, Structure, behavior, and voter turnout in the United States. The American Political Science Review 92, 145–158. Tirole, J., 1988, The Theory of Industrial Organization (MIT Press, Cambridge, MA). Tullock, G., 1972, The purchase of politicians. Western Economic Journal 10, 354–355. U.S. House of Representatives, 2003, H.R. 2427 Pharmaceutical Market Access Act of 2003. (Bill in the House of Representatives, June 11, 2003.) U.S. House of Representatives, Oversight & Investigations Subcommittee, 2007, FDA Foreign Drug Inspection Program: a System at Risk (http://energycommerce.house.gov/ images/stories/Documents/Hearings/PDF/110-oi-hrg.110107.StaffTripReport.pdf). Wright, D. J., 2004, The drug bargaining game: pharmaceutical regulation in Australia. Journal of Health Economics 23, 785–813. Wright, J., 2004, Campaign contributions and congressional voting on tobacco policy, 1980-2000. Business and Politics 6, 1–26.
![] Paris, France](https://static.fdocuments.net/doc/165x107/61f73e627130d91f77389333/-paris-france.jpg)