Political Alignment and Public Health Conditions: an ... · Political Alignment and Public Health...
20
Political Alignment and Public Health Conditions: an empirical approach based on a regression discontinuity design 1 Maria Izabel Mendes + and Fl´avia Chein † Abstract The aim of this paper is to evaluate the e↵ects of political alignment on public health conditions in Brazil. We adopt a regression discontinuity design, both in its parametric and non-parametric versions. Our source of exogeneous discontinuity is based on the results of the municipal executive elections in the years 2004 and 2008, in which the winner and runner-up belonged to opposing coalitions. This study is a step forward in the related literature since the existing empirical work has only explored the e↵ect on public spending. Public health condition is measured by health indicators taken from DATASUS, including infant mortality due to diarrhea, general infant and maternal mortality rate. The variables related to the elections were taken from the Brazilian Superior Electoral Court (Tribunal Superior Eleitoral, TSE). The main findings point that : i) the discontinuity observed in the federal transfers and heath indicators varies across political cycles; ii) the e↵ects of political alignment are more sensitive to the first two years after the elections; iii) the absence of discontinuities in health care indicators may mean that decision-makers are sensitive to these indicators, avoiding opportunistic choices. Resumo O objetivo deste trabalho ´ e avaliar os efeitos do alinhamento pol´ ıtico nas condi¸c˜ oes de sa´ ude p´ ublica no Brasil. Adotamos um desenho de regress˜ ao de descont´ ınua, tanto em suas vers˜ oes param´ etricas como n˜ao param´ etricas. Nossa fonte de descontinuidade exagerada baseia-se nos resul- tados das elei¸ c˜ oes executivas municipais nos anos 2004 e 2008, nas quais o vencedor e o vice-campe˜ao pertenciam a coaliz˜ oes opostas. Este estudo ´ e um passo em frente na literatura relacionada, uma vez que trabalhos anteriores exploram apenas o efeito sobre os gastos p´ ublicos. O estado de sa´ ude p´ ublica ´ e medido por indicadores de sa´ ude tomados de DATASUS, incluindo a mortalidade infantil devido ` a diarr´ eia, taxa geral de mortalidade infantil e materna. As vari´aveis relacionadas ` as elei¸ c˜oesforam retiradas do Tribunal superior eleitoral brasileiro (Tribunal Superior Eleitoral, TSE). As principais conclus˜ oes apontam que: i) a descontinuidade observada nas transferˆ encias federais e indicadores de sa´ ude varia em todos os ciclos pol´ ıticos; Ii) os efeitos do alinhamento pol´ ıtico s˜ ao mais sens´ ıveis aos dois primeiros anos ap´os as elei¸ c˜ oes; Iii) a ausˆ encia de descontinuidades nos indicadores de cuida- dos de sa´ ude pode significar que os decisores s˜ ao sens´ ıveis a esses indicadores, evitando escolhas oportunistas. JEL Classification: H10; I15; I18 Palavras chave: ciclos pol´ ıticos, sa´ ude p´ ublica,elei¸c˜ oes municipais, Brasil, RDD Key Words: political cycles; health care; municipal executive elections; Brazil, RDD Area: Economia do Setor P´ ublico 1 We are thankful to CNPq and FAPEMIG for financial support. + Department of Economics, Federal University of Juiz de Fora; E-mail: [email protected]. † Department of Economics, Federal University of Juiz de Fora; Research Productivity Fellow (CNPq National Research Council);E-mail: fl[email protected]; ↵[email protected]. 1
Transcript of Political Alignment and Public Health Conditions: an ... · Political Alignment and Public Health...
Political Alignment and Public Health Conditions: an empirical approachbased on a regression discontinuity design1
Maria Izabel Mendes+ and Flavia Chein†
Abstract
The aim of this paper is to evaluate the e↵ects of political alignment on public health conditionsin Brazil. We adopt a regression discontinuity design, both in its parametric and non-parametricversions. Our source of exogeneous discontinuity is based on the results of the municipal executiveelections in the years 2004 and 2008, in which the winner and runner-up belonged to opposingcoalitions. This study is a step forward in the related literature since the existing empirical workhas only explored the e↵ect on public spending. Public health condition is measured by healthindicators taken from DATASUS, including infant mortality due to diarrhea, general infant andmaternal mortality rate. The variables related to the elections were taken from the Brazilian SuperiorElectoral Court (Tribunal Superior Eleitoral, TSE). The main findings point that : i) the discontinuityobserved in the federal transfers and heath indicators varies across political cycles; ii) the e↵ects ofpolitical alignment are more sensitive to the first two years after the elections; iii) the absenceof discontinuities in health care indicators may mean that decision-makers are sensitive to theseindicators, avoiding opportunistic choices.
Resumo
O objetivo deste trabalho e avaliar os efeitos do alinhamento polıtico nas condicoes de saudepublica no Brasil. Adotamos um desenho de regressao de descontınua, tanto em suas versoesparametricas como nao parametricas. Nossa fonte de descontinuidade exagerada baseia-se nos resul-tados das eleicoes executivas municipais nos anos 2004 e 2008, nas quais o vencedor e o vice-campeaopertenciam a coalizoes opostas. Este estudo e um passo em frente na literatura relacionada, uma vezque trabalhos anteriores exploram apenas o efeito sobre os gastos publicos. O estado de saude publicae medido por indicadores de saude tomados de DATASUS, incluindo a mortalidade infantil devidoa diarreia, taxa geral de mortalidade infantil e materna. As variaveis relacionadas as eleicoes foramretiradas do Tribunal superior eleitoral brasileiro (Tribunal Superior Eleitoral, TSE). As principaisconclusoes apontam que: i) a descontinuidade observada nas transferencias federais e indicadores desaude varia em todos os ciclos polıticos; Ii) os efeitos do alinhamento polıtico sao mais sensıveis aosdois primeiros anos apos as eleicoes; Iii) a ausencia de descontinuidades nos indicadores de cuida-dos de saude pode significar que os decisores sao sensıveis a esses indicadores, evitando escolhasoportunistas.
JEL Classification: H10; I15; I18Palavras chave: ciclos polıticos, saude publica, eleicoes municipais, Brasil, RDDKey Words: political cycles; health care; municipal executive elections; Brazil, RDDArea: Economia do Setor Publico
1We are thankful to CNPq and FAPEMIG for financial support.
+Department of Economics, Federal University of Juiz de Fora; E-mail: [email protected].
†Department of Economics, Federal University of Juiz de Fora; Research Productivity Fellow (CNPq National
Research Council);E-mail: [email protected]; ↵[email protected].
1

1 Introduction
History has demonstrated a close relationship between politics and economy and how political goalsa↵ect the behavior of economic variables. According to the theory of Political Cycles, in order toachieve or remain in power, the political agents must show that they can lead in a way that eachvoter can be provided with their essential needs. One way of doing this is through decision-makingat the macroeconomic level on the conduct of the fiscal and monetary policy and its impact on thevoter’s daily life.
In this regard, over the past few years, several studies have been devoted to understanding thisinterrelation between political and economic systems. In the international literature, the worksof Downs (1957), Nordhaus (1975) and Hibbs (1977) demonstrate the existence of cycles caused bypolitical reasons. Downs (1957), for instance, relates how the political actors’ (parties and candidates)private interests motivate their choices. According to the author, the economic problem of thepolitical parties is vote maximization. Thus, policy-making is focused on the achievement of thisobjective, that is, the victory in the elections.
On the other hand, Nordhaus (1975) showed that a pattern of political decisions can be foundwhen elections happen regularly. His work analyzes the Phillips Curve in nine countries during theelection period in order to check for any control or manipulation of the behavior of two variables:unemployment and inflation. The result indicated that there is a reduction in unemployment beforethe election period with a rise in the inflation rates.
These two works have contributed to the emergence of the theory of opportunistic political be-havior, in which the political agent solely seeks to remain in power. Regardless of ideological bias,the goal is to maximize votes.
The partisan model (Hibbs, 1977), on the other hand, shows a causal relationship between politicaldecisions motivated by ideological interests and economic cycles. Thus, political parties committed todi↵erent interests behave di↵erently, seeking to favor those groups with whom they have the greatestideological a�nit. In this sense, besides a victory in the elections, governments would be interestedin meeting the demands of the social class that provides greater political support to them and thatsomehow is related to the ideologies of the ruling party.
Rogo↵ and Sibert (1988), based on Nordhaus (1975), proposed the theory of political budgetcycles, in which the focus is on fiscal policies. According to this theory, in election years, govern-ments increase public spending and transfers, allocate budget funds to short-term and high visibilityprojects, besides waiving tax revenues.
In Brazil, the research on the existence of political-economic cycles has advanced in recent yearsdue to the democratization processes, the organization of the party system and data reliability.The studies have been conducted in the three administrative levels (Federal, State and Municipal)and, in most of them there is empirical evidence suggesting the existence of cycles. The main issuesaddressed refer to the opportunistic and partisan e↵ects on spending and private investments (Sakuraiand Gremaud, 2007; Ferreira and Bulgarin, 2007; Nakaguma and Bender, 2010; Novaes and Mattos,2010; Mendes and Chein,2015). However, most of these studies use panel estimators that, althoughhaving the appropriate treatment to capture the unobservable specific e↵ects of the units treated, donot guarantee the exogenous e↵ect of the policy cycle on the variables under consideration. Therefore,any empirical correlation between the political cycle and the variable of interest can be completelydriven by local socioeconomic conditions that a↵ect both the election results and the phenomenonbeing focused.
Considering the importance of health care policies in developing countries, especially in Brazil,the aim of this article is to investigate the relationship between political alignment and public healthconditions. Therefore, we check whether the expenditure on health care is a↵ected or not by thepolitical alliances that are formed during the period of elections and whether health indicators arealso a↵ected by these cycles. Given the di�culty of describing the level of health care, it was decided
2
to use variables related to infant mortality. This indicator is commonly used as a proxy to indicatethe level of health care and socioeconomic development of populations.
Our empirical strategy is very similar to the one adopted by Brollo and Nannicini (2012) andLeao, Mello and Ferraz (2012). We use a regression discontinuity approach that exploits the outcomesof local and general elections held during the period 2004-2012 as a source of within-municipalityvariation in political alignment.
The use of regression discontinuity (RD) aims to advance in the identification of the relationshipbetween the political alignment and health care, since a comparison between municipalities ruled bymayors aligned with the president and those with mayors who are not is likely to generate unbiasedestimates due to the problem of endogeneity. The goal is to find an exogenous variation that a↵ectspolitical alignment, considering only the close races.
The remainer of this paper is organized as follows: Section 2 provides a brief background onhealth care funding in Brazil. The next section presents a descriptive data analysis to support thetreatment applied to the variables selected. Section 4 deals with the methodological description themodels employed, followed by the estimated results. Finally, in Section 5, the main conclusions aredrawn.
2 Health Care Financing in Brazil
The Brazilian Unified Health System (Sistema Unico de Saude, SUS) is the o�cial federal healthcare institution in the country. The SUS is one of the largest public health systems in the world andthe only one that provides a comprehensive care to the population and is completely free.
The theoretical basis of the system is the fiscal federalism and decentralization. Federalism refersto the provision of public goods in a decentralized manner to sub-national governments in order toallow that levels of public spending are adapted to meet the needs of a heterogeneous population.Decentralization refers to a transfer of certain administrative and fiscal functions and powers from acentral authority to various local authorities (OATES, 1972).
The SUS is managed by representatives of each level of government designated to develop execu-tive functions regarding health. In the national level, it is the Minister of Health; in the state level,the Secretary of State for Health; and, in the local level, the Municipal Health Secretary. SUS man-agers are responsible for the coordination, articulation, negotiation, planning, monitoring, control,evaluation and audit of the health system under their management.
The legislation that established the SUS also laid the foundations of the federal funds trans-fer model for sub-national governments as regards the funding for decentralized health actions andservices. In the national level, funding for health actions and services occurs through the intergovern-mental application and/or transfers of the public funds collected. In the states, the funding systemcomes from their resources as well as from transfers from the federal level. In the municipalities,in addition to their resources, funding depends on federal and state transfers. Municipalities areresponsible for the formulation of the municipal health care policy, planning, complementary regu-lation, direct control and provision of direct and health care services or through referrals to othertowns.
The legislation governing the SUS establishes that fund transfers (fund to fund) occur regularlyand automatically from the National Health Fund (Fundo Nacional de Saude) to the State HealthFunds (Fundos Estaduais de Saude) and Municipal Funds (Fundos Municipais de Saude, FMS).These transfers must comply with various criteria, such as the demographic and epidemiologicalprofile of the population, the characteristics of the health services network, performance in theprevious period of time, the budget of municipal and state funds for health care, investment forecast,and compensation paid to other spheres of government regarding health care.
The several mechanisms and criteria regarding fund transfers to SUS determine di↵erent capabil-ities for the redistribution of resources among states and municipalities. Each transfer mechanism is
3
linked, to a greater or lesser extent, to the installed and production capacity of public and private ser-vices accredited to the existing SUS in a given jurisdiction. According to Lima (2007), this structurehelps to accentuate socioeconomic inequalities in a context of scarce resources for health care and hasshaped the positioning of federal actors as well as cooperation and conflict relationships, stimulatingthe creation of new criteria and mechanisms of redistribution of federal funds since the late 1990s.Due to that, the authors believe that the health care policy is developing its own mechanisms, andthey interact in a specific context, with structural and institutional variables that are di�cult to bechanged by the actors who work in the health care sector.
3 Descriptive Analysis of the Data
The database includes information from 5,569 municipalities, and the findings refer to 2004-2012.This article does not deal with compared minimum areas so as not to lose information relatedto election variables and their resulting impact on the scope of this article. In the regressions,the municipalities created after 2005 have been excluded, as well as the municipalities that haveoriginated them, with a final total of 5,548 municipalities being included in the study.
3.1 Brazilian political scene
The initial analysis aims to describe the political scenario in the reference period. The variablesconcerning the elections that are being assessed are: candidates and winners in municipal and nationalelections, their parties and the number of votes obtained. From this information, it is possible tobuild other variables describing the election process. The base variable of political control in thestudy is a dummy one used to indicate the alignment between the party of the mayor and that of thepresident. The value of 1 is assigned to this variable if the parties are the same, and 0 if otherwise.This strategy was adopted based on the empirical model by Leao, Mello and Ferraz (2012) andVideira and Mattos (2011).
Brazil is a democratic republic with three levels of government, namely: central, regional andlocal. The central government is formed by the President and the National Congress, comprisingthe House of Representatives and the Federal Senate. The regional government has representationin each of the 26 states and the Federal District, which are under the leadership of the Governor andof the Legislative Assembly. In the local level, the public representatives of the people are the Mayor- the largest local authority - and the City Council.
The country has adopted a multi-party system in which the various parties can take leadershipthroughout the territory and in the three levels of government. Governance is ensured only when themost representative member of the executive branch has the administrative support of the majorityof the members in the chambers of the legislative branch. Therefore, there are often coalitionsbetween parties in order to ensure the approval of projects and bills as well as the control over thebureaucratic apparatus available to the executive branch.
It is worth highlighting that there is a di↵erence in the Brazilian electoral calendar regardingthe dispute of positions in the central, regional and local governments, generating an overlappingof electoral cycles between levels. As a consequence, each elected member of government in theexecutive branch serves the equivalent to two mayoral mandates and vice versa. Two election cyclesare analyzed in this article. The first cycle refers to the 2004 municipal elections from 2005 to 2008,while the second one is related to the outcome of the electoral process of 2008, which elected themayors who served between 2009 and 2012. During that time, there was no party change in thecentral government, although there were three democratic electoral processes for the presidentialpost (the 2002, 2006 and 2010 elections), with the Workers’ Party (Partido dos Trabalhadores, PT)being the ruling party.
4
In the period before the 2004 electoral process, 3.28%, or 182 municipalities, were governed bymayors who belonged to the same party as the president elected in 2002. After the closing of theelectoral process, 7.25% (402 municipalities) were administered by mayors aligned with the centralgovernment. In the 2008 election cycle, 9.73% of the municipalities (540) were managed by mayorsaligned with the central government. The 2010 central elections brought little change to the politicallandscape, with a drop of 0.03 percentage points in the total of aligned municipalities.
It is useful to evaluate the level of competitiveness of the electoral process between candidates whowere aligned and those not aligned with the central government. Out of the total of municipalitiesanalyzed, it turns out that in 1902 municipalities, i.e. 34.28% of the sample, the di↵erence of votesbetween aligned and non-aligned candidates in the 2004 elections was 10%. In 968 municipalities, or17.45% of the sample, the di↵erence of votes between those candidates is 5%. For the 2008 electioncycle, considering the di↵erence of votes of up to 10%, 29.16% of the sample is represented, i.e., 1618municipalities. In 892 municipalities, or 16.08%, the di↵erence in votes between the aligned andnon-aligned candidates was up to 5%.
3.2 Health care spending
Financial and budgetary data on health care are captured by the variables Discretionary Transfersof Federal SUS allocated to the Municipality, Transfers of Federal SUS-allocated Funds to the Mu-nicipality (fund to fund transfers, i.e. from the National Health Care Fund to the Municipal HealthCare Fund) and Discretionary Transfers of Capital Resources of SUS allocated to the Municipality.These transferences are handled separately by relevance account to subject, by the celebration ofagreements, transfers of contracts and mainly Fund to Fund transfers.
In addition, we include variables related to general transfers from the federal government tomunicipalities: Discretionary Transfers of the Current Resources, Transfers of Capital Resources andDiscretionary Transfers of Capital Resources of the Federal Government allocated to the Municipality.We focus on these types of federal transfers because their allocation mechanism depends on thesupport of federal government. All data have been taken from a database called FINBRA - Financesof Brazil - which is under the responsibility of the National Treasury (Secretaria do Tesouro Nacional,STN).
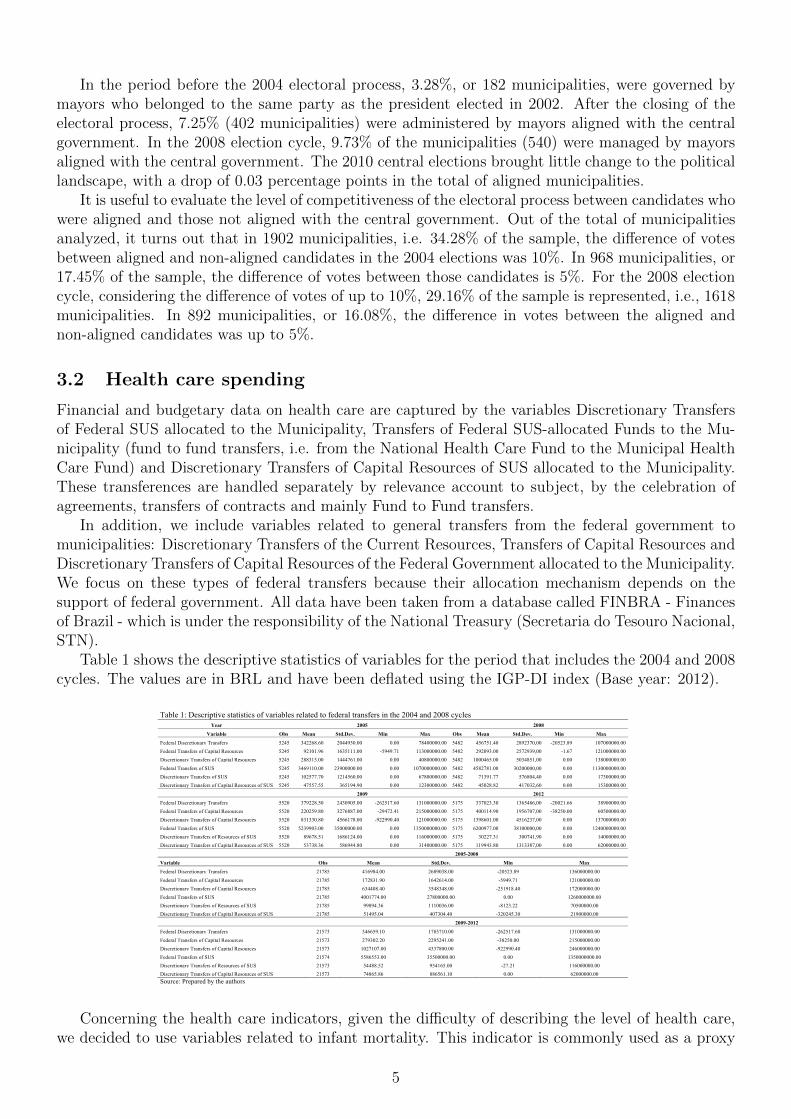
Table 1 shows the descriptive statistics of variables for the period that includes the 2004 and 2008cycles. The values are in BRL and have been deflated using the IGP-DI index (Base year: 2012).
18
Table 1: Descriptive statistics of variables related to federal transfers in the 2004 and 2008 cycles Year 2005 2008
Variable Obs Mean Std.Dev. Min Max Obs Mean Std.Dev. Min Max
Federal Discretionary Transfers 5245 342268.60 2044930.00 0.00 78400000.00 5482 456751.40 2892370,00 -20523.89 107000000.00
Federal Transfers of Capital Resources 5245 92101.96 1635111.00 -5949.71 113000000.00 5482 292093.00 2572939,00 -1.67 121000000.00
Discretionary Transfers of Capital Resources 5245 288313.00 1444761.00 0.00 40800000.00 5482 1000465.00 5034851,00 0.00 138000000.00
Federal Transfers of SUS 5245 3469110.00 23900000.00 0.00 1070000000.00 5482 4582781.00 30200000,00 0.00 1130000000.00
Discretionary Transfers of SUS 5245 102577.70 1214560.00 0.00 67800000.00 5482 71391.77 576804,40 0.00 17300000.00
Discretionary Transfers of Capital Resources of SUS 5245 47557.55 365194.90 0.00 12300000.00 5482 45028.82 417032,60 0.00 15300000.00
2009 2012
Federal Discretionary Transfers 5520 379228.50 2430905.00 -262517.60 131000000.00 5175 337023.30 1365486,00 -20021.66 38900000.00
Federal Transfers of Capital Resources 5520 220259.80 3276887.00 -29472.41 215000000.00 5175 400114.90 1956707,00 -38250.00 60500000.00
Discretionary Transfers of Capital Resources 5520 831330.80 4566178.00 -922990.40 121000000.00 5175 1398601.00 4516237,00 0.00 137000000.00
Federal Transfers of SUS 5520 5239903.00 35000000.00 0.00 1350000000.00 5175 6200977.00 38100000,00 0.00 1240000000.00
Discretionary Transfers of Resources of SUS 5520 89678.51 1686124.00 0.00 116000000.00 5175 30227.31 300741,90 0.00 14000000.00
Discretionary Transfers of Capital Resources of SUS 5520 53738.36 586944.80 0.00 31400000.00 5175 119943.80 1313387,00 0.00 62000000.00 2005-2008
Variable Obs Mean Std.Dev. Min Max
Federal Discretionary Transfers 21785 416984.00 2689038.00 -20523.89 136000000.00
Federal Transfers of Capital Resources 21785 172831.90 1642614.00 -5949.71 121000000.00
Discretionary Transfers of Capital Resources 21785 634408.40 3548348.00 -251918.40 172000000.00
Federal Transfers of SUS 21785 4001774.00 27800000.00 0.00 1260000000.00
Discretionary Transfers of Resources of SUS 21785 99894.36 1110036.00 -8123.22 70500000.00
Discretionary Transfers of Capital Resources of SUS 21785 51495.04 407304.40 -320245.30 21900000.00
2009-2012
Federal Discretionary Transfers 21573 346659.10 1785710.00 -262517.60 131000000.00
Federal Transfers of Capital Resources 21573 279302.20 2295241.00 -38250.00 215000000.00
Discretionary Transfers of Capital Resources 21573 1027107.00 4337800.00 -922990.40 246000000.00
Federal Transfers of SUS 21574 5586553.00 35500000.00 0.00 1350000000.00
Discretionary Transfers of Resources of SUS 21573 54488.52 954165.00 -27.21 116000000.00
Discretionary Transfers of Capital Resources of SUS 21573 74865.86 886561.10 0.00 62000000.00 Source: Prepared by the authors
Concerning the health care indicators, given the di�culty of describing the level of health care,we decided to use variables related to infant mortality. This indicator is commonly used as a proxy
5
to indicate the level of health care and socioeconomic development of populations. There are severalbooks discussing the validity of its use (Leal and Szwarcwald, 1996; Reidpath and Allotey, 2003; andAkachi and Canning, 2009). Among the limitations to its use as a health indicator, these stand out:(a) it reflects an incomplete history of the disease; (b) diseases that weaken, but do not lead to deathare not represented; and (c) deaths are events that express only the maximum severity.
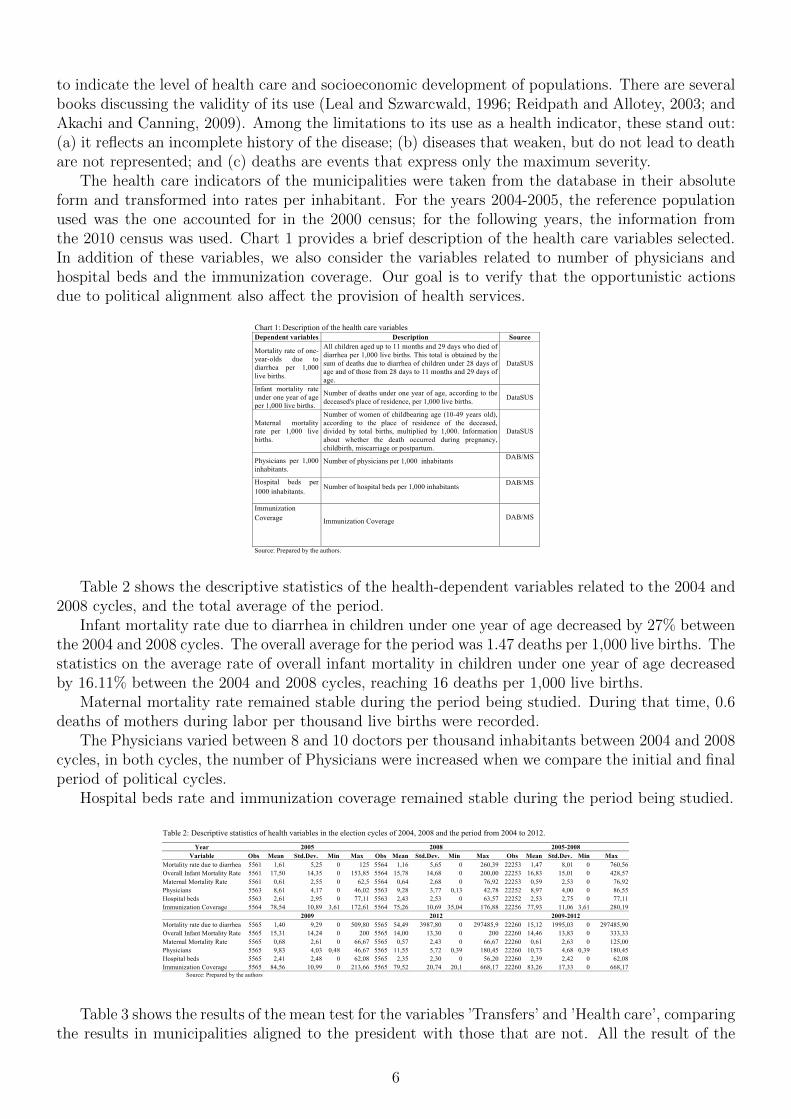
The health care indicators of the municipalities were taken from the database in their absoluteform and transformed into rates per inhabitant. For the years 2004-2005, the reference populationused was the one accounted for in the 2000 census; for the following years, the information fromthe 2010 census was used. Chart 1 provides a brief description of the health care variables selected.In addition of these variables, we also consider the variables related to number of physicians andhospital beds and the immunization coverage. Our goal is to verify that the opportunistic actionsdue to political alignment also a↵ect the provision of health services.
19
Chart 1: Description of the health care variables Dependent variables Description Source
Mortality rate of one-year-olds due to diarrhea per 1,000 live births.
All children aged up to 11 months and 29 days who died of diarrhea per 1,000 live births. This total is obtained by the sum of deaths due to diarrhea of children under 28 days of age and of those from 28 days to 11 months and 29 days of age.
DataSUS
Infant mortality rate under one year of age per 1,000 live births.
Number of deaths under one year of age, according to the deceased's place of residence, per 1,000 live births. DataSUS
Maternal mortality rate per 1,000 live births.
Number of women of childbearing age (10-49 years old), according to the place of residence of the deceased, divided by total births, multiplied by 1,000. Information about whether the death occurred during pregnancy, childbirth, miscarriage or postpartum.
DataSUS
Physicians per 1,000 inhabitants.
Number of physicians per 1,000 inhabitants DAB/MS
Hospital beds per 1000 inhabitants.
Number of hospital beds per 1,000 inhabitants DAB/MS
Immunization Coverage
Immunization Coverage DAB/MS
Source: Prepared by the authors.
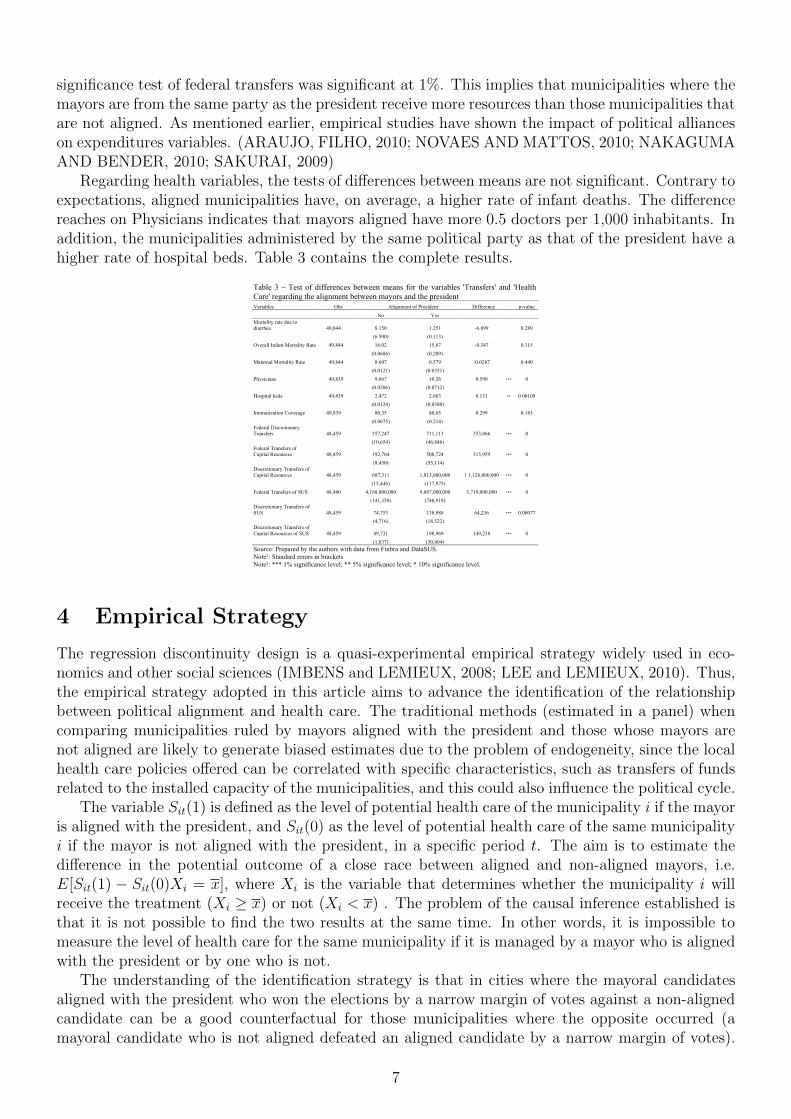
Table 2 shows the descriptive statistics of the health-dependent variables related to the 2004 and2008 cycles, and the total average of the period.
Infant mortality rate due to diarrhea in children under one year of age decreased by 27% betweenthe 2004 and 2008 cycles. The overall average for the period was 1.47 deaths per 1,000 live births. Thestatistics on the average rate of overall infant mortality in children under one year of age decreasedby 16.11% between the 2004 and 2008 cycles, reaching 16 deaths per 1,000 live births.
Maternal mortality rate remained stable during the period being studied. During that time, 0.6deaths of mothers during labor per thousand live births were recorded.
The Physicians varied between 8 and 10 doctors per thousand inhabitants between 2004 and 2008cycles, in both cycles, the number of Physicians were increased when we compare the initial and finalperiod of political cycles.
Hospital beds rate and immunization coverage remained stable during the period being studied.
20
Table 2: Descriptive statistics of health variables in the election cycles of 2004, 2008 and the period from 2004 to 2012.
Year 2005 2008 2005-2008 Variable Obs Mean Std.Dev. Min Max Obs Mean Std.Dev. Min Max Obs Mean Std.Dev. Min Max
Mortality rate due to diarrhea 5561 1,61 5,25 0 125 5564 1,16 5,65 0 260,39 22253 1,47 8,01 0 760,56 Overall Infant Mortality Rate 5561 17,50 14,35 0 153,85 5564 15,78 14,68 0 200,00 22253 16,83 15,01 0 428,57 Maternal Mortality Rate 5561 0,61 2,55 0 62,5 5564 0,64 2,68 0 76,92 22253 0,59 2,53 0 76,92 Physicians 5563 8,61 4,17 0 46,02 5563 9,28 3,77 0,13 42,78 22252 8,97 4,00 0 86,55 Hospital beds 5563 2,61 2,95 0 77,11 5563 2,43 2,53 0 63,57 22252 2,53 2,75 0 77,11 Immunization Coverage 5564 78,54 10,89 3,61 172,61 5564 75,26 10,69 35,04 176,88 22256 77,93 11,06 3,61 280,19
2009 2012 2009-2012
Mortality rate due to diarrhea 5565 1,40 9,29 0 509,80 5565 54,49 3987,80 0 297485,9 22260 15,12 1995,03 0 297485,90 Overall Infant Mortality Rate 5565 15,31 14,24 0 200 5565 14,00 13,30 0 200 22260 14,46 13,83 0 333,33 Maternal Mortality Rate 5565 0,68 2,61 0 66,67 5565 0,57 2,43 0 66,67 22260 0,61 2,63 0 125,00 Physicians 5565 9,83 4,03 0,48 46,67 5565 11,55 5,72 0,39 180,45 22260 10,73 4,68 0,39 180,45 Hospital beds 5565 2,41 2,48 0 62,08 5565 2,35 2,30 0 56,20 22260 2,39 2,42 0 62,08 Immunization Coverage 5565 84,56 10,99 0 213,66 5565 79,52 20,74 20,1 668,17 22260 83,26 17,33 0 668,17
Source: Prepared by the authors
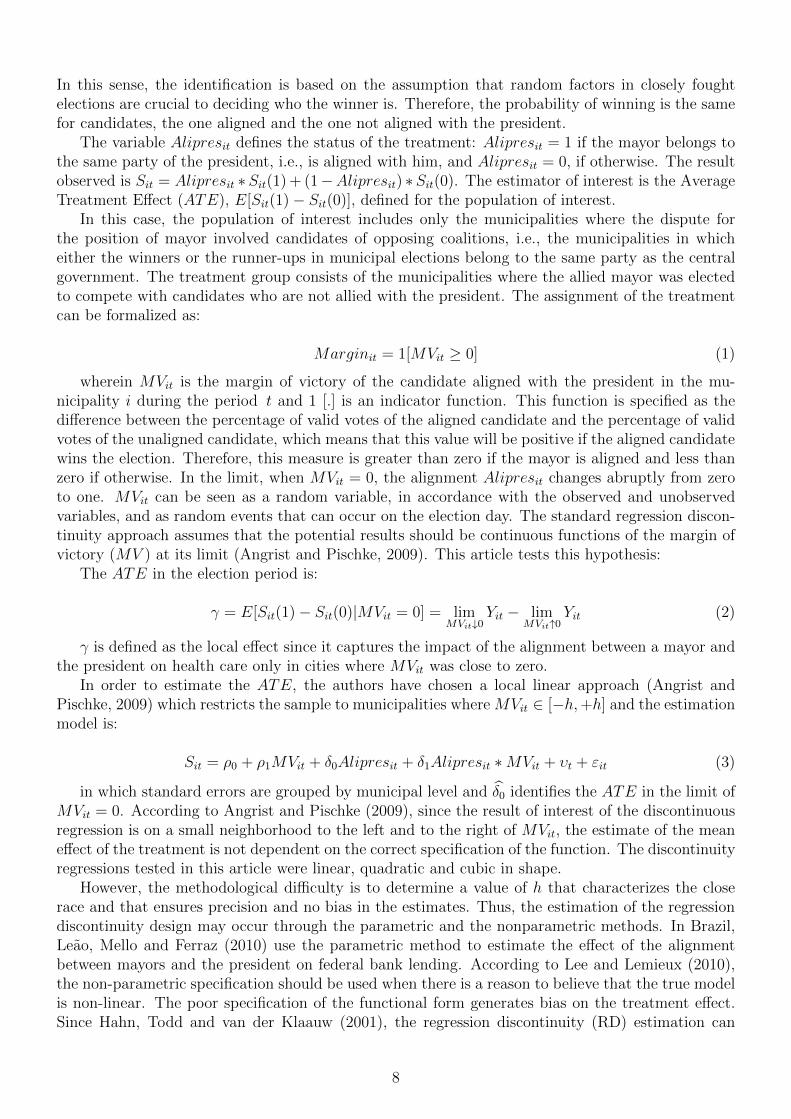
Table 3 shows the results of the mean test for the variables ’Transfers’ and ’Health care’, comparingthe results in municipalities aligned to the president with those that are not. All the result of the
6
significance test of federal transfers was significant at 1%. This implies that municipalities where themayors are from the same party as the president receive more resources than those municipalities thatare not aligned. As mentioned earlier, empirical studies have shown the impact of political allianceson expenditures variables. (ARAUJO, FILHO, 2010; NOVAES AND MATTOS, 2010; NAKAGUMAAND BENDER, 2010; SAKURAI, 2009)
Regarding health variables, the tests of di↵erences between means are not significant. Contrary toexpectations, aligned municipalities have, on average, a higher rate of infant deaths. The di↵erencereaches on Physicians indicates that mayors aligned have more 0.5 doctors per 1,000 inhabitants. Inaddition, the municipalities administered by the same political party as that of the president have ahigher rate of hospital beds. Table 3 contains the complete results.
21
Table 3 – Test of differences between means for the variables 'Transfers' and 'Health Care' regarding the alignment between mayors and the president Variables Obs Alignment of President Difference p-value
No Yes Mortality rate due to diarrhea 49,844 8.150 1.251 -6.899
0.289
(6.500) (0.113)
Overall Infant Mortality Rate 49,844 16.02 15.67 -0.347
0.115
(0.0686) (0.209)
Maternal Mortality Rate 49,844 0.607 0.579 -0.0287
0.440
(0.0121) (0.0351)
Physicians 49,839 9.667 10.26 0.590 *** 0
(0.0206) (0.0712)
Hospital beds 49,839 2.472 2.603 0.131 ** 0.00109
(0.0124) (0.0380)
Immunization Coverage 49,839 80.35 80.65 0.299
0.183
(0.0675) (0.214)
Federal Discretionary Transfers 48,459 357,247 711,113 353,866 *** 0
(10,654) (46,846)
Federal Transfers of Capital Resources 48,459 192,764 508,724 315,959 *** 0
(8,450) (53,114)
Discretionary Transfers of Capital Resources 48,459 687,311 1,813,000,000 11,126,000,000 *** 0
(15,446) (117,975)
Federal Transfers of SUS 48,460 4,168,000,000 9,887,000,000 5,719,000,000 *** 0
(141,358) (740,918)
Discretionary Transfers of SUS 48,459 74,753 138,988 64,236 *** 0.00077
(4,716) (18,522)
Discretionary Transfers of Capital Resources of SUS 48,459 49,731 198,969 149,238 *** 0 (1,837) (30,804) Source: Prepared by the authors with data from Finbra and DataSUS. Note¹: Standard errors in brackets Note²: *** 1% significance level; ** 5% significance level; * 10% significance level.
4 Empirical Strategy
The regression discontinuity design is a quasi-experimental empirical strategy widely used in eco-nomics and other social sciences (IMBENS and LEMIEUX, 2008; LEE and LEMIEUX, 2010). Thus,the empirical strategy adopted in this article aims to advance the identification of the relationshipbetween political alignment and health care. The traditional methods (estimated in a panel) whencomparing municipalities ruled by mayors aligned with the president and those whose mayors arenot aligned are likely to generate biased estimates due to the problem of endogeneity, since the localhealth care policies o↵ered can be correlated with specific characteristics, such as transfers of fundsrelated to the installed capacity of the municipalities, and this could also influence the political cycle.
The variable Sit(1) is defined as the level of potential health care of the municipality i if the mayoris aligned with the president, and Sit(0) as the level of potential health care of the same municipalityi if the mayor is not aligned with the president, in a specific period t. The aim is to estimate thedi↵erence in the potential outcome of a close race between aligned and non-aligned mayors, i.e.E[Sit(1) � Sit(0)Xi = x], where Xi is the variable that determines whether the municipality i willreceive the treatment (Xi � x) or not (Xi < x) . The problem of the causal inference established isthat it is not possible to find the two results at the same time. In other words, it is impossible tomeasure the level of health care for the same municipality if it is managed by a mayor who is alignedwith the president or by one who is not.
The understanding of the identification strategy is that in cities where the mayoral candidatesaligned with the president who won the elections by a narrow margin of votes against a non-alignedcandidate can be a good counterfactual for those municipalities where the opposite occurred (amayoral candidate who is not aligned defeated an aligned candidate by a narrow margin of votes).
7
In this sense, the identification is based on the assumption that random factors in closely foughtelections are crucial to deciding who the winner is. Therefore, the probability of winning is the samefor candidates, the one aligned and the one not aligned with the president.
The variable Alipresit defines the status of the treatment: Alipresit = 1 if the mayor belongs tothe same party of the president, i.e., is aligned with him, and Alipresit = 0, if otherwise. The resultobserved is Sit = Alipresit ⇤Sit(1) + (1�Alipresit) ⇤Sit(0). The estimator of interest is the AverageTreatment E↵ect (ATE), E[Sit(1)� Sit(0)], defined for the population of interest.
In this case, the population of interest includes only the municipalities where the dispute forthe position of mayor involved candidates of opposing coalitions, i.e., the municipalities in whicheither the winners or the runner-ups in municipal elections belong to the same party as the centralgovernment. The treatment group consists of the municipalities where the allied mayor was electedto compete with candidates who are not allied with the president. The assignment of the treatmentcan be formalized as:
Marginit = 1[MVit � 0] (1)
wherein MVit is the margin of victory of the candidate aligned with the president in the mu-nicipality i during the period t and 1 [.] is an indicator function. This function is specified as thedi↵erence between the percentage of valid votes of the aligned candidate and the percentage of validvotes of the unaligned candidate, which means that this value will be positive if the aligned candidatewins the election. Therefore, this measure is greater than zero if the mayor is aligned and less thanzero if otherwise. In the limit, when MVit = 0, the alignment Alipresit changes abruptly from zeroto one. MVit can be seen as a random variable, in accordance with the observed and unobservedvariables, and as random events that can occur on the election day. The standard regression discon-tinuity approach assumes that the potential results should be continuous functions of the margin ofvictory (MV ) at its limit (Angrist and Pischke, 2009). This article tests this hypothesis:
The ATE in the election period is:
� = E[Sit(1)� Sit(0)|MVit = 0] = limMVit#0
Yit � limMVit"0
Yit (2)
� is defined as the local e↵ect since it captures the impact of the alignment between a mayor andthe president on health care only in cities where MVit was close to zero.
In order to estimate the ATE, the authors have chosen a local linear approach (Angrist andPischke, 2009) which restricts the sample to municipalities whereMVit 2 [�h,+h] and the estimationmodel is:
Sit = ⇢0 + ⇢1MVit + �0Alipresit + �1Alipresit ⇤MVit + �t + "it (3)
in which standard errors are grouped by municipal level and b�0 identifies the ATE in the limit ofMVit = 0. According to Angrist and Pischke (2009), since the result of interest of the discontinuousregression is on a small neighborhood to the left and to the right of MVit, the estimate of the meane↵ect of the treatment is not dependent on the correct specification of the function. The discontinuityregressions tested in this article were linear, quadratic and cubic in shape.
However, the methodological di�culty is to determine a value of h that characterizes the closerace and that ensures precision and no bias in the estimates. Thus, the estimation of the regressiondiscontinuity design may occur through the parametric and the nonparametric methods. In Brazil,Leao, Mello and Ferraz (2010) use the parametric method to estimate the e↵ect of the alignmentbetween mayors and the president on federal bank lending. According to Lee and Lemieux (2010),the non-parametric specification should be used when there is a reason to believe that the true modelis non-linear. The poor specification of the functional form generates bias on the treatment e↵ect.Since Hahn, Todd and van der Klaauw (2001), the regression discontinuity (RD) estimation can
8
generally be interpreted as an RD-related estimation problem.The conventional non-parametric estimators based on the kernel method depend on the choice of
bandwidth. Calonico, Cattaneo and Titiunik (2014) argue that even the estimators of the existingbandwidth selectors (Imbens and Kalyanaram, 2012; Fan and Gijbels, 1996), based on the balancingof the squared bias and on the variance of the regression discontinuity estimator tend determinewider bandwidths to ensure the validity of the distribution. Thus, these bandwidth selectors leadto considerable bias in the approximations of the distribution of the estimator. As a result, theconfidence intervals estimated by the RD treatment e↵ect may be biased, having empirical coveragewell below its nominal target. In other words, the conventional confidence intervals can substantiallyover-reject the null hypothesis for the absence of the treatment-e↵ect.
The alternative proposed by Calonico, Cattaneo and Titiunik (2014) is to build more robustconfidence intervals, starting with the treatment-e↵ect estimators of the regression discontinuityfor bias correction. Intuitively, these estimators are not a good fit for small samples because theestimated bias (bn) introduces an additional variability in b⌧ bcp,q(hn, bn) = b⌧p(hn) � hp+1
nbBn,p,q. This
variability is not accounted for when forming confidence intervals. This proposal incorporates anasymptotic approach for which is determined by observing that b⌧ bcp,q(hn, bn) which is determined byobserving that:
pnhn{b⌧ bcp,q(hn � bn)� ⌧} =
pnhn(b⌧ bcp,q(hn)� ⌧ � hp=1
n { bBn,p,q � Bn,p} (4)
In which:
pnhn(b⌧ bcp,q(hn)� ⌧ � hp=1
n { bBn,p,q}�!d N(O, Vp) (5)
pnhnh
p+1n { bBn,p,q � Bn,p}�!d N{O, Vp+1,q (⇢)} (6)
determines appropriate regularity conditions to ensure that:
hn
bn! ⇢ 2 (0,1) (7)
Vp,q(⇢) can be interpreted as the contribution of bias correction to the variability of the biascorrection estimator. Under weaker constraints, the authors demonstrate that
pnhn{b⌧ bcp,q(hn � bn)� ⌧} ! N{0, V b,c
p,q (⇢)} (8)
Where V b,cp,q (⇢) is the asymptotic variance estimator of the corrected bias, which is di↵erent from
the usual formula,Vp. The variance formula is built to account for the variability of both estimators
of treatment e↵ect in the RD: the original one, b⌧p(h) and the one with bias correction, bBn,p,q.Overall, the robust confidence interval for the correction of bias proposed by Calonico, Cattaneo
and Titunik (2014) can be defined as:
CIrbcSRD(hn,bn) = (b⌧SRD(hn � hp+1n Bn,p.q ± ��1
1�↵2
qVSRD(hn) + Cbc
SRD(hn, bn) (9)
5 Results
The results are presented by political cycle. The section 5.1 refers to the results of the political cycle2004 and section 5.2 refers to the results of the estimations for the political cycle 2008. The analysisof political cycles was carried out in two stages in order to capture the design of the Brazilian electoralcalendar. Initially, we analyze the first two years of each cycle, the run-up to federal elections. Wethen test the same variables for the final year of each cycle, the run-up to local elections in that electthe mayors of each municipality.
9

According to our identification strategy, we first check for opportunistic actions on the transfer ofcentral government funds to the municipalities aligned. After that, we check if the alignment a↵ect‘sthe provision of health care services, as part of the discretionary resources not linked to SUS can beused to promote actions within the system. Finally, in order to fulfill the objectives proposed by thispaper, we analyze the e↵ects of alignment on health indicators, represented by mortality rates.
5.1 Political Cycle of 2004
5.1.1 Federal Transfers and Transferences of SUS funds
Regarding the election period after the 2004 cycle, it was found that there was discontinuity forthe parametric approach in discretionary Transfers of Capital Resources. The e↵ect of alignmenton this variable expressed in logarithmic form is about 333.33%. The figure 1 illustrates this point.In the linear specification of the polynomial, municipalities where the mayors are aligned with thepresident receive on average 15.71% more than those who lost close races in the relation of variableldt1. For ldt4, the e↵ect of political alignment is about 13.28%. In the non-parametric approaches,these e↵ects cannot be identified.
For nonparametric approach the e↵ect of alignment between the president and mayors on discre-tionary Transfers of Federal Government variable have negative signal for conventional and robustmodel. This result is counterintuitive and deserves a deeper analysis in the future.
22
Figure 1: Effect of the political alignment between mayor and president on the logarithm Discretionary Transfers of Capital Resources in the 2004 cycle (2005-2006).
Source: Prepared by de authors Notes: The horizontal axis measures the margin of votes for aligned mayors. The solid line is the
predictive value of the logarithm Discretionary Transfers of Capital Resources estimated on the degree 2 polynomial. The zero point is the threshold for victory (greater than zero) and the defeat of the aligned municipalities (less than zero).
1112
1314
15
-10 -5 0 5 10Margin of victory
Sample average within bin 2th order global polynomial
Effect of Alignment on the Discretionary Transfers of Capital Resources
In the final period of the cycle, when there is the preparation for the upcoming municipal elections,no significant coe�cient was found. The complete results are shown in Table 4 and Table 5.
23
Table 4: Estimates of the political alignment effects on Federal Transfers (in log) in the Political Cycle of 2004 (2005-2006).
Parametric Approach
Linear Quadratic Cubic
Variable Federal Discretionary Transfers
Transfers of Capital
Discretionary Transfers of
Capital
Federal Discretionary
Transfers
Transfers of Capital
Discretionary Transfers of
Capital
Federal Discretionary
Transfers
Transfers of Capital
Discretionary Transfers of
Capital Effect of alignment -0.060 -0.145 1.466*** 1.630 2.855 -1.066 11.102*** Robust Standard Error (0.298) (0.417) (0.339) -1.516 -2.589 -1.420 -3.616 Observations 414 87 274 124 29 98 124 29 98 R-squared 0.267 0.436 0.328 0.494 0.670 0.493 0.513 0.671 0.537
Non Parametric Approach Conventional -1.702** -2.893 0.452 -1.544* -3.827* 0.206 -1.767** -2.065 0.084
(0.851) -1.873 (0.668) (0.798) -2.042 (0.779) (0.876) -3.432 (0.927) Robust -2.010** -3.772* 0.342 -1.808** -3.933 0.094 -1.791* -0.950 0.030
(0.969) -2.090 (0.726) (0.889) -2.447 (0.833) (0.983) -4.389 -1.008 Observations 52 88 101 166 105 167 261 106 190 Conventional Std. Error 0.851 1.873 0.668 0.798 2.042 0.779 0.876 3.432 0.927 Conventional p-value 0.0455 0.122 0.498 0.0530 0.0609 0.792 0.0437 0.547 0.927 Robust p-value 0.0381 0.0711 0.638 0.0421 0.108 0.910 0.0685 0.829 0.976 Order Loc. Poly. (p) 1 1 1 2 2 2 3 3 3 Order Bias (q) 2 2 2 3 3 3 4 4 4 BW Loc. Poly. (h) 1.126 3.878 2.338 2.799 4.318 3.586 4.228 4.433 4.125 BW Bias (b) 2.555 5.702 4.824 4.670 6.406 5.870 5.510 5.633 5.302 Source: Prepared by the authors. Notes: The regressions of the parametric form include the polynomial of the margin of votes and its interaction with the dummy of the alignment with the president. The regression also controls, for state-specific purposes, the year and the value of the dependent variable in the initial year of the cycle. The standard errors in brackets are grouped in clusters of municipalities. Level of significance: ***< 1%, ** <5%, * <10%. The regression discontinuity of the conventional non-parametric kind does not allow for bias correction.
10
24
Table 5: Estimates of the political alignment effects on Federal Transfers of SUS (in log) in the Political Cycle of 2004 (2005-2006).
Parametric Approach Linear Quadratic Cubic
Variable
Federal Transfers of SUS
Discretionary Transfers of
SUS
Discretionary Transfers of Capital Resources of SUS
Federal Transfers of
SUS Discretionary
Transfers of SUS
Discretionary Transfers of Capital Resources of SUS
Federal Transfers of
SUS Discretionary
Transfers of SUS
Discretionary Transfers of
Capital Resources of SUS
Effect of alignment 0.146* 0.471 2.328*** 0.030
0.204 Robust Standard
Error (0.086) (0.678) (0.550) (0.668) (0.644) Observations 866 60 22 286 19 7 286 19 7 R-squared 0.805 0.572 0.928 0.776 0.819 1.000 0.782 0.819 1.000
Non Parametric Approach Conventional 0.210 1.478 1.302 0.379 1.566 1.416 0.418 1.890 1.652
(0.497) -1.034 -1.149 (0.596) -1.218 -1.334 (0.596) -1.296 -1.539
Robust 0.223 1.654 1.340 0.423 1.599 1.569 0.436 1.666 2.022
(0.560) -1.204 -1.353 (0.626) -1.356 -1.522 (0.601) -1.599 -1.670
Observations 342 68 39 379 87 66 397 125 89 Conventional Std. Error 0.497 1.034 1.149 0.596 1.218 1.334 0.596 1.296 1.539 Conventional p-value 0.673 0.153 0.257 0.525 0.198 0.288 0.484 0.145 0.283 Robust p-value 0.691 0.169 0.322 0.499 0.238 0.303 0.468 0.298 0.226 Order Loc. Poly. (p) 1 1 1 2 2 2 3 3 3 Order Bias (q) 2 2 2 3 3 3 4 4 4 BW Loc. Poly. (h) 3.259 3.582 2.868 3.642 4.993 4.613 3.785 6.915 5.847 BW Bias (b) 4.963 6.174 4.751 5.000 7.448 6.145 5.100 8.593 7.996 Source: Prepared by the authors. Notes: The regressions of the parametric form include the polynomial of the margin of votes and its interaction with the dummy of the alignment with the president. The regression also controls, for state-specific purposes, the year and the value of the dependent variable in the initial year of the cycle. The standard errors in brackets are grouped in clusters of municipalities. Level of significance: ***< 1%, ** <5%, * <10%. The regression discontinuity of the conventional non-parametric kind does not allow for bias correction.
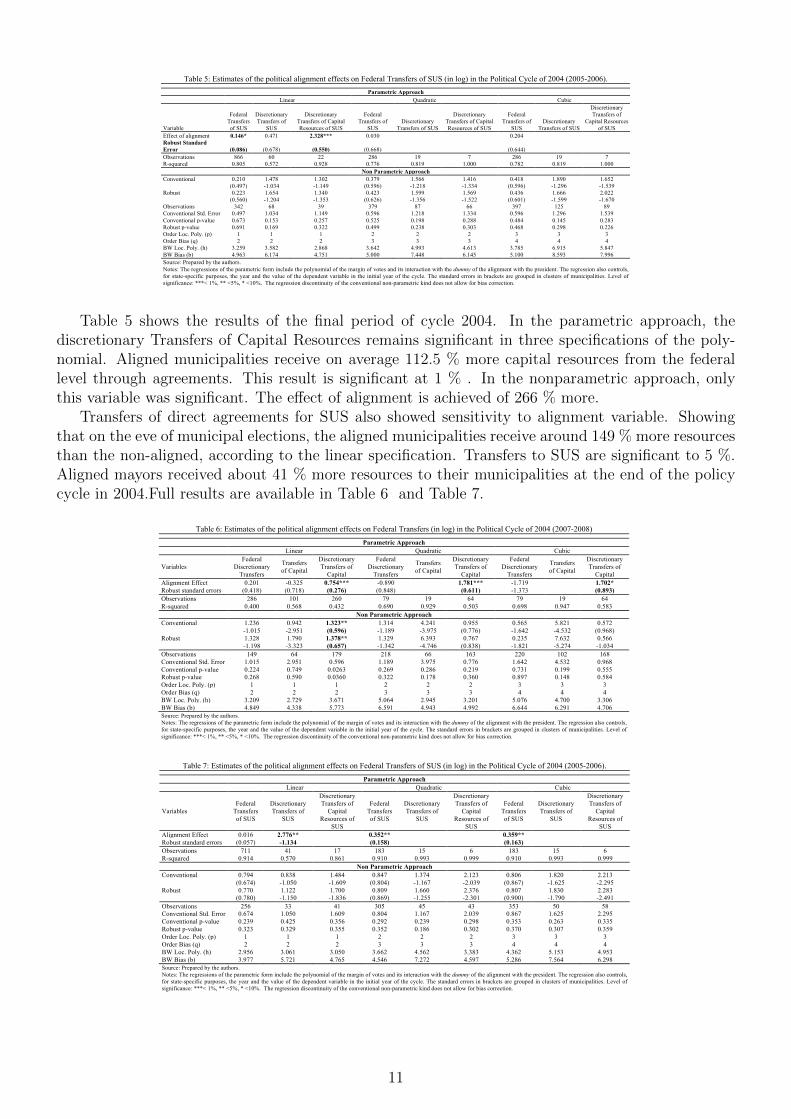
Table 5 shows the results of the final period of cycle 2004. In the parametric approach, thediscretionary Transfers of Capital Resources remains significant in three specifications of the poly-nomial. Aligned municipalities receive on average 112.5 % more capital resources from the federallevel through agreements. This result is significant at 1 % . In the nonparametric approach, onlythis variable was significant. The e↵ect of alignment is achieved of 266 % more.
Transfers of direct agreements for SUS also showed sensitivity to alignment variable. Showingthat on the eve of municipal elections, the aligned municipalities receive around 149 % more resourcesthan the non-aligned, according to the linear specification. Transfers to SUS are significant to 5 %.Aligned mayors received about 41 % more resources to their municipalities at the end of the policycycle in 2004.Full results are available in Table 6 and Table 7.
25
Table 6: Estimates of the political alignment effects on Federal Transfers (in log) in the Political Cycle of 2004 (2007-2008) Parametric Approach
Linear Quadratic Cubic
Variables Federal
Discretionary Transfers
Transfers of Capital
Discretionary Transfers of
Capital
Federal Discretionary
Transfers
Transfers of Capital
Discretionary Transfers of
Capital
Federal Discretionary
Transfers
Transfers of Capital
Discretionary Transfers of
Capital Alignment Effect 0.201 -0.325 0.754*** -0.890 1.781*** -1.719 1.702* Robust standard errors (0.418) (0.718) (0.276) (0.848) (0.611) -1.373 (0.893) Observations 286 101 260 79 19 64 79 19 64 R-squared 0.400 0.568 0.432 0.690 0.929 0.503 0.698 0.947 0.583
Non Parametric Approach Conventional 1.236 0.942 1.323** 1.314 4.241 0.955 0.565 5.821 0.572
-1.015 -2.951 (0.596) -1.189 -3.975 (0.776) -1.642 -4.532 (0.968) Robust 1.328 1.790 1.378** 1.329 6.393 0.767 0.235 7.632 0.566
-1.198 -3.323 (0.657) -1.342 -4.746 (0.838) -1.821 -5.274 -1.034 Observations 149 64 179 218 66 163 220 102 168 Conventional Std. Error 1.015 2.951 0.596 1.189 3.975 0.776 1.642 4.532 0.968 Conventional p-value 0.224 0.749 0.0263 0.269 0.286 0.219 0.731 0.199 0.555 Robust p-value 0.268 0.590 0.0360 0.322 0.178 0.360 0.897 0.148 0.584 Order Loc. Poly. (p) 1 1 1 2 2 2 3 3 3 Order Bias (q) 2 2 2 3 3 3 4 4 4 BW Loc. Poly. (h) 3.209 2.729 3.671 5.064 2.945 3.201 5.076 4.700 3.306 BW Bias (b) 4.849 4.338 5.773 6.591 4.943 4.992 6.644 6.291 4.706 Source: Prepared by the authors. Notes: The regressions of the parametric form include the polynomial of the margin of votes and its interaction with the dummy of the alignment with the president. The regression also controls, for state-specific purposes, the year and the value of the dependent variable in the initial year of the cycle. The standard errors in brackets are grouped in clusters of municipalities. Level of significance: ***< 1%, ** <5%, * <10%. The regression discontinuity of the conventional non-parametric kind does not allow for bias correction.
26
Table 7: Estimates of the political alignment effects on Federal Transfers of SUS (in log) in the Political Cycle of 2004 (2005-2006). Parametric Approach
Linear Quadratic Cubic
Variables Federal
Transfers of SUS
Discretionary Transfers of
SUS
Discretionary Transfers of
Capital Resources of
SUS
Federal Transfers of SUS
Discretionary Transfers of
SUS
Discretionary Transfers of
Capital Resources of
SUS
Federal Transfers of SUS
Discretionary Transfers of
SUS
Discretionary Transfers of
Capital Resources of
SUS Alignment Effect 0.016 2.776** 0.352** 0.359** Robust standard errors (0.057) -1.134 (0.158) (0.163) Observations 711 41 17 183 15 6 183 15 6 R-squared 0.914 0.570 0.861 0.910 0.993 0.999 0.910 0.993 0.999
Non Parametric Approach Conventional 0.794 0.838 1.484 0.847 1.374 2.123 0.806 1.820 2.213
(0.674) -1.050 -1.609 (0.804) -1.167 -2.039 (0.867) -1.625 -2.295 Robust 0.770 1.122 1.700 0.809 1.660 2.376 0.807 1.830 2.283
(0.780) -1.150 -1.836 (0.869) -1.255 -2.301 (0.900) -1.790 -2.491 Observations 256 33 41 305 45 43 353 50 58 Conventional Std. Error 0.674 1.050 1.609 0.804 1.167 2.039 0.867 1.625 2.295 Conventional p-value 0.239 0.425 0.356 0.292 0.239 0.298 0.353 0.263 0.335 Robust p-value 0.323 0.329 0.355 0.352 0.186 0.302 0.370 0.307 0.359 Order Loc. Poly. (p) 1 1 1 2 2 2 3 3 3 Order Bias (q) 2 2 2 3 3 3 4 4 4 BW Loc. Poly. (h) 2.956 3.061 3.050 3.662 4.562 3.383 4.362 5.153 4.953 BW Bias (b) 3.977 5.721 4.765 4.546 7.272 4.597 5.286 7.564 6.298 Source: Prepared by the authors. Notes: The regressions of the parametric form include the polynomial of the margin of votes and its interaction with the dummy of the alignment with the president. The regression also controls, for state-specific purposes, the year and the value of the dependent variable in the initial year of the cycle. The standard errors in brackets are grouped in clusters of municipalities. Level of significance: ***< 1%, ** <5%, * <10%. The regression discontinuity of the conventional non-parametric kind does not allow for bias correction.
11

5.1.2 Health Care Services Provision
Once found evidence of opportunistic actions on the transfer of federal funds to municipalities thatbelong to the same party as the president, intends to verify if the political alignment a↵ects theprovision of services to the population. As health services o↵er proxy variables were used, numberof physicians and hospital beds per 1,000 inhabitants and Immunization Coverage.
In relation to the initial period of the cycle 2004, it appears that only the variable Immuniza-tion Coverage presents significant result in the 10% significance level. The Immunization Coveragebetween aligned municipalities is on average 1.11% higher, in parametric approach with linear spec-ification. In nonparametric approach the sensitivity of the data improves.
The variable Physicians indicates that on average the aligned municipalities have 2-3 more doctorsper thousand inhabitants than the non-aligned to the central government. This result was identifiedin three specifications of the polynomial by the conventional method. The Figure 2 illustrates thesedi↵erences. In the estimation method for robust confidence intervals, the linear specification of thepolynomial does not detect di↵erences between aligned and unaligned.
27
Figure 2: Effect of the political alignment between mayor and president on the number of the physicians per 1,000 inhabitants in the 2004 cycle (2005-2006).
Source: Prepared by de authors Notes: The horizontal axis measures the margin of votes for aligned mayors. The solid line is the predictive value of number of the physicians per 1,000 inhabitants estimated on the degree 3 polynomial. The zero point is the threshold for victory (greater than zero) and the defeat of the aligned municipalities (less than zero).
510
15
-10 -5 0 5 10Margin of victory
Sample average within bin 3th order global polynomial
Effect of Alignment on the number of Physicians per 1,000 inhabitants
[
Although for the nonparametric approach, the Immunization Coverage has indicated there e↵ectbetween the political alignment and the provision of this service, the signal e↵ect is negative. Thisresult suggests that there is some disadvantage in o↵ering this service to the population located inaligned municipalities.
The variable Hospital beds is significant by nonparametric approach by the two methods in theestimation of confidence intervals, on the quadratic and cubic specification of the polynomial. Theresults indicate that the aligned municipalities have on average 3 to 4 hospital beds more than themunicipalities not aligned to the central government, with 5% significance level.
At the end of the 2004 election cycle, it appears that the e↵ect of political alignment for thehospital beds per 1,000 inhabitants was significant for the parametric approach to quadratic and cubicspecifications of the polynomial. However, the signal e↵ect is negative and the value of the e↵ect isaround 0.5%. The same happens with the doctor per thousand inhabitants. In the nonparametricapproach, the sign of the e↵ect of political alignment on the Immunization Coverage is ambiguous;positive is presented only for the cubic and negative specification for other specifications.
The e↵ect of alignment between mayors and president for Hospital beds at the end of the cyclein 2004 is expected, indicating that aligned municipalities have on average 4 hospital beds more perthousand that the non-aligned. All results can be found in the tables 8 and 9.
12
28
Table 8: Estimates of the effect of political alignment on health care service provision in the 2004 political cycle (2005-2006).
Parametric Approach Linear Quadratic Cubic Variable Physicians Hospital beds Immunization Coverage Physicians Hospital beds Immunization Coverage Physicians Hospital beds Immunization Coverage Effect of alignment -0.037 0.016 1.117* -0.270 0.055 -0.646 -0.478 0.068 0.512 Robust Standard Error (0.131) (0.038) (0.662) (0.331) (0.043) (1.498) (0.324) (0.052) (1.679) Observations 1,086 1,086 1,086 357 357 357 357 357 357 R-squared 0.900 0.991 0.646 0.911 0.985 0.703 0.911 0.985 0.706
Non Parametric Approach Conventional 1.927* -0.705 -4.933** 3.466** 3.551** -5.380* 3.701** 3.881** -5.303
(1.131) (0.977) (2.434) (1.607) (1.796) (3.221) (1.758) (1.774) (3.770)
Robust 2.049 -0.667 -5.063* 3.758** 4.089** -5.799 4.062** 4.450** -5.591 (1.275) (1.069) (2.757) (1.758) (2.003) (3.571) (1.877) (1.951) (4.153) Observations 384 446 281 346 240 334 544 396 446 Conventional Std. Error 1.131 0.977 2.434 1.607 1.796 3.221 1.758 1.774 3.770 Conventional p-value 0.0884 0.471 0.0427 0.0310 0.0481 0.0948 0.0353 0.0286 0.160 Robust p-value 0.108 0.533 0.0663 0.0325 0.0413 0.104 0.0304 0.0225 0.178 Order Loc. Poly. (p) 1 1 1 2 2 2 3 3 3 Order Bias (q) 2 2 2 3 3 3 4 4 4 BW Loc. Poly. (h) 3.486 3.993 2.549 3.151 2.172 3.051 4.835 3.574 3.998 BW Bias (b) 6.167 5.716 4.459 5.048 3.717 4.617 6.701 5.332 5.446 Source: Prepared by the authors. Notes: The regressions of the parametric form include the polynomial of the margin of votes and its interaction with the dummy of the alignment with the president. The regression also controls, for state-specific purposes, the year and the value of the dependent variable in the initial year of the cycle. The standard errors in brackets are grouped in clusters of municipalities. Level of significance: ***< 1%, ** <5%, * <10%. The regression discontinuity of the conventional non-parametric kind does not allow for bias correction.
29
Table 9: Estimates of the effect of political alignment on health care service provision in the 2004 political cycle (2007-2008).
Parametric Approach Linear Quadratic Cubic Variable Physicians Hospital beds Immunization Coverage Physicians Hospital beds Immunization Coverage Physicians Hospital beds Immunization Coverage Effect of alignment -0.850** 0.189 -0.255 -0.520 -0.558** -3.545 -1.370 -0.579* -4.493 Robust Standard Error (0.386) (0.145) (0.939) (0.825) (0.215) (2.695) (1.082) (0.296) (3.488) Observations 808 808 808 211 211 211 211 211 211 R-squared 0.575 0.933 0.458 0.494 0.891 0.477 0.509 0.895 0.482
Non Parametric Approach Conventional -0.116 -0.820 -4.799 0.099 4.456** -5.904* 0.368 4.049* -7.498**
(1.272) (1.207) (2.964) (1.551) (2.169) (3.370) (1.941) (2.165) (3.615)
Robust 0.039 -0.608 -6.204* 0.113 5.098** -6.385* 0.251 4.545* -7.934** (1.440) (1.335) (3.296) (1.759) (2.433) (3.785) (2.137) (2.562) (3.925) Observations 211 340 146 290 201 234 318 314 328 Conventional Std. Error 1.272 1.207 2.964 1.551 2.169 3.370 1.941 2.165 3.615 Conventional p-value 0.927 0.497 0.105 0.949 0.0399 0.0798 0.850 0.0614 0.0381 Robust p-value 0.978 0.649 0.0598 0.949 0.0362 0.0916 0.907 0.0760 0.0432 Order Loc. Poly. (p) 1 1 1 2 2 2 3 3 3 Order Bias (q) 2 2 2 3 3 3 4 4 4 BW Loc. Poly. (h) 2.328 4.103 1.554 3.240 2.238 2.556 3.733 3.637 3.901 BW Bias (b) 4.068 6.039 2.971 4.674 3.842 3.865 5.033 4.937 5.402 Source: Prepared by the authors. Notes: The regressions of the parametric form include the polynomial of the margin of votes and its interaction with the dummy of the alignment with the president. The regression also controls, for state-specific purposes, the year and the value of the dependent variable in the initial year of the cycle. The standard errors in brackets are grouped in clusters of municipalities. Level of significance: ***< 1%, ** <5%, * <10%. The regression discontinuity of the conventional non-parametric kind does not allow for bias correction.
5.1.3 Health Indicators
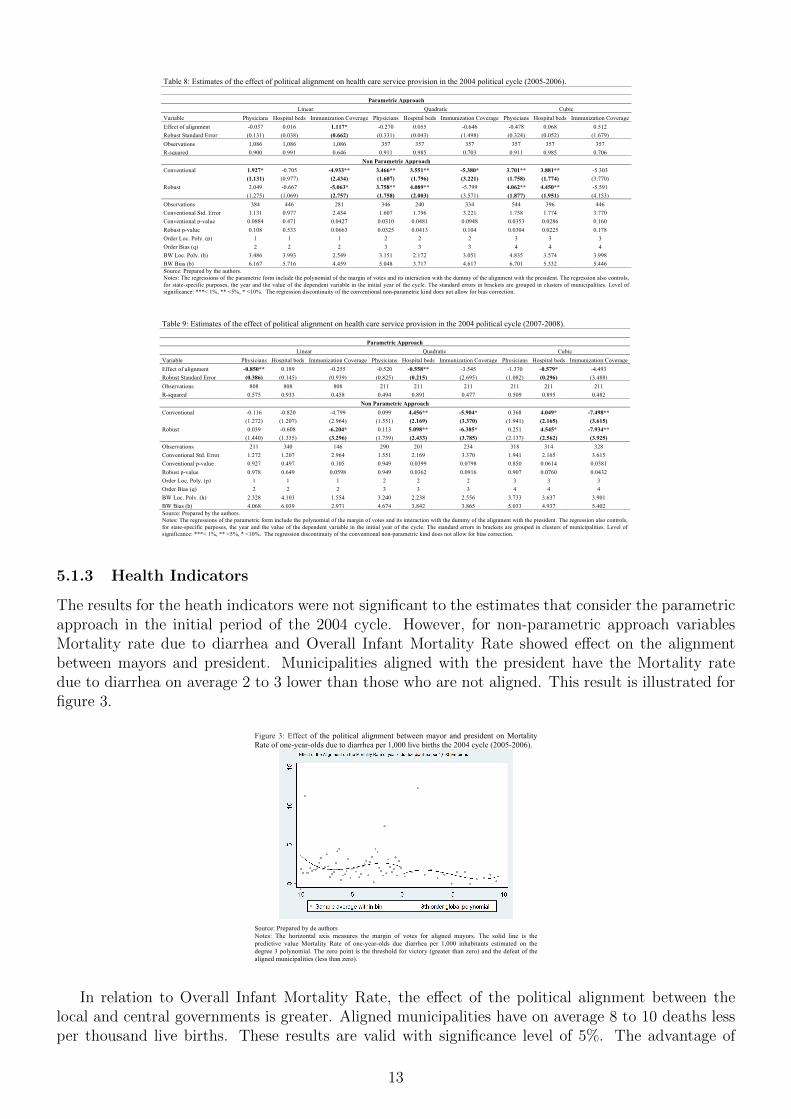
The results for the heath indicators were not significant to the estimates that consider the parametricapproach in the initial period of the 2004 cycle. However, for non-parametric approach variablesMortality rate due to diarrhea and Overall Infant Mortality Rate showed e↵ect on the alignmentbetween mayors and president. Municipalities aligned with the president have the Mortality ratedue to diarrhea on average 2 to 3 lower than those who are not aligned. This result is illustrated forfigure 3.
30
Figure 3: Effect of the political alignment between mayor and president on Mortality Rate of one-year-olds due to diarrhea per 1,000 live births the 2004 cycle (2005-2006).
Source: Prepared by de authors Notes: The horizontal axis measures the margin of votes for aligned mayors. The solid line is the predictive value Mortality Rate of one-year-olds due diarrhea per 1,000 inhabitants estimated on the degree 3 polynomial. The zero point is the threshold for victory (greater than zero) and the defeat of the aligned municipalities (less than zero).
In relation to Overall Infant Mortality Rate, the e↵ect of the political alignment between thelocal and central governments is greater. Aligned municipalities have on average 8 to 10 deaths lessper thousand live births. These results are valid with significance level of 5%. The advantage of
13
the nonparametric approach is to decrease the probability of over-reject the null hypothesis. For thevariable Maternal Mortality Rate , the results were not significant at any of approaches.
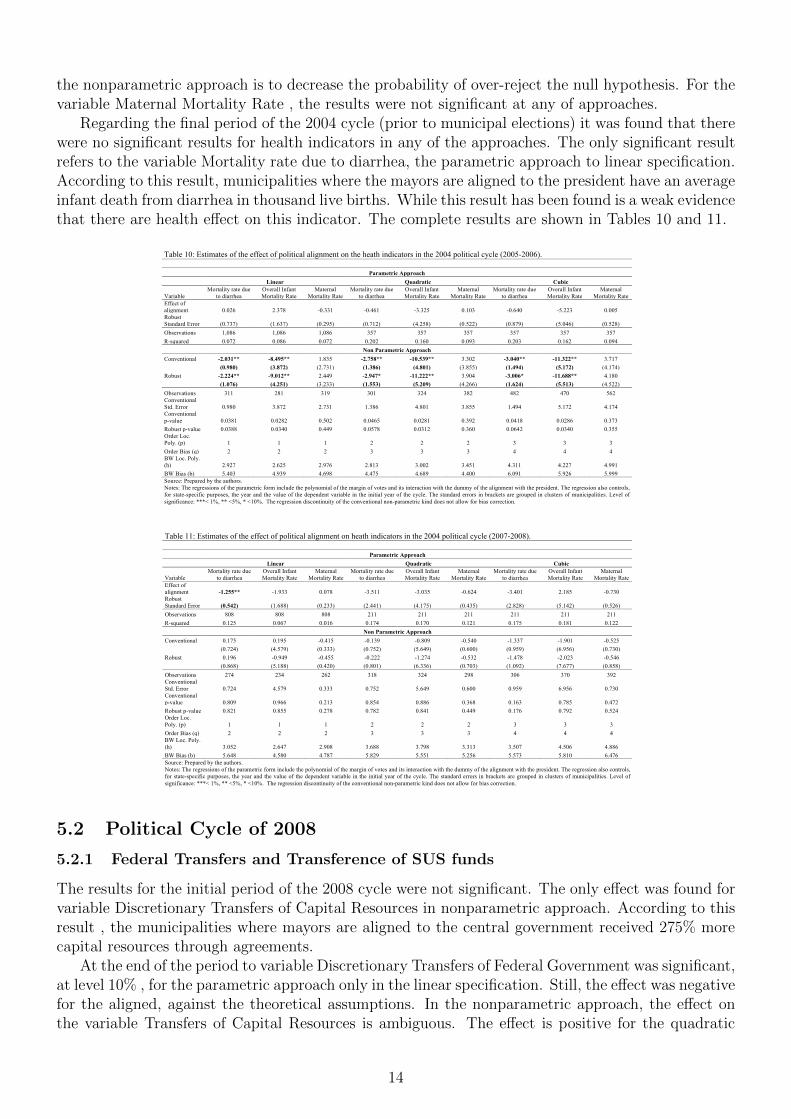
Regarding the final period of the 2004 cycle (prior to municipal elections) it was found that therewere no significant results for health indicators in any of the approaches. The only significant resultrefers to the variable Mortality rate due to diarrhea, the parametric approach to linear specification.According to this result, municipalities where the mayors are aligned to the president have an averageinfant death from diarrhea in thousand live births. While this result has been found is a weak evidencethat there are health e↵ect on this indicator. The complete results are shown in Tables 10 and 11.
31
Table 10: Estimates of the effect of political alignment on the heath indicators in the 2004 political cycle (2005-2006).
Parametric Approach Linear Quadratic Cubic
Variable Mortality rate due
to diarrhea Overall Infant Mortality Rate
Maternal Mortality Rate
Mortality rate due to diarrhea
Overall Infant Mortality Rate
Maternal Mortality Rate
Mortality rate due to diarrhea
Overall Infant Mortality Rate
Maternal Mortality Rate
Effect of alignment 0.026 2.378 -0.331 -0.461 -3.325 0.103 -0.640 -5.223 0.005 Robust Standard Error (0.737) (1.637) (0.295) (0.712) (4.258) (0.522) (0.879) (5.046) (0.528) Observations 1,086 1,086 1,086 357 357 357 357 357 357 R-squared 0.072 0.086 0.072 0.202 0.160 0.093 0.203 0.162 0.094
Non Parametric Approach Conventional -2.031** -8.495** 1.835 -2.758** -10.539** 3.302 -3.040** -11.322** 3.717
(0.980) (3.872) (2.731) (1.386) (4.801) (3.855) (1.494) (5.172) (4.174)
Robust -2.224** -9.012** 2.449 -2.947* -11.222** 3.904 -3.006* -11.688** 4.180 (1.076) (4.251) (3.233) (1.553) (5.209) (4.266) (1.624) (5.513) (4.522) Observations 311 281 319 301 324 382 482 470 562 Conventional Std. Error 0.980 3.872 2.731 1.386 4.801 3.855 1.494 5.172 4.174 Conventional p-value 0.0381 0.0282 0.502 0.0465 0.0281 0.392 0.0418 0.0286 0.373 Robust p-value 0.0388 0.0340 0.449 0.0578 0.0312 0.360 0.0642 0.0340 0.355 Order Loc. Poly. (p) 1 1 1 2 2 2 3 3 3 Order Bias (q) 2 2 2 3 3 3 4 4 4 BW Loc. Poly. (h) 2.927 2.625 2.976 2.813 3.002 3.451 4.311 4.227 4.991 BW Bias (b) 5.403 4.939 4.698 4.475 4.689 4.400 6.091 5.926 5.999 Source: Prepared by the authors. Notes: The regressions of the parametric form include the polynomial of the margin of votes and its interaction with the dummy of the alignment with the president. The regression also controls, for state-specific purposes, the year and the value of the dependent variable in the initial year of the cycle. The standard errors in brackets are grouped in clusters of municipalities. Level of significance: ***< 1%, ** <5%, * <10%. The regression discontinuity of the conventional non-parametric kind does not allow for bias correction.
32
Table 11: Estimates of the effect of political alignment on heath indicators in the 2004 political cycle (2007-2008).
Parametric Approach Linear Quadratic Cubic
Variable Mortality rate due
to diarrhea Overall Infant Mortality Rate
Maternal Mortality Rate
Mortality rate due to diarrhea
Overall Infant Mortality Rate
Maternal Mortality Rate
Mortality rate due to diarrhea
Overall Infant Mortality Rate
Maternal Mortality Rate
Effect of alignment -1.255** -1.933 0.078 -3.511 -3.035 -0.624 -3.401 2.185 -0.730 Robust Standard Error (0.542) (1.688) (0.233) (2.441) (4.175) (0.435) (2.828) (5.142) (0.526) Observations 808 808 808 211 211 211 211 211 211 R-squared 0.125 0.067 0.016 0.174 0.170 0.121 0.175 0.181 0.122
Non Parametric Approach Conventional 0.175 0.195 -0.415 -0.139 -0.809 -0.540 -1.337 -1.901 -0.525
(0.724) (4.579) (0.333) (0.752) (5.649) (0.600) (0.959) (6.956) (0.730)
Robust 0.196 -0.949 -0.455 -0.222 -1.274 -0.532 -1.478 -2.023 -0.546 (0.868) (5.188) (0.420) (0.801) (6.336) (0.703) (1.092) (7.677) (0.858) Observations 274 234 262 318 324 298 306 370 392 Conventional Std. Error 0.724 4.579 0.333 0.752 5.649 0.600 0.959 6.956 0.730 Conventional p-value 0.809 0.966 0.213 0.854 0.886 0.368 0.163 0.785 0.472 Robust p-value 0.821 0.855 0.278 0.782 0.841 0.449 0.176 0.792 0.524 Order Loc. Poly. (p) 1 1 1 2 2 2 3 3 3 Order Bias (q) 2 2 2 3 3 3 4 4 4 BW Loc. Poly. (h) 3.052 2.647 2.908 3.688 3.798 3.313 3.507 4.506 4.886 BW Bias (b) 5.648 4.580 4.787 5.829 5.551 5.256 5.573 5.810 6.476 Source: Prepared by the authors. Notes: The regressions of the parametric form include the polynomial of the margin of votes and its interaction with the dummy of the alignment with the president. The regression also controls, for state-specific purposes, the year and the value of the dependent variable in the initial year of the cycle. The standard errors in brackets are grouped in clusters of municipalities. Level of significance: ***< 1%, ** <5%, * <10%. The regression discontinuity of the conventional non-parametric kind does not allow for bias correction.
5.2 Political Cycle of 2008
5.2.1 Federal Transfers and Transference of SUS funds
The results for the initial period of the 2008 cycle were not significant. The only e↵ect was found forvariable Discretionary Transfers of Capital Resources in nonparametric approach. According to thisresult , the municipalities where mayors are aligned to the central government received 275% morecapital resources through agreements.
At the end of the period to variable Discretionary Transfers of Federal Government was significant,at level 10% , for the parametric approach only in the linear specification. Still, the e↵ect was negativefor the aligned, against the theoretical assumptions. In the nonparametric approach, the e↵ect onthe variable Transfers of Capital Resources is ambiguous. The e↵ect is positive for the quadratic
14

specification, about 520 % more , with a significance of 10 %, and negative for the cubic polynomialspecification , around 349 % less. All results can be found in tables 12 to 15.
33
Table 12: Estimates of the effect of political alignment on federal transfers (in log) in the 2008 political cycle (2009-2010). Parametric Approach
Linear Quadratic Cubic
Variables Federal
Discretionary Transfers
Transfers of Capital
Discretionary Transfers of
Capital
Federal Discretionary
Transfers
Transfers of Capital
Discretionary Transfers of
Capital
Federal Discretionary
Transfers
Transfers of Capital
Discretionary Transfers of
Capital Effect of alignment -0.306 0.112 0.260 -0.484 1.226 0.883 0.104 -2.586 0.819 Robust Standard Error (0.428) (0.440) (0.242) -1.055 -3.496 (0.813) -1.199 -4.667 -1.126 Observations 325 112 419 114 26 129 114 26 129 R-squared 0.194 0.549 0.218 0.310 0.865 0.286 0.342 0.874 0.289
Non Parametric Approach Conventional 1.236 0.942 1.323** 1.314 4.241 0.955 0.565 5.821 0.572
-1.015 -2.951 (0.596) -1.189 -3.975 (0.776) -1.642 -4.532 (0.968) Robust 1.328 1.790 1.378** 1.329 6.393 0.767 0.235 7.632 0.566
-1.198 -3.323 (0.657) -1.342 -4.746 (0.838) -1.821 -5.274 -1.034 Observations 149 64 179 218 66 163 220 102 168 Conventional Std. Error 1.015 2.951 0.596 1.189 3.975 0.776 1.642 4.532 0.968 Conventional p-value 0.224 0.749 0.0263 0.269 0.286 0.219 0.731 0.199 0.555 Robust p-value 0.268 0.590 0.0360 0.322 0.178 0.360 0.897 0.148 0.584 Order Loc. Poly. (p) 1 1 1 2 2 2 3 3 3 Order Bias (q) 2 2 2 3 3 3 4 4 4 BW Loc. Poly. (h) 3.209 2.729 3.671 5.064 2.945 3.201 5.076 4.700 3.306 BW Bias (b) 4.849 4.338 5.773 6.591 4.943 4.992 6.644 6.291 4.706 Source: Prepared by the authors. Notes: The regressions of the parametric form include the polynomial of the margin of votes and its interaction with the dummy of the alignment with the president. The regression also controls, for state-specific purposes, the year and the value of the dependent variable in the initial year of the cycle. The standard errors in brackets are grouped in clusters of municipalities. Level of significance: ***< 1%, ** <5%, * <10%. The regression discontinuity of the conventional non-parametric kind does not allow for bias correction.
34
Table 13: Estimates of the political alignment effects on Federal Transfers of SUS (in log) in the Political Cycle of 2004 (2005-2006). Parametric Approach
Linear Quadratic Cubic
Variables Federal
Transfers of SUS
Discretionary Transfers of
SUS
Discretionary Transfers of
Capital Resources of
SUS
Federal Transfers of
SUS
Discretionary Transfers of
SUS
Discretionary Transfers of
Capital Resources of
SUS
Federal Transfers of SUS
Discretionary Transfers of
SUS
Discretionary Transfers of
Capital Resources of
SUS Effect of alignment -0.003 0.739 0.965 0.041 0.139 Robust Standard Error (0.028) (0.861) (0.835) (0.086) (0.102) Observations 786 47 35 263 19 3 263 19 3 R-squared 0.959 0.500 0.445 0.953 0.949 1.000 0.954 0.949 1.000
Non Parametric Approach Conventional 0.794 0.838 1.484 0.847 1.374 2.123 0.806 1.820 2.213
(0.674) -1.050 -1.609 (0.804) -1.167 -2.039 (0.867) -1.625 -2.295 Robust 0.770 1.122 1.700 0.809 1.660 2.376 0.807 1.830 2.283
(0.780) -1.150 -1.836 (0.869) -1.255 -2.301 (0.900) -1.790 -2.491 Observations 256 33 41 305 45 43 353 50 58 Conventional Std. Error 0.674 1.050 1.609 0.804 1.167 2.039 0.867 1.625 2.295 Conventional p-value 0.239 0.425 0.356 0.292 0.239 0.298 0.353 0.263 0.335 Robust p-value 0.323 0.329 0.355 0.352 0.186 0.302 0.370 0.307 0.359 Order Loc. Poly. (p) 1 1 1 2 2 2 3 3 3 Order Bias (q) 2 2 2 3 3 3 4 4 4 BW Loc. Poly. (h) 2.956 3.061 3.050 3.662 4.562 3.383 4.362 5.153 4.953 BW Bias (b) 3.977 5.721 4.765 4.546 7.272 4.597 5.286 7.564 6.298 Source: Prepared by the authors. Notes: The regressions of the parametric form include the polynomial of the margin of votes and its interaction with the dummy of the alignment with the president. The regression also controls, for state-specific purposes, the year and the value of the dependent variable in the initial year of the cycle. The standard errors in brackets are grouped in clusters of municipalities. Level of significance: ***< 1%, ** <5%, * <10%. The regression discontinuity of the conventional non-parametric kind does not allow for bias correction.
35
Table 14: Estimates of the effect of political alignment on the federal transfers in the 2008 political cycle (2011-2012). Parametric Approach
Linear Quadratic Cubic
Variables Federal
Discretionary Transfers
Transfers of Capital
Discretionary Transfers of
Capital
Federal Discretionary
Transfers
Transfers of Capital
Discretionary Transfers of
Capital
Federal Discretionary
Transfers
Transfers of Capital
Discretionary Transfers of
Capital Effect of alignment -0.725* 0.311 0.235 -0.300 -0.350 0.075 -0.503 0.035 -0.069 Robust Standard Error (0.374) (0.472) (0.205) (0.788) (0.821) (0.326) -1.257 (0.974) (0.376) Observations 245 98 424 104 55 173 104 55 173 R-squared 0.326 0.222 0.205 0.483 0.415 0.258 0.485 0.425 0.261
Non Parametric Approach Conventional 0.832 1.379 0.042 1.043 1.825* -1.108 0.998 1.739 -1.500*
(0.668) (0.977) (0.513) -1.213 -1.076 (0.731) -1.572 -1.086 (0.867) Robust 0.926 1.689 0.096 1.066 2.044* -1.312* 0.891 1.876 -1.635*
(0.829) -1.088 (0.599) -1.489 -1.192 (0.773) -1.898 -1.207 (0.926) Observations 137 38 236 131 73 192 156 144 220 Conventional Std. Error 0.668 0.977 0.513 1.213 1.076 0.731 1.572 1.086 0.867 Conventional p-value 0.213 0.158 0.934 0.390 0.0899 0.130 0.526 0.109 0.0836 Robust p-value 0.264 0.121 0.872 0.474 0.0865 0.0897 0.639 0.120 0.0775 Order Loc. Poly. (p) 1 1 1 2 2 2 3 3 3 Order Bias (q) 2 2 2 3 3 3 4 4 4 BW Loc. Poly. (h) 3.660 1.810 3.630 3.447 2.988 2.865 4.243 4.957 3.280 BW Bias (b) 5.878 3.370 5.322 4.492 4.485 4.597 5.014 6.554 4.477 Source: Prepared by the authors. Notes: The regressions of the parametric form include the polynomial of the margin of votes and its interaction with the dummy of the alignment with the president. The regression also controls, for state-specific purposes, the year and the value of the dependent variable in the initial year of the cycle. The standard errors in brackets are grouped in clusters of municipalities. Level of significance: ***< 1%, ** <5%, * <10%. The regression discontinuity of the conventional non-parametric kind does not allow for bias correction.
15
36
Table 15: Estimates of the political alignment effects on Federal Transfers of SUS (in log) in the Political Cycle of 2004 (2005-2006). Parametric Approach
Linear Quadratic Cubic
Variables Federal
Transfers of SUS
Discretionary Transfers of
SUS
Discretionary Transfers of
Capital Resources of
SUS
Federal Transfers of
SUS
Discretionary Transfers of
SUS
Discretionary Transfers of
Capital Resources of
SUS
Federal Transfers of SUS
Discretionary Transfers of
SUS
Discretionary Transfers of
Capital Resources of
SUS Effect of alignment -0.051 0.284 0.509 -0.101 -0.084 Robust Standard Error (0.050) -2.544 (0.812) (0.087) (0.105) Observations 693 26 44 298 13 11 298 13 11 R-squared 0.913 0.771 0.877 0.900 0.942 0.901 0.900 0.942 0.901
Non Parametric Approach Conventional -0.064 0.706 -0.867 -0.230 1.179 -1.138 -0.322 1.287 -1.165
(0.287) -1.187 (0.798) (0.410) -1.712 (0.866) (0.461) -2.095 -1.004 Robust -0.090 1.059 -1.015 -0.329 1.323 -1.187 -0.368 1.156 -1.217
(0.335) -1.392 (0.920) (0.474) -2.085 (0.962) (0.534) -2.541 -1.103 Observations 226 19 43 246 24 87 363 37 106 Conventional Std. Error 0.287 1.187 0.798 0.410 1.712 0.866 0.461 2.095 1.004 Conventional p-value 0.823 0.552 0.277 0.574 0.491 0.189 0.484 0.539 0.246 Robust p-value 0.787 0.447 0.270 0.488 0.526 0.217 0.490 0.649 0.270 Order Loc. Poly. (p) 1 1 1 2 2 2 3 3 3 Order Bias (q) 2 2 2 3 3 3 4 4 4 BW Loc. Poly. (h) 2.854 2.489 2.227 3.101 3.542 4.197 4.544 4.558 5.331 BW Bias (b) 4.650 4.991 4.060 4.455 5.270 6.086 5.769 6.002 7.068 Source: Prepared by the authors. Notes: The regressions of the parametric form include the polynomial of the margin of votes and its interaction with the dummy of the alignment with the president. The regression also controls, for state-specific purposes, the year and the value of the dependent variable in the initial year of the cycle. The standard errors in brackets are grouped in clusters of municipalities. Level of significance: ***< 1%, ** <5%, * <10%. The regression discontinuity of the conventional non-parametric kind does not allow for bias correction. 5.2.2 Heath Care Service Provision
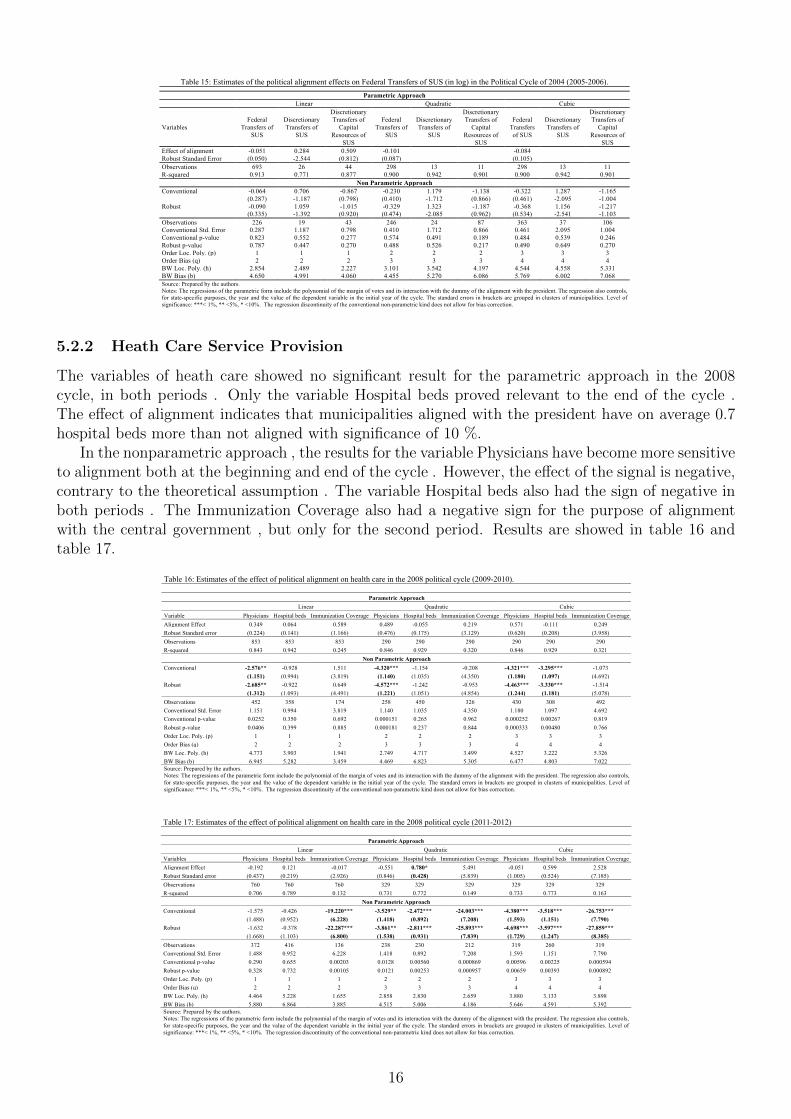
The variables of heath care showed no significant result for the parametric approach in the 2008cycle, in both periods . Only the variable Hospital beds proved relevant to the end of the cycle .The e↵ect of alignment indicates that municipalities aligned with the president have on average 0.7hospital beds more than not aligned with significance of 10 %.
In the nonparametric approach , the results for the variable Physicians have become more sensitiveto alignment both at the beginning and end of the cycle . However, the e↵ect of the signal is negative,contrary to the theoretical assumption . The variable Hospital beds also had the sign of negative inboth periods . The Immunization Coverage also had a negative sign for the purpose of alignmentwith the central government , but only for the second period. Results are showed in table 16 andtable 17.
37
Table 16: Estimates of the effect of political alignment on health care in the 2008 political cycle (2009-2010).
Parametric Approach Linear Quadratic Cubic Variable Physicians Hospital beds Immunization Coverage Physicians Hospital beds Immunization Coverage Physicians Hospital beds Immunization Coverage Alignment Effect 0.349 0.064 0.589 0.489 -0.055 0.219 0.571 -0.111 0.249 Robust Standard error (0.224) (0.141) (1.166) (0.476) (0.175) (3.129) (0.620) (0.208) (3.958) Observations 853 853 853 290 290 290 290 290 290 R-squared 0.843 0.942 0.245 0.846 0.929 0.320 0.846 0.929 0.321
Non Parametric Approach Conventional -2.576** -0.928 1.511 -4.320*** -1.154 -0.208 -4.321*** -3.295*** -1.073
(1.151) (0.994) (3.819) (1.140) (1.035) (4.350) (1.180) (1.097) (4.692)
Robust -2.685** -0.922 0.649 -4.572*** -1.242 -0.953 -4.463*** -3.330*** -1.514
(1.312) (1.093) (4.491) (1.221) (1.051) (4.854) (1.244) (1.181) (5.078)
Observations 452 358 174 258 450 326 430 308 492 Conventional Std. Error 1.151 0.994 3.819 1.140 1.035 4.350 1.180 1.097 4.692 Conventional p-value 0.0252 0.350 0.692 0.000151 0.265 0.962 0.000252 0.00267 0.819 Robust p-value 0.0406 0.399 0.885 0.000181 0.237 0.844 0.000333 0.00480 0.766 Order Loc. Poly. (p) 1 1 1 2 2 2 3 3 3 Order Bias (q) 2 2 2 3 3 3 4 4 4 BW Loc. Poly. (h) 4.773 3.903 1.941 2.749 4.717 3.499 4.527 3.222 5.326 BW Bias (b) 6.945 5.282 3.459 4.469 6.823 5.305 6.477 4.803 7.022 Source: Prepared by the authors. Notes: The regressions of the parametric form include the polynomial of the margin of votes and its interaction with the dummy of the alignment with the president. The regression also controls, for state-specific purposes, the year and the value of the dependent variable in the initial year of the cycle. The standard errors in brackets are grouped in clusters of municipalities. Level of significance: ***< 1%, ** <5%, * <10%. The regression discontinuity of the conventional non-parametric kind does not allow for bias correction.
38
Table 17: Estimates of the effect of political alignment on health care in the 2008 political cycle (2011-2012)
Parametric Approach Linear Quadratic Cubic Variables Physicians Hospital beds Immunization Coverage Physicians Hospital beds Immunization Coverage Physicians Hospital beds Immunization Coverage Alignment Effect -0.192 0.121 -0.017 -0.551 0.780* 5.491 -0.051 0.599 2.528 Robust Standard error (0.437) (0.219) (2.926) (0.846) (0.428) (5.839) (1.005) (0.524) (7.185) Observations 760 760 760 329 329 329 329 329 329 R-squared 0.706 0.789 0.132 0.731 0.772 0.149 0.733 0.773 0.163
Non Parametric Approach Conventional -1.575 -0.426 -19.220*** -3.529** -2.472*** -24.003*** -4.380*** -3.518*** -26.753***
(1.488) (0.952) (6.228) (1.418) (0.892) (7.208) (1.593) (1.151) (7.790)
Robust -1.632 -0.378 -22.287*** -3.861** -2.811*** -25.893*** -4.698*** -3.597*** -27.859***
(1.668) (1.103) (6.800) (1.538) (0.931) (7.839) (1.729) (1.247) (8.385)
Observations 372 416 136 238 230 212 319 260 319 Conventional Std. Error 1.488 0.952 6.228 1.418 0.892 7.208 1.593 1.151 7.790 Conventional p-value 0.290 0.655 0.00203 0.0128 0.00560 0.000869 0.00596 0.00225 0.000594 Robust p-value 0.328 0.732 0.00105 0.0121 0.00253 0.000957 0.00659 0.00393 0.000892 Order Loc. Poly. (p) 1 1 1 2 2 2 3 3 3 Order Bias (q) 2 2 2 3 3 3 4 4 4 BW Loc. Poly. (h) 4.464 5.228 1.655 2.858 2.830 2.659 3.880 3.133 3.898 BW Bias (b) 5.880 6.864 3.885 4.515 5.006 4.186 5.646 4.591 5.392 Source: Prepared by the authors. Notes: The regressions of the parametric form include the polynomial of the margin of votes and its interaction with the dummy of the alignment with the president. The regression also controls, for state-specific purposes, the year and the value of the dependent variable in the initial year of the cycle. The standard errors in brackets are grouped in clusters of municipalities. Level of significance: ***< 1%, ** <5%, * <10%. The regression discontinuity of the conventional non-parametric kind does not allow for bias correction.
16

5.2.3 Health Care Indicators
Table 18 and 19 show the results of political alignment on health indicators. At the end of thecycle 2008, there is a decrease in the Maternal Mortality Rate to municipalities aligned in the nonparametric estimates. On the other side, the e↵ect of alignment on the variable Overall InfantMortality Rate was positive in the initial period of this cycle. The average e↵ect is 11 to 12 deathsper 1,000 live births. In the final period there was no statistical significance for this variable.
For all variables, except the Maternal Mortality rate, there was no significant e↵ect of alignmenton health indicators in the parametric approach.
39
Table 18: Estimates of the effect of political alignment on health indicators in the 2008 political cycle (2009-2010)
Parametric Approach Linear Quadratic Cubic
Variable Mortality rate due
to diarrhea Overall Infant Mortality Rate
Maternal Mortality Rate
Mortality rate due to diarrhea
Overall Infant Mortality Rate
Maternal Mortality Rate
Mortality rate due to diarrhea
Overall Infant Mortality Rate
Maternal Mortality Rate
Alignment Effect -0.257 -2.351 -0.150 0.321 -10.938 0.008 -0.446 -8.935 -0.166 Robust Standard error (0.308) (1.978) (0.198) (0.442) (6.761) (0.318) (1.138) (8.461) (0.515) Observations 853 853 853 290 290 290 290 290 290 R-squared 0.034 0.086 0.036 0.124 0.145 0.047 0.129 0.153 0.048
Non Parametric Approach Conventional 1.185 11.870** -0.139 1.336 12.838** -0.055 1.174 14.958** -0.081
(1.899) (5.371) (0.149) (2.424) (6.255) (0.261) (2.776) (7.284) (0.144)
Robust 1.362 12.886** -0.138 1.238 13.655* -0.032 1.132 15.546* -0.066
(2.352) (6.343) (0.194) (2.744) (7.106) (0.301) (2.910) (7.993) (0.165)
Observations 380 214 162 492 358 282 588 478 312 Conventional Std. Error 1.899 5.371 0.149 2.424 6.255 0.261 2.776 7.284 0.144 Conventional p-value 0.533 0.0271 0.353 0.582 0.0401 0.832 0.672 0.0400 0.571 Robust p-value 0.562 0.0422 0.479 0.652 0.0547 0.917 0.697 0.0518 0.690 Order Loc. Poly. (p) 1 1 1 2 2 2 3 3 3 Order Bias (q) 2 2 2 3 3 3 4 4 4 BW Loc. Poly. (h) 4.092 2.330 1.751 5.349 3.868 2.946 6.224 5.043 3.326 BW Bias (b) 5.534 4.081 4.034 6.390 5.387 4.793 7.893 6.303 5.320 Source: Prepared by the authors. Notes: The regressions of the parametric form include the polynomial of the margin of votes and its interaction with the dummy of the alignment with the president. The regression also controls, for state-specific purposes, the year and the value of the dependent variable in the initial year of the cycle. The standard errors in brackets are grouped in clusters of municipalities. Level of significance: ***< 1%, ** <5%, * <10%. The regression discontinuity of the conventional non-parametric kind does not allow for bias correction.
40
Table 19: Estimates of the effect of political alignment on health indicators in the 2008 political cycle (2011-2012)
Parametric Approach
Variable Mortality rate due
to diarrhea Overall Infant Mortality Rate
Maternal Mortality Rate
Mortality rate due to diarrhea
Overall Infant Mortality Rate
Maternal Mortality Rate
Mortality rate due to diarrhea
Overall Infant Mortality Rate
Maternal Mortality Rate
Alignment Effect 0.167 -0.766 -0.589** -0.142 -2.152 -0.590 -0.290 -1.198 -0.549 Robust Standard error (0.282) (1.626) (0.270) (0.437) (3.314) (0.613) (0.540) (4.455) (0.923) Observations 760 760 760 329 329 329 329 329 329 R-squared 0.079 0.070 0.025 0.081 0.093 0.026 0.091 0.094 0.026
Non Parametric Approach Conventional -0.813 -4.728 -1.271** -1.254 -5.843 -1.267* -0.860 -7.941 -1.232*
(0.687) (5.149) (0.645) (0.840) (5.526) (0.733) (0.996) (6.267) (0.714)
Robust -0.853 -6.592 -1.429* -1.406 -7.415 -1.374* -0.722 -8.946 -1.176
(0.859) (5.979) (0.762) (0.954) (6.280) (0.803) (1.082) (7.073) (0.719)
Observations 156 156 186 319 305 313 350 416 327 Conventional Std. Error 0.687 5.149 0.645 0.840 5.526 0.733 0.996 6.267 0.714 Conventional p-value 0.237 0.358 0.0488 0.136 0.290 0.0838 0.388 0.205 0.0844 Robust p-value 0.321 0.270 0.0608 0.140 0.238 0.0870 0.505 0.206 0.102 Order Loc. Poly. (p) 1 1 1 2 2 2 3 3 3 Order Bias (q) 2 2 2 3 3 3 4 4 4 BW Loc. Poly. (h) 1.975 1.959 2.278 3.894 3.658 3.798 4.205 5.145 4.026 BW Bias (b) 3.131 3.366 3.805 5.785 5.161 4.697 6.216 6.367 5.448 Source: Prepared by the authors. Notes: The regressions of the parametric form include the polynomial of the margin of votes and its interaction with the dummy of the alignment with the president. The regression also controls, for state-specific purposes, the year and the value of the dependent variable in the initial year of the cycle. The standard errors in brackets are grouped in clusters of municipalities. Level of significance: ***< 1%, ** <5%, * <10%. The regression discontinuity of the conventional non-parametric kind does not allow for bias correction.
6 Final Considerations
The aim of this article was to analyze how the political alignments influence health care in Brazilianmunicipalities. The theory of political cycles studies, within a democratic political system, how thepolitical choices of governments a↵ect economic variables. This influence can occur through thepractice of opportunistic actions, in which the decisions of the elected members of government seeksonly to maintaining their power or in which political actions are taken solely to meet the aspirationsof specific groups (seeing this through the ideological-partisan point of view).
This article contributes to the literature on political cycles by adopting a di↵erentiated identifi-cation strategy through the use of the regression discontinuity design for the analysis of the e↵ect ofpolitical alignment on health care in Brazilian municipalities. This estimator, which accommodates
17
the presence of unobserved variable and fixed factors in time, shows that the mayors who are po-litically aligned with the president and who participated in closely fought elections tend to receivemore on federal transfers in the two first two years after the elections.
We found that the main variable that allows opportunistic actions of politicians is the discre-tionary transfer of capital resources between the central and municipal government. The fundsreceived exclusively for the SUS have little sensitivity to political alliances, since they are deter-mined by specific legislation. Thus, according to our analysis, the resources for health in Brazil arenot subject to strong electoral manipulation. However, there is still a channel through which it ispossible to opportunistic allocation of resources.
The estimates found increased health service provision at the beginning of the election cycle of2004, more than in 2008. Regarding health indicators there was low sensitivity of such data to thepolitical alignment. This can be attributed to the fact that these variables are long-term policydependent and are correlated with people’s health habits. Many of the estimates found e↵ects withthe sign opposite to that indicated by the literature, it is believed that this fact may be correlatedwith the extent of policy e↵ects.
The strategy of dividing the electoral cycles in periods allow us to identify di↵erent behaviorsaccording to the electoral calendar. The e↵ects of alignment to the central government are moresensitive in the run-up to presidential election, i.e., the first two years of each cycle. This is strongevidence that the political actions aimed at maintaining power.
The comparison between the estimates of the political cycles of 2004 and 2008 show that the datafor 2004 are more sensitive to alignment than 2008. Among the possible hypotheses, it is consideredthat a possible e↵ect of the financial crisis in 2008 can have contributed to a slight adjustmentof public accounts. The political cycle 2008 includes the period of development of new four-yearplanning (PPA 2008-2011-Plano Prurianual). In addition, this period is no longer possible to re-election, ending his second term. Even with the party’s maintenance of Workers (PT) in the centralgovernment in the years 2011 and 2012, the Brazilian electorate is characterized by personalism.
Among the limitations of the article, these stand out: i) the di�culty of condensing the complexityof the concept of health care into a number of relevant variables. Even if that were possible, therewould still be the problem of data reliability, since the information system is powered by its localhealth care managers, and many of these municipalities are linked to a management ?pact? with thestates where the release of funds is linked to the achievement of goals; ii) the e↵ect of time and thebehavior of individuals regarding health. Some variables are sensitive to short-term policies, whereasothers need investment maturation to be changed. The rulers do not control habits, beliefs, values,and behaviors of individuals regarding their health status.
References
[1] ALESINA, A. Macroeconomic policy in a two-party system as repeated game. Quarterly Journal
of Economics. 102, pp. 651-678, 1987.
[2] ANGRIST, J.D., PISCHKE, J.S. Mostly Harmless Econometrics: an Empiricists Companion.New Jersey:Princeton University Press, 2009.
[3] ARAUJO E FILHO. Ciclos polıtico-economicos: uma analise do comportamento dos gastospublicos nos estados brasileiros no perıodo de 1995 a 2008. XXXVIII Encontro Nacional deEconomia - ANPEC 2010. Available at: http://www.anpec.org.br/encontro201.
[4] BRASIL. Casa Civil. Law number 8080, de 19 de setembro de 1990.
[5] BRASIL. Ministerio da Saude. Portaria n. 2.203, 5 DE NOVEMBRO DE 1996. NORMA OP-ERACIONAL BASICA N.1/1996
18
[6] BRASIL. Ministerio da Saude. Portaria n. 272, de 27 de Fevereiro de 2002. NORMA OPERA-CIONAL DA ASSISTENCIA A SAUDE / SUS - NOAS-SUS 01/02
[7] DataSUS. Informacoes de Saude. Availabe at: http://www2.datasus.gov.br/.
[8] BROLLO, F.; NANNICINI, T. Tying Your Enemy’s Hands in Close Races: The Politics ofFederal Transfers in Brazil. American Political Science Review, Vol. 106, No. 4 (November2012), pp.742, 761.
[9] CALONICO, S; CATTANEO, M.D,; TITIUNIK, R. Robust nonparametric confidence intervalsfor regression-discontinuity designs. Ecometrica, Vol. 82, No. 6 (November, 2014), pp. 2295-2326.
[10] DOWNS, A. An Economic Theory of Political Action in a Democracy. Journal of PoliticalEconomy. Vol. 65, No. 2 (Apr, 1957), pp.135-150.
[11] FERREIRA, I. F. S.; BUGARIN, M. S.. Transferencias voluntarias e ciclo polıtico-orcamentariono federalismo fiscal brasileiro. Rev. Bras. Econ., Rio de Janeiro , v. 61, n. 3, Sept. 2007.
[12] FINBRA – Financas do Brasil – Dados Contabeis dos Municıpios. Available athttp://www.tesouro.fazenda.gov.br/contas-anuaisAcesso em: 20 Jun.2014.
[13] HAHN, J.; Todd, P.; van der KLAAW, W. Identification and Estimation of Treatment E↵ectswith a Regression-Discontinuity Design. Econometrica, Vol. 69, n. 1 (2001): pp. 201–09.
[14] HIBBS, D. Political Parties and Macroeconomic Policy. American Political Science Review,Chicago, vol. 71, p. 1467-1487, 1977.
[15] LEAO, S.; MELLO,J.M.P.; FERRAZ, C. (2012). The E↵ect of Political Alignment on PublicFederal Bank Lending. 35o. Encontro Brasileiro de Econometria. Foz do Iguacu, 2013. SociedadeBrasileira de Econometria.
[16] LEE, D.S; LEMIEUX, T. Regression Descontinuity Designs in Economics. Journal of EconomicLiterature, 2010, Vol. 48 (June), pp:281-355.
[17] LIMA, L.D. de, Conexoes entre federalismo fiscal e financiamento da polıtica de saude do Brasil.Ciencia & Saude Coletiva, 2007; 12(2): 511-522.
[18] MENDES,E.V. As redes de atencao a saude. 2 ed. Brasılia: Organizacao Pan-Americana daSaude, 2011.
[19] MENDES, M.I.F.; CHEIN, F. Oportunismo Eleitoral e Assistencia a Saude: o alinhamentopolıtico gera benefıcio? (working paper).
[20] NAKAGUMA, M. Y.; BENDER, S. Ciclos Polıticos e Resultados Eleitorais: um estudo sobreo comportamento do eleitor brasileiro. Rev. Bras. Econ., v. 64, n. 1, p. 3-24, Rio de Janeiro,jan-mar, 2010.
[21] NORDHAUS, W. The Political Business Cycle. Review of Economic Studies, New York, vol.42, p. 169-190, 1975.
[22] NOVAES, L. MATTOS, E. O efeito da intencao de reeleicao sobre os gastos em saude: Umaanalise com base no modelo de reputacao polıtica. Revista de Economia Polıtica, vol.30, n. 1(117), pp. 140-158, janeiro-marco/2010.
[23] OATES, W. E. 1972. Fiscal federalism. New York: Harcourt Bruce Jovanovich
19
[24] ROGOFF, Kenneth; SIBERT, Anne. Elections and macroeconomic policy cycles. Review of
economic studies. no 55, Pag. 1-16, 1988.
[25] ROGOFF, Kenneth. Equilibrium political budget cycles. The American Economic Review.Vol.80, p.20-36, 1990.
[26] SAKURAI, S. N. Ciclos polıticos nas funcoes orcamentarias dos municıpios brasileiros: umaanalise para o perıodo 1990 - 2005 via dados em painel. Estudos Economicos 39(1), 39-58, 2009
[27] SAKURAI, Sergio Naruhiko; GREMAUD, Amaury Patrick. Political business cycles: evidenciasempıricas para os municıpios paulistas (1989 - 2001). Econ. Apl., Ribeirao Preto, v.11, n. 1, Mar.2007.
[28] TEIXEIRA, M.G. O imperativo do financiamento e da gestao: desafios ao Sistema Unico deSaude. Revista de Direito Sanitario, 4: 85-96, 2003.
20