POLITECNICO DI MILANO Scuola di Ingegneria Industriale … · POLITECNICO DI MILANO Scuola di...
112
POLITECNICO DI MILANO Scuola di Ingegneria Industriale e dell'Informazione Corso di Laurea Magistrale in Ingegneria Elettrica Comparative Investigation on the Properties of Transformer-used High-temperature Resistant Oil and Paper Insulation Materials Relatore: Prof. Giovanni Dotelli Correlatore: Saverio Latorrata Tesi di Laurea Magistrale di: Shen Shuhang Matr. 813546 Anno Accademico 2015-2016
Transcript of POLITECNICO DI MILANO Scuola di Ingegneria Industriale … · POLITECNICO DI MILANO Scuola di...
POLITECNICO DI MILANO
Scuola di Ingegneria Industriale e dell'Informazione
Corso di Laurea Magistrale in Ingegneria Elettrica
Comparative Investigation on the Properties of Transformer-used
High-temperature Resistant Oil and Paper Insulation Materials
Relatore: Prof. Giovanni Dotelli
Correlatore: Saverio Latorrata
Tesi di Laurea Magistrale di:
Shen Shuhang
Matr. 813546
Anno Accademico 2015-2016

Contents
1
Contents
CONTENTS .............................................................................................................................................. 1
ABSTRACT ............................................................................................................................................... 4
1 INTRODUCTION ............................................................................................................................ 8
1.1 RESEARCH BACKGROUND AND SIGNIFICANCE ..................................................................................... 8
1.2 STATE-OF-ART OF HIGH TEMPERATURE RESISTANT INSULATION PAPER ............................................ 9
1.2.1 The Development of High-Temperature Resistant Insulation Paper ......................................... 9
1.2.2 Main Components of High-Temperature Resistant Insulation Paper ...................................... 13
1.3 AGING MECHANISMS OF HIGH TEMPERATURE RESISTANT INSULATION PAPER ................................. 17
1.3.1 Aging Process of High Temperature Resistant Insulation Paper ............................................ 17
1.3.2 Thermal Aging Kinetics of Insulation Material ....................................................................... 26
1.3.3 Prediction of Transformer Lifespan ........................................................................................ 29
1.4 RESEARCH STATUS OF VEGETABLE OIL IMPREGNATED INSULATION SYSTEM ................................... 31
1.4.1 Characteristics of Vegetable Oil.............................................................................................. 31
1.4.2 Thermal Aging Researches on Vegetable Oil Impregnated Insulation Paper ......................... 33
1.5 RESEARCH CONTENT OF THIS THESIS ................................................................................................ 34
2 EXPERIMENTAL DESIGN OF HIGH-TEMPERATURE RESISTANT INSULATION
MATERIALS PROPERTY COMPARISON AND THERMAL AGING .............................................. 36
2.1 MATERIALS AND TEST PARAMETERS OF PROPERTY COMPARISON .................................................... 36
2.2 MATERIALS AND TEST PARAMETERS OF THERMAL AGING ................................................................ 37
2.3 PRECONDITIONING OF PAPER AND OIL MATERIAL ............................................................................. 39
2.3.1 Preconditioning of Paper ........................................................................................................ 39
2.3.2 Preconditioning of Oil ............................................................................................................. 40
2.4 CHAPTER CONCLUSION ...................................................................................................................... 42
3 PHYSICAL AND MECHANICAL PERFORMANCES OF HIGH TEMPERATURE
RESISTANT INSULATION PAPER ..................................................................................................... 43
3.1 BASIS WEIGHT AND DENSITY ............................................................................................................ 43
3.1.1 Test Method ............................................................................................................................. 43
3.1.2 Test Results .............................................................................................................................. 44
Contents
2
3.2 WATER CONTENT .............................................................................................................................. 45
3.2.1 Test Method ............................................................................................................................. 45
3.2.2 Test Results .............................................................................................................................. 47
3.3 TENSILE STRENGTH ........................................................................................................................... 48
3.3.1 Test Method ............................................................................................................................. 48
3.3.2 Test Results .............................................................................................................................. 49
3.4 OIL ABSORPTION ............................................................................................................................... 52
3.4.1 Test Method ............................................................................................................................. 52
3.4.2 Test Results .............................................................................................................................. 53
4 DIELECTRIC PERFORMANCES OF HIGH TEMPERATURE RESISTANT INSULATION
PAPER ..................................................................................................................................................... 58
4.1 PERMITTIVITY AND DISSIPATION FACTOR ......................................................................................... 58
4.1.1 Test Method ............................................................................................................................. 58
4.1.2 Test Results .............................................................................................................................. 60
4.2 BREAKDOWN ELECTRIC FIELD IN AIR ................................................................................................ 68
4.2.1 Test Method ............................................................................................................................. 69
4.2.2 Test Results .............................................................................................................................. 70
4.3 BREAKDOWN ELECTRIC FIELD IN OIL ................................................................................................ 71
4.3.1 Test Method ............................................................................................................................. 71
4.3.2 Test Results .............................................................................................................................. 71
5 PHYSIOCHEMICAL PERFORMANCES OF HIGH TEMPERATURE RESISTANT
INSULATION OIL ................................................................................................................................. 76
5.1 VISCOSITY ......................................................................................................................................... 76
5.1.1 Test Method ............................................................................................................................. 76
5.1.2 Test Results .............................................................................................................................. 77
5.2 TOTAL ACID NUMBER........................................................................................................................ 78
5.2.1 Test Method ............................................................................................................................. 78
5.2.2 Test Results .............................................................................................................................. 79
5.3 WATER CONTENT .............................................................................................................................. 80
5.3.1 Test Method ............................................................................................................................. 80
5.3.2 Test Results .............................................................................................................................. 81
6 RESULTS AND ANALYSIS OF ACCELERATED AGING EXPERIMENT OF HIGH
TEMPERATURE RESISTANT INSULATION SYSTEM .................................................................... 83
6.1 VARIATION IN INSULATION PAPER PERFORMANCE BEFORE AND AFTER AGING ................................ 83
6.1.1 Tensile Strength ....................................................................................................................... 84
Contents
3
6.1.2 Breakdown Voltage.................................................................................................................. 86
6.2 VARIATION IN INSULATION OIL PERFORMANCE BEFORE AND AFTER AGING .................................... 87
6.2.1 Viscosity ................................................................................................................................... 87
6.2.2 Total Acid Number................................................................................................................... 89
6.2.3 DGA ......................................................................................................................................... 90
7 DISCUSSION ON THE AGING PROCESSES AND MECHANISMS OF HIGH
TEMPERATURE RESISTANT INSULATION SYSTEM .................................................................... 98
7.1 ANALYSIS OF AGING MECHANISMS OF PAPER AND OIL MMATERIALS .............................................. 98
7.2 ANALYSIS OF LONGER REMAINING LIFESPAN OF T910 AND DMD PAPER ....................................... 100
8 CONCLUSIONS AND PROSPECTS .......................................................................................... 103
8.1 CONCLUSIONS OF THE THESIS .......................................................................................................... 103
8.2 PROSPECTS OF THE THESIS ............................................................................................................... 104
9 BIBLIOGRAPHY ........................................................................................................................ 105
APPENDIX ............................................................................................................................................ 108
WEIBULL DISTRIBUTION ................................................................................................................ 108
ACKNOWLEDGES .............................................................................................................................. 110
Abstract
4
Abstract
As the distribution transformers experience more severe seasonal overloading in recent
years, the reliability of electricity supply to urban and rural residences is jeopardized.
Therefore, it is necessary to improve transformers’ anti-overload ability. One economical
way is to substitute the insulation system with a higher temperature resistant system. There
are already several kinds of high temperature resistant paper candidates which are needed
to be investigated on their applicability to fluid-filled transformers. Meanwhile, compared
with traditional mineral oil, vegetable oil has much higher fire and flash points and is readily
biodegradable. Therefore, vegetable oil has higher fire safety and the advantage of
environmental friendliness and is increasingly applied in transformers. The combination of
high temperature resistant paper and vegetable oil would provide a potential to safely
increase the transformer anti-overload ability. It is necessary to investigate on the behavior
of high temperature resistant oil and paper insulation materials.
This thesis first selects NOMEX T910 paper and Thermally Upgraded Kraft(TUK) paper
and three kinds of vegetable oil, namely FR3,Vinsoil and Dupont EBF#2. The initial physical,
chemical, mechanical and dielectric properties of all the paper and oil material are studied
and the results are compared with conventional Kraft paper and mineral oil system. On this
basis, the thesis further sets up a thermal aging platform and then performs a 150℃
accelerated thermal aging tests on T910 paper and PET Composite(DMD) paper in FR3
impregnation in a sealed tube. The change on typical properties of paper and oil along aging
is analyzed.
The results show that T910 paper owns a better performance on water content and oil
absorption. But on the initial mechanical strength, TUK paper and Kraft paper have higher
values, and T910 paper still meet the requirement of the relevant standard. The dissipation
factor tanδ of TUK paper and Kraft paper are lower, while T910’s is greater. The dielectric
constants εr of all three kinds of paper increase as the density goes up. T910 paper shows
higher breakdown electrical field values in air and most oil impregnation conditions, and
Abstract
5
mineral oil is more sensitive to temperature rise. As for the oil, all the vegetable oils have
higher water content, total acid number and viscosity.
After 720h of the 150℃ aging, the breakdown voltage of paper shows little change. Kraft
paper has more obvious tensile strength decrease and drops to 60% of the initial value,
whereas T910 paper and DMD paper nearly keep contant and high level all the time, remain
95% and 90% respectively. The vegetable oil has a stable viscosity behavior but distinct
increase on total acid number. The DGA results indicate higher gaseous content of C2H6
and CO and are diagnosed as T1 low-temperature fault by IEC standard. The aging process
makes it clear that the paper and oil degrade as the hydyolysis process dominates. All the
paper and oil materials experience the molecular chain cleavage led by the breakdown of
glucosidic bonds or ester bonds and some by-products are formed simultaneously. The
supporting role of high thermal stability of NOMEX fiber and the interactive
transesterification effect between PET and triglyceride make the T910 paper and DMD
paper have great tensile stability in FR3 oil. T910 and DMD paper both show greater tensile
retention than Kraft paper. However, the limitation of aging time could not verify the
temperature resistivity of T910 and DMD paper in FR3 oil sufficiently. Therefore, the
possibility of cooperations of T910 paper and DMD paper with FR3 oil to improve
transformer’s anti-overload ability is still needed to be assessed.
Abstract
6
Abstract
Poiché i trasformatori di rete hanno evidenziato, negli ultimi anni, seri problemi dovuti ai
sovraccarichi stagionali, l’affidabilità dei sistemi di alimentazione urbana e non è messa a
repentaglio. Perciò, è necessario migliorare l’abilità dei trasformatori di gestire tali
sovraccarichi. Una via economica è rappresentata dalla possibilità di sostituire il sistema
isolante con uno maggiormente resistente alle alte temperature. Esistono già diversi tipi di
carta resistente alle alte temperature candidati a questo ruolo che meritano un’analisi di
applicabilità ai trasformatori. Allo stesso tempo, se paragonato agli oli minerali tradizionali,
l’olio vegetale ha un più alto flash point ed è facilmente biodegradabile. Perciò esso offre
una maggiore sicurezza e il vantaggio di essere meno impattante dal punto di vista
ambientale; per questi motivi il suo impiego nei trasformatori sta aumentando notevolmente.
La combinazione di un foglio resistente alle alte temperature e di olio vegetale
comporterebbe un potenziale miglioramento nell’abilità nella gestione dei sovraccarichi.
Questa tesi ha selezionato dapprima due fogli, NOMEX T910 e Thermally Upgraded Kraft
(TUK),e tre tipi di olio vegetale, FR3, Vinsoil e Dupont EBF#2. Le proprietà fisiche,
chimiche, meccaniche e dielettriche iniziali degli isolanti impiegati sono state studiate e i
risultati paragonati con le proprietà di un foglio Kraft e di un olio minerale convenzionali.
Su questa base, si è sviluppato un piano di test termici di invecchiamento e in seguito un test
di stress accelerato a 150 °C. La variazione delle proprietà tipiche dei materiali impiegati
nel corso dell’invecchiamento è stata analizzata.
I risultati hanno mostrato che il T910 è in grado di fornire una performance migliore in
termini di contenuto di acqua e assorbimento di olio. Tuttavia,il TUK e il Kraft hanno
mostrano valori iniziali di resistenza meccanica più elevati. Il fattore di dissipazione tanδ
del TUK e del Kraft è più basso. Le costanti dielettriche εr dei tre paper aumentano
all’aumentare della densità. Il T910 mostra i più alti valori di breakdown in aria e l’olio
minerale è maggiormente sensitivo a un aumento di temperatura. Gli oli vegetali hanno
maggiori contenuto di acqua, numero di acidità totale e viscosità.
Dopo 720 h di invecchiamento, la tensione di breakdown dei fogli mostra una leggera
variazione. Il Kraft mostra una ovvia riduzione della resistenza a trazione (fino al 60 % del
Abstract
7
valore iniziale), mentre T910 e DMD mantengono tale parametro pressoché costante per
tutto il tempo.
L’olio vegetale mostra un comportamento stabile della viscosità, ma un netto aumento del
numero di acidità totale.
I risultati DGA indicano un più elevato contenuto di C2H6 e CO.
Il processo di invecchiamento ha evidenziato che il foglio e l’olio degradano se il processo
di idrolisi risulta dominante. Tutti i fogli e gli oli minerali hanno evidenziato la frattura della
catena polimerica dovuta alla rottura dei legami glucosidici o esterei e alla formazione
simultanea di sottoprodotti.
I fogli T910 e DMD mostrano una migliore tenuta a trazione rispetto al Kraft. Tuttavia, il
limite imposto di tempo durante le prove di invecchiamento potrebbe aver inciso sui risultati
ottenuti. Pertanto, la possibilità di unione delle proprietà di T910 e DMD nell’olio FR3 per
migliorare la gestione dei sovraccarichi meriterebbe un’ulteriore valutazione.
Introduction
8
1 Introduction
1.1 Research Background and Significance
As the commonly used electrical apparatus in power system, the distribution transformers
play a critical role in electricity transmission, distribution and utilization. The safe operation
of distribution grid directly determines the stability and reliability of power supply. Currently,
most distribution transformers apply the oil-immersed type insulation, that is the windings
wrapped by insulation paper are immersed in insulation oil. Transformers in some areas may
experience seasonal overloading in particular periods, for example farming or festivals.
Under such conditions, the transformers temperature rise will increase, leading to the melting
of protecting fuse and then blackout. Meanwhile, the urban industries and household
electricity also call for a higher requirement of safe and stable electricity supplement.
Therefore, how to enhance the anti-overloading ability of distribution transformers
economically and efficiently has become a prominent problem in recent years.
The anti-overloading ability of distribution transformers can be improved by the following
methods: (1) increasing the transformer capacity. However, the daily residential electricity
consumption is limited, as the loading rates in normal operation just reach approximately
40%. The raising of transformers capacity will also increase the light-loading losses, causing
additional energy wasting. (2) supplement of draught fans or increasing the size of oil tank.
(3) choosing alternative high-temperature resistant oil-paper insulation systems. The third
method has the highest technique-economic performance. The appearance of high-
temperature class insulation paper provide a solid support. At the same time, the high fire
and flash points, the environment-friendly property and the characteristic that could prolong
insulation paper’s life of vegetable insulation oil make the economic increasing of
transformers anti-overloading ability possible.
The conventional transformer oil and paper insulation system consists of Kraft paper and
mineral oil. During the long-term operation, oil-paper insulation materials will deteriorate
under electrical, thermal, mechanical and environmental factors, among which the thermal
stress is the main degrading source. Insulation paper will age accelerated when facing the
Introduction
9
temperature rise caused by overloading. According to the Montsinger’s rule[1], the life of
insulation paper will be halved as the operating temperature increases by every 6 to 8℃.
Hence, in order to increase the transformers anti-overloading ability, we need to select highly
temperature resistant paper material. There are plenty choices in real applications.
NOMEX® paper, thermally upgraded Kraft (TUK) paper, DMD paper and NOMEX T910
are typical paper materials with high thermal class. Due to the different performances, the
suitability of such materials in anti-overloading transformers is still needed to be investigated.
Although the mineral oil is widely used as insulation oil, the low fire and flash points make
it has low fire security, unsuitable for areas where the population is dense or great fire safety
concerns are drawn. Mineral oil is hard to degrade naturally. Once it is leaked, the
environment will be contaminated. However, the high fire and flash points and readily
biodegradability allow the vegetable oil to be more safe and environment-friendly[2]. There
are also researches[3] showing that the impregnation by vegetable oil could postpone the
hydrolysis of cellulose and thus extend the paper and transformers life.
To sum up, investigating the differences of fundamental properties of different insulation
materials could provide a basis to increase the transformer anti-overloading ability. It will
also be helpful for engineers to design a suitable and stable insulation system.
1.2 State-of-Art of High Temperature Resistant
Insulation Paper
1.2.1 The Development of High-Temperature Resistant Insulation Paper
Before the 1920s, a variety of fibrous materials, both cellulosic and non-cellulosic, were
used for electrical insulation: cotton rag, silk, jute, asbestos, etc. Although varnished cambric
cloth and other textiles were used in cables, varnished or ‘boiled-in-oil’ pressboard made up
of cotton rags and paper clippings was used in transformers. In 1920, blends of kraft wood
fibers and manila-hemp fibers began to be used for telephone insulation. In capacitors, linen
was used until the late 1920s. The 1920s and 1930s were periods of much experimentation
on how to improve the dielectric performance of the paper-oil system. A better
understanding of fibers and impurities in the pulp resulted in better insulation. It seems that
by the late 1920s and early 1930s, kraft paper insulation began to be used in combination
Introduction
10
with insulating oil in transformers. This combination was needed to satisfy the increasing
insulation requirements as the voltage ratings escalated. In the 1940s, kraft paper in
combination with oil was the dielectric material of choice for HV use as evidenced by the
number of cellulose material studies done. Much more information on paper chemistry was
generated in the 1950s and later at the Institute of Paper Chemistry. But interest in synthetic
dielectric materials slowly developed in the late 1950s, and such materials began to replace
cellulosic insulation in power cables and capacitors[4]. Mixtures of cellulosic and synthetic
materials are now used in many transformer insulation applications.
It may be noted that transformer insulation had to be developed almost concurrently with
transformer development, but it took a few decades before the paper-oil combination became
reliable and well accepted. The transformer had been invented as far back as 1885 by a team
of Austrian engineers and further developed by other inventors, especially George
Westinghouse and his team. The one built by George Westinghouse in 1885 based on the
work of his team of experts in the U.S. was, in principle, similar to theirs, and was a dry-
type distribution transformer with 500-V primary and 100-V secondary. It used air as coolant.
Cellulose-oil insulation was critical for all transformers developed since the 1920s.
Transformer oil itself had been introduced for transformer use in 1892 by GE and underwent
improvement from paraffinic to naphthenic by 1925. Vacuum filling of oil was introduced
in 1932.
A. Kraft Paper and Board
It is difficult to pinpoint the time when electrical grade paper was introduced, but it is
known that such papers were used for capacitors and cables extensively before becoming
the primary solid insulation in transformers. The use of resin-impregnated paper for
transformer insulation was introduced at the turn of the 20th century. The introduction of
oil impregnation of paper led to the discontinuation of resin-impregnated paper.
Although resin-impregnated cylinders functioned remarkably well in the earlier days, they
were not desirable in high-stressed areas such as angles and corners (boundary areas) as the
voltage rating increased. By the late 1920s in Switzerland, Weidmann had developed
transformerboard (now called pressboard) from kraft pulp, which could be easily fabricated
into formed items, and these were ideal for high-stressed areas. The wet sheets, built up from
Introduction
11
a number of required plies, pass through compressing and drying cylinders and emerge as
dry sheets. The calendered pressboard is ideal also for washers and tubes used in power
transformers. Another European manufacturer of calendered board, based in Sweden, is
Figeholm, which started its operation in 1931. Other companies once in production have
been acquired by other companies or shut down. Figeholm itsef is now owned by ASEA in
Sweden[5].
B. Creped Paper Turn Insulation
Although plain kraft paper is widely used for conductor insulation in transformers in many
countries, creped kraft paper is used for such purposes in the U.S. Crepe paper for turn
insulation was introduced by Dennison Paper Company in Framingham, MA in the 1970s
with the blessing of the Westinghouse Large Power Transformer Plant in Muncie, IN, which
was interested in a tear-free paper for taping[5]. The tough hemp-kraft paper used for taping
at the time had very little stretch. The crepe paper has as much as 20% stretch (elongation).
The creping is done on the regular sheet of paper, as a drum of it unrolls and is picked up by
another drum revolving at a slower speed; the paper goes through an aqueous bath containing
a creping compound. The crepe paper described here should not be confused with the 100%
stretch lead tape used in transformers that was available earlier. The introduction of the crepe
paper was a few years after thermal upgrading agents were put into paper (see subsequent),
so the crepe paper could be thermally upgraded at the same time from a non-upgraded paper.
C. Thermal Upgrading of Paper
As the rating of transformers climbed in the 1950s and 1960s and as transformers were
occasionally overloaded, the concern for transformer life, or rather, paper insulation life, was
raised. Thermal upgrading of the paper insulation was considered one remedy and was
attempted by several research groups associated with transformer or paper manufacturing in
the late 1950s through the 1970s; upgraded paper began to be used in the U.S. since the mid
1960s. An EPRI Report on thermal upgrading agents released in 1987 gives both historical
and ongoing studies. The upgrading systems developed include Insuldur (Westinghouse),
Cyanoethylate (GE), Thermacel (McGraw Edison), Celloflex (Allis Chalmers), Mannitherm
(Manning Paper Co.), HAS (McGraw Edison), Hovotherm (Hollingsworth & Vose), and
Rigel 65°C Rise (Rigel Products)[6]. The superiority of the upgraded papers was
demonstrated by both short-term and long-term aging. The purpose of upgrading is to
increase the insulation life. Accelerated aging studies confirmed that cellulose degradation

Introduction
12
is considerably slowed by upgrading agents. Transformers rated at 55°C oil rise could be
upgraded to 65°C oil rise, which meant the insulation life was extended by at least three
times. Also, cellulose paper has a thermal class rating of only 105°C, whereas the TUK paper
usually has at least 15°C elevation, which means its thermal class could reach up to 120°C[7].
D. Synthetic Materials-NOMEX®
Special synthetic formulations such as Aramid (an aromatic polyamide) developed by
DuPont in 1960s under the trade name Nomex® are being used for making paper sheets and
pressboard for limited transformer use. Nomex® has a considerably higher thermal rating
(220°C vs. 105°C for cellulosic paper)[5]. Moisture absorption by Nomex® paper is
significantly lower than for cellulosic paper, e.g., for 0.075-mm (3-mil) thick papers,
saturation values at room temperature at 50% humidity are as follows: Nomex®, 4%;
cellulose paper, 6.5%. Hybrid insulation structures in distribution, mobile, and small power
transformers containing both Nomex® turn insulation and cellulosic structural parts are in
commercial use. The higher cost of Nomex® insulation prevents its widespread use in
medium and large power units.
E. Flexible Laminates-DMD
Flexible laminates have been used as basic insulation in the electrical industry for over 30
years, but they are still one of the least understood components in an electrical insulation
system. DMD laminates are three-ply constructions of nonwoven polyester fiber mat bonded
to both sides of polyester film originally known as Dacron® - Mylar® - Dacron® in the
industry, and subsequently shortened to DMD[8]. These composites could be considered to
be the first modern flexible laminates developed specifically for insulating electrical motors.
Introduced in the late 1950s, DMD laminates are composed entirely of synthetic organic
materials combined together to achieve a truly synergistic effect-the performance of the
laminate far exceeds the performance of the individual components. It should be noted that
early experiences with DMD laminates pointed out potential problems with the nonwoven
mat surface. The soft, fibrous mat surface exhibited poor abrasion resistance and tended to
snag and pull on rough surfaces. This would cause problems in automatic insertion
operations when the laminate would hang up in the slot or jam the insertion equipment. This
problem was overcome by saturating, or overcoating, the nonwoven mat surfaces with a hard
resin, usually polyester or epoxy, to tie down the surface fibers and create a smooth, abrasion
resistant surface.
Introduction
13
F. Cellulose-Synthetic Composite NOMEX T910®
Since 1980s, there are little modifications made on the insulation paper. In recent years,
DuPont developed a new and unique solid insulating material under the trademark NOMEX
T910®. This new paper is composed of high quality electrical grade cellulose pulp and web-
like binders made from high-temperature meta-aramid synthetic polymer without any
additional binders. NOMEX T910® has a thermal class of 130°C, filling the blank space in
thermal class between 120°C(TUK) and 220°C(NOMEX). This new solid insulation paper
has shown noticeably better thermal capability than the incumbent cellulose paper, with a
cost between the cellulose and the synthetic aramid papers.
1.2.2 Main Components of High-Temperature Resistant Insulation Paper
A. Kraft Paper
For the manufacturing of paper and pressboard for electrical insulation, mainly unbleached
softwood kraft pulp is used. The cellulose is refined from the tree by the so-called "sulphate"
or "kraft" process. Wood is a natural composite material that is made up of flexible tubes of
cellulose bound together by lignin, a brownish aromatic polymer that is mostly removed
during the pulping process. After processing the typical composition of unbleached kraft
pulp is 78-80% cellulose, 10-20 % hemicellulose and 2-6 % lignin[9].
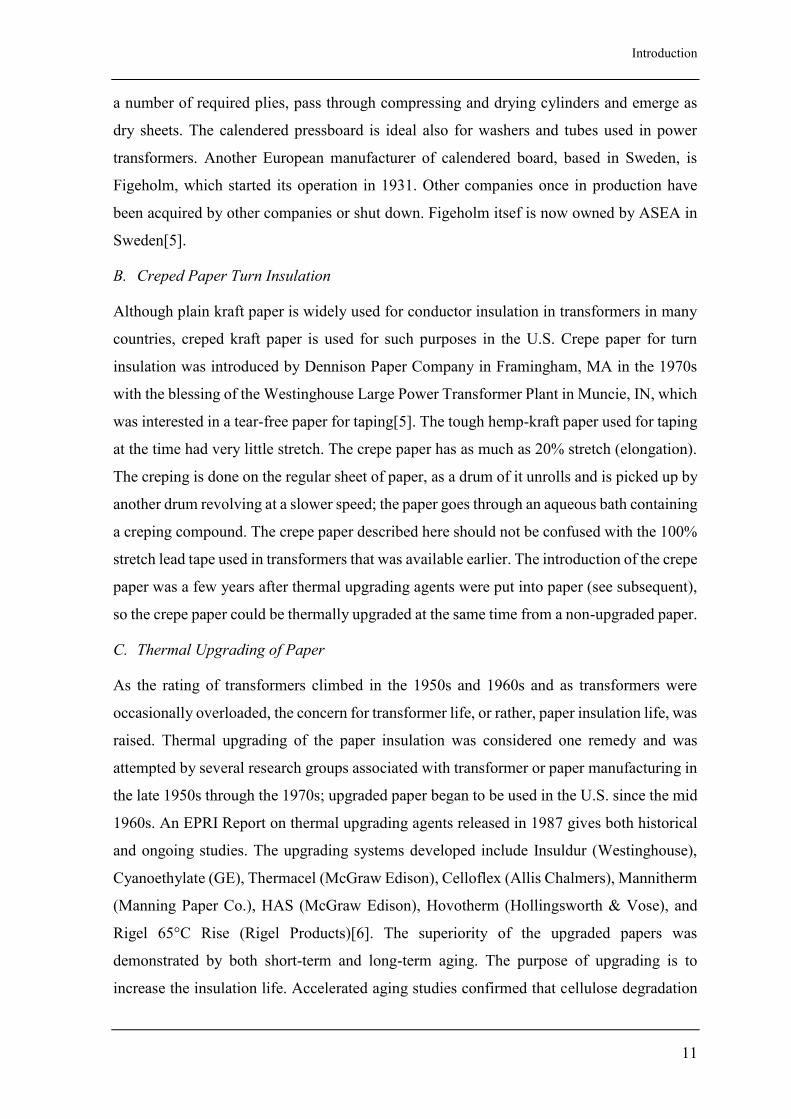
Cellulose, the essential component of paper and pressboard, is a polymer of glucose units
linked to one another in a special manner as shown in Figure. 1-1[10]. It may be represented
simply as [C5H10O5]n, ignoring the extra atoms on the end groups, where n is the degree of
polymerization (DP). The repeating unit, however, is cellobiose, consisting of two glucose
units.
Figure 1-1. Structural formula of cellulose
The DP values for paper samples can be estimated by specified methods such as ASTM D-
4243. The DP of kraft pulps ranges from 1100 to 1200, but mixed pulp fibers can have much
higher DP, e.g., 1400 to 1600.
Introduction
14
When the cellulose molecule is fully extended it takes the form of a flat ribbon with highly
hydrophilic hydroxyl groups protruding laterally and capable of forming both inter- and
intramolecular hydrogen bonds. The surface of the ribbon consists mainly of hydrogen atoms
linked directly to carbon and is therefore hydrophobic. These two features of the molecular
structure of cellulose are responsible for its supramolecular structure and this in turn
determines many of its chemical and physical properties.
B. Thermally upgrading Kraft(TUK) Paper
There are basically two types of thermal upgrading processes that were developed[11].
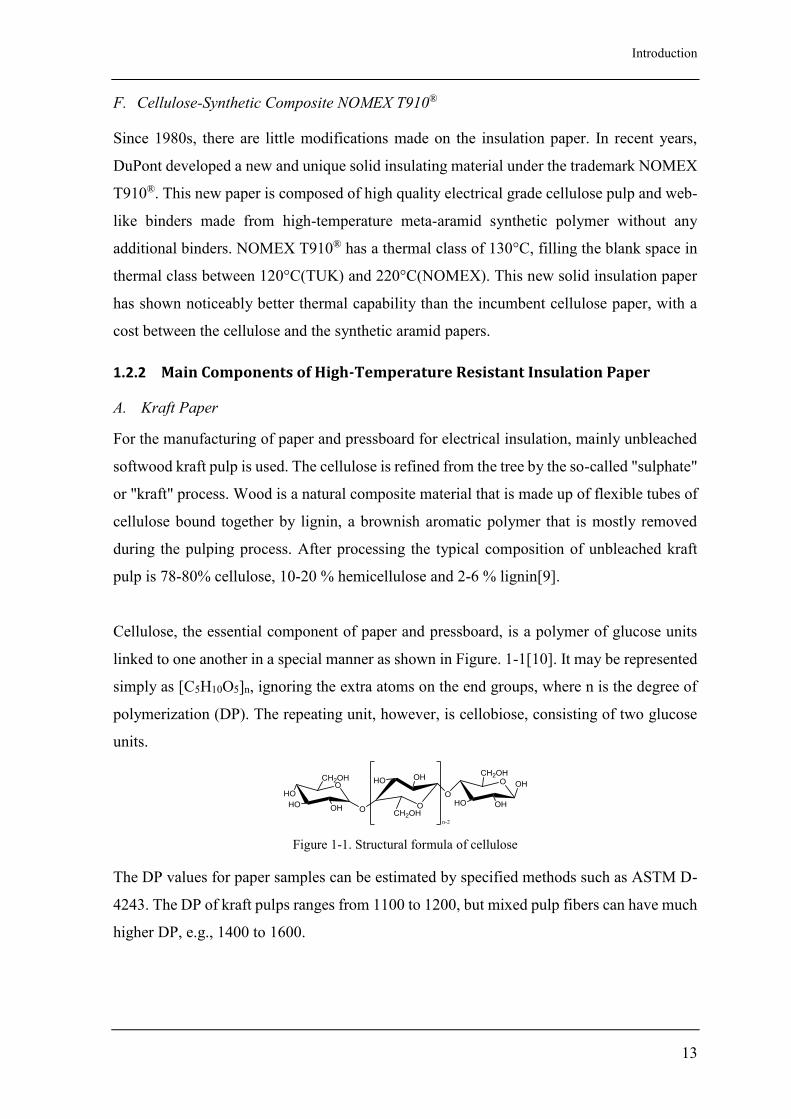
1) Modification of the cellulose chains specifically at OH groups by cyanoethylation and
acetylation.
In cyanoethylation the cellulose is chemically modified with some of the less-stable water-
forming hydroxyl groups in the cellulose chain being replaced by more stable cyanethyl
groups. (see Figure 1-2). This process must be done in the pulping stage of paper
manufacturing. The replacement of some of the hydroxyl groups also reduces the number of
hydrogen bridges between the molecules. This reduces mechanical strength.
Figure 1-2. The Cyanoethylated Reaction of Cellulose.
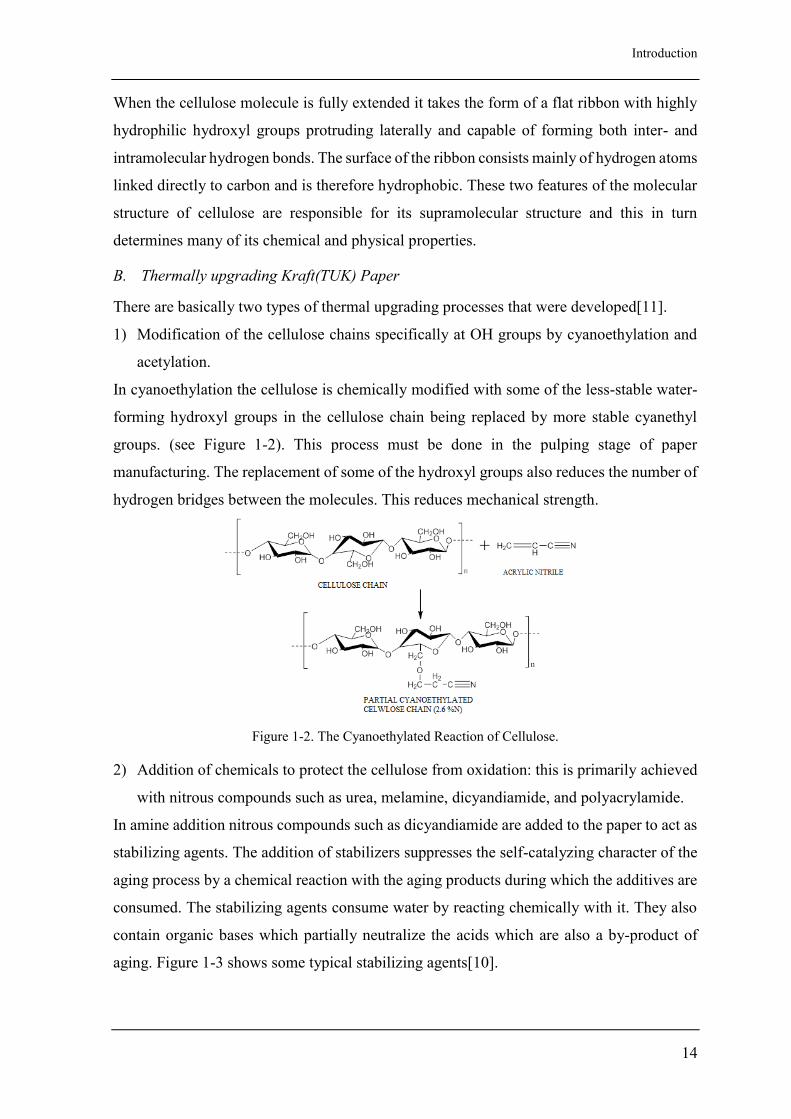
2) Addition of chemicals to protect the cellulose from oxidation: this is primarily achieved
with nitrous compounds such as urea, melamine, dicyandiamide, and polyacrylamide.
In amine addition nitrous compounds such as dicyandiamide are added to the paper to act as
stabilizing agents. The addition of stabilizers suppresses the self-catalyzing character of the
aging process by a chemical reaction with the aging products during which the additives are
consumed. The stabilizing agents consume water by reacting chemically with it. They also
contain organic bases which partially neutralize the acids which are also a by-product of
aging. Figure 1-3 shows some typical stabilizing agents[10].
Introduction
15
Figure 1-3. Agents for thermally upgrading of paper
All processes result in an increased content of nitrogen in the solid insulation, but the
treatment is by no means standardized, and the concentration of additives may vary. The
nitrogen content of the various upgrading systems ranged from 0.3 to 2.7%.
C. DMD Paper
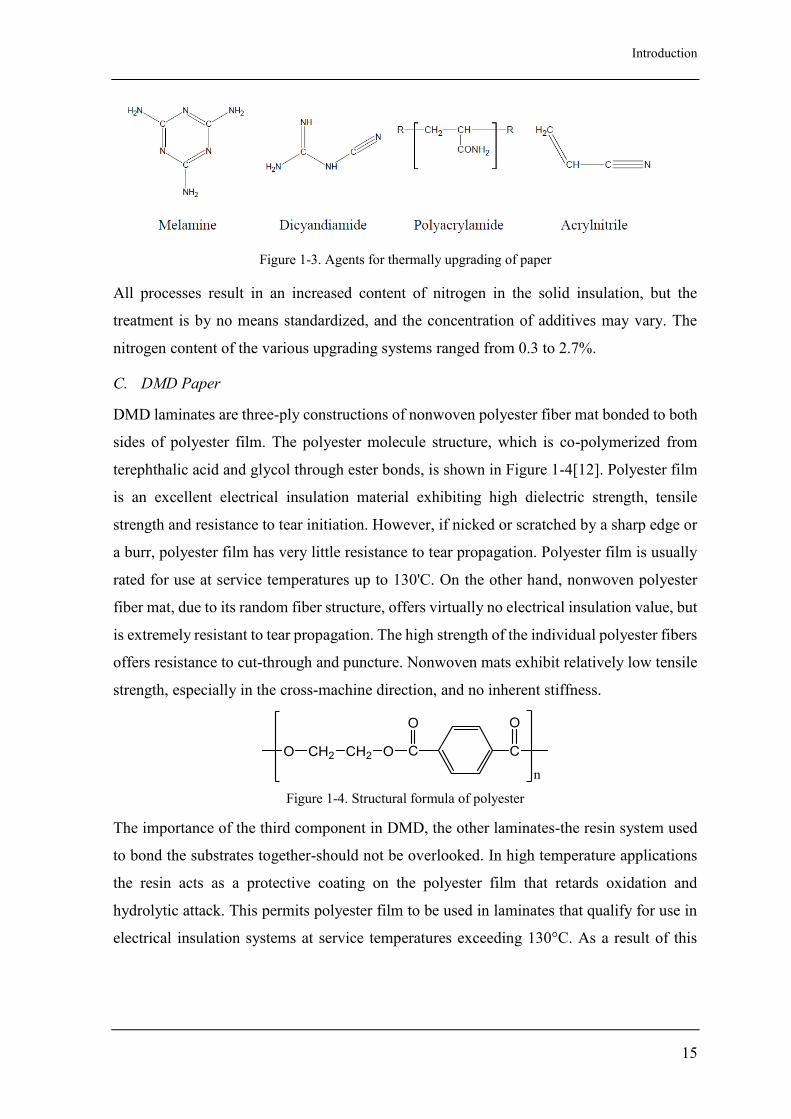
DMD laminates are three-ply constructions of nonwoven polyester fiber mat bonded to both
sides of polyester film. The polyester molecule structure, which is co-polymerized from
terephthalic acid and glycol through ester bonds, is shown in Figure 1-4[12]. Polyester film
is an excellent electrical insulation material exhibiting high dielectric strength, tensile
strength and resistance to tear initiation. However, if nicked or scratched by a sharp edge or
a burr, polyester film has very little resistance to tear propagation. Polyester film is usually
rated for use at service temperatures up to 130'C. On the other hand, nonwoven polyester
fiber mat, due to its random fiber structure, offers virtually no electrical insulation value, but
is extremely resistant to tear propagation. The high strength of the individual polyester fibers
offers resistance to cut-through and puncture. Nonwoven mats exhibit relatively low tensile
strength, especially in the cross-machine direction, and no inherent stiffness.
Figure 1-4. Structural formula of polyester
The importance of the third component in DMD, the other laminates-the resin system used
to bond the substrates together-should not be overlooked. In high temperature applications
the resin acts as a protective coating on the polyester film that retards oxidation and
hydrolytic attack. This permits polyester film to be used in laminates that qualify for use in
electrical insulation systems at service temperatures exceeding 130°C. As a result of this
Introduction
16
phenomenon, there are many insulation systems recognized by Underwriters Laboratories,
Inc., as Thermal Class 155, which utilize DMD laminates as the primary slot insulation.
A DMD laminate thus exhibits the best characteristics of its individual components:
excellent electrical insulation properties, high tensile strength, stiffness and formability from
the polyester film; resistance to tear, puncture and cut-through from the nonwoven mat; and
high temperature capabilities as a result of the resin system used.
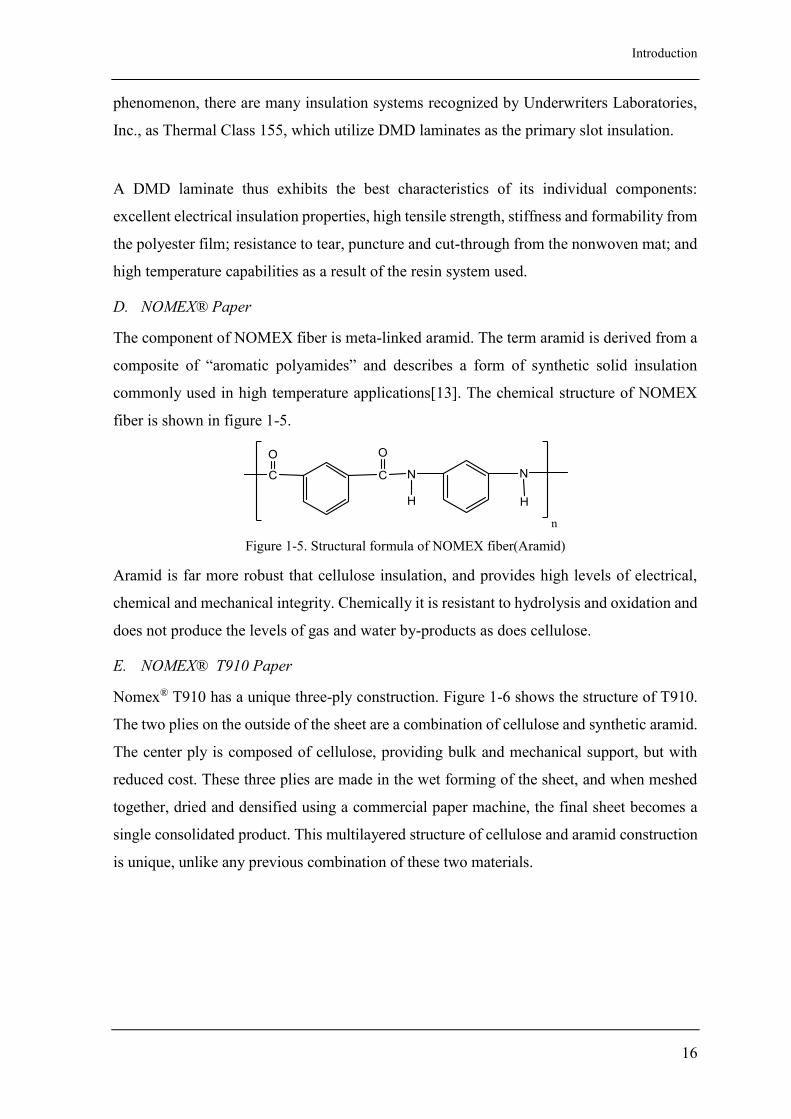
D. NOMEX® Paper
The component of NOMEX fiber is meta-linked aramid. The term aramid is derived from a
composite of “aromatic polyamides” and describes a form of synthetic solid insulation
commonly used in high temperature applications[13]. The chemical structure of NOMEX
fiber is shown in figure 1-5.
Figure 1-5. Structural formula of NOMEX fiber(Aramid)
Aramid is far more robust that cellulose insulation, and provides high levels of electrical,
chemical and mechanical integrity. Chemically it is resistant to hydrolysis and oxidation and
does not produce the levels of gas and water by-products as does cellulose.
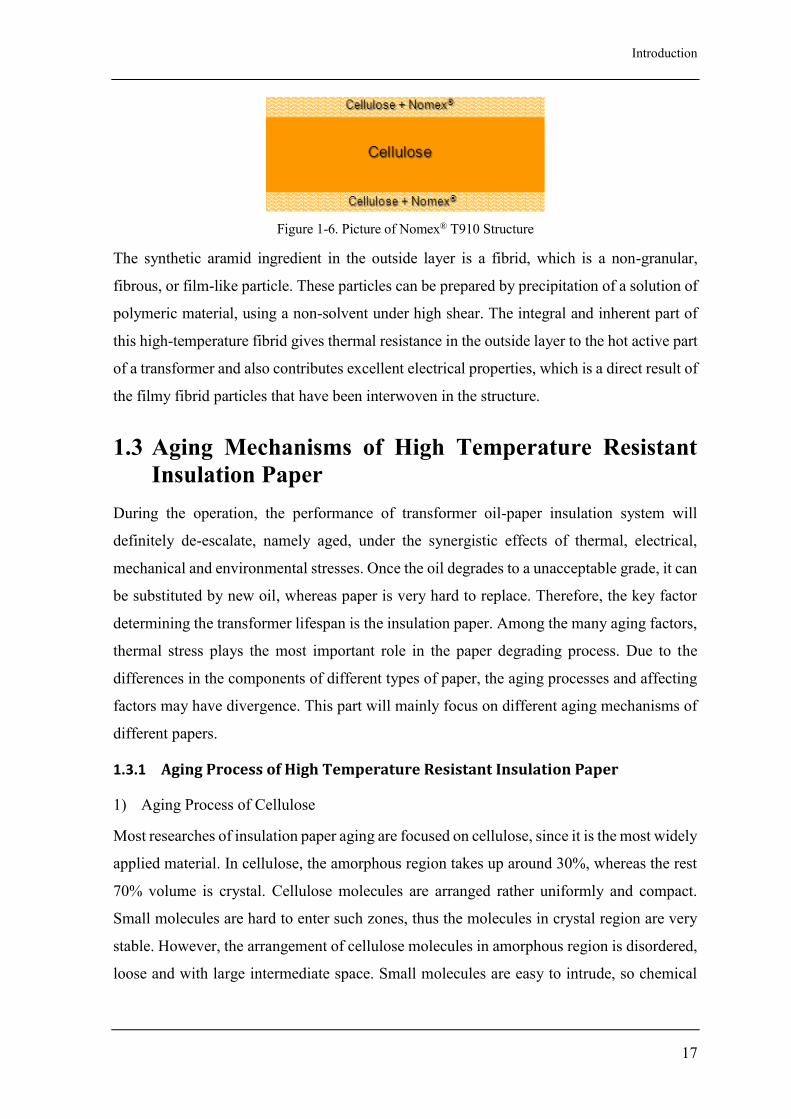
E. NOMEX® T910 Paper
Nomex® T910 has a unique three-ply construction. Figure 1-6 shows the structure of T910.
The two plies on the outside of the sheet are a combination of cellulose and synthetic aramid.
The center ply is composed of cellulose, providing bulk and mechanical support, but with
reduced cost. These three plies are made in the wet forming of the sheet, and when meshed
together, dried and densified using a commercial paper machine, the final sheet becomes a
single consolidated product. This multilayered structure of cellulose and aramid construction
is unique, unlike any previous combination of these two materials.
Introduction
17
Figure 1-6. Picture of Nomex® T910 Structure
The synthetic aramid ingredient in the outside layer is a fibrid, which is a non-granular,
fibrous, or film-like particle. These particles can be prepared by precipitation of a solution of
polymeric material, using a non-solvent under high shear. The integral and inherent part of
this high-temperature fibrid gives thermal resistance in the outside layer to the hot active part
of a transformer and also contributes excellent electrical properties, which is a direct result of
the filmy fibrid particles that have been interwoven in the structure.
1.3 Aging Mechanisms of High Temperature Resistant
Insulation Paper
During the operation, the performance of transformer oil-paper insulation system will
definitely de-escalate, namely aged, under the synergistic effects of thermal, electrical,
mechanical and environmental stresses. Once the oil degrades to a unacceptable grade, it can
be substituted by new oil, whereas paper is very hard to replace. Therefore, the key factor
determining the transformer lifespan is the insulation paper. Among the many aging factors,
thermal stress plays the most important role in the paper degrading process. Due to the
differences in the components of different types of paper, the aging processes and affecting
factors may have divergence. This part will mainly focus on different aging mechanisms of
different papers.
1.3.1 Aging Process of High Temperature Resistant Insulation Paper
1) Aging Process of Cellulose
Most researches of insulation paper aging are focused on cellulose, since it is the most widely
applied material. In cellulose, the amorphous region takes up around 30%, whereas the rest
70% volume is crystal. Cellulose molecules are arranged rather uniformly and compact.
Small molecules are hard to enter such zones, thus the molecules in crystal region are very
stable. However, the arrangement of cellulose molecules in amorphous region is disordered,
loose and with large intermediate space. Small molecules are easy to intrude, so chemical
Introduction
18
interactions are more likely to happen in amorphous region, where cellulose aging is also
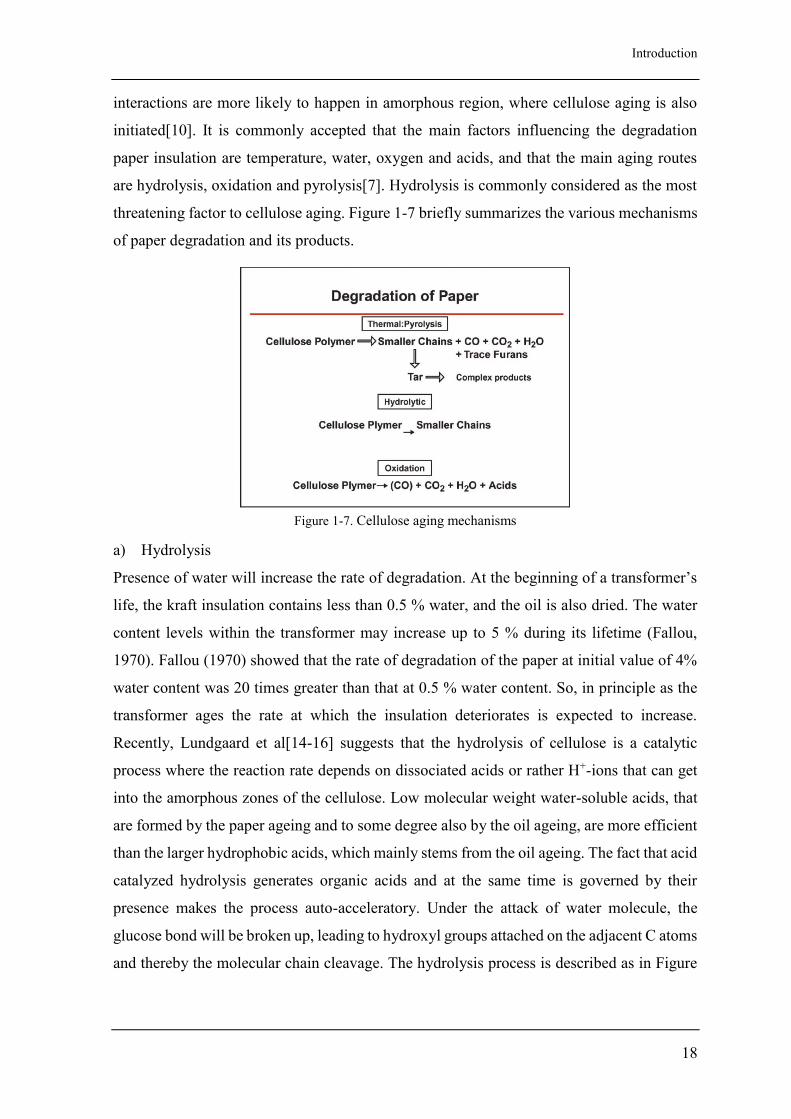
initiated[10]. It is commonly accepted that the main factors influencing the degradation
paper insulation are temperature, water, oxygen and acids, and that the main aging routes
are hydrolysis, oxidation and pyrolysis[7]. Hydrolysis is commonly considered as the most
threatening factor to cellulose aging. Figure 1-7 briefly summarizes the various mechanisms
of paper degradation and its products.
Figure 1-7. Cellulose aging mechanisms
a) Hydrolysis
Presence of water will increase the rate of degradation. At the beginning of a transformer’s
life, the kraft insulation contains less than 0.5 % water, and the oil is also dried. The water
content levels within the transformer may increase up to 5 % during its lifetime (Fallou,
1970). Fallou (1970) showed that the rate of degradation of the paper at initial value of 4%
water content was 20 times greater than that at 0.5 % water content. So, in principle as the
transformer ages the rate at which the insulation deteriorates is expected to increase.
Recently, Lundgaard et al[14-16] suggests that the hydrolysis of cellulose is a catalytic
process where the reaction rate depends on dissociated acids or rather H+-ions that can get
into the amorphous zones of the cellulose. Low molecular weight water-soluble acids, that
are formed by the paper ageing and to some degree also by the oil ageing, are more efficient
than the larger hydrophobic acids, which mainly stems from the oil ageing. The fact that acid
catalyzed hydrolysis generates organic acids and at the same time is governed by their
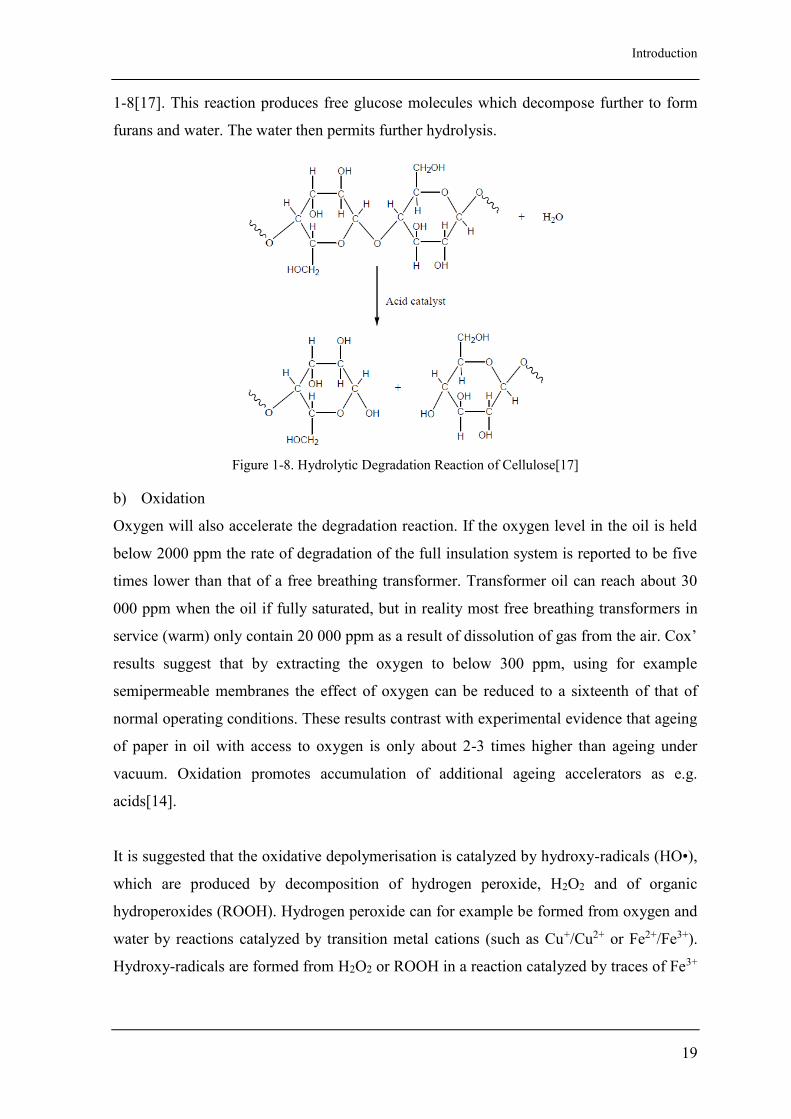
presence makes the process auto-acceleratory. Under the attack of water molecule, the
glucose bond will be broken up, leading to hydroxyl groups attached on the adjacent C atoms
and thereby the molecular chain cleavage. The hydrolysis process is described as in Figure
Introduction
19
1-8[17]. This reaction produces free glucose molecules which decompose further to form
furans and water. The water then permits further hydrolysis.
Figure 1-8. Hydrolytic Degradation Reaction of Cellulose[17]
b) Oxidation
Oxygen will also accelerate the degradation reaction. If the oxygen level in the oil is held
below 2000 ppm the rate of degradation of the full insulation system is reported to be five
times lower than that of a free breathing transformer. Transformer oil can reach about 30
000 ppm when the oil if fully saturated, but in reality most free breathing transformers in
service (warm) only contain 20 000 ppm as a result of dissolution of gas from the air. Cox’
results suggest that by extracting the oxygen to below 300 ppm, using for example
semipermeable membranes the effect of oxygen can be reduced to a sixteenth of that of
normal operating conditions. These results contrast with experimental evidence that ageing
of paper in oil with access to oxygen is only about 2-3 times higher than ageing under
vacuum. Oxidation promotes accumulation of additional ageing accelerators as e.g.
acids[14].
It is suggested that the oxidative depolymerisation is catalyzed by hydroxy-radicals (HO•),
which are produced by decomposition of hydrogen peroxide, H2O2 and of organic
hydroperoxides (ROOH). Hydrogen peroxide can for example be formed from oxygen and
water by reactions catalyzed by transition metal cations (such as Cu+/Cu2+ or Fe2+/Fe3+).
Hydroxy-radicals are formed from H2O2 or ROOH in a reaction catalyzed by traces of Fe3+
Introduction
20
or other active metals, together with small amounts of autooxidizable compounds such as
phenols, aromatic amines or thiols. It is here also suggested that the oxidation is reduced in
an acidic environment, which would reduce the importance of these reactions with time[10].
c) Pyrolysis
By pyrolysis we mean a process that can take place without access to water and/or oxygen,
or any other agent to initiate the decomposition. At normal operating or overload
temperatures (i.e. <140℃) such processes are considered to be of little relevance. At high
temperatures, which may occur at defects such as poor soldering or magnetic induced local
failure currents, pyrolysis may well occur. Generation of CO and CO2 may follow. However
this is outside the scope of this report.
The researches of A.M Emsley group[18] showed that temperature and moisture are the main
affecting factors in the process of paper aging, while oxygen plays a secondary role.
Meanwhile, temperature and moisture have very high synergetic effect, much greater than
the effect between temperature and oxygen. They also discovered that, with low water
content in paper, water and oxygen have a antagonistic interaction behavior. Water has less
importance on aging as the oxygen concentration increases. Authors account this for the
potential reason for the fact that insulation could still remain intact in some scrapped
transformers.
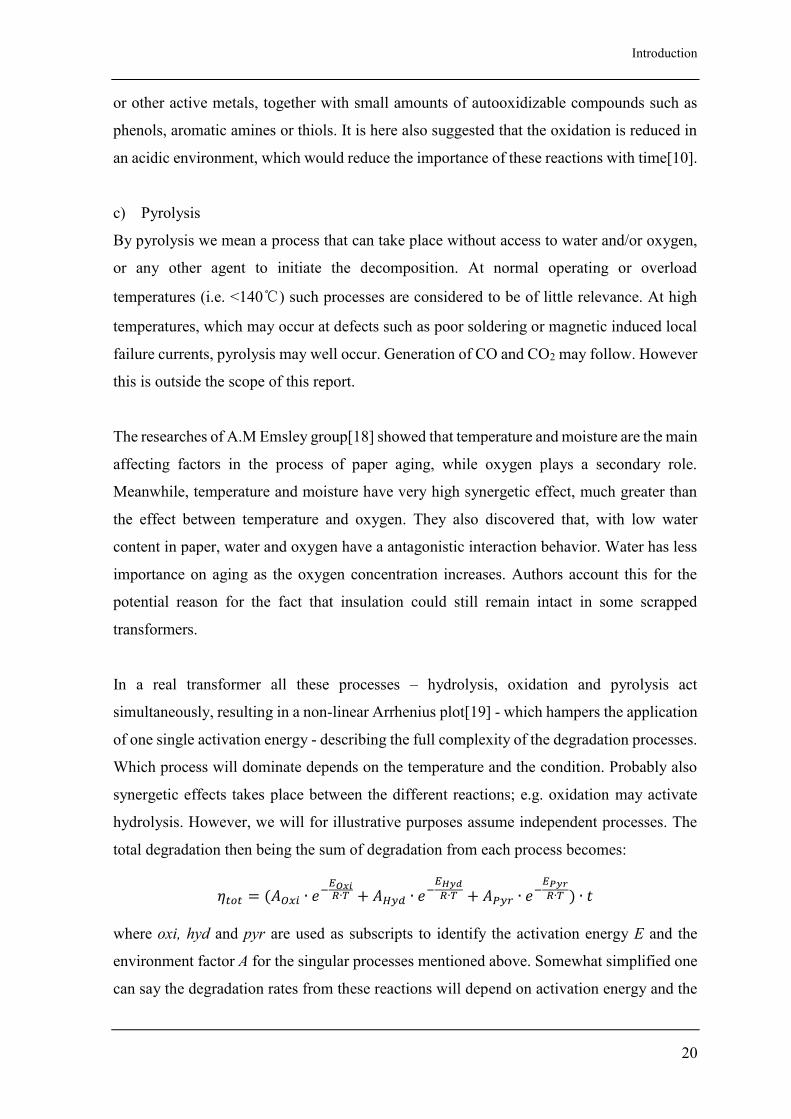
In a real transformer all these processes – hydrolysis, oxidation and pyrolysis act
simultaneously, resulting in a non-linear Arrhenius plot[19] - which hampers the application
of one single activation energy - describing the full complexity of the degradation processes.
Which process will dominate depends on the temperature and the condition. Probably also
synergetic effects takes place between the different reactions; e.g. oxidation may activate
hydrolysis. However, we will for illustrative purposes assume independent processes. The
total degradation then being the sum of degradation from each process becomes:
𝜂𝑡𝑜𝑡 = (𝐴𝑂𝑥𝑖 ∙ 𝑒−𝐸𝑂𝑥𝑖𝑅∙𝑇 + 𝐴𝐻𝑦𝑑 ∙ 𝑒−
𝐸𝐻𝑦𝑑
𝑅∙𝑇 + 𝐴𝑃𝑦𝑟 ∙ 𝑒−𝐸𝑃𝑦𝑟
𝑅∙𝑇 ) ∙ 𝑡
where oxi, hyd and pyr are used as subscripts to identify the activation energy E and the
environment factor A for the singular processes mentioned above. Somewhat simplified one
can say the degradation rates from these reactions will depend on activation energy and the
Introduction
21
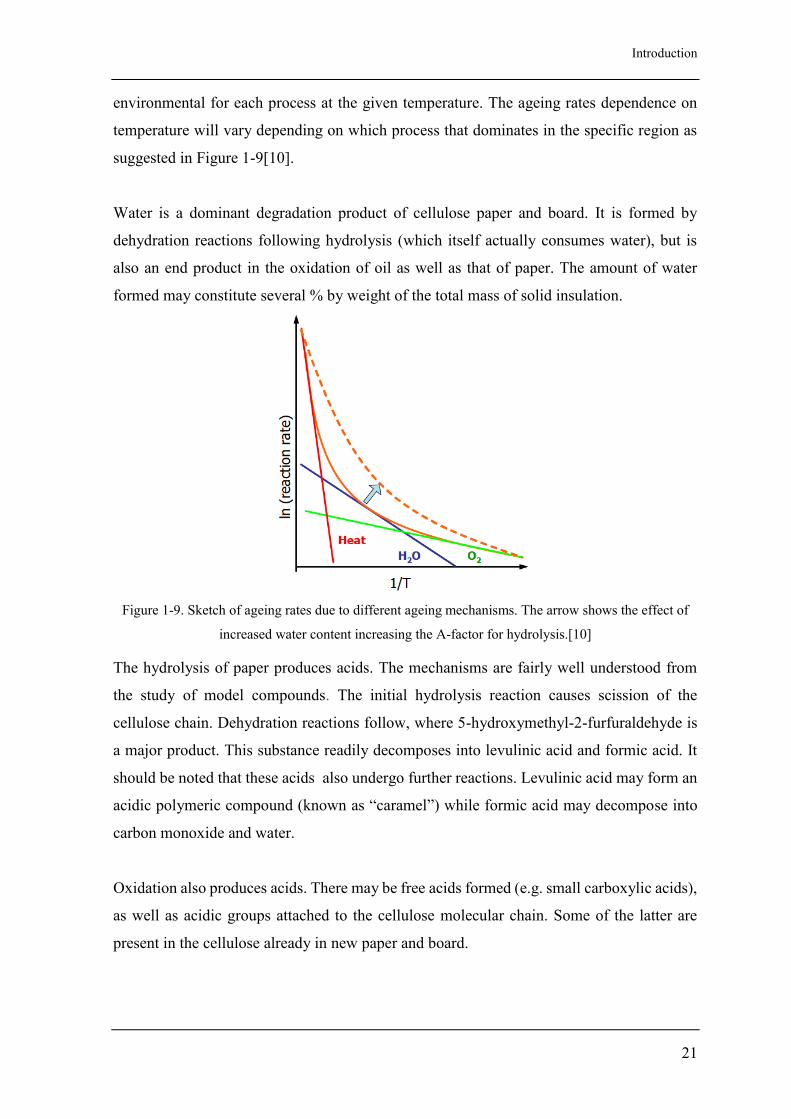
environmental for each process at the given temperature. The ageing rates dependence on
temperature will vary depending on which process that dominates in the specific region as
suggested in Figure 1-9[10].
Water is a dominant degradation product of cellulose paper and board. It is formed by
dehydration reactions following hydrolysis (which itself actually consumes water), but is
also an end product in the oxidation of oil as well as that of paper. The amount of water
formed may constitute several % by weight of the total mass of solid insulation.
Figure 1-9. Sketch of ageing rates due to different ageing mechanisms. The arrow shows the effect of
increased water content increasing the A-factor for hydrolysis.[10]
The hydrolysis of paper produces acids. The mechanisms are fairly well understood from
the study of model compounds. The initial hydrolysis reaction causes scission of the
cellulose chain. Dehydration reactions follow, where 5-hydroxymethyl-2-furfuraldehyde is
a major product. This substance readily decomposes into levulinic acid and formic acid. It
should be noted that these acids also undergo further reactions. Levulinic acid may form an
acidic polymeric compound (known as “caramel”) while formic acid may decompose into
carbon monoxide and water.
Oxidation also produces acids. There may be free acids formed (e.g. small carboxylic acids),
as well as acidic groups attached to the cellulose molecular chain. Some of the latter are
present in the cellulose already in new paper and board.
Introduction
22
Obviously the oxidation of paper (as well as oil) is associated with the presence of oxygen.
The higher the oxygen content the higher the rate of oxidation. In the absence of oxygen the
oxidation rate will be insignificant. Reducing the O2 content will reduce the oxidation rate
but not necessarily in direct proportion to the change of O2 content. However, as already
pointed out, acids can be formed by other routes than oxidation, especially hydrolysis.
Many of these acids will have a low molecular weight thus being volatile and having a low
boiling point. They will also have a high polarity, meaning that they will be hydrophilic,
tending to dissolve well in paper.
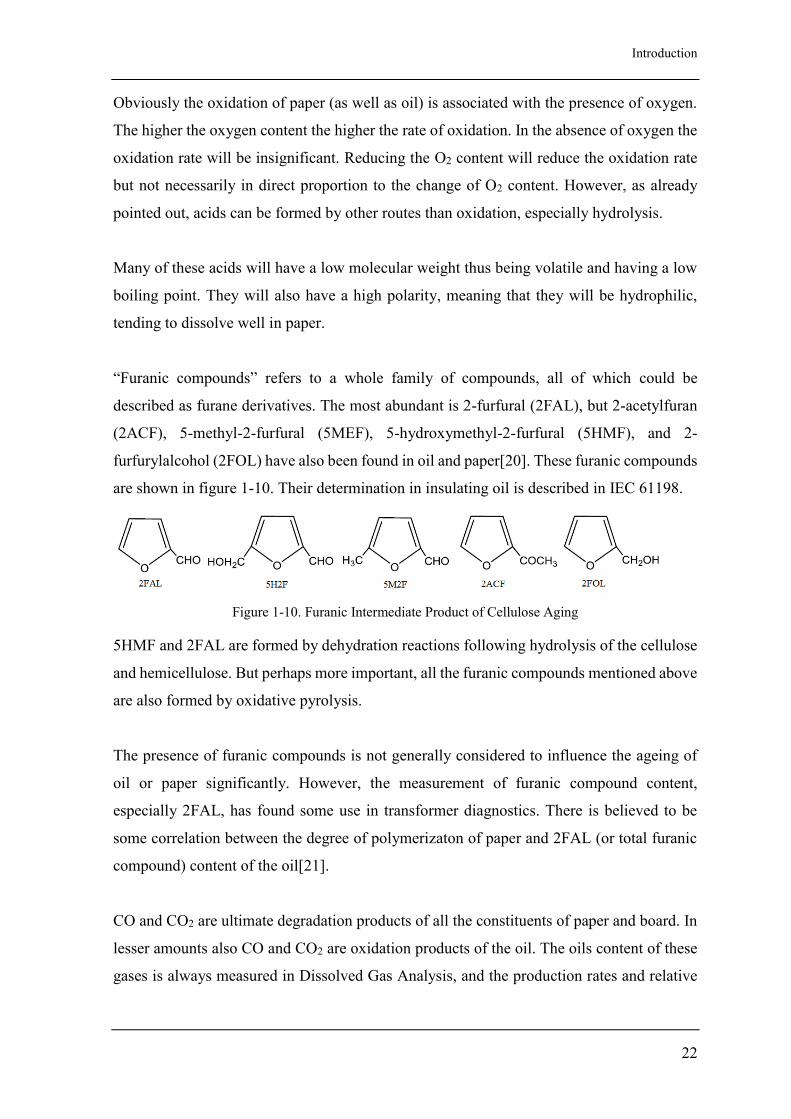
“Furanic compounds” refers to a whole family of compounds, all of which could be
described as furane derivatives. The most abundant is 2-furfural (2FAL), but 2-acetylfuran
(2ACF), 5-methyl-2-furfural (5MEF), 5-hydroxymethyl-2-furfural (5HMF), and 2-
furfurylalcohol (2FOL) have also been found in oil and paper[20]. These furanic compounds
are shown in figure 1-10. Their determination in insulating oil is described in IEC 61198.
Figure 1-10. Furanic Intermediate Product of Cellulose Aging
5HMF and 2FAL are formed by dehydration reactions following hydrolysis of the cellulose
and hemicellulose. But perhaps more important, all the furanic compounds mentioned above
are also formed by oxidative pyrolysis.
The presence of furanic compounds is not generally considered to influence the ageing of
oil or paper significantly. However, the measurement of furanic compound content,
especially 2FAL, has found some use in transformer diagnostics. There is believed to be
some correlation between the degree of polymerizaton of paper and 2FAL (or total furanic
compound) content of the oil[21].
CO and CO2 are ultimate degradation products of all the constituents of paper and board. In
lesser amounts also CO and CO2 are oxidation products of the oil. The oils content of these
gases is always measured in Dissolved Gas Analysis, and the production rates and relative
Introduction
23
amounts of CO2 and CO are used in the interpretation of the results. Very high CO2 contents
from paper degradation may influence the acidity of the oil, and may thus complicate the
assessment of oil condition.
2) Aging Process of Polyester
The three layers of DMD are all made up from polyester(PET) macromolecular compound.
The PET fibers on the outside layer has a non-woven loose and porous structure and are the
weakest link in DMD paper. Therefore, the long-term behavior of DMD is directly restrained
by the PET fiber condition. PET macromolecules would degrade in different ways under
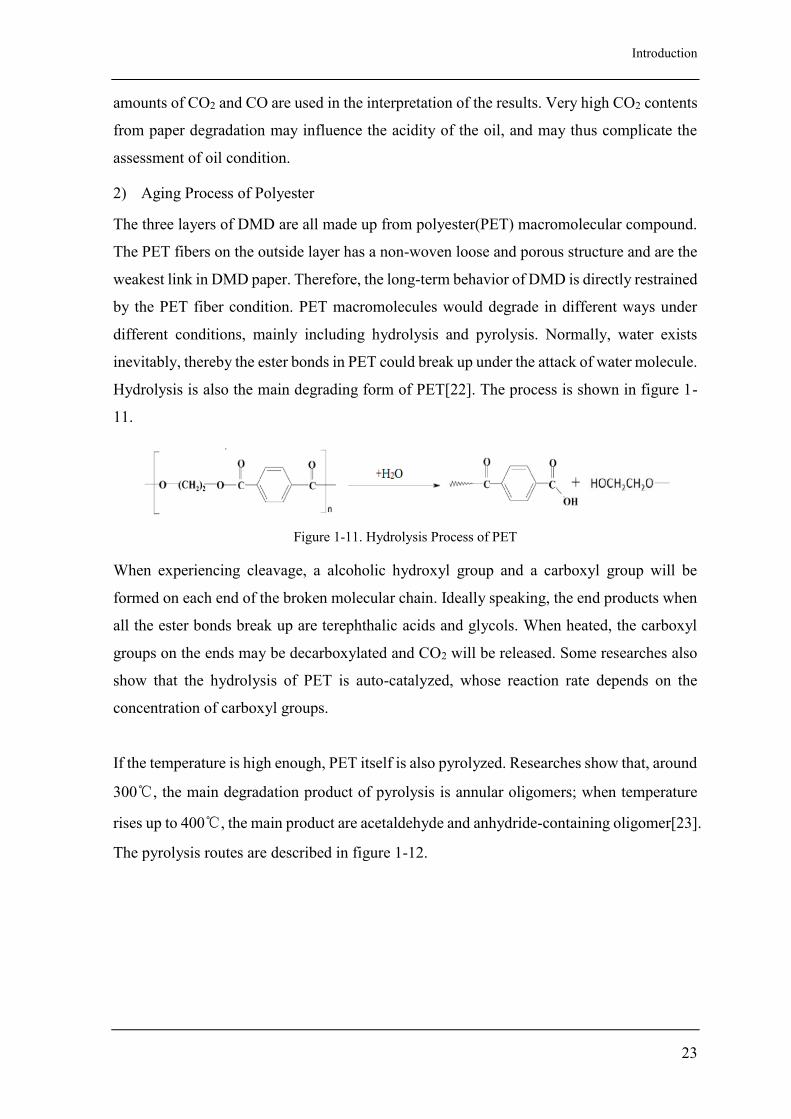
different conditions, mainly including hydrolysis and pyrolysis. Normally, water exists
inevitably, thereby the ester bonds in PET could break up under the attack of water molecule.
Hydrolysis is also the main degrading form of PET[22]. The process is shown in figure 1-
11.
Figure 1-11. Hydrolysis Process of PET
When experiencing cleavage, a alcoholic hydroxyl group and a carboxyl group will be
formed on each end of the broken molecular chain. Ideally speaking, the end products when
all the ester bonds break up are terephthalic acids and glycols. When heated, the carboxyl
groups on the ends may be decarboxylated and CO2 will be released. Some researches also
show that the hydrolysis of PET is auto-catalyzed, whose reaction rate depends on the
concentration of carboxyl groups.
If the temperature is high enough, PET itself is also pyrolyzed. Researches show that, around
300℃, the main degradation product of pyrolysis is annular oligomers; when temperature
rises up to 400℃, the main product are acetaldehyde and anhydride-containing oligomer[23].
The pyrolysis routes are described in figure 1-12.
Introduction
24
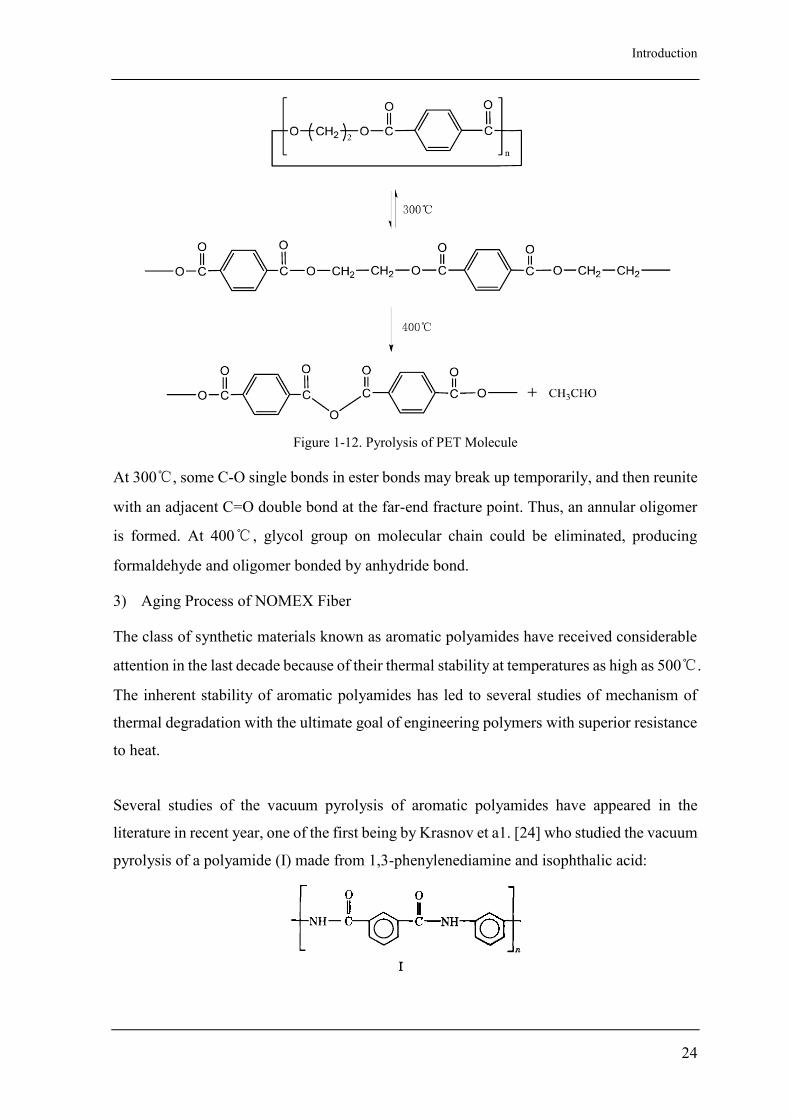
Figure 1-12. Pyrolysis of PET Molecule
At 300℃, some C-O single bonds in ester bonds may break up temporarily, and then reunite
with an adjacent C=O double bond at the far-end fracture point. Thus, an annular oligomer
is formed. At 400℃ , glycol group on molecular chain could be eliminated, producing
formaldehyde and oligomer bonded by anhydride bond.
3) Aging Process of NOMEX Fiber
The class of synthetic materials known as aromatic polyamides have received considerable
attention in the last decade because of their thermal stability at temperatures as high as 500℃.
The inherent stability of aromatic polyamides has led to several studies of mechanism of
thermal degradation with the ultimate goal of engineering polymers with superior resistance
to heat.
Several studies of the vacuum pyrolysis of aromatic polyamides have appeared in the
literature in recent year, one of the first being by Krasnov et a1. [24] who studied the vacuum
pyrolysis of a polyamide (I) made from 1,3-phenylenediamine and isophthalic acid:
Introduction
25
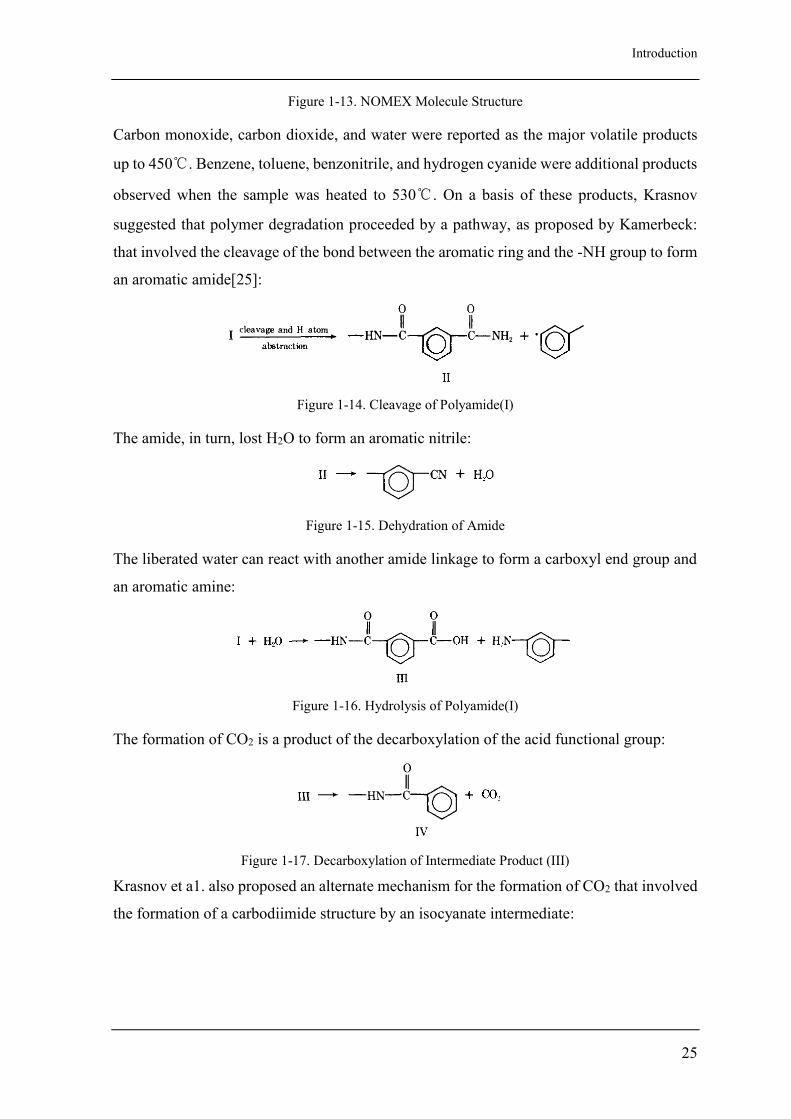
Figure 1-13. NOMEX Molecule Structure
Carbon monoxide, carbon dioxide, and water were reported as the major volatile products
up to 450℃. Benzene, toluene, benzonitrile, and hydrogen cyanide were additional products
observed when the sample was heated to 530℃. On a basis of these products, Krasnov
suggested that polymer degradation proceeded by a pathway, as proposed by Kamerbeck:
that involved the cleavage of the bond between the aromatic ring and the -NH group to form
an aromatic amide[25]:
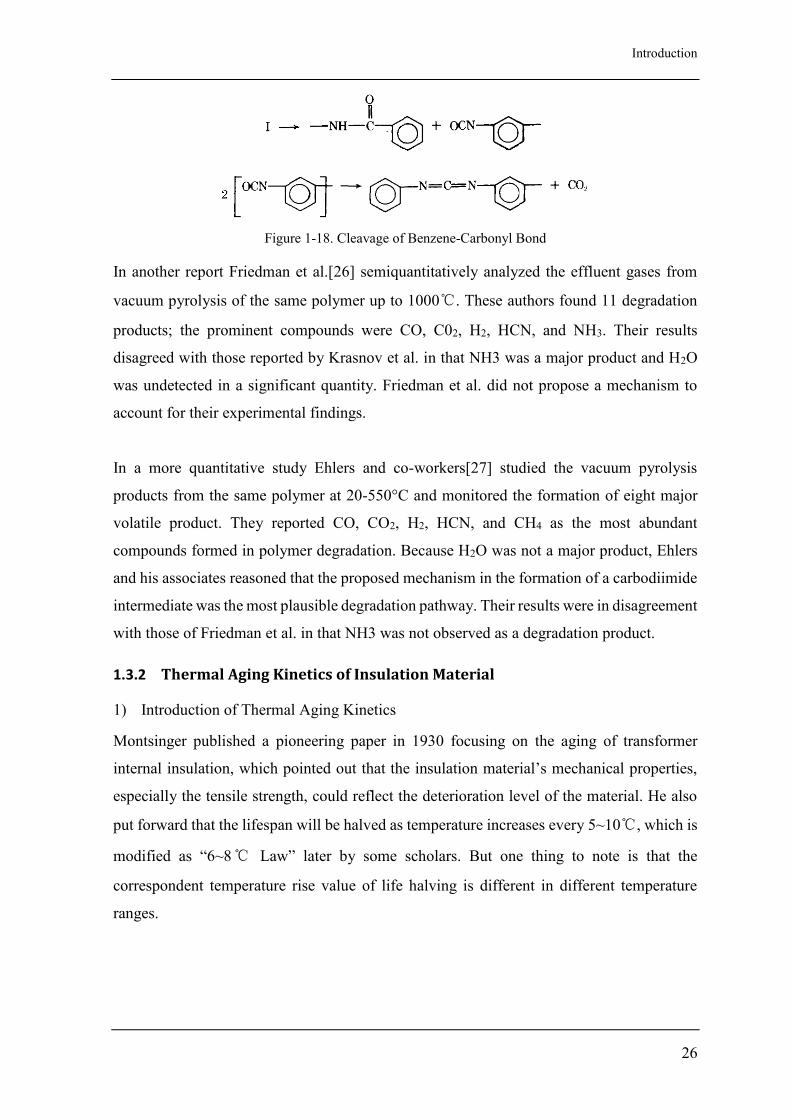
Figure 1-14. Cleavage of Polyamide(I)
The amide, in turn, lost H2O to form an aromatic nitrile:
Figure 1-15. Dehydration of Amide
The liberated water can react with another amide linkage to form a carboxyl end group and
an aromatic amine:
Figure 1-16. Hydrolysis of Polyamide(I)
The formation of CO2 is a product of the decarboxylation of the acid functional group:
Figure 1-17. Decarboxylation of Intermediate Product (III)
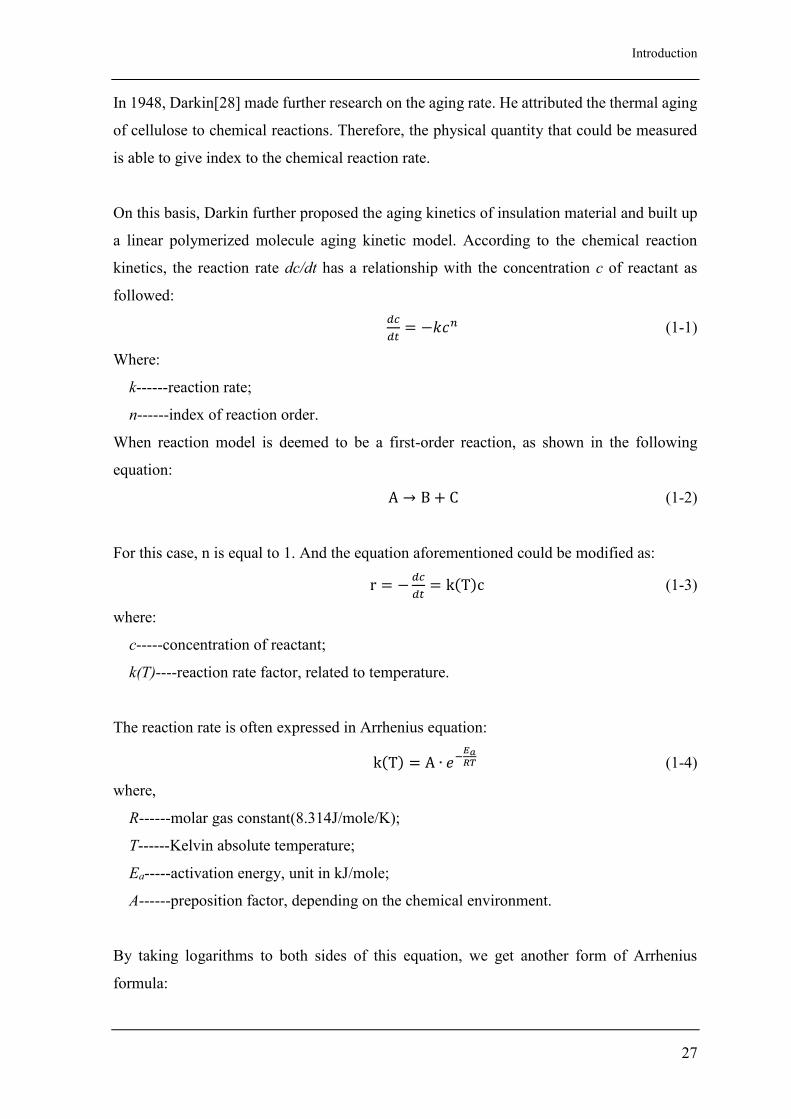
Krasnov et a1. also proposed an alternate mechanism for the formation of CO2 that involved
the formation of a carbodiimide structure by an isocyanate intermediate:
Introduction
26
Figure 1-18. Cleavage of Benzene-Carbonyl Bond
In another report Friedman et al.[26] semiquantitatively analyzed the effluent gases from
vacuum pyrolysis of the same polymer up to 1000℃. These authors found 11 degradation
products; the prominent compounds were CO, C02, H2, HCN, and NH3. Their results
disagreed with those reported by Krasnov et al. in that NH3 was a major product and H2O
was undetected in a significant quantity. Friedman et al. did not propose a mechanism to
account for their experimental findings.
In a more quantitative study Ehlers and co-workers[27] studied the vacuum pyrolysis
products from the same polymer at 20-550°C and monitored the formation of eight major
volatile product. They reported CO, CO2, H2, HCN, and CH4 as the most abundant
compounds formed in polymer degradation. Because H2O was not a major product, Ehlers
and his associates reasoned that the proposed mechanism in the formation of a carbodiimide
intermediate was the most plausible degradation pathway. Their results were in disagreement
with those of Friedman et al. in that NH3 was not observed as a degradation product.
1.3.2 Thermal Aging Kinetics of Insulation Material
1) Introduction of Thermal Aging Kinetics
Montsinger published a pioneering paper in 1930 focusing on the aging of transformer
internal insulation, which pointed out that the insulation material’s mechanical properties,
especially the tensile strength, could reflect the deterioration level of the material. He also
put forward that the lifespan will be halved as temperature increases every 5~10℃, which is
modified as “6~8℃ Law” later by some scholars. But one thing to note is that the
correspondent temperature rise value of life halving is different in different temperature
ranges.
Introduction
27
In 1948, Darkin[28] made further research on the aging rate. He attributed the thermal aging
of cellulose to chemical reactions. Therefore, the physical quantity that could be measured
is able to give index to the chemical reaction rate.
On this basis, Darkin further proposed the aging kinetics of insulation material and built up
a linear polymerized molecule aging kinetic model. According to the chemical reaction
kinetics, the reaction rate dc/dt has a relationship with the concentration c of reactant as
followed:
𝑑𝑐
𝑑𝑡= −𝑘𝑐𝑛 (1-1)
Where:
k------reaction rate;
n------index of reaction order.
When reaction model is deemed to be a first-order reaction, as shown in the following
equation:
A → B + C (1-2)
For this case, n is equal to 1. And the equation aforementioned could be modified as:
r = −𝑑𝑐
𝑑𝑡= k(T)c (1-3)
where:
c-----concentration of reactant;
k(T)----reaction rate factor, related to temperature.
The reaction rate is often expressed in Arrhenius equation:
k(T) = A ∙ 𝑒−𝐸𝑎𝑅𝑇 (1-4)
where,
R------molar gas constant(8.314J/mole/K);
T------Kelvin absolute temperature;
Ea-----activation energy, unit in kJ/mole;
A------preposition factor, depending on the chemical environment.
By taking logarithms to both sides of this equation, we get another form of Arrhenius
formula:
Introduction
28
ln(k) = ln(A) −𝐸𝑎
𝑅∙
1
𝑇 (1-5)
Simplified as:
ln(k) = 𝑎 −𝑏
𝑅 (1-6)
2) Aging Kinetics of Insulation Paper
As ageing proceeds the molecular weight and DP of the cellulose is reduced due to molecular
cellulose chains being cut. The relation between the chain scissions (η) and measured DP
is[29]:
η =𝐷𝑃0
𝐷𝑃𝑡− 1 (1-7)
DP0 is the initial degree of polymerisation and DPt is value after an ageing period t. Most
analyses of degradation have been based on the work of Kuhn and co-workers in 1930, which
was extended by Ekenstam in 1936 to relate rates of degradation to DP. Ekenstam considered
random, first order chain scission and showed a direct relationship of reciprocal DP with
time and that this relation combined with the Arrhenius equation to include temperature
dependence can be mathematically expressed as:
1
𝐷𝑃𝑡−
1
𝐷𝑃0= A ∙ 𝑒−
𝐸𝑎𝑅𝑇 ∙ 𝑡 (1-8)
1
𝐷𝑃0(
𝐷𝑃0
𝐷𝑃𝑡− 1) = 𝐴 ∙ 𝑒−
𝐸𝑎𝑅𝑇 ∙ 𝑡 (1-9)
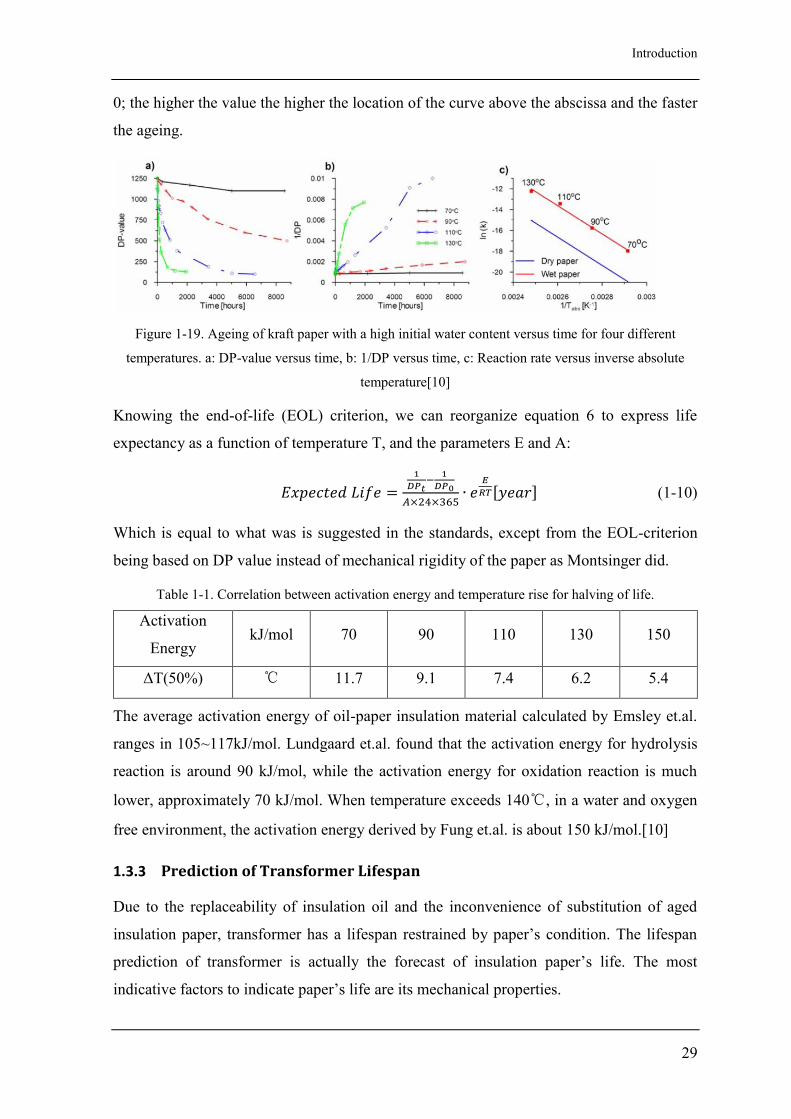
So from several reasons it is convenient to focus on changes in the DP value or the rate at
which chain scissions occur. The equation above can be explained and supported by the
following procedure and considerations[10] : If we instead of plotting DP vs. time as shown
in Figure 1-19(a), plots 1/DP as shown in Figure 1-19(b) we get fairly straight lines, showing
that the rate of change (k) is quite linear over time up to a certain value of 1/DP. This is in
accordance with a model saying that Δη/Δt = k, which is a first order reaction rate model.
Plotting the natural logarithm of k vs. 1/T gives straight lines as would be the case for a
thermally activated process described in an Arrhenius plot. In equation 8 it is the value of Ea
describes the slope of the curve in Figure 1-19(c); the higher this value is the more
temperature dependent will the reaction rate be (steeper curve). Table 1 shows how the
activation energy is related to the temperature increase giving a 50% life reduction: Chemists
prefer to relate the energy to joule per mole, while physicists use eV per molecule. In
principle the A-values determine the intercept of the curves in 14c with a virtual Y-axis from
Introduction
29
0; the higher the value the higher the location of the curve above the abscissa and the faster
the ageing.
Figure 1-19. Ageing of kraft paper with a high initial water content versus time for four different
temperatures. a: DP-value versus time, b: 1/DP versus time, c: Reaction rate versus inverse absolute
temperature[10]
Knowing the end-of-life (EOL) criterion, we can reorganize equation 6 to express life
expectancy as a function of temperature T, and the parameters E and A:
𝐸𝑥𝑝𝑒𝑐𝑡𝑒𝑑 𝐿𝑖𝑓𝑒 =
1
𝐷𝑃𝑡−
1
𝐷𝑃0
𝐴×24×365∙ 𝑒
𝐸
𝑅𝑇[𝑦𝑒𝑎𝑟] (1-10)
Which is equal to what was is suggested in the standards, except from the EOL-criterion
being based on DP value instead of mechanical rigidity of the paper as Montsinger did.
Table 1-1. Correlation between activation energy and temperature rise for halving of life.
Activation
Energy kJ/mol 70 90 110 130 150
ΔT(50%) ℃ 11.7 9.1 7.4 6.2 5.4
The average activation energy of oil-paper insulation material calculated by Emsley et.al.
ranges in 105~117kJ/mol. Lundgaard et.al. found that the activation energy for hydrolysis
reaction is around 90 kJ/mol, while the activation energy for oxidation reaction is much
lower, approximately 70 kJ/mol. When temperature exceeds 140℃, in a water and oxygen
free environment, the activation energy derived by Fung et.al. is about 150 kJ/mol.[10]
1.3.3 Prediction of Transformer Lifespan
Due to the replaceability of insulation oil and the inconvenience of substitution of aged
insulation paper, transformer has a lifespan restrained by paper’s condition. The lifespan
prediction of transformer is actually the forecast of insulation paper’s life. The most
indicative factors to indicate paper’s life are its mechanical properties.
Introduction
30
From the aforementioned paper aging kinetics, we can observe that the direct parameter that
represents the polymerization strength is DP value. As paper ages, the chain scissions will
lead to the decrease of DP value. The initial DP value of cellulose in pulp ranges in
1300~1400, which afterwards drops to around 1200 through the kraft process. Generally
speaking, when DP of cellulose declines to 200, cellulose insulation paper is considered to
reach the end of its life[30]. The measurement of DP value is based on four kinds of
molecular weight definitions: number-averaged DP(DPn), weight-averaged DP(DPw), Z-
averaged DP(DPz) and viscosity-averaged DP(DPv) respectively[31]. Strictly speaking, any
DP value should be denoted with the correspondent molecular weight estimation type.
Considering the measurement speed and economy, the most widespread determination
method is viscosity measurement, that is measuring DPv. Polymer materials(like cellulose)
are dissolved by some particular solvents, and the viscosity of that solution is proportional
to the volume(length) and the concentration of macromolecular chain. The DP value of
polymer material could be converted by the measurement of viscosity. The solvent often
used to dissolve polymer materials is (CUEN), which is totally able to dissolve cellulose.
However, thanks to the chemical robustness and stability of NOMEX fibers, NOMEX paper
could hardly be dissolved by most solvents. Therefore, the determination of DP value of
NOMEX is not easy to fulfil.
DP value is the parameter to reflect the degrading condition of insulation paper from a
microscopic structural point view, while the parameter which most directly represents the
mechanical strength macroscopically is tensile strength and other mechanical properties.
Hence, tensile strength is also usually taken to indicate the level of paper deterioration. A
50% retained tensile strength is generally accepted as corresponded to the DP value of 200.
Paper will become quite brittle and unsuitable for further operation when its tensile strength
drops below 50% of the initial value. This retention is always utilized as the paper end-life
criteria[32].
The simultaneous sampling of insulation paper when transformer is running is very hard to
fulfil. And some indirect quantitative ways to interpret paper operation condition based on
the analysis of paper aging intermediate products are proposed. Among the different methods,
the most deeply carried-out methods are furan compounds and DGA analysis.
Introduction
31
Furan compounds could be formed as cellulose degrades. A high furan compound content is
an indicator of transformer over-temperature fault. Some researchers have established
relationships between furan compounds content and DP value, and expressed in formulas.
The formulas raised up by Chendong and De Pablo et.al. are most representative. Researches
on the comparisons between the furan compounds generated by Kraft paper and that by TUK
paper showed that TUK paper has lower furan compounds yield.
DGA analysis working as an effective transformer condition interpretation method has been
implemented for several years. The interpretation is achieved by measuring the contents of
hydrocarbon and carbon oxide gases in oil and by determining their relevant relationship.
Abundant experimental results and on-site experiences manifest that the degradation of
insulation paper will lead to a sharp increase in carbon oxide gases in oil[33]. Therefore, the
carbon oxide gases are treated as prime indicator on the level of paper degradation. Due to
the potential possibility of external intrusion of CO2 from the atmosphere, although it could
also be generated by paper aging, the most indicative gas for determination of paper
condition is CO. In transformer, the normal ration of CO2 over CO is lower than 7. Once this
ratio increases sharply, the insulation paper would be experiencing severe aging. Large
portion of CO content(for example, more than 30% of total carbon oxide gases) would
definitely be a sign of insulation paper over-temperature fault.
1.4 Research Status of Vegetable Oil Impregnated
Insulation System
1.4.1 Characteristics of Vegetable Oil
The main component of vegetable oils, also called as natural esters, is triglycerides extracted
from natural seeds, comprising more than 95% portion of vegetable oil. There are also
diglycerides, monoglycerides, glycerin and some fatty acids existing in the vegetable oil[34].
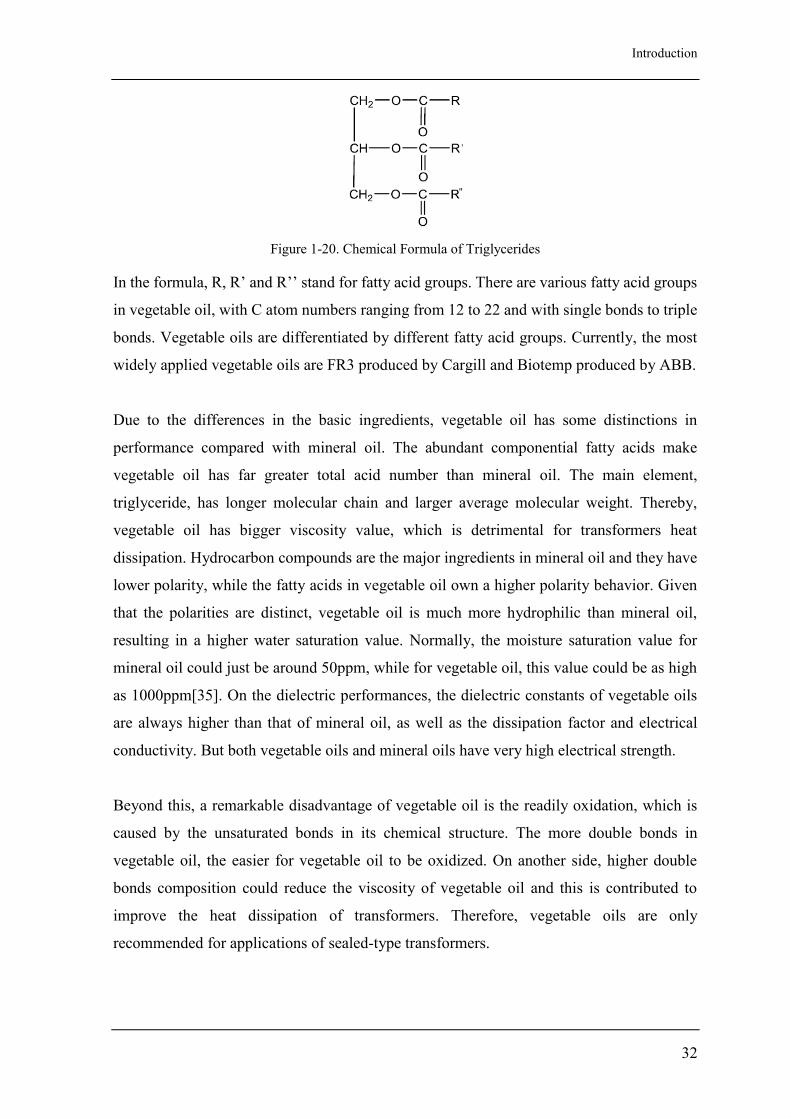
Triglycerides have a common chemical structure as showed in figure 1-20.
Introduction
32
Figure 1-20. Chemical Formula of Triglycerides
In the formula, R, R’ and R’’ stand for fatty acid groups. There are various fatty acid groups
in vegetable oil, with C atom numbers ranging from 12 to 22 and with single bonds to triple
bonds. Vegetable oils are differentiated by different fatty acid groups. Currently, the most
widely applied vegetable oils are FR3 produced by Cargill and Biotemp produced by ABB.
Due to the differences in the basic ingredients, vegetable oil has some distinctions in
performance compared with mineral oil. The abundant componential fatty acids make
vegetable oil has far greater total acid number than mineral oil. The main element,
triglyceride, has longer molecular chain and larger average molecular weight. Thereby,
vegetable oil has bigger viscosity value, which is detrimental for transformers heat
dissipation. Hydrocarbon compounds are the major ingredients in mineral oil and they have
lower polarity, while the fatty acids in vegetable oil own a higher polarity behavior. Given
that the polarities are distinct, vegetable oil is much more hydrophilic than mineral oil,
resulting in a higher water saturation value. Normally, the moisture saturation value for
mineral oil could just be around 50ppm, while for vegetable oil, this value could be as high
as 1000ppm[35]. On the dielectric performances, the dielectric constants of vegetable oils
are always higher than that of mineral oil, as well as the dissipation factor and electrical
conductivity. But both vegetable oils and mineral oils have very high electrical strength.
Beyond this, a remarkable disadvantage of vegetable oil is the readily oxidation, which is
caused by the unsaturated bonds in its chemical structure. The more double bonds in
vegetable oil, the easier for vegetable oil to be oxidized. On another side, higher double
bonds composition could reduce the viscosity of vegetable oil and this is contributed to
improve the heat dissipation of transformers. Therefore, vegetable oils are only
recommended for applications of sealed-type transformers.
Introduction
33
The high viscosity and poor anti-oxidation performance could be compensated by
optimization design of transformer insulation system, and brilliant high fire and flash points
and readily biodegradable performances have also propelled vegetable oil filled transformers
to be widely installed in distribution power grid since 2000. According to some reports, until
2009, more than 45,000 transformers have adopted vegetable oil as liquid insulation
material[36].
1.4.2 Thermal Aging Researches on Vegetable Oil Impregnated Insulation Paper
As new alternative insulation liquids, assessments and evaluations of long-term condition of
vegetable oils must be performed before formal operation. Long time working lifespan is
usually guaranteed under normal working temperature. In order to shorten the time duration,
thermally accelerated experiments are usually performed on new insulation materials. To be
more specific, commonly used accelerated aging methods are: Sealed Tube Aging(IEC
62332-2[37]), Functional Life Aging, namely Lockie Method(IEEE C57.100[38]) and Dual
Temperature Model(IEC 62332-1[39]).
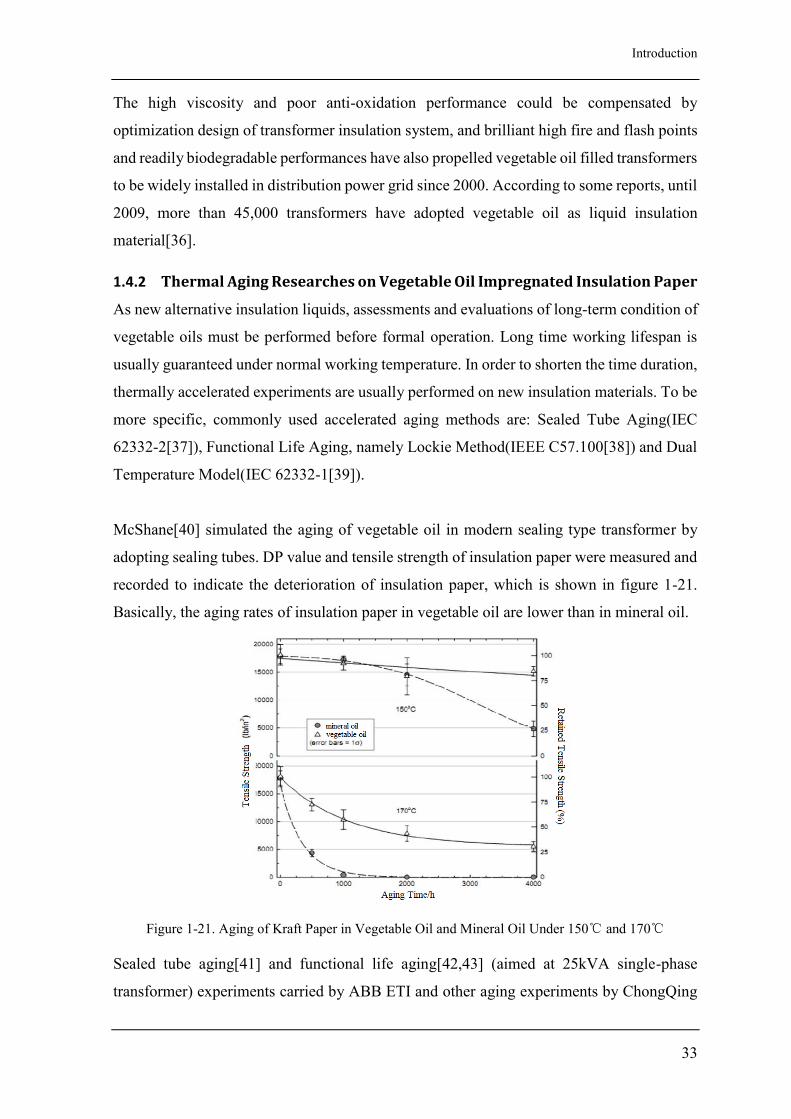
McShane[40] simulated the aging of vegetable oil in modern sealing type transformer by
adopting sealing tubes. DP value and tensile strength of insulation paper were measured and
recorded to indicate the deterioration of insulation paper, which is shown in figure 1-21.
Basically, the aging rates of insulation paper in vegetable oil are lower than in mineral oil.
Figure 1-21. Aging of Kraft Paper in Vegetable Oil and Mineral Oil Under 150℃ and 170℃
Sealed tube aging[41] and functional life aging[42,43] (aimed at 25kVA single-phase
transformer) experiments carried by ABB ETI and other aging experiments by ChongQing
Introduction
34
University[44], Stuttgart University[45] and DuPont[46] all exhibit that vegetable oil could
retard the aging speed of insulation paper, while the transformer hot spot temperature using
vegetable oil could be 15℃ higher than that of mineral oil.
Some explanations are given by researchers to explain this phenomenon:
ABB experts ascribe the paper life prolonging effect to the dynamic moisture equilibrium
between oil and paper. Due to the higher hydrophilia of vegetable oil, the moisture balance
will move more to oil rather than paper, lowering the water content in paper and thereby the
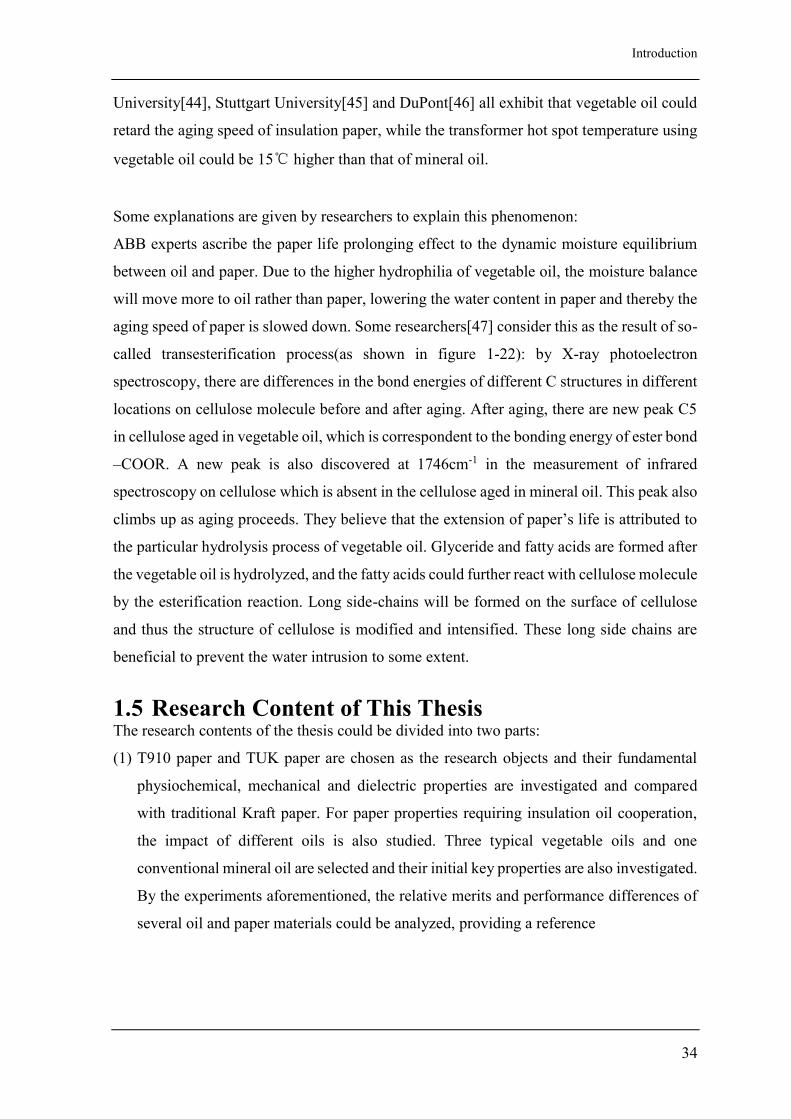
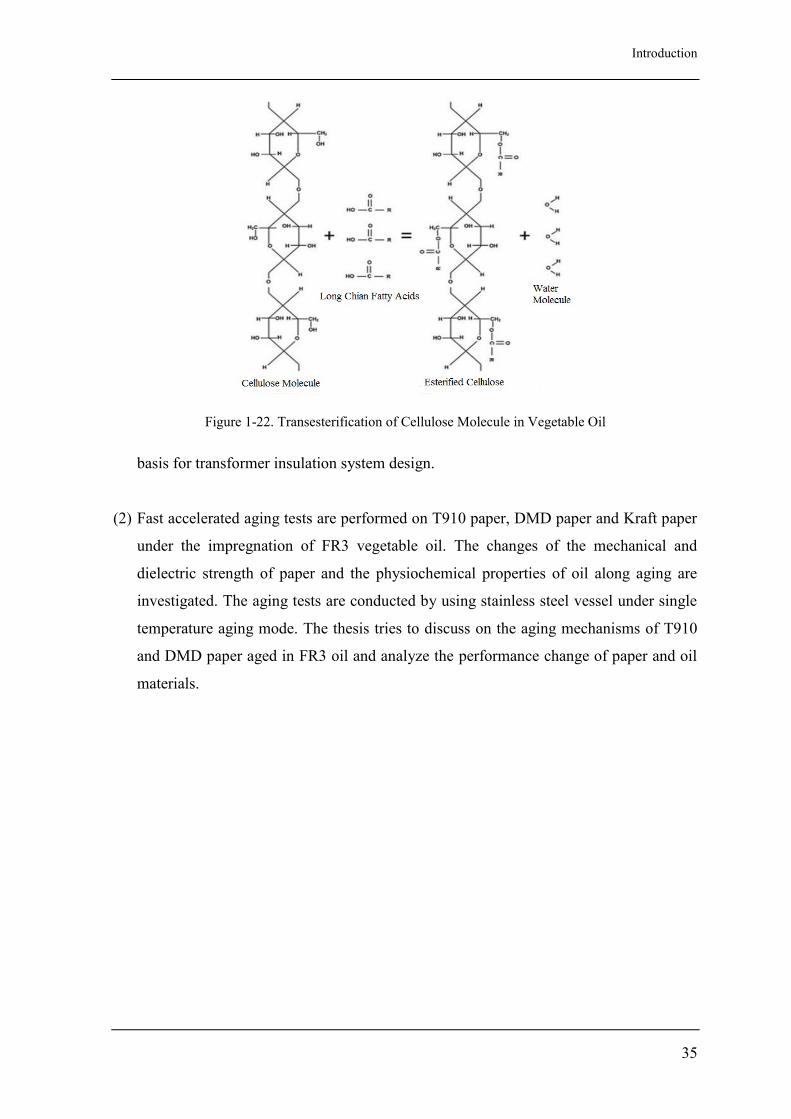
aging speed of paper is slowed down. Some researchers[47] consider this as the result of so-
called transesterification process(as shown in figure 1-22): by X-ray photoelectron
spectroscopy, there are differences in the bond energies of different C structures in different
locations on cellulose molecule before and after aging. After aging, there are new peak C5
in cellulose aged in vegetable oil, which is correspondent to the bonding energy of ester bond
–COOR. A new peak is also discovered at 1746cm-1 in the measurement of infrared
spectroscopy on cellulose which is absent in the cellulose aged in mineral oil. This peak also
climbs up as aging proceeds. They believe that the extension of paper’s life is attributed to
the particular hydrolysis process of vegetable oil. Glyceride and fatty acids are formed after
the vegetable oil is hydrolyzed, and the fatty acids could further react with cellulose molecule
by the esterification reaction. Long side-chains will be formed on the surface of cellulose
and thus the structure of cellulose is modified and intensified. These long side chains are
beneficial to prevent the water intrusion to some extent.
1.5 Research Content of This Thesis The research contents of the thesis could be divided into two parts:
(1) T910 paper and TUK paper are chosen as the research objects and their fundamental
physiochemical, mechanical and dielectric properties are investigated and compared
with traditional Kraft paper. For paper properties requiring insulation oil cooperation,
the impact of different oils is also studied. Three typical vegetable oils and one
conventional mineral oil are selected and their initial key properties are also investigated.
By the experiments aforementioned, the relative merits and performance differences of
several oil and paper materials could be analyzed, providing a reference
Introduction
35
Figure 1-22. Transesterification of Cellulose Molecule in Vegetable Oil
basis for transformer insulation system design.
(2) Fast accelerated aging tests are performed on T910 paper, DMD paper and Kraft paper
under the impregnation of FR3 vegetable oil. The changes of the mechanical and
dielectric strength of paper and the physiochemical properties of oil along aging are
investigated. The aging tests are conducted by using stainless steel vessel under single
temperature aging mode. The thesis tries to discuss on the aging mechanisms of T910
and DMD paper aged in FR3 oil and analyze the performance change of paper and oil
materials.
Experimental Design of High-Temperature Resistant Insulation Materials Property Comparison and Thermal Aging
36
2 Experimental Design of High-Temperature Resistant
Insulation Materials Property Comparison and
Thermal Aging
2.1 Materials and Test Parameters of Property
Comparison
In this part, the thesis chooses several typical high-temperature resistant oil and paper
materials as research objects. Kraft paper, TUK paper and T910 paper are included as paper
material candidates. Kraft paper is produced by Sanmu Manufacturer and is mechanically
strengthened for power transformer use; T910 paper is produced by DuPont; TUK paper is
produced by Ruitai Insulation Material Manufacturer and is a type of DDP(diamond dot)
pattern. For Kraft and T910 paper, they have three thickness specifications: 0.08mm,
0.13mm and 0.18mm, while TUK paper only has 0.08mm thickness.
Oil materials included in the experiments are Karamay #45 produced by China CNPC, FR3
produced by US Cargill, Vinsoil produced by China NARI and EBF#2 produced by US
DuPont. Karamay #45 is a kind of common-used pour point improved mineral oil, whose
pour point could be as low as -45℃. FR3, Vinsoil and EBF#2 are three vegetable oils based
on different vegetable seeds. The general descriptions on typical properties of Karamay #45
mineral oil and FR3 and Vinsoil vegetable oils are shown in table 2-1.
Table 2-1 Comparisons on Typical Properties of Karamay, FR3 and Vinsoil Transformer Oil
Typical Property Karamay#45 Mineral Oil FR3 NARI Vinsoil
color transparent light green light yellow
chemical type hydrocarbon ester ester
gravity at 25℃ 0.89 0.92 0.92
viscosity at 40℃ (cSt) 9.7 36 32.4
pour point(℃) -42 -21 -16
interfacial tension
(dynes/cm) 45 24 30
flash point(closed)(℃) 142 319 331
water content(ppm) 20 56.5 142
tan δ(at 90℃) 0.0009 0.03 0.0201
breakdown voltage(kV) 55 54.4 57
total acid number (mg 0.009 0.03 0.01
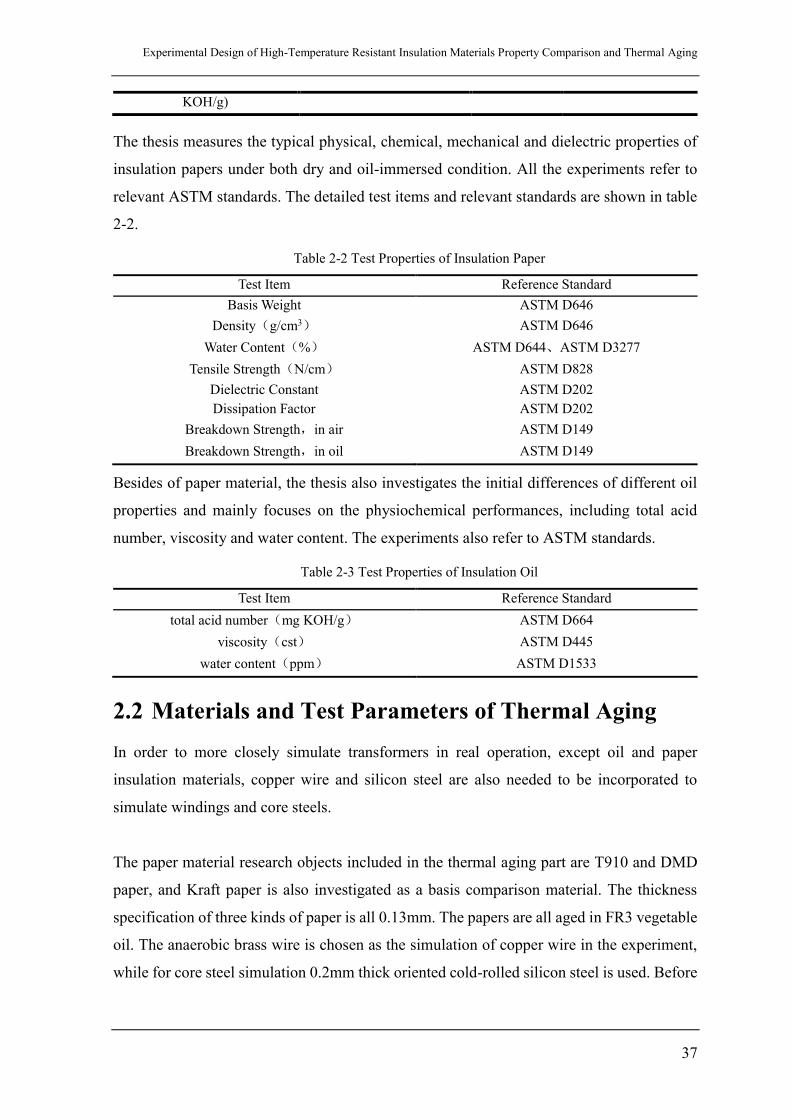
Experimental Design of High-Temperature Resistant Insulation Materials Property Comparison and Thermal Aging
37
KOH/g)
The thesis measures the typical physical, chemical, mechanical and dielectric properties of
insulation papers under both dry and oil-immersed condition. All the experiments refer to
relevant ASTM standards. The detailed test items and relevant standards are shown in table
2-2.
Table 2-2 Test Properties of Insulation Paper
Test Item Reference Standard
Basis Weight ASTM D646
Density(g/cm3) ASTM D646
Water Content(%) ASTM D644、ASTM D3277
Tensile Strength(N/cm) ASTM D828
Dielectric Constant ASTM D202
Dissipation Factor ASTM D202
Breakdown Strength,in air ASTM D149
Breakdown Strength,in oil ASTM D149
Besides of paper material, the thesis also investigates the initial differences of different oil
properties and mainly focuses on the physiochemical performances, including total acid
number, viscosity and water content. The experiments also refer to ASTM standards.
Table 2-3 Test Properties of Insulation Oil
Test Item Reference Standard
total acid number(mg KOH/g) ASTM D664
viscosity(cst) ASTM D445
water content(ppm) ASTM D1533
2.2 Materials and Test Parameters of Thermal Aging
In order to more closely simulate transformers in real operation, except oil and paper
insulation materials, copper wire and silicon steel are also needed to be incorporated to
simulate windings and core steels.
The paper material research objects included in the thermal aging part are T910 and DMD
paper, and Kraft paper is also investigated as a basis comparison material. The thickness
specification of three kinds of paper is all 0.13mm. The papers are all aged in FR3 vegetable
oil. The anaerobic brass wire is chosen as the simulation of copper wire in the experiment,
while for core steel simulation 0.2mm thick oriented cold-rolled silicon steel is used. Before
Experimental Design of High-Temperature Resistant Insulation Materials Property Comparison and Thermal Aging
38
aging, the brass wire and silicon steel are all polished by 2000 mesh sandpapers to eradicate
the surface oxidized layer.
The determination of four aging components’ ratio should be under the reference to real
portions in transformers. Here, the recommended material ratio in IEC 62332-2 aging
standard is referred. Concerning about the volume of aging vessel and the thermal expansion
of insulation oil, the four components’ ratio is set as volume of oil : weight of paper : surface
area of copper wire : surface of silicon steel=2L: 95.4g: 8cm2:42.6cm2.
The aging vessels are made up by stainless steel, which is a cylinder with a volume of 2.375L.
The cylinder is sealed by fluorine apron which is resistant to 190℃.The vessel has three
valves on the top, functioning as vacuuming, nitrogen injection and oil injection/sampling
respectively. On account of the fact that the vessel and valves have to be operated under high
temperature for a long term, the sealability and temperature resistance are highly demanded.
In the experiments, American company Swagelok’s SS-6BW type bellows seal valves are
used, which has very high temperature, oil and corrosion resistances and high sealability.
In order to exclude the impacts of oxygen and water in the environment on the aging process,
a nitrogen protective blanket is inserted into the head space of the vessel. The material
assembly and condition controlling process is as following: solid materials are placed inside
the vessel and the vessel is sealed first, then open the vacuum valve to vacuum the vessel
and inject oil through oil valve under vacuum condition. Close the vacuum and oil valves
and open the nitrogen valve to insert a nitrogen blanket. After the materials are aged to
required time durations, the internal nitrogen is compressed and thus the pressure increases.
Therefore, at such sampling nodes, oil sampling valve is open first and some oil sample
would be extruded out. After the inner and outer pressures are balanced, nitrogen is filled in
to extrude more oil samples. After oil is sampled, the vessel is opened and paper materials
are taken out.
The temperature in the aging experiments has a decisive impact on the aging process.
According to IEC 60126.4[48], the temperature fluctuation of aging ovens in the range of
80°C to 180°C should not exceed 5°C. Ovens used in the thesis meet the requirement,
confirmed by infrared thermometry measurement.
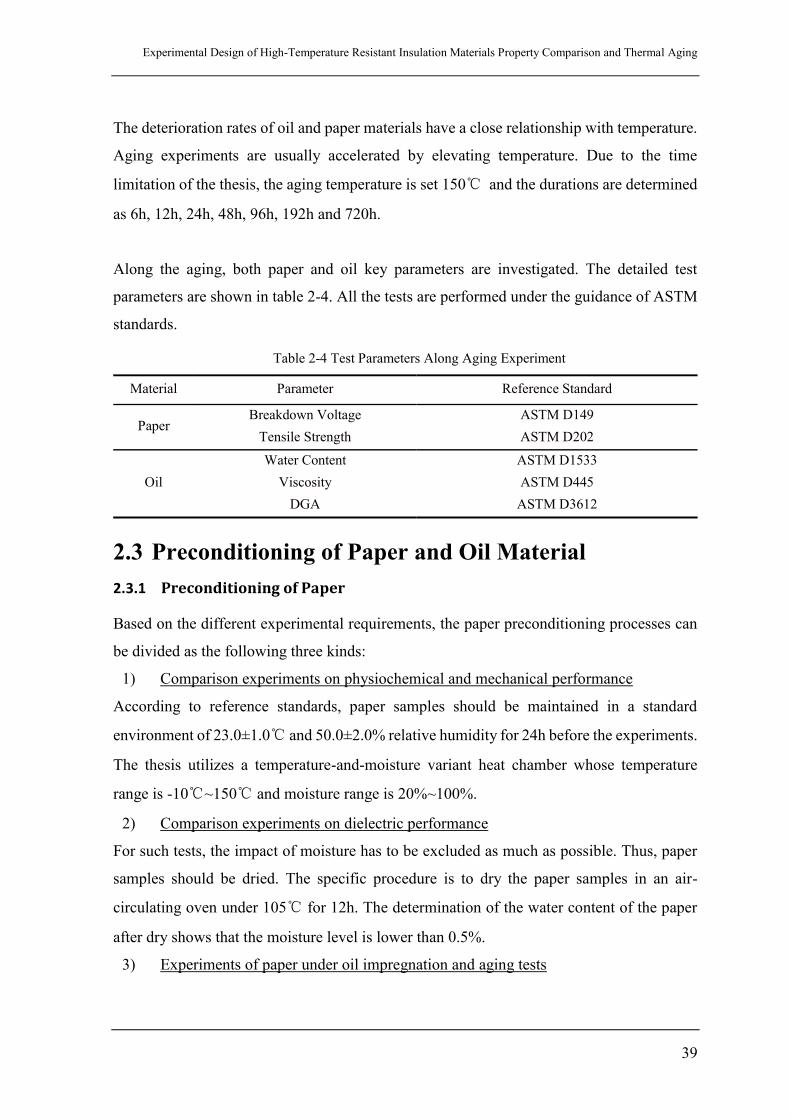
Experimental Design of High-Temperature Resistant Insulation Materials Property Comparison and Thermal Aging
39
The deterioration rates of oil and paper materials have a close relationship with temperature.
Aging experiments are usually accelerated by elevating temperature. Due to the time
limitation of the thesis, the aging temperature is set 150℃ and the durations are determined
as 6h, 12h, 24h, 48h, 96h, 192h and 720h.
Along the aging, both paper and oil key parameters are investigated. The detailed test
parameters are shown in table 2-4. All the tests are performed under the guidance of ASTM
standards.
Table 2-4 Test Parameters Along Aging Experiment
Material Parameter Reference Standard
Paper Breakdown Voltage ASTM D149
Tensile Strength ASTM D202
Oil
Water Content ASTM D1533
Viscosity ASTM D445
DGA ASTM D3612
2.3 Preconditioning of Paper and Oil Material
2.3.1 Preconditioning of Paper
Based on the different experimental requirements, the paper preconditioning processes can
be divided as the following three kinds:
1) Comparison experiments on physiochemical and mechanical performance
According to reference standards, paper samples should be maintained in a standard
environment of 23.0±1.0℃ and 50.0±2.0% relative humidity for 24h before the experiments.
The thesis utilizes a temperature-and-moisture variant heat chamber whose temperature
range is -10℃~150℃ and moisture range is 20%~100%.
2) Comparison experiments on dielectric performance
For such tests, the impact of moisture has to be excluded as much as possible. Thus, paper
samples should be dried. The specific procedure is to dry the paper samples in an air-
circulating oven under 105℃ for 12h. The determination of the water content of the paper
after dry shows that the moisture level is lower than 0.5%.
3) Experiments of paper under oil impregnation and aging tests
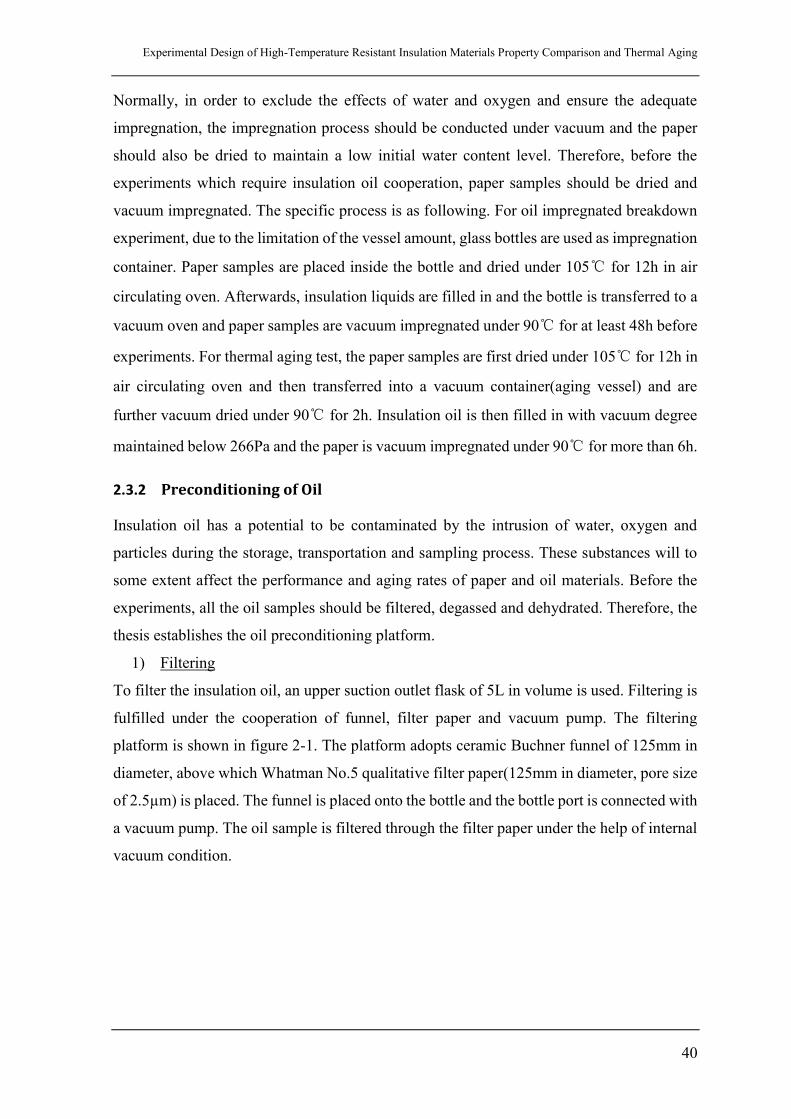
Experimental Design of High-Temperature Resistant Insulation Materials Property Comparison and Thermal Aging
40
Normally, in order to exclude the effects of water and oxygen and ensure the adequate
impregnation, the impregnation process should be conducted under vacuum and the paper
should also be dried to maintain a low initial water content level. Therefore, before the
experiments which require insulation oil cooperation, paper samples should be dried and
vacuum impregnated. The specific process is as following. For oil impregnated breakdown
experiment, due to the limitation of the vessel amount, glass bottles are used as impregnation
container. Paper samples are placed inside the bottle and dried under 105℃ for 12h in air
circulating oven. Afterwards, insulation liquids are filled in and the bottle is transferred to a
vacuum oven and paper samples are vacuum impregnated under 90℃ for at least 48h before
experiments. For thermal aging test, the paper samples are first dried under 105℃ for 12h in
air circulating oven and then transferred into a vacuum container(aging vessel) and are
further vacuum dried under 90℃ for 2h. Insulation oil is then filled in with vacuum degree
maintained below 266Pa and the paper is vacuum impregnated under 90℃ for more than 6h.
2.3.2 Preconditioning of Oil
Insulation oil has a potential to be contaminated by the intrusion of water, oxygen and
particles during the storage, transportation and sampling process. These substances will to
some extent affect the performance and aging rates of paper and oil materials. Before the
experiments, all the oil samples should be filtered, degassed and dehydrated. Therefore, the
thesis establishes the oil preconditioning platform.
1) Filtering
To filter the insulation oil, an upper suction outlet flask of 5L in volume is used. Filtering is
fulfilled under the cooperation of funnel, filter paper and vacuum pump. The filtering
platform is shown in figure 2-1. The platform adopts ceramic Buchner funnel of 125mm in
diameter, above which Whatman No.5 qualitative filter paper(125mm in diameter, pore size
of 2.5µm) is placed. The funnel is placed onto the bottle and the bottle port is connected with
a vacuum pump. The oil sample is filtered through the filter paper under the help of internal
vacuum condition.
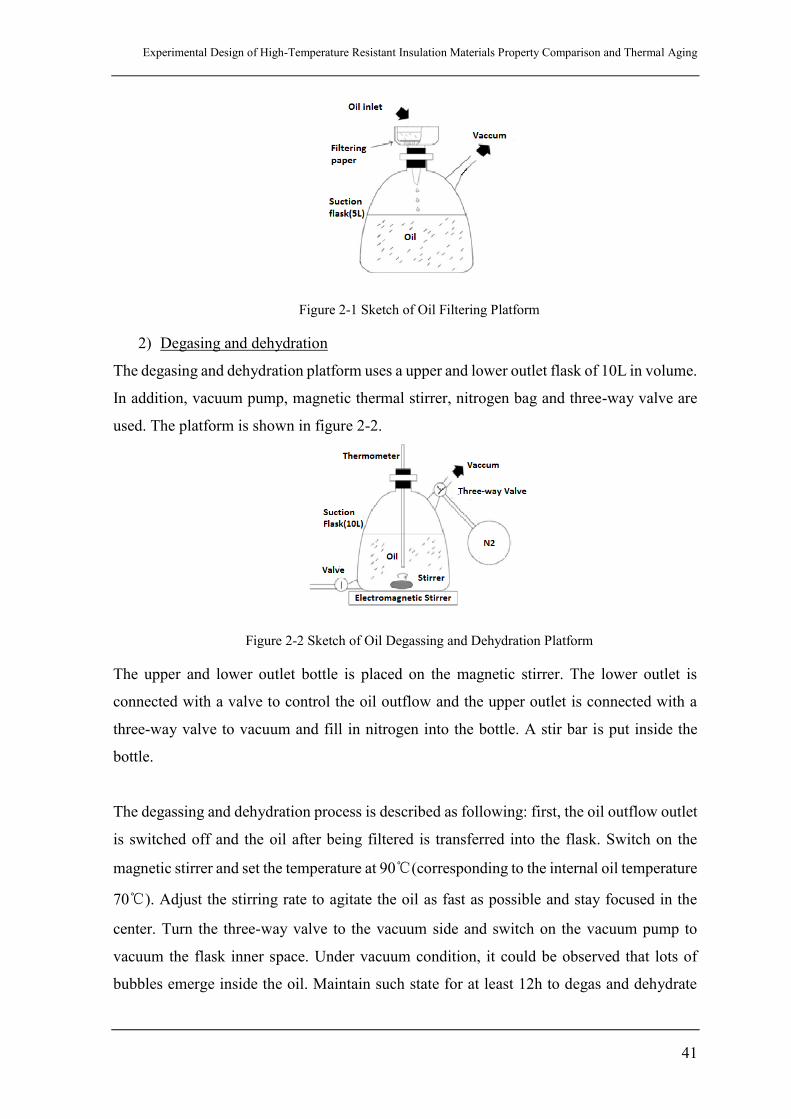
Experimental Design of High-Temperature Resistant Insulation Materials Property Comparison and Thermal Aging
41
Figure 2-1 Sketch of Oil Filtering Platform
2) Degasing and dehydration
The degasing and dehydration platform uses a upper and lower outlet flask of 10L in volume.
In addition, vacuum pump, magnetic thermal stirrer, nitrogen bag and three-way valve are
used. The platform is shown in figure 2-2.
Figure 2-2 Sketch of Oil Degassing and Dehydration Platform
The upper and lower outlet bottle is placed on the magnetic stirrer. The lower outlet is
connected with a valve to control the oil outflow and the upper outlet is connected with a
three-way valve to vacuum and fill in nitrogen into the bottle. A stir bar is put inside the
bottle.
The degassing and dehydration process is described as following: first, the oil outflow outlet
is switched off and the oil after being filtered is transferred into the flask. Switch on the
magnetic stirrer and set the temperature at 90℃(corresponding to the internal oil temperature
70℃). Adjust the stirring rate to agitate the oil as fast as possible and stay focused in the
center. Turn the three-way valve to the vacuum side and switch on the vacuum pump to
vacuum the flask inner space. Under vacuum condition, it could be observed that lots of
bubbles emerge inside the oil. Maintain such state for at least 12h to degas and dehydrate
Experimental Design of High-Temperature Resistant Insulation Materials Property Comparison and Thermal Aging
42
the oil. Afterwards, close the vacuum pump and turn the three-way valve to nitrogen side
and open the nitrogen bag. When the pressures inside and outside the flask are balanced, the
oil outflow outlet is open and oil sample is flowed into aging vessels or oil-impregnation
containers.
The results of the water content measurements of the insulation oil after dehydration and
degassing show that the mineral oil moisture level could be reduced to 10ppm, while
vegetable oil has a water content around 50ppm. This water content levels meet the
requirements for the insulation oil before transformer operation(<20ppm for mineral oil and
<200ppm for vegetable oil).
2.4 Chapter Conclusion
This chapter mainly introduces the test materials and parameters involved in this thesis. The
preconditioning methods of solid and liquid materials depending on different requirements
of experiments are also described. The content in this chapter provides an overview of
experimental preparation and a basis for the work hereinafter.
Physical and Mechanical Performances of High Temperature Resistant Insulation Paper
43
3 Physical and Mechanical Performances of High
Temperature Resistant Insulation Paper
This chapter mainly introduces the experimental results on physical and mechanical
performance of three paper materials, which are T910 paper, TUK paper and Kraft paper.
The experiment methods are also described. The preconditioning process of the materials
are mention in chapter 2. In order to avoid contamination of water and particles from hand,
the experimenter wears rubber gloves during the whole session of experiments.
3.1 Basis Weight and Density
3.1.1 Test Method
Due to the error existed during manufacture, the basic physical index of paper sample could
have bias from the rated values. The thesis measures the real thickness, basis weight and
density according to ASTM D202 Standard Test Methods for Sampling and Testing
Untreated Paper Used for Electrical Insulation[49].
.
The paper samples to be tested are cut into 10 sheets with size of 200±5×200±5mm.
Micrometer screw with the division value of 0.01mm is used to measure the thickness of one
paper sample sheet at any 5 locations. The separation of each location and the edge should
be larger than 6mm. The average value of these 5 thickness measurements is taken as the
measured thickness of the sample. And the average of 10 paper samples thickness is taken
as the measured real thickness of the paper.
An analytical Balance with accuracy of 0.0001g is used to measure each paper sample sheet
weight M. The length H and width W are determined by a steel ruler with division value of
0.5mm. The basis weight is then calculated by formula (3-1), and the average of 10 paper
samples’ basis weight is taken as the measured value. Meanwhile, the density is further
determined based on the thickness measurement.
WH
M
A
MBW
(3-1)
TWH
M
V
MD
(3-2)
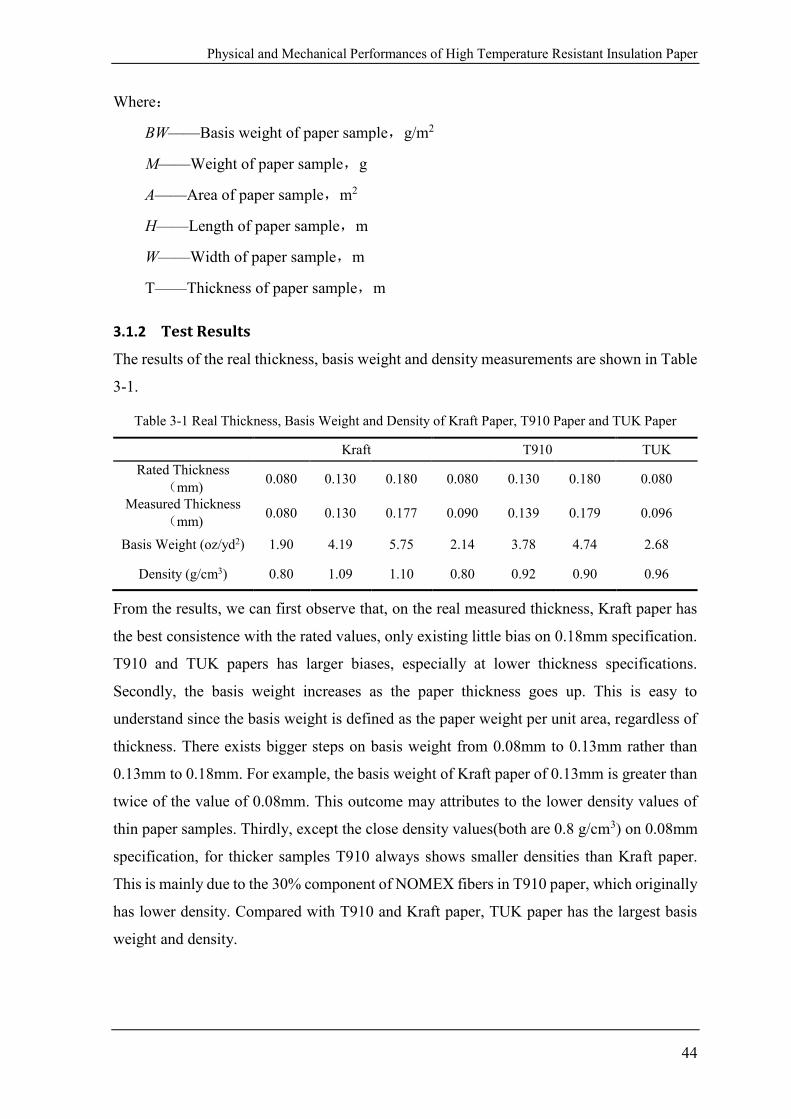
Physical and Mechanical Performances of High Temperature Resistant Insulation Paper
44
Where:
BW——Basis weight of paper sample,g/m2
M——Weight of paper sample,g
A——Area of paper sample,m2
H——Length of paper sample,m
W——Width of paper sample,m
T——Thickness of paper sample,m
3.1.2 Test Results
The results of the real thickness, basis weight and density measurements are shown in Table
3-1.
Table 3-1 Real Thickness, Basis Weight and Density of Kraft Paper, T910 Paper and TUK Paper
Kraft T910 TUK
Rated Thickness
(mm) 0.080 0.130 0.180 0.080 0.130 0.180 0.080
Measured Thickness
(mm) 0.080 0.130 0.177 0.090 0.139 0.179 0.096
Basis Weight (oz/yd2) 1.90 4.19 5.75 2.14 3.78 4.74 2.68
Density (g/cm3) 0.80 1.09 1.10 0.80 0.92 0.90 0.96
From the results, we can first observe that, on the real measured thickness, Kraft paper has
the best consistence with the rated values, only existing little bias on 0.18mm specification.
T910 and TUK papers has larger biases, especially at lower thickness specifications.
Secondly, the basis weight increases as the paper thickness goes up. This is easy to
understand since the basis weight is defined as the paper weight per unit area, regardless of
thickness. There exists bigger steps on basis weight from 0.08mm to 0.13mm rather than
0.13mm to 0.18mm. For example, the basis weight of Kraft paper of 0.13mm is greater than
twice of the value of 0.08mm. This outcome may attributes to the lower density values of
thin paper samples. Thirdly, except the close density values(both are 0.8 g/cm3) on 0.08mm
specification, for thicker samples T910 always shows smaller densities than Kraft paper.
This is mainly due to the 30% component of NOMEX fibers in T910 paper, which originally
has lower density. Compared with T910 and Kraft paper, TUK paper has the largest basis
weight and density.
Physical and Mechanical Performances of High Temperature Resistant Insulation Paper
45
Due to the porous structure of insulation paper which is a composite system of air and fibers,
the density could directly reflect the fiber content in paper materials. The mass of air could
be neglected and thus higher density value means higher fiber content in the paper and the
more dense the paper is. For same kind of material, density values could be used to analyze
the paper densification degree. Therefore, we can draw a conclusion that the Kraft papers of
0.13mm and 0.18mm in thickness are more compressed than of 0.08mm. The compression
degree has a direct relationship with some key performances of insulation paper, e.g. oil
absorption and dielectric constant etc.
3.2 Water Content
3.2.1 Test Method
Since the water exists in paper could affect paper performance and accelerate its aging, it is
necessary to determine the initial water contents of different kinds of paper. ASTM D644
Standard Test Method for Moisture Content of Paper and Paperboard by Oven Drying[50]
and ASTM D3277 Standard Test Methods for Moisture Content of Oil-Impregnated
Cellulosic Insulation[51] are both referred as the test accordance. Oven drying and Karl
Fisher titration methods are adopted to measure the water content in insulation paper.
The basic rule of oven drying method is to use oven to dry out the water that exists inside
paper samples and measure the differences of the paper weight before and after drying. Then
the water content could be deduced. During the experiments, glass bottles of 100mL in
volume are selected. The bottle has good airtightness with 145℃ resistant PP screw cap and
fluorine rubber gasket is placed inside the cap.
The experiment process is described as following. Firstly, the glass bottle is open and placed
into a heating oven whose temperature is set as 105℃. After heating 1h, the oven is open
and the cap is screwed up onto the bottle as soon as possible and then the bottle is cooled
down to room temperature in a desiccator for 1h. Afterwards, the glass bottle is weighed by
analytical balance. Secondly, around 2g paper samples are put inside the bottle by a tweezers
and the bottle is screwed up and weighed again. The difference of two successive weight of
the bottle is taken as the initial paper sample wet weight W1. Thirdly, heat the paper sample
along with the bottle open inside the oven under 105℃ for 2h. Then, open the oven and
Physical and Mechanical Performances of High Temperature Resistant Insulation Paper
46
screw up the bottle immediately and put it into the desiccator. After the bottle is cooled down
to room temperature, weigh the bottle with paper sample inside and then take out the paper
sample and only weigh the empty bottle and the screw cap. The difference of these two
successive weight of the bottle is taken as the paper sample dry weight W2. Repeat the
aforementioned weighing process, until the difference of two successive weight in no larger
than 0.002g. The water content of paper sample is then calculated by formula (3-3). For each
thickness specification, three paper samples are performed the test and their average value
is calculated as the water content for such paper.
%1001
21
W
WWWC (3-3)
Where,
WC——Water content of paper sample,%
W1——Weight of paper sample before drying,g
W2——Weight of paper sample after drying,g
The basic rule of Karl Fisher titration is the reduction reaction of iodine by SO2 under the
existence of water. The I2 involved in is electrolyzed on electrode. By measuring the total
amount of electric charges transferred, the amount of water involves could be determined.
Karl Fisher titration experiment is carried out by using Metrohm 831 Karl Fisher titrator,
under the cooperation of Metrohm 860 thermoprep. When testing the water content of solid
materials, thermoprep is first used to evaporate the water exists inside the material. Then the
vaporized water is carried into the titrator by air dried through molecular sieve. Inside the
titrator, there is commercial-used KF reagent, including iodide, SO2, imidazole and methanol.
Reagent oxidizes on the anode and yields iodine. The key point is that the required iodine
amount is derived by electrolysis process, and thus the equipment could directly calculate
the iodine amount by recording the electric charges. Finally, the water amount enters the
titrator is determined.
Before the formal titration, three blank samples are first titrated and their average value is
taken as the background water content. Small paper stripe sample weighing around 0.1g is
placed inside the sample bottle. The sample bottle is then put into the center of thermoprep

Physical and Mechanical Performances of High Temperature Resistant Insulation Paper
47
to be heated under 220℃. Open the gas pump to carry the water vaporized into the titrator.
The residual water amount subtracted by background value is considered as the water content
in the paper sample. Two measurements are conducted and the average value is recorded.
3.2.2 Test Results
The results of water content measurements of paper samples in standard environment(23℃,
50% relative humidity) by two methods are shown in table 3-2
Table 3-2 Water Content of T910, Kraft and TUK paper
T910 Kraft TUK
Rated Thickness(mm) 0.08 0.13 0.18 0.08 0.13 0.18 0.08
Oven Drying(%) 4.02 3.86 4.03 5.85 5.93 5.96 6.95
Karl Fisher(%) 3.77 4.30 4.88 5.47 5.64 5.68 6.55
From the test results, certain biases between two measurement technologies are observed.
Nevertheless, T910 paper owns the lowest water content level, from 3.77% to 4.88%. TUK
paper’s water content is the highest(6.55%~6.95%), while Kraft paper has intermediate
values, from 5.47% to 5.96%. The Karl Fisher tests show that the water content increases as
the thickness goes up, and this rule is only suitable for Kraft paper under oven drying method.
The biases between two methods of T910 results are bigger, up to 0.8%; while the
differences for Kraft and TUK paper are small, just around 0.3%.
From the components of three kinds of paper, we know that 30% of T910 paper are NOMEX
fibers, with the rest being cellulose and TUK paper has some nitrogenous additives. It is the
difference on the component and structure that determines the particular water content level.
To be more specific, NOMEX fiber has a lower polarity of approximately 2.5 and has no
highly polar groups on molecular chain. However, on cellulose molecular chain, there are 3
hydroxyl groups on each glucose unit, and this greatly enhances its polarity. Commonly, the
reported polarity of cellulose is around 6.0. Therefore, Kraft and cellulose-based paper have
naturally greater hydrophilicity and NOMEX fiber could reduce the overall water content of
T910 composite system. This explains why the water content of T910 is 20% lower than
Kraft paper. For TUK paper, except the cellulose basis, some nitrogenous additives, e.g.
dicyandiamide and urea, including amino(-NH2) are added. These additives could form
hydrogen bond with water molecule and also owns high hydrophilicity. For instance, the
dicyandiamide has a water solubility of 32g/L, while cellulose will only swell in water.
Physical and Mechanical Performances of High Temperature Resistant Insulation Paper
48
Consequently, small nitrogenous additive addition will increase the water content of TUK
paper.
3.3 Tensile Strength
3.3.1 Test Method
Tensile strength is defined as the maximum tension that paper per unit width could maintain
under standard test condition. Referring to ASTM D202 Standard Test Methods for
Sampling and Testing Untreated Paper Used for Electrical Insulation[49], tensile strength
of paper sample is measured by constant elongation rate method. Electronic universal
mechanical testing machine is used.
Cut the insulation paper into paper strips with standard size of 200mm×25mm. The paper
strip is fixed onto the machine clampers. Select a tensile rate that can break up paper strips
in 10~15s. Usually the tensile rate on paper machine direction is set as 20mm/min, while on
cross-machines direction is 50 mm/min. Start the machine and the tensile experiment will
be automatically carried by the machine. After paper strips are ruptured, record the
maximum fracture force, time and position. Measure the width W of the fracture position.
Tensile strength TS of paper sample is calculated by formula (3-4) and the 10 paper samples
are performed the test to derive the average value.
W
FTS max (3-4)
Where,
TS——Tensile strength of paper sample
Fmax——Maximum force when fracture
W——Width of paper sample
One thing to note is that, depending on the type of insulation paper and its direction, elastic
deformation or elastoplastic deformation may exist during the stretching process. When
calculating, Fmax should choose the maximum stress that causes the paper fibers start to
deform.
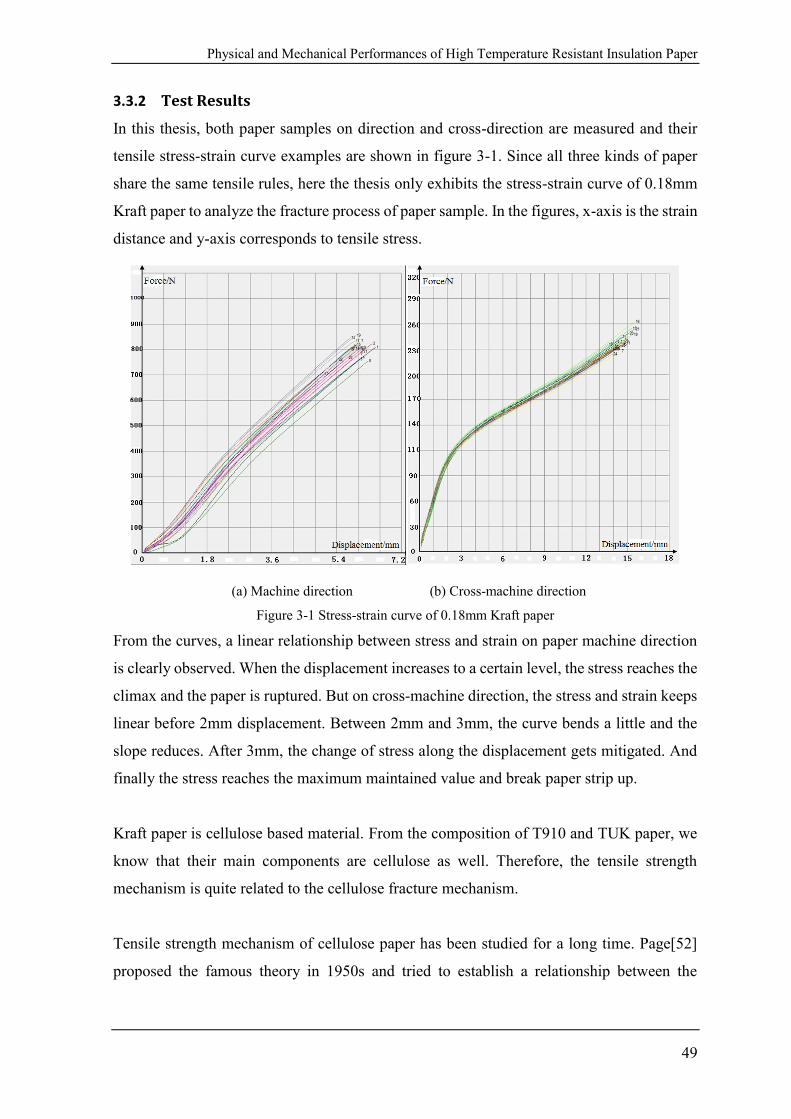
Physical and Mechanical Performances of High Temperature Resistant Insulation Paper
49
3.3.2 Test Results
In this thesis, both paper samples on direction and cross-direction are measured and their
tensile stress-strain curve examples are shown in figure 3-1. Since all three kinds of paper
share the same tensile rules, here the thesis only exhibits the stress-strain curve of 0.18mm
Kraft paper to analyze the fracture process of paper sample. In the figures, x-axis is the strain
distance and y-axis corresponds to tensile stress.
(a) Machine direction (b) Cross-machine direction
Figure 3-1 Stress-strain curve of 0.18mm Kraft paper
From the curves, a linear relationship between stress and strain on paper machine direction
is clearly observed. When the displacement increases to a certain level, the stress reaches the
climax and the paper is ruptured. But on cross-machine direction, the stress and strain keeps
linear before 2mm displacement. Between 2mm and 3mm, the curve bends a little and the
slope reduces. After 3mm, the change of stress along the displacement gets mitigated. And
finally the stress reaches the maximum maintained value and break paper strip up.
Kraft paper is cellulose based material. From the composition of T910 and TUK paper, we
know that their main components are cellulose as well. Therefore, the tensile strength
mechanism is quite related to the cellulose fracture mechanism.
Tensile strength mechanism of cellulose paper has been studied for a long time. Page[52]
proposed the famous theory in 1950s and tried to establish a relationship between the
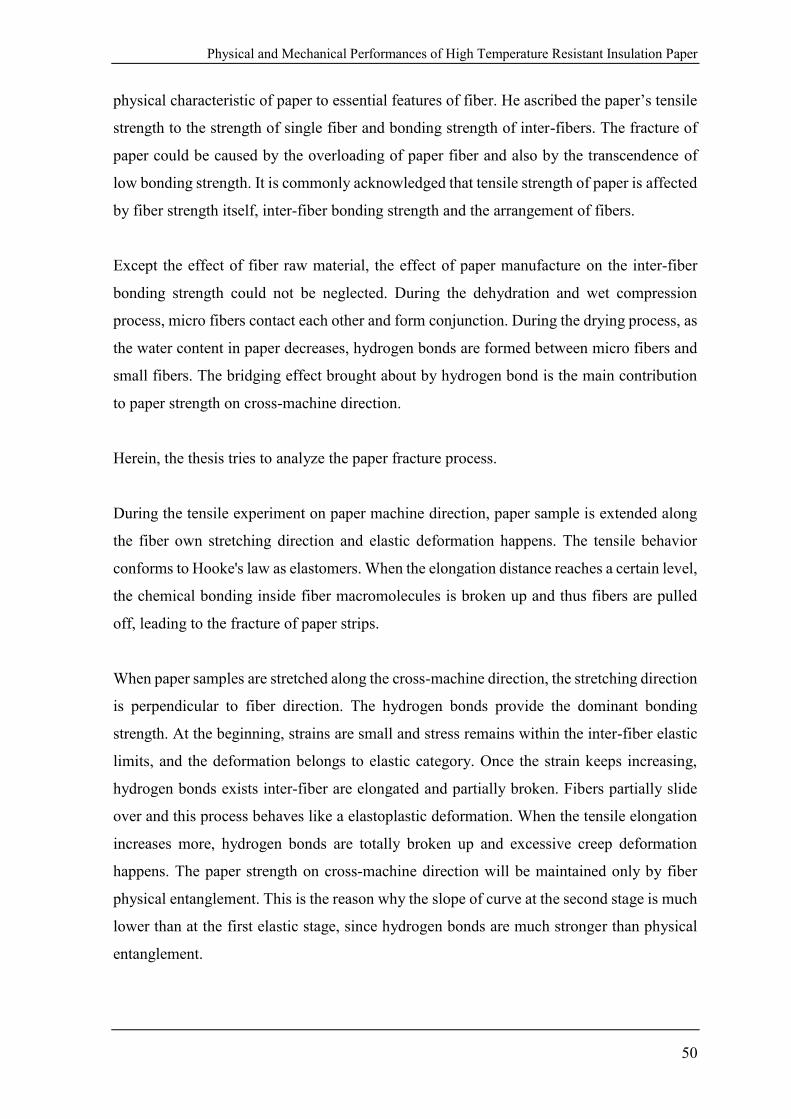
Physical and Mechanical Performances of High Temperature Resistant Insulation Paper
50
physical characteristic of paper to essential features of fiber. He ascribed the paper’s tensile
strength to the strength of single fiber and bonding strength of inter-fibers. The fracture of
paper could be caused by the overloading of paper fiber and also by the transcendence of
low bonding strength. It is commonly acknowledged that tensile strength of paper is affected
by fiber strength itself, inter-fiber bonding strength and the arrangement of fibers.
Except the effect of fiber raw material, the effect of paper manufacture on the inter-fiber
bonding strength could not be neglected. During the dehydration and wet compression
process, micro fibers contact each other and form conjunction. During the drying process, as
the water content in paper decreases, hydrogen bonds are formed between micro fibers and
small fibers. The bridging effect brought about by hydrogen bond is the main contribution
to paper strength on cross-machine direction.
Herein, the thesis tries to analyze the paper fracture process.
During the tensile experiment on paper machine direction, paper sample is extended along
the fiber own stretching direction and elastic deformation happens. The tensile behavior
conforms to Hooke's law as elastomers. When the elongation distance reaches a certain level,
the chemical bonding inside fiber macromolecules is broken up and thus fibers are pulled
off, leading to the fracture of paper strips.
When paper samples are stretched along the cross-machine direction, the stretching direction
is perpendicular to fiber direction. The hydrogen bonds provide the dominant bonding
strength. At the beginning, strains are small and stress remains within the inter-fiber elastic
limits, and the deformation belongs to elastic category. Once the strain keeps increasing,
hydrogen bonds exists inter-fiber are elongated and partially broken. Fibers partially slide
over and this process behaves like a elastoplastic deformation. When the tensile elongation
increases more, hydrogen bonds are totally broken up and excessive creep deformation
happens. The paper strength on cross-machine direction will be maintained only by fiber
physical entanglement. This is the reason why the slope of curve at the second stage is much
lower than at the first elastic stage, since hydrogen bonds are much stronger than physical
entanglement.
Physical and Mechanical Performances of High Temperature Resistant Insulation Paper
51
The calculated tensile strength on both machine and cross machine direction are shown in
table 3-3.
To better and more conveniently compare the data, results are drawn in bar plots as shown
in figure 3-2.
Table 3-3 Tensile Strength of Kraft, T910 and TUK Paper
Kraft T910 TUK
Rated Thickness
(mm) 0.08 0.13 0.18 0.08 0.13 0.18 0.08
Machine Direction
(N/cm) 101.07 277.24 327.40 74.22 130.79 147.86 107.80
Cross machine
direction(N/cm) 14.69 52.91 96.53 14.94 38.49 43.94 35.38
(a)Machine Direction (b) Cross-machine Direction
Figure 3-2 Tensile Strength of Kraft, T910 and TUK paper
From the plots, a apparent conclusion could be drawn that the tensile strength on machine
direction is far greater than on cross-machine direction. This is mainly caused by the
different bonding approaches on two directions. The strength on machine direction is mainly
provided by chemical bonds, while on cross-machine direction the hydrogen bonds are the
prior source. Chemical bonds are strong interaction, whose bonding energy usually ranges
in 125~840kJ/mol. Hydrogen bonds are weaker interaction, whose bonding energy is usually
below 40kJ/mol. Therefore, the energy needs to destroy chemical bonds is much greater than
the energy to break hydrogen bonds. This is the reason why paper owns higher tensile
strength on machine direction.
Physical and Mechanical Performances of High Temperature Resistant Insulation Paper
52
Besides, it could be clearly seen that, compared with the other two papers, T910 paper always
shows lower tensile strength no matter what direction and thickness specifications are. TUK
is the most robust material where all three materials could be compared. Only under 0.08mm
thickness specification, Kraft paper has similar tensile strength value with T910 paper on
cross-machine direction. On other conditions, Kraft paper has much higher tensile strength
level. And the leading of Kraft paper over T910 paper becomes more significant as thickness
increases. For instance, on machine direction, the tensile strength of 0.08mm Kraft paper
exceeds 36% over that of T910 paper. For 0.13mm specification, the percentage of Kraft
paper tensile strength surpass T910 paper is 113%, while it reaches up to 122% under
0.18mm specification. This outcome is resulted from the fact that Kraft paper in experiment
is specially mechanically strengthened for the aim of power transformer application and
TUK paper in experiment belongs to a DDP strengthened type.
T910 paper owns lower tensile strength on machine and cross machine directions due to its
particular structure. At the entanglement position of NOMEX and cellulose fibers, due to
the intrinsic differences of macromolecular structures, their hydrogen bonding effect is weak.
NOMEX fiber does not have polar groups such as hydroxyls, so it is not easy to form
hydrogen bonds with other polar groups. Therefore, at the intersection of two fibers, the
bonding strength is weaker and such areas are the weak link of T910 paper. Although T910
paper has much lower tensile strength, according to ASTM D1305 Standard Specification
for Electrical Insulating Paper and Paperboard-Sulfate (Kraft) Layer Type[53], its tensile
strength still meets the requirement and so as other two paper materials. The threshold values
of different thicknesses on machine direction are shown in figure 3-3(a) by the dotted line.
3.4 Oil Absorption
3.4.1 Test Method
The real operation of insulation paper is achieved by the impregnation in insulation oil. The
impregnation level and the oil content of insulation paper are reflected by oil absorption
value. Because insulation papers are porous materials, oil will fill in the pores when
impregnating. Oil absorption is the key parameter to indicate the oil absorption ability of
insulation paper. It is normally required for insulation paper to have a higher oil absorption
value. Thus the composite oil impregnated paper system will have a lower composite
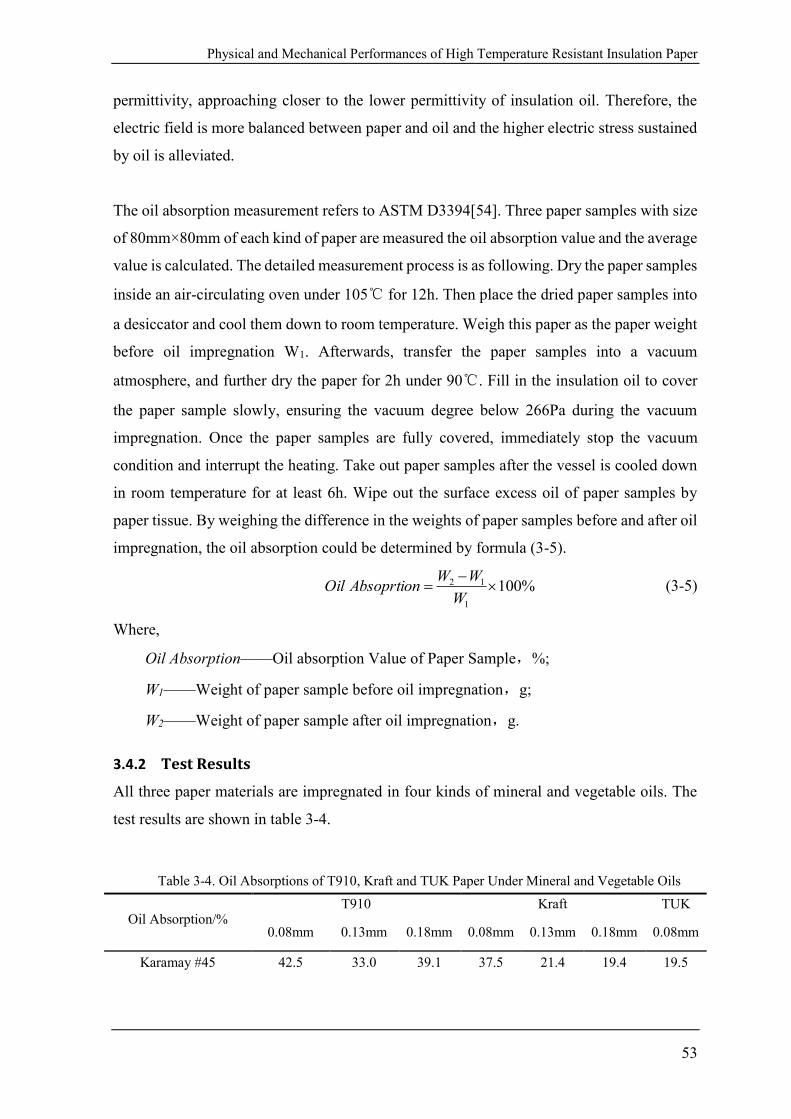
Physical and Mechanical Performances of High Temperature Resistant Insulation Paper
53
permittivity, approaching closer to the lower permittivity of insulation oil. Therefore, the
electric field is more balanced between paper and oil and the higher electric stress sustained
by oil is alleviated.
The oil absorption measurement refers to ASTM D3394[54]. Three paper samples with size
of 80mm×80mm of each kind of paper are measured the oil absorption value and the average
value is calculated. The detailed measurement process is as following. Dry the paper samples
inside an air-circulating oven under 105℃ for 12h. Then place the dried paper samples into
a desiccator and cool them down to room temperature. Weigh this paper as the paper weight
before oil impregnation W1. Afterwards, transfer the paper samples into a vacuum
atmosphere, and further dry the paper for 2h under 90℃. Fill in the insulation oil to cover
the paper sample slowly, ensuring the vacuum degree below 266Pa during the vacuum
impregnation. Once the paper samples are fully covered, immediately stop the vacuum
condition and interrupt the heating. Take out paper samples after the vessel is cooled down
in room temperature for at least 6h. Wipe out the surface excess oil of paper samples by
paper tissue. By weighing the difference in the weights of paper samples before and after oil
impregnation, the oil absorption could be determined by formula (3-5).
%100 1
12
W
WWAbsoprtionOil (3-5)
Where,
Oil Absorption——Oil absorption Value of Paper Sample,%;
W1——Weight of paper sample before oil impregnation,g;
W2——Weight of paper sample after oil impregnation,g.
3.4.2 Test Results
All three paper materials are impregnated in four kinds of mineral and vegetable oils. The
test results are shown in table 3-4.
Table 3-4. Oil Absorptions of T910, Kraft and TUK Paper Under Mineral and Vegetable Oils
Oil Absorption/% T910 Kraft TUK
0.08mm 0.13mm 0.18mm 0.08mm 0.13mm 0.18mm 0.08mm
Karamay #45 42.5 33.0 39.1 37.5 21.4 19.4 19.5
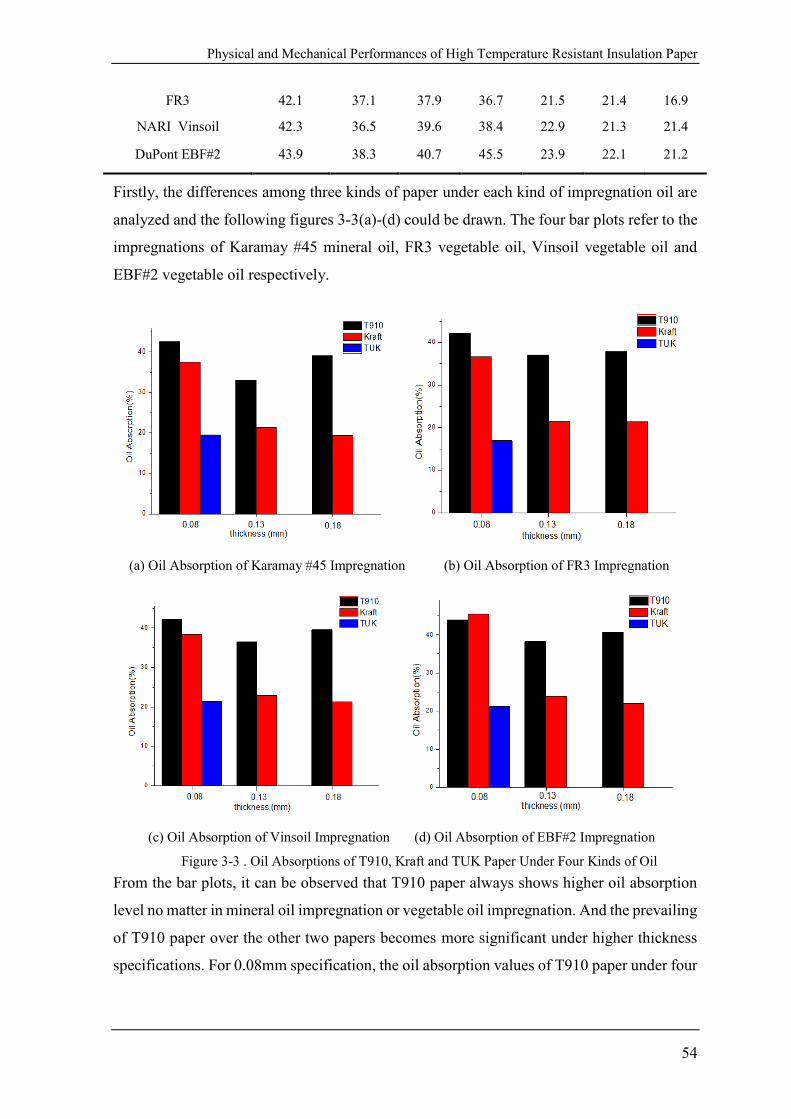
Physical and Mechanical Performances of High Temperature Resistant Insulation Paper
54
FR3 42.1 37.1 37.9 36.7 21.5 21.4 16.9
NARI Vinsoil 42.3 36.5 39.6 38.4 22.9 21.3 21.4
DuPont EBF#2 43.9 38.3 40.7 45.5 23.9 22.1 21.2
Firstly, the differences among three kinds of paper under each kind of impregnation oil are
analyzed and the following figures 3-3(a)-(d) could be drawn. The four bar plots refer to the
impregnations of Karamay #45 mineral oil, FR3 vegetable oil, Vinsoil vegetable oil and
EBF#2 vegetable oil respectively.
(a) Oil Absorption of Karamay #45 Impregnation (b) Oil Absorption of FR3 Impregnation
(c) Oil Absorption of Vinsoil Impregnation (d) Oil Absorption of EBF#2 Impregnation
Figure 3-3 . Oil Absorptions of T910, Kraft and TUK Paper Under Four Kinds of Oil
From the bar plots, it can be observed that T910 paper always shows higher oil absorption
level no matter in mineral oil impregnation or vegetable oil impregnation. And the prevailing
of T910 paper over the other two papers becomes more significant under higher thickness
specifications. For 0.08mm specification, the oil absorption values of T910 paper under four
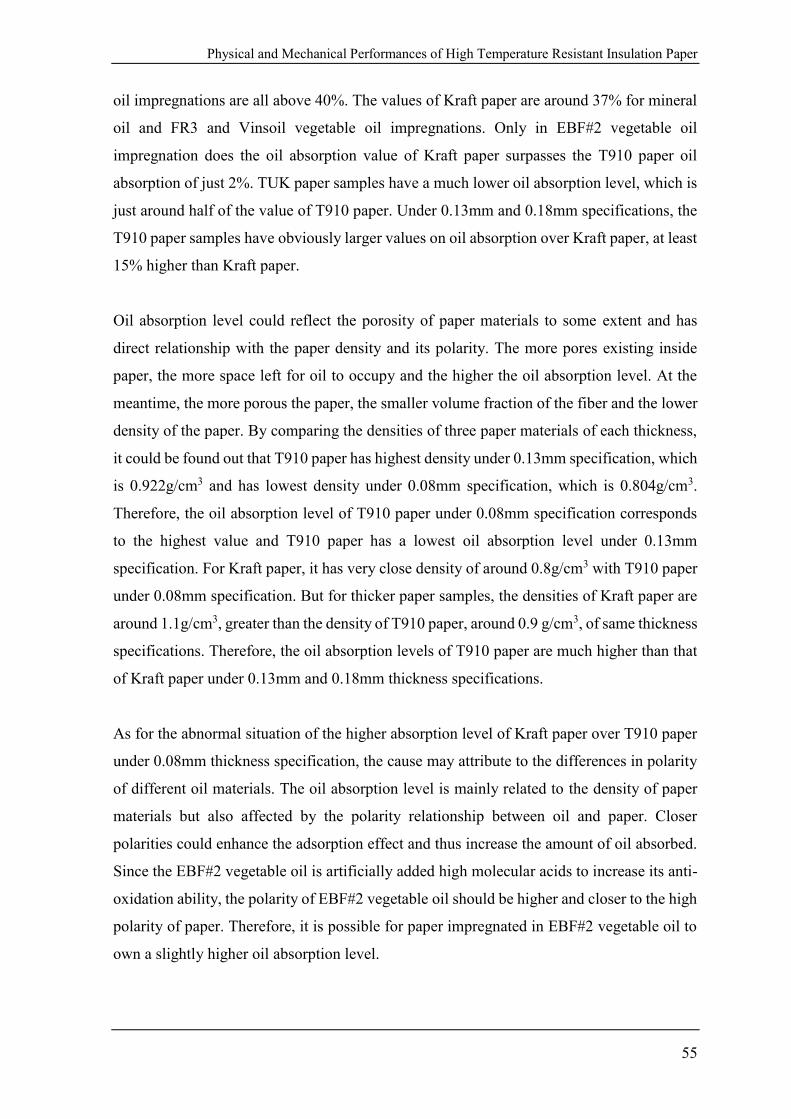
Physical and Mechanical Performances of High Temperature Resistant Insulation Paper
55
oil impregnations are all above 40%. The values of Kraft paper are around 37% for mineral
oil and FR3 and Vinsoil vegetable oil impregnations. Only in EBF#2 vegetable oil
impregnation does the oil absorption value of Kraft paper surpasses the T910 paper oil
absorption of just 2%. TUK paper samples have a much lower oil absorption level, which is
just around half of the value of T910 paper. Under 0.13mm and 0.18mm specifications, the
T910 paper samples have obviously larger values on oil absorption over Kraft paper, at least
15% higher than Kraft paper.
Oil absorption level could reflect the porosity of paper materials to some extent and has
direct relationship with the paper density and its polarity. The more pores existing inside
paper, the more space left for oil to occupy and the higher the oil absorption level. At the
meantime, the more porous the paper, the smaller volume fraction of the fiber and the lower
density of the paper. By comparing the densities of three paper materials of each thickness,
it could be found out that T910 paper has highest density under 0.13mm specification, which
is 0.922g/cm3 and has lowest density under 0.08mm specification, which is 0.804g/cm3.
Therefore, the oil absorption level of T910 paper under 0.08mm specification corresponds
to the highest value and T910 paper has a lowest oil absorption level under 0.13mm
specification. For Kraft paper, it has very close density of around 0.8g/cm3 with T910 paper
under 0.08mm specification. But for thicker paper samples, the densities of Kraft paper are
around 1.1g/cm3, greater than the density of T910 paper, around 0.9 g/cm3, of same thickness
specifications. Therefore, the oil absorption levels of T910 paper are much higher than that
of Kraft paper under 0.13mm and 0.18mm thickness specifications.
As for the abnormal situation of the higher absorption level of Kraft paper over T910 paper
under 0.08mm thickness specification, the cause may attribute to the differences in polarity
of different oil materials. The oil absorption level is mainly related to the density of paper
materials but also affected by the polarity relationship between oil and paper. Closer
polarities could enhance the adsorption effect and thus increase the amount of oil absorbed.
Since the EBF#2 vegetable oil is artificially added high molecular acids to increase its anti-
oxidation ability, the polarity of EBF#2 vegetable oil should be higher and closer to the high
polarity of paper. Therefore, it is possible for paper impregnated in EBF#2 vegetable oil to
own a slightly higher oil absorption level.
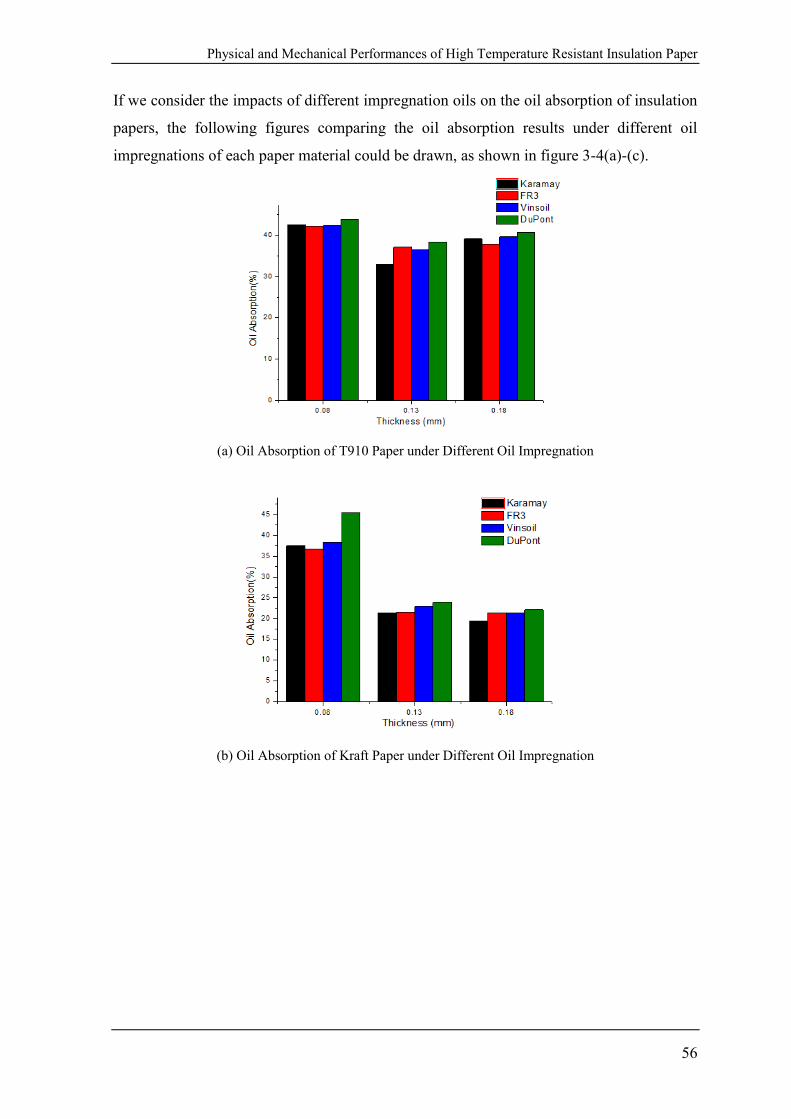
Physical and Mechanical Performances of High Temperature Resistant Insulation Paper
56
If we consider the impacts of different impregnation oils on the oil absorption of insulation
papers, the following figures comparing the oil absorption results under different oil
impregnations of each paper material could be drawn, as shown in figure 3-4(a)-(c).
(a) Oil Absorption of T910 Paper under Different Oil Impregnation
(b) Oil Absorption of Kraft Paper under Different Oil Impregnation
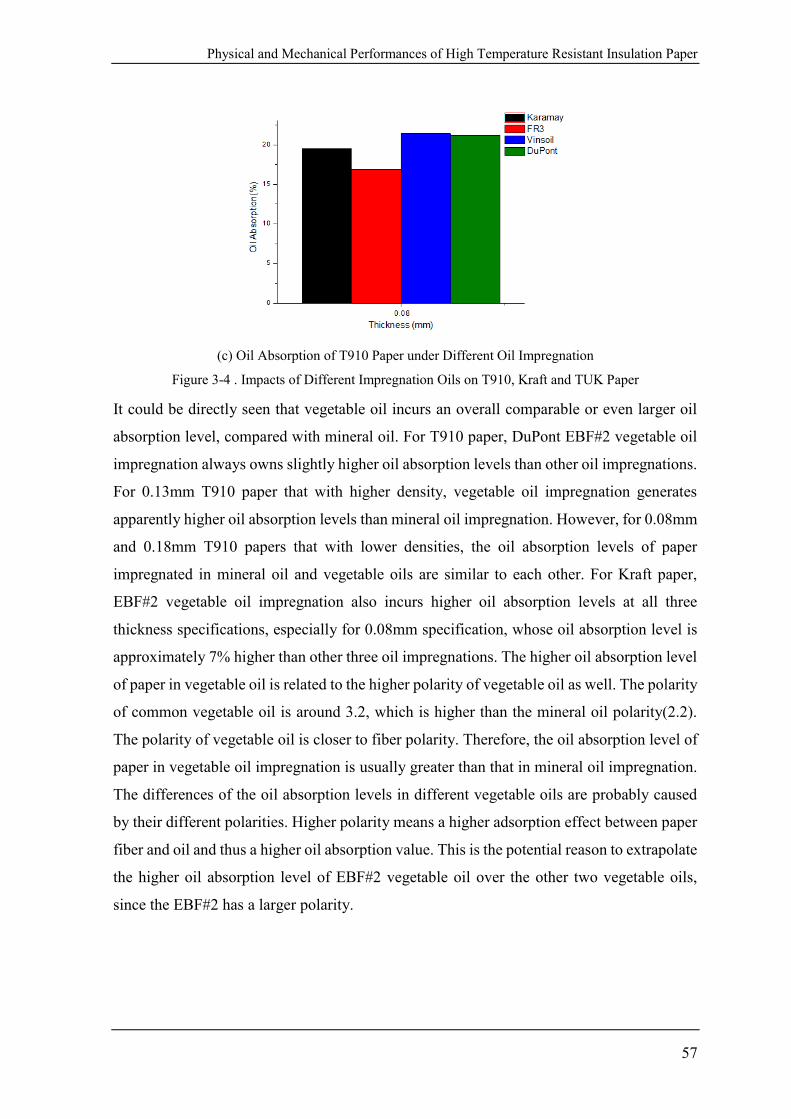
Physical and Mechanical Performances of High Temperature Resistant Insulation Paper
57
(c) Oil Absorption of T910 Paper under Different Oil Impregnation
Figure 3-4 . Impacts of Different Impregnation Oils on T910, Kraft and TUK Paper
It could be directly seen that vegetable oil incurs an overall comparable or even larger oil
absorption level, compared with mineral oil. For T910 paper, DuPont EBF#2 vegetable oil
impregnation always owns slightly higher oil absorption levels than other oil impregnations.
For 0.13mm T910 paper that with higher density, vegetable oil impregnation generates
apparently higher oil absorption levels than mineral oil impregnation. However, for 0.08mm
and 0.18mm T910 papers that with lower densities, the oil absorption levels of paper
impregnated in mineral oil and vegetable oils are similar to each other. For Kraft paper,
EBF#2 vegetable oil impregnation also incurs higher oil absorption levels at all three
thickness specifications, especially for 0.08mm specification, whose oil absorption level is
approximately 7% higher than other three oil impregnations. The higher oil absorption level
of paper in vegetable oil is related to the higher polarity of vegetable oil as well. The polarity
of common vegetable oil is around 3.2, which is higher than the mineral oil polarity(2.2).
The polarity of vegetable oil is closer to fiber polarity. Therefore, the oil absorption level of
paper in vegetable oil impregnation is usually greater than that in mineral oil impregnation.
The differences of the oil absorption levels in different vegetable oils are probably caused
by their different polarities. Higher polarity means a higher adsorption effect between paper
fiber and oil and thus a higher oil absorption value. This is the potential reason to extrapolate
the higher oil absorption level of EBF#2 vegetable oil over the other two vegetable oils,
since the EBF#2 has a larger polarity.
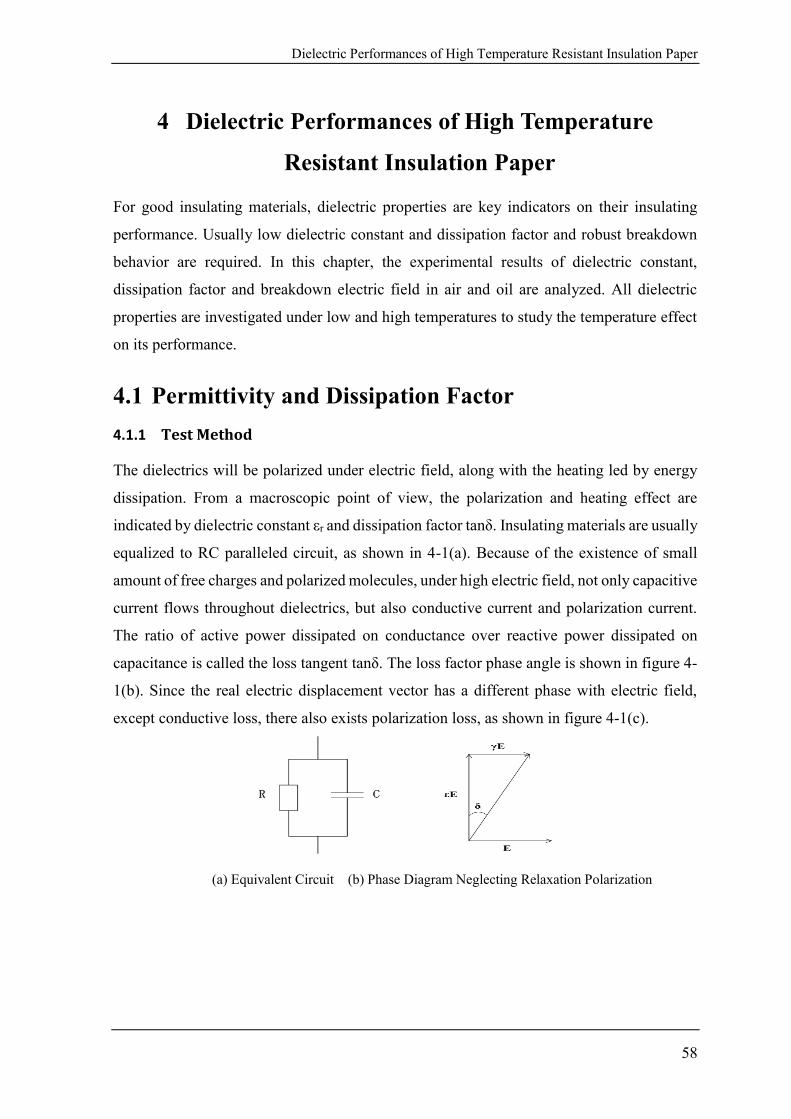
Dielectric Performances of High Temperature Resistant Insulation Paper
58
4 Dielectric Performances of High Temperature
Resistant Insulation Paper
For good insulating materials, dielectric properties are key indicators on their insulating
performance. Usually low dielectric constant and dissipation factor and robust breakdown
behavior are required. In this chapter, the experimental results of dielectric constant,
dissipation factor and breakdown electric field in air and oil are analyzed. All dielectric
properties are investigated under low and high temperatures to study the temperature effect
on its performance.
4.1 Permittivity and Dissipation Factor
4.1.1 Test Method
The dielectrics will be polarized under electric field, along with the heating led by energy
dissipation. From a macroscopic point of view, the polarization and heating effect are
indicated by dielectric constant εr and dissipation factor tanδ. Insulating materials are usually
equalized to RC paralleled circuit, as shown in 4-1(a). Because of the existence of small
amount of free charges and polarized molecules, under high electric field, not only capacitive
current flows throughout dielectrics, but also conductive current and polarization current.
The ratio of active power dissipated on conductance over reactive power dissipated on
capacitance is called the loss tangent tanδ. The loss factor phase angle is shown in figure 4-
1(b). Since the real electric displacement vector has a different phase with electric field,
except conductive loss, there also exists polarization loss, as shown in figure 4-1(c).
(a) Equivalent Circuit (b) Phase Diagram Neglecting Relaxation Polarization
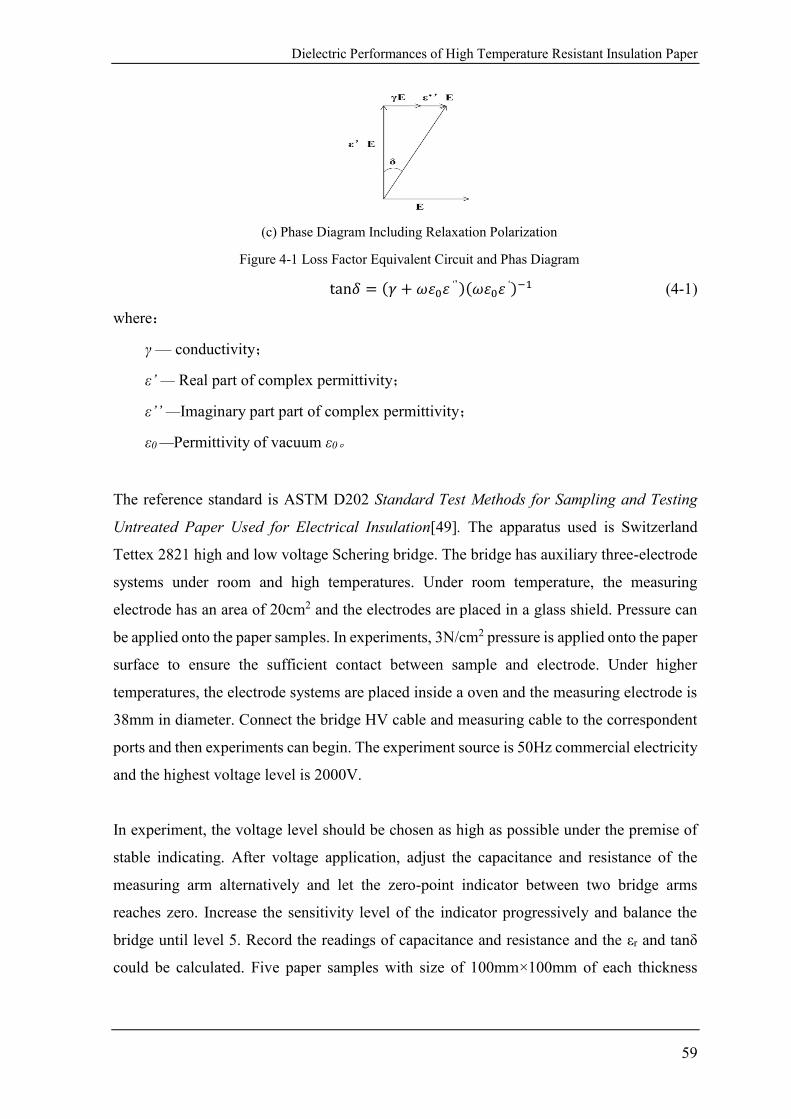
Dielectric Performances of High Temperature Resistant Insulation Paper
59
(c) Phase Diagram Including Relaxation Polarization
Figure 4-1 Loss Factor Equivalent Circuit and Phas Diagram
tan𝛿 = (𝛾 + 𝜔휀0휀‘’)(𝜔휀0휀‘)−1 (4-1)
where:
γ — conductivity;
ε’ — Real part of complex permittivity;
ε’’ —Imaginary part part of complex permittivity;
ε0 —Permittivity of vacuum ε0。
The reference standard is ASTM D202 Standard Test Methods for Sampling and Testing
Untreated Paper Used for Electrical Insulation[49]. The apparatus used is Switzerland
Tettex 2821 high and low voltage Schering bridge. The bridge has auxiliary three-electrode
systems under room and high temperatures. Under room temperature, the measuring
electrode has an area of 20cm2 and the electrodes are placed in a glass shield. Pressure can
be applied onto the paper samples. In experiments, 3N/cm2 pressure is applied onto the paper
surface to ensure the sufficient contact between sample and electrode. Under higher
temperatures, the electrode systems are placed inside a oven and the measuring electrode is
38mm in diameter. Connect the bridge HV cable and measuring cable to the correspondent
ports and then experiments can begin. The experiment source is 50Hz commercial electricity
and the highest voltage level is 2000V.
In experiment, the voltage level should be chosen as high as possible under the premise of
stable indicating. After voltage application, adjust the capacitance and resistance of the
measuring arm alternatively and let the zero-point indicator between two bridge arms
reaches zero. Increase the sensitivity level of the indicator progressively and balance the
bridge until level 5. Record the readings of capacitance and resistance and the εr and tanδ
could be calculated. Five paper samples with size of 100mm×100mm of each thickness
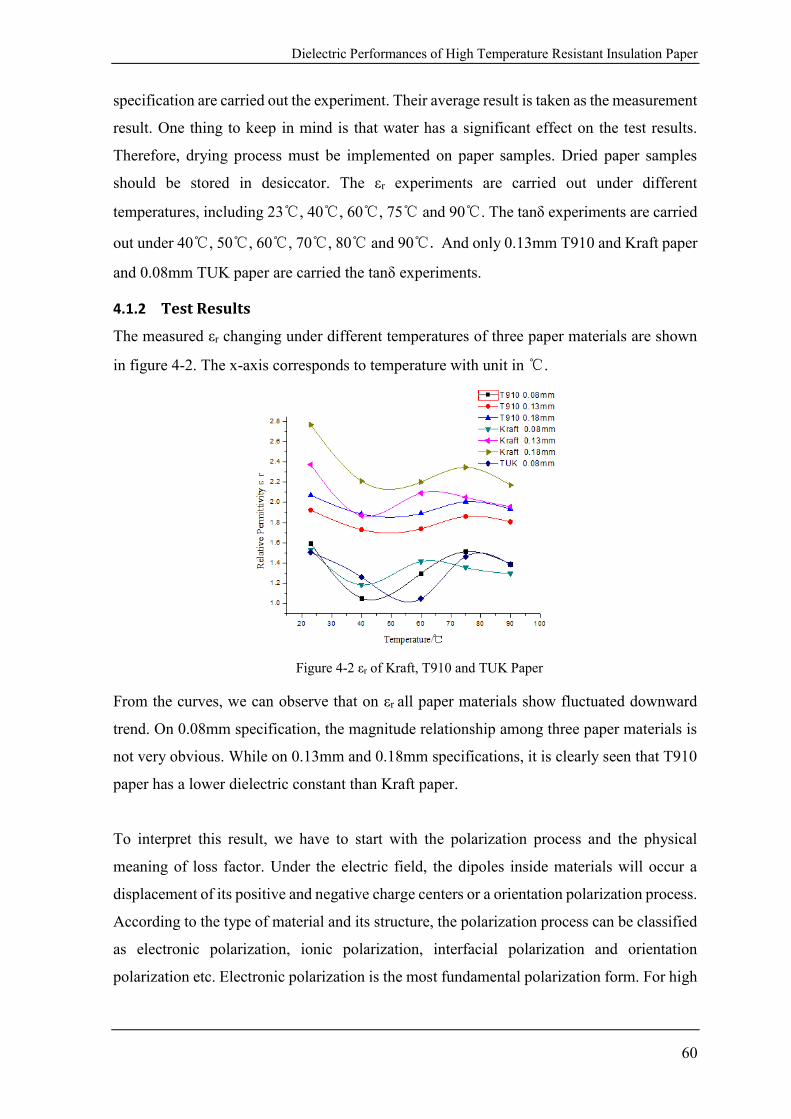
Dielectric Performances of High Temperature Resistant Insulation Paper
60
specification are carried out the experiment. Their average result is taken as the measurement
result. One thing to keep in mind is that water has a significant effect on the test results.
Therefore, drying process must be implemented on paper samples. Dried paper samples
should be stored in desiccator. The εr experiments are carried out under different
temperatures, including 23℃, 40℃, 60℃, 75℃ and 90℃. The tanδ experiments are carried
out under 40℃, 50℃, 60℃, 70℃, 80℃ and 90℃. And only 0.13mm T910 and Kraft paper
and 0.08mm TUK paper are carried the tanδ experiments.
4.1.2 Test Results
The measured εr changing under different temperatures of three paper materials are shown
in figure 4-2. The x-axis corresponds to temperature with unit in ℃.
Figure 4-2 εr of Kraft, T910 and TUK Paper
From the curves, we can observe that on εr all paper materials show fluctuated downward
trend. On 0.08mm specification, the magnitude relationship among three paper materials is
not very obvious. While on 0.13mm and 0.18mm specifications, it is clearly seen that T910
paper has a lower dielectric constant than Kraft paper.
To interpret this result, we have to start with the polarization process and the physical
meaning of loss factor. Under the electric field, the dipoles inside materials will occur a
displacement of its positive and negative charge centers or a orientation polarization process.
According to the type of material and its structure, the polarization process can be classified
as electronic polarization, ionic polarization, interfacial polarization and orientation
polarization etc. Electronic polarization is the most fundamental polarization form. For high
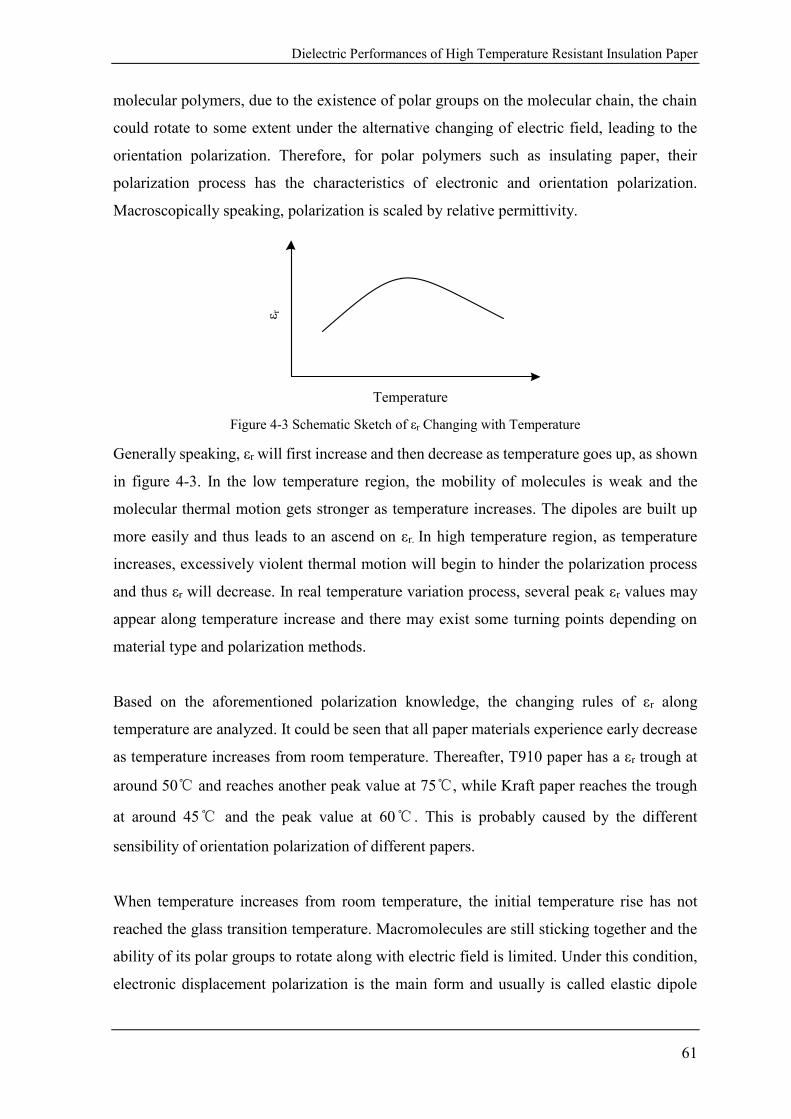
Dielectric Performances of High Temperature Resistant Insulation Paper
61
molecular polymers, due to the existence of polar groups on the molecular chain, the chain
could rotate to some extent under the alternative changing of electric field, leading to the
orientation polarization. Therefore, for polar polymers such as insulating paper, their
polarization process has the characteristics of electronic and orientation polarization.
Macroscopically speaking, polarization is scaled by relative permittivity.
Temperature
ε r
Figure 4-3 Schematic Sketch of εr Changing with Temperature
Generally speaking, εr will first increase and then decrease as temperature goes up, as shown
in figure 4-3. In the low temperature region, the mobility of molecules is weak and the
molecular thermal motion gets stronger as temperature increases. The dipoles are built up
more easily and thus leads to an ascend on εr. In high temperature region, as temperature
increases, excessively violent thermal motion will begin to hinder the polarization process
and thus εr will decrease. In real temperature variation process, several peak εr values may
appear along temperature increase and there may exist some turning points depending on
material type and polarization methods.
Based on the aforementioned polarization knowledge, the changing rules of εr along
temperature are analyzed. It could be seen that all paper materials experience early decrease
as temperature increases from room temperature. Thereafter, T910 paper has a εr trough at
around 50℃ and reaches another peak value at 75℃, while Kraft paper reaches the trough
at around 45℃ and the peak value at 60℃ . This is probably caused by the different
sensibility of orientation polarization of different papers.
When temperature increases from room temperature, the initial temperature rise has not
reached the glass transition temperature. Macromolecules are still sticking together and the
ability of its polar groups to rotate along with electric field is limited. Under this condition,
electronic displacement polarization is the main form and usually is called elastic dipole

Dielectric Performances of High Temperature Resistant Insulation Paper
62
polarization. The thermal motion of molecules are already intensified and hinders the
electronic polarization. Thereby, the macroscopic εr shows a descending trend. As the
temperature keeps increasing, the rotating mobility of polar groups is strengthened. When
temperature exceeds above glass transition temperature, paper fibers are in highly elastic
state and their polar groups and chain links could rotate obviously as electric field alternates.
The orientation polarization is thus intensified and contributes more to the overall
polarization in a certain temperature range. The orientation polarization is stronger and its
intensity is larger than electronic polarization. Thus, εr again begins to increase. When
temperature further increases, the more intensified thermal motion will impede the
orientation of polar groups and chain links. The macromolecules again become disordered
and thus εr will experience a final decrease. During the changes, there is a peak value of εr
and based on the change of εr the range of paper fibers glass transition temperatures could
be qualitatively analyzed. The uprising interval of Kraft paper εr is 45~65℃, while for T910
paper and TUK paper the uprising intervals are 50~75℃ and 60~80℃ respectively. The
glass transition temperatures of each material are considered to lie in these temperature
ranges. T910 paper has two polymer components and TUK paper has surface epoxy film,
both of which are two phase system. Additional interfacial polarization may also exists and
contributes to excess polarization intensification. This is the potential reason for the delay of
the εr trough and peak values of T910 and TUK paper over Kraft paper.
The complete dielectric constant is represented by complex dielectric constant, and could be
divided into real part ε’ and imaginary part ε’’. During the dielectric polarization, due to the
orientation of dipoles or the existence of macroscopic polarization current, some energies
are dissipated as heat radiation. The loss caused by dielectric polarization is often called as
relaxation loss. The relaxation loss factor is defined as the ratio of imaginary part ε’’ over
real part ε’, as shown in formula (4-2).
''
tan'
(4-2)
Where,
ε’ —real part of complex permittivity;
ε’’ —imaginary part of complex permittivity。
ε’ and ε’’ could be represented as:
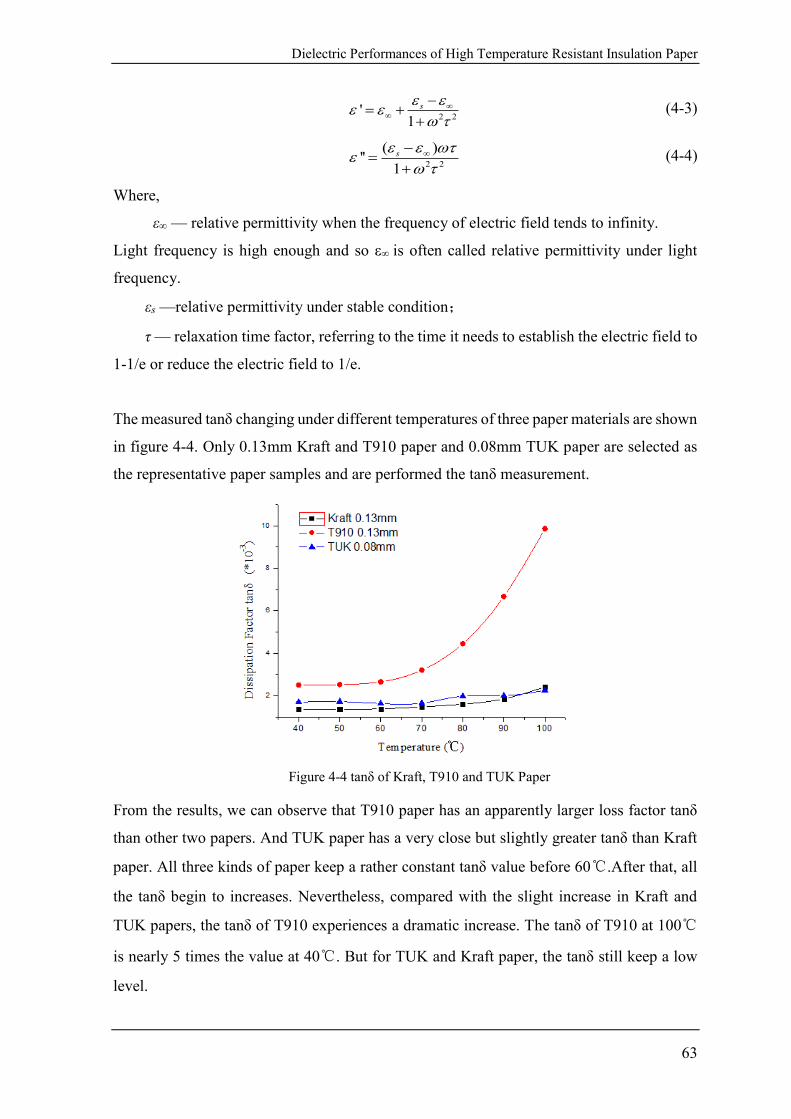
Dielectric Performances of High Temperature Resistant Insulation Paper
63
2 2
'1
s
(4-3)
2 2
( )''
1
s
(4-4)
Where,
ε∞ — relative permittivity when the frequency of electric field tends to infinity.
Light frequency is high enough and so ε∞ is often called relative permittivity under light
frequency.
εs —relative permittivity under stable condition;
τ — relaxation time factor, referring to the time it needs to establish the electric field to
1-1/e or reduce the electric field to 1/e.
The measured tanδ changing under different temperatures of three paper materials are shown
in figure 4-4. Only 0.13mm Kraft and T910 paper and 0.08mm TUK paper are selected as
the representative paper samples and are performed the tanδ measurement.
Figure 4-4 tanδ of Kraft, T910 and TUK Paper
From the results, we can observe that T910 paper has an apparently larger loss factor tanδ
than other two papers. And TUK paper has a very close but slightly greater tanδ than Kraft
paper. All three kinds of paper keep a rather constant tanδ value before 60℃.After that, all
the tanδ begin to increases. Nevertheless, compared with the slight increase in Kraft and
TUK papers, the tanδ of T910 experiences a dramatic increase. The tanδ of T910 at 100℃
is nearly 5 times the value at 40℃. But for TUK and Kraft paper, the tanδ still keep a low
level.
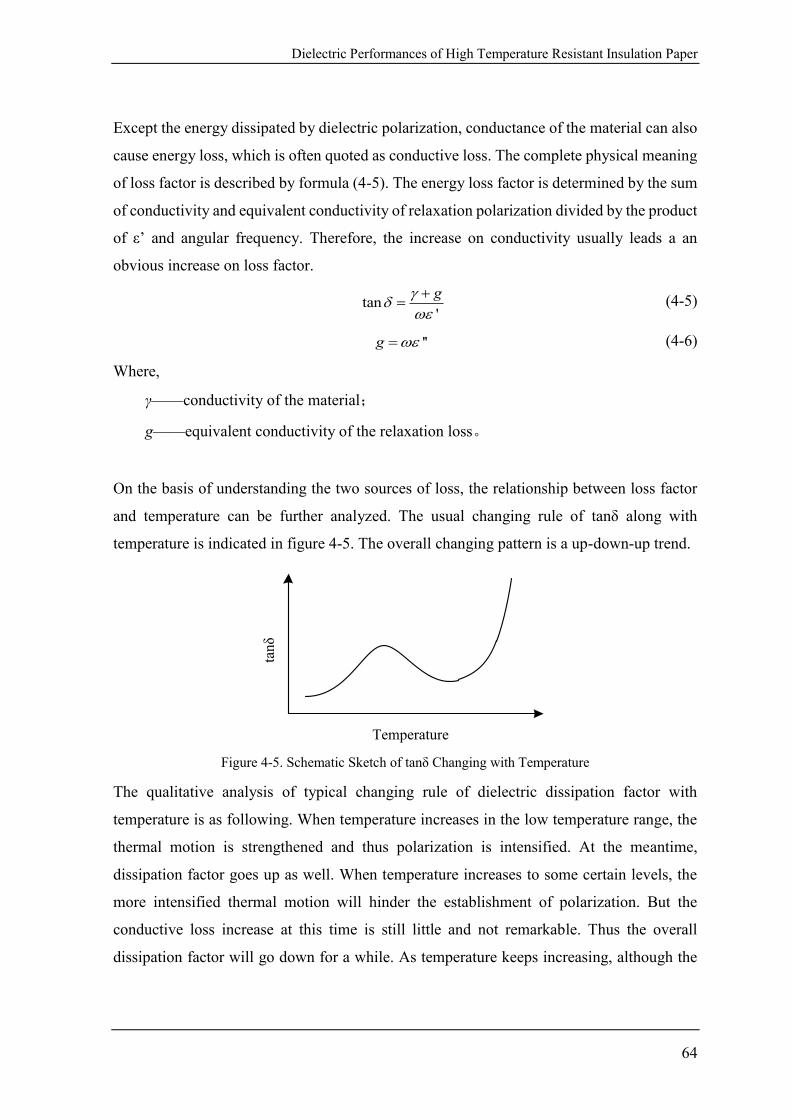
Dielectric Performances of High Temperature Resistant Insulation Paper
64
Except the energy dissipated by dielectric polarization, conductance of the material can also
cause energy loss, which is often quoted as conductive loss. The complete physical meaning
of loss factor is described by formula (4-5). The energy loss factor is determined by the sum
of conductivity and equivalent conductivity of relaxation polarization divided by the product
of ε’ and angular frequency. Therefore, the increase on conductivity usually leads a an
obvious increase on loss factor.
tan'
g
(4-5)
''g (4-6)
Where,
γ——conductivity of the material;
g——equivalent conductivity of the relaxation loss。
On the basis of understanding the two sources of loss, the relationship between loss factor
and temperature can be further analyzed. The usual changing rule of tanδ along with
temperature is indicated in figure 4-5. The overall changing pattern is a up-down-up trend.
Temperature
tanδ
Figure 4-5. Schematic Sketch of tanδ Changing with Temperature
The qualitative analysis of typical changing rule of dielectric dissipation factor with
temperature is as following. When temperature increases in the low temperature range, the
thermal motion is strengthened and thus polarization is intensified. At the meantime,
dissipation factor goes up as well. When temperature increases to some certain levels, the
more intensified thermal motion will hinder the establishment of polarization. But the
conductive loss increase at this time is still little and not remarkable. Thus the overall
dissipation factor will go down for a while. As temperature keeps increasing, although the
Dielectric Performances of High Temperature Resistant Insulation Paper
65
relaxation loss are further reduced, an exponential increasing of conductive loss incurred by
high temperature will happen. Finally, the overall dissipation factor will obviously increase.
Considering 40℃ is already above room temperature, the molecular thermal motion has
already got intensified to some extent. The change in tanδ may lie in the plain region before
the final rapid high-temperature boost. In this temperature region, the decrease in relaxation
loss indicated by a reduction in εr is somewhat compensated by the increase on conductive
loss. Therefore, the overall loss factor could maintain a close level for small temperature
rises. Afterwards, tanδ of T910 increases dramatically after 70℃ but Kraft paper and TUK
paper have a slight increase in tanδ. This is probably due to the differences on the change of
conductive loss of different papers. Conductive loss is directly related to material
conductivity, which usually decreases as temperature goes up. The more conductivity
decreases, the more the resistivity increases and the more conductive loss increases.
Therefore, an inference could be made that, as temperature goes up, the decrease in
conductivity of T910 paper is much larger than the decrease of Kraft and TUK paper. And
thus the conductive loss and then the overall tanδ of T910 show a rapid ascending trend.
Another thing to note is that the εr of three kinds of dried paper changes with thickness.
Theoretically speaking, as the same kind of material, the εr is one inherent characteristic and
should not change with thickness and other size parameters. This is due to the fact that dried
paper samples are not pure paper fibers but composite systems of fiber and air. The εr of a
composite dielectric is dependent on the relative content of each component. Papers with
different thickness specifications have different densities. This means that the portions of
fiber are different, leading to discrepancy in εr. Generally speaking, the higher the paper
density, the greater the εr.
The current theoretical researches mainly focus on double component composite
dielectrics[55-58]. The models built up are either paralleled or in series, as shown in figure
4-6.
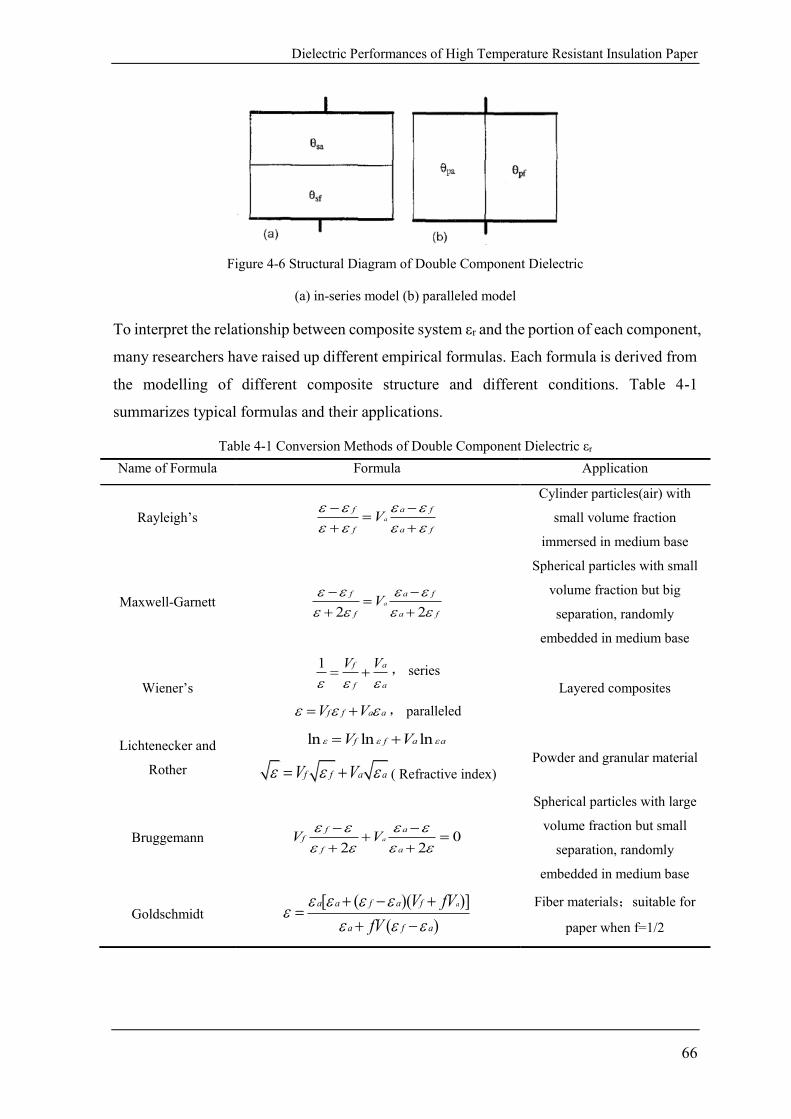
Dielectric Performances of High Temperature Resistant Insulation Paper
66
Figure 4-6 Structural Diagram of Double Component Dielectric
(a) in-series model (b) paralleled model
To interpret the relationship between composite system εr and the portion of each component,
many researchers have raised up different empirical formulas. Each formula is derived from
the modelling of different composite structure and different conditions. Table 4-1
summarizes typical formulas and their applications.
Table 4-1 Conversion Methods of Double Component Dielectric εr
Name of Formula Formula Application
Rayleigh’s a
f a f
f a f
V
Cylinder particles(air) with
small volume fraction
immersed in medium base
Maxwell-Garnett 2 2
a
f a f
f a f
V
Spherical particles with small
volume fraction but big
separation, randomly
embedded in medium base
Wiener’s
1 f a
f a
V V
, series
f f a aV V , paralleled
Layered composites
Lichtenecker and
Rother
ln ln lnf f a aV V
f f a aV V ( Refractive index)
Powder and granular material
Bruggemann 02 2
a
f af
f a
V V
Spherical particles with large
volume fraction but small
separation, randomly
embedded in medium base
Goldschmidt [ ( )( )]
( )
aa a f a f
a f a
V fV
fV
Fiber materials;suitable for
paper when f=1/2
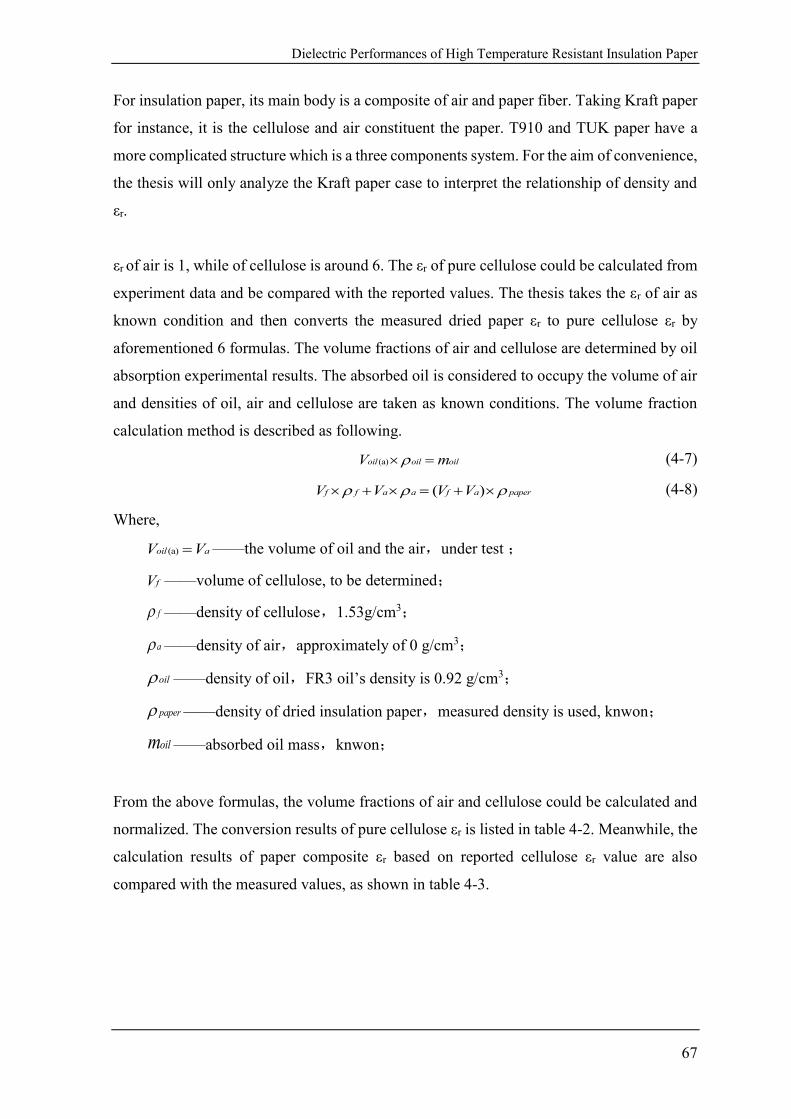
Dielectric Performances of High Temperature Resistant Insulation Paper
67
For insulation paper, its main body is a composite of air and paper fiber. Taking Kraft paper
for instance, it is the cellulose and air constituent the paper. T910 and TUK paper have a
more complicated structure which is a three components system. For the aim of convenience,
the thesis will only analyze the Kraft paper case to interpret the relationship of density and
εr.
εr of air is 1, while of cellulose is around 6. The εr of pure cellulose could be calculated from
experiment data and be compared with the reported values. The thesis takes the εr of air as
known condition and then converts the measured dried paper εr to pure cellulose εr by
aforementioned 6 formulas. The volume fractions of air and cellulose are determined by oil
absorption experimental results. The absorbed oil is considered to occupy the volume of air
and densities of oil, air and cellulose are taken as known conditions. The volume fraction
calculation method is described as following.
(a)oil oil oilV m (4-7)
( )f f a a f a paperV V V V (4-8)
Where,
(a)oil aV V ——the volume of oil and the air,under test ;
fV ——volume of cellulose, to be determined;
f ——density of cellulose,1.53g/cm3;
a ——density of air,approximately of 0 g/cm3;
oil ——density of oil,FR3 oil’s density is 0.92 g/cm3;
paper ——density of dried insulation paper,measured density is used, knwon;
oilm ——absorbed oil mass,knwon;
From the above formulas, the volume fractions of air and cellulose could be calculated and
normalized. The conversion results of pure cellulose εr is listed in table 4-2. Meanwhile, the
calculation results of paper composite εr based on reported cellulose εr value are also
compared with the measured values, as shown in table 4-3.
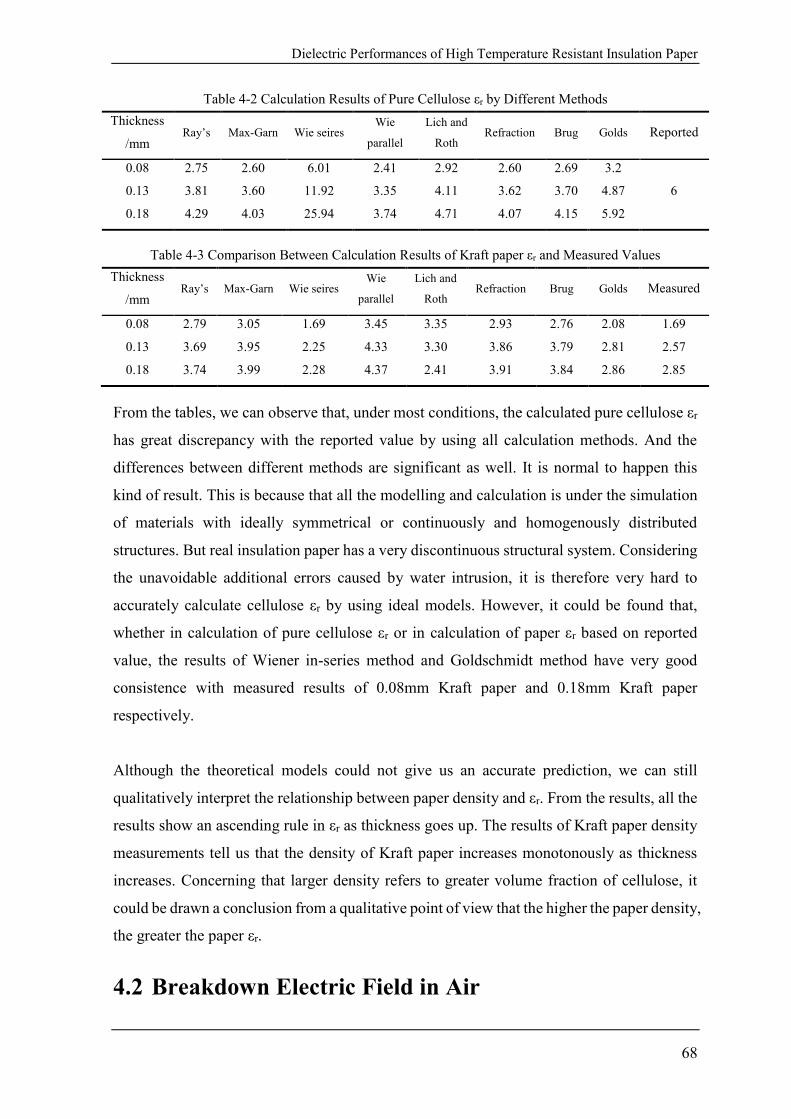
Dielectric Performances of High Temperature Resistant Insulation Paper
68
Table 4-2 Calculation Results of Pure Cellulose εr by Different Methods
Thickness
/mm Ray’s Max-Garn Wie seires
Wie
parallel
Lich and
Roth Refraction Brug Golds Reported
0.08 2.75 2.60 6.01 2.41 2.92 2.60 2.69 3.2
6 0.13 3.81 3.60 11.92 3.35 4.11 3.62 3.70 4.87
0.18 4.29 4.03 25.94 3.74 4.71 4.07 4.15 5.92
Table 4-3 Comparison Between Calculation Results of Kraft paper εr and Measured Values
Thickness
/mm Ray’s Max-Garn Wie seires
Wie
parallel
Lich and
Roth Refraction Brug Golds Measured
0.08 2.79 3.05 1.69 3.45 3.35 2.93 2.76 2.08 1.69
0.13 3.69 3.95 2.25 4.33 3.30 3.86 3.79 2.81 2.57
0.18 3.74 3.99 2.28 4.37 2.41 3.91 3.84 2.86 2.85
From the tables, we can observe that, under most conditions, the calculated pure cellulose εr
has great discrepancy with the reported value by using all calculation methods. And the
differences between different methods are significant as well. It is normal to happen this
kind of result. This is because that all the modelling and calculation is under the simulation
of materials with ideally symmetrical or continuously and homogenously distributed
structures. But real insulation paper has a very discontinuous structural system. Considering
the unavoidable additional errors caused by water intrusion, it is therefore very hard to
accurately calculate cellulose εr by using ideal models. However, it could be found that,
whether in calculation of pure cellulose εr or in calculation of paper εr based on reported
value, the results of Wiener in-series method and Goldschmidt method have very good
consistence with measured results of 0.08mm Kraft paper and 0.18mm Kraft paper
respectively.
Although the theoretical models could not give us an accurate prediction, we can still
qualitatively interpret the relationship between paper density and εr. From the results, all the
results show an ascending rule in εr as thickness goes up. The results of Kraft paper density
measurements tell us that the density of Kraft paper increases monotonously as thickness
increases. Concerning that larger density refers to greater volume fraction of cellulose, it
could be drawn a conclusion from a qualitative point of view that the higher the paper density,
the greater the paper εr.
4.2 Breakdown Electric Field in Air
Dielectric Performances of High Temperature Resistant Insulation Paper
69
4.2.1 Test Method
Insulation materials must have high enough dielectric strength to ensure the stable and
healthy operation. The dielectric strength is commonly determined by breakdown
experiments. The experiment applies increasing voltage on the test sample until its electrical
breakdown and the electric breakdown strength is derived by the division of breakdown
voltage over sample thickness. The breakdown strength is defined as:
𝐸𝐵 =𝑈
𝑇 (4-9)
Where,
EB——Breakdown electric field;
U——Breakdown voltage;
t ——Thickness.
The thesis first measures the paper samples’ breakdown electric field in air, according to
ASTM D149 Standard Test Method for Dielectric Breakdown Voltage and Dielectric
Strength of Solid Electrical Insulating Materials at Commercial Power Frequencies[59].
The breakdown experiment system is composed of a voltage booster, electrode system and
grounding wire. For breakdown experiment in air, the cylinder electrodes with 51mm
diameter specification are adopted. Due to the lower dielectric strength in air, the voltage
increasing rate has to be chosen a lower value. In experiments, voltage increasing rates
within 150V/s to 200V/s are selected according to different paper thickness. The basic rule
is to control the breakdown time lies within 10s to 20s. For paper samples of each thickness
specification, a total number of 20 breakdown experiments are carried and the breakdown
voltages are divided by paper average thickness result. The breakdown experiments of paper
in air are only performed under room temperature.
To interpret the derived breakdown electric field results, Weibull statistic method is used.
And the breakdown electric field corresponding to the breakdown probability of 63.2% is
taken as the characteristic value. The Weibull statistic method is introduced in Appendix
more in detail.
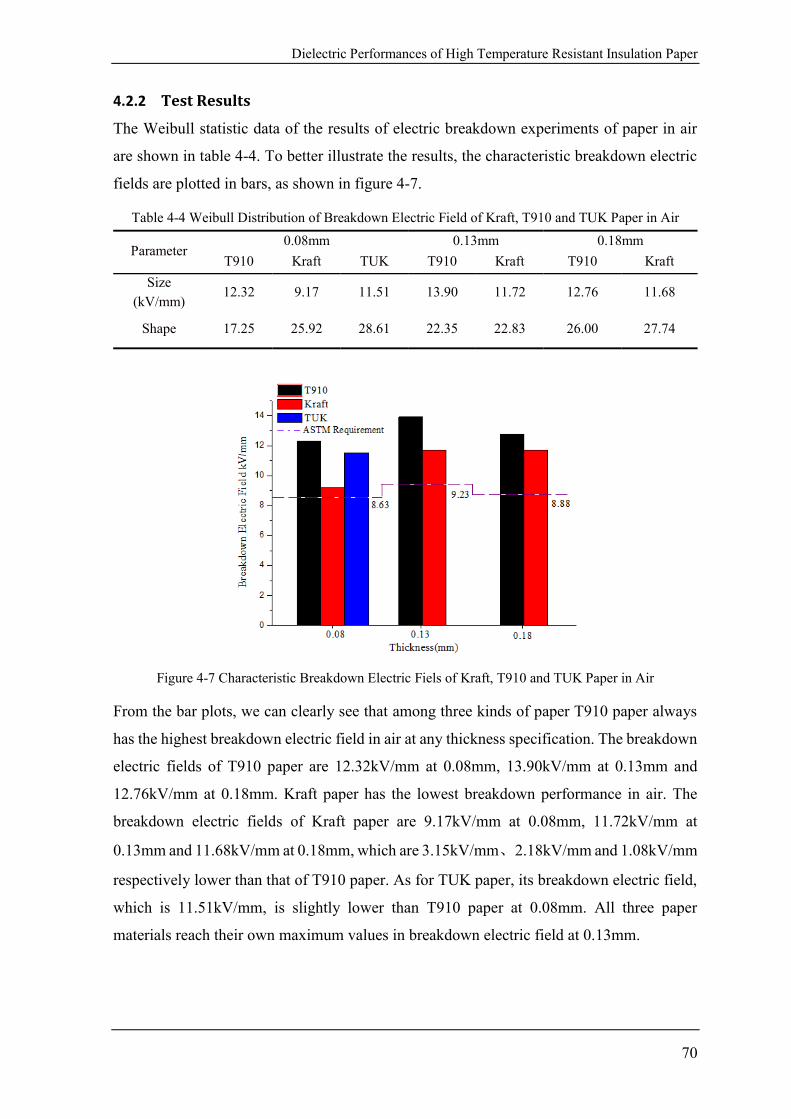
Dielectric Performances of High Temperature Resistant Insulation Paper
70
4.2.2 Test Results
The Weibull statistic data of the results of electric breakdown experiments of paper in air
are shown in table 4-4. To better illustrate the results, the characteristic breakdown electric
fields are plotted in bars, as shown in figure 4-7.
Table 4-4 Weibull Distribution of Breakdown Electric Field of Kraft, T910 and TUK Paper in Air
Parameter 0.08mm 0.13mm 0.18mm
T910 Kraft TUK T910 Kraft T910 Kraft
Size
(kV/mm) 12.32 9.17 11.51 13.90 11.72 12.76 11.68
Shape 17.25 25.92 28.61 22.35 22.83 26.00 27.74
Figure 4-7 Characteristic Breakdown Electric Fiels of Kraft, T910 and TUK Paper in Air
From the bar plots, we can clearly see that among three kinds of paper T910 paper always
has the highest breakdown electric field in air at any thickness specification. The breakdown
electric fields of T910 paper are 12.32kV/mm at 0.08mm, 13.90kV/mm at 0.13mm and
12.76kV/mm at 0.18mm. Kraft paper has the lowest breakdown performance in air. The
breakdown electric fields of Kraft paper are 9.17kV/mm at 0.08mm, 11.72kV/mm at
0.13mm and 11.68kV/mm at 0.18mm, which are 3.15kV/mm、2.18kV/mm and 1.08kV/mm
respectively lower than that of T910 paper. As for TUK paper, its breakdown electric field,
which is 11.51kV/mm, is slightly lower than T910 paper at 0.08mm. All three paper
materials reach their own maximum values in breakdown electric field at 0.13mm.
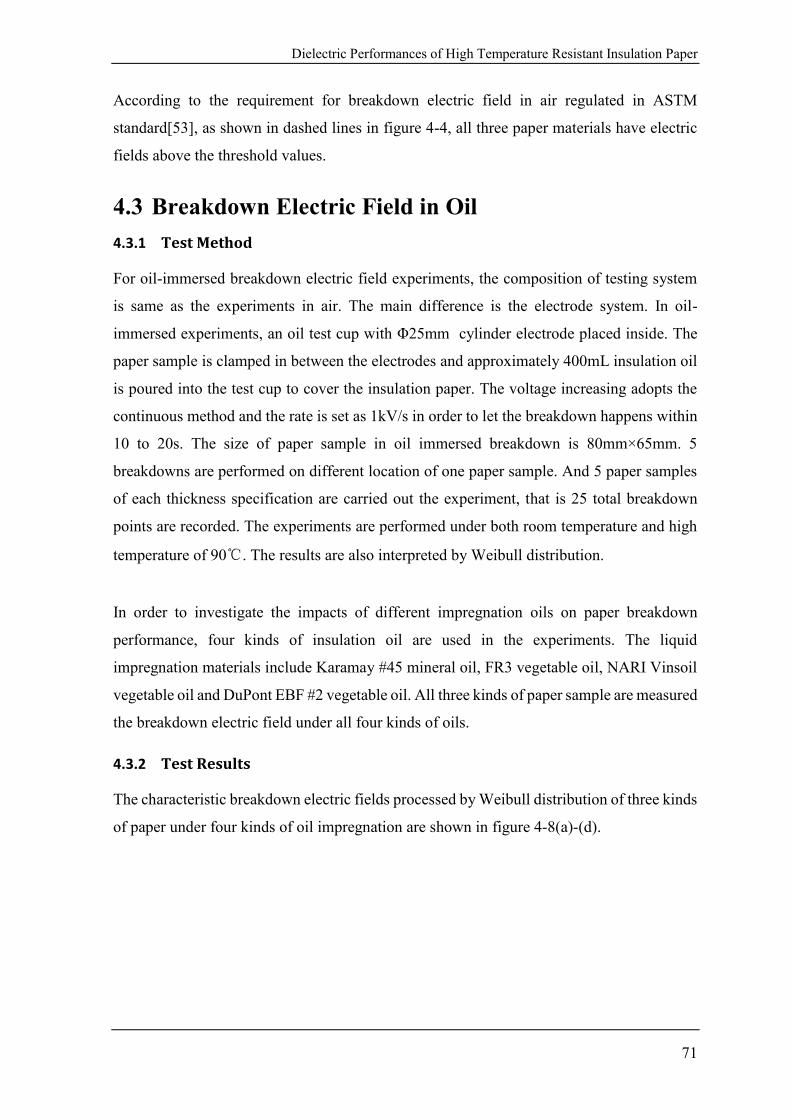
Dielectric Performances of High Temperature Resistant Insulation Paper
71
According to the requirement for breakdown electric field in air regulated in ASTM
standard[53], as shown in dashed lines in figure 4-4, all three paper materials have electric
fields above the threshold values.
4.3 Breakdown Electric Field in Oil
4.3.1 Test Method
For oil-immersed breakdown electric field experiments, the composition of testing system
is same as the experiments in air. The main difference is the electrode system. In oil-
immersed experiments, an oil test cup with Φ25mm cylinder electrode placed inside. The
paper sample is clamped in between the electrodes and approximately 400mL insulation oil
is poured into the test cup to cover the insulation paper. The voltage increasing adopts the
continuous method and the rate is set as 1kV/s in order to let the breakdown happens within
10 to 20s. The size of paper sample in oil immersed breakdown is 80mm×65mm. 5
breakdowns are performed on different location of one paper sample. And 5 paper samples
of each thickness specification are carried out the experiment, that is 25 total breakdown
points are recorded. The experiments are performed under both room temperature and high
temperature of 90℃. The results are also interpreted by Weibull distribution.
In order to investigate the impacts of different impregnation oils on paper breakdown
performance, four kinds of insulation oil are used in the experiments. The liquid
impregnation materials include Karamay #45 mineral oil, FR3 vegetable oil, NARI Vinsoil
vegetable oil and DuPont EBF #2 vegetable oil. All three kinds of paper sample are measured
the breakdown electric field under all four kinds of oils.
4.3.2 Test Results
The characteristic breakdown electric fields processed by Weibull distribution of three kinds
of paper under four kinds of oil impregnation are shown in figure 4-8(a)-(d).
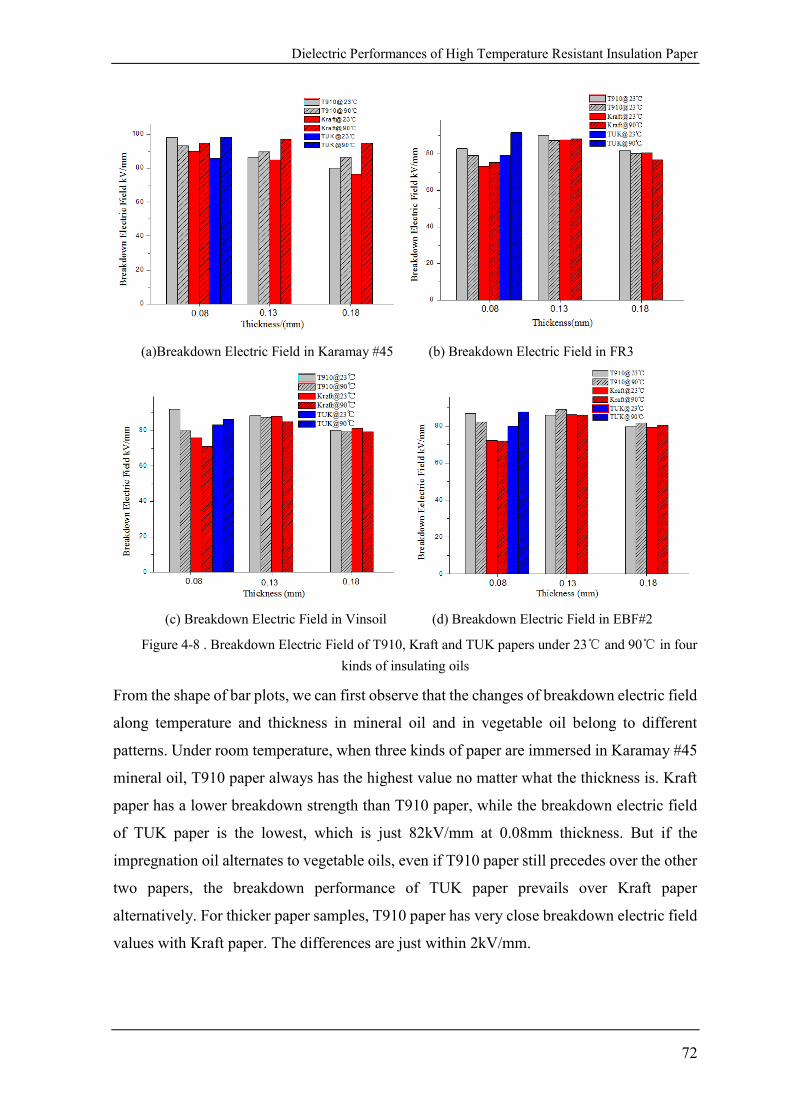
Dielectric Performances of High Temperature Resistant Insulation Paper
72
(a)Breakdown Electric Field in Karamay #45 (b) Breakdown Electric Field in FR3
(c) Breakdown Electric Field in Vinsoil (d) Breakdown Electric Field in EBF#2
Figure 4-8 . Breakdown Electric Field of T910, Kraft and TUK papers under 23℃ and 90℃ in four
kinds of insulating oils
From the shape of bar plots, we can first observe that the changes of breakdown electric field
along temperature and thickness in mineral oil and in vegetable oil belong to different
patterns. Under room temperature, when three kinds of paper are immersed in Karamay #45
mineral oil, T910 paper always has the highest value no matter what the thickness is. Kraft
paper has a lower breakdown strength than T910 paper, while the breakdown electric field
of TUK paper is the lowest, which is just 82kV/mm at 0.08mm thickness. But if the
impregnation oil alternates to vegetable oils, even if T910 paper still precedes over the other
two papers, the breakdown performance of TUK paper prevails over Kraft paper
alternatively. For thicker paper samples, T910 paper has very close breakdown electric field
values with Kraft paper. The differences are just within 2kV/mm.
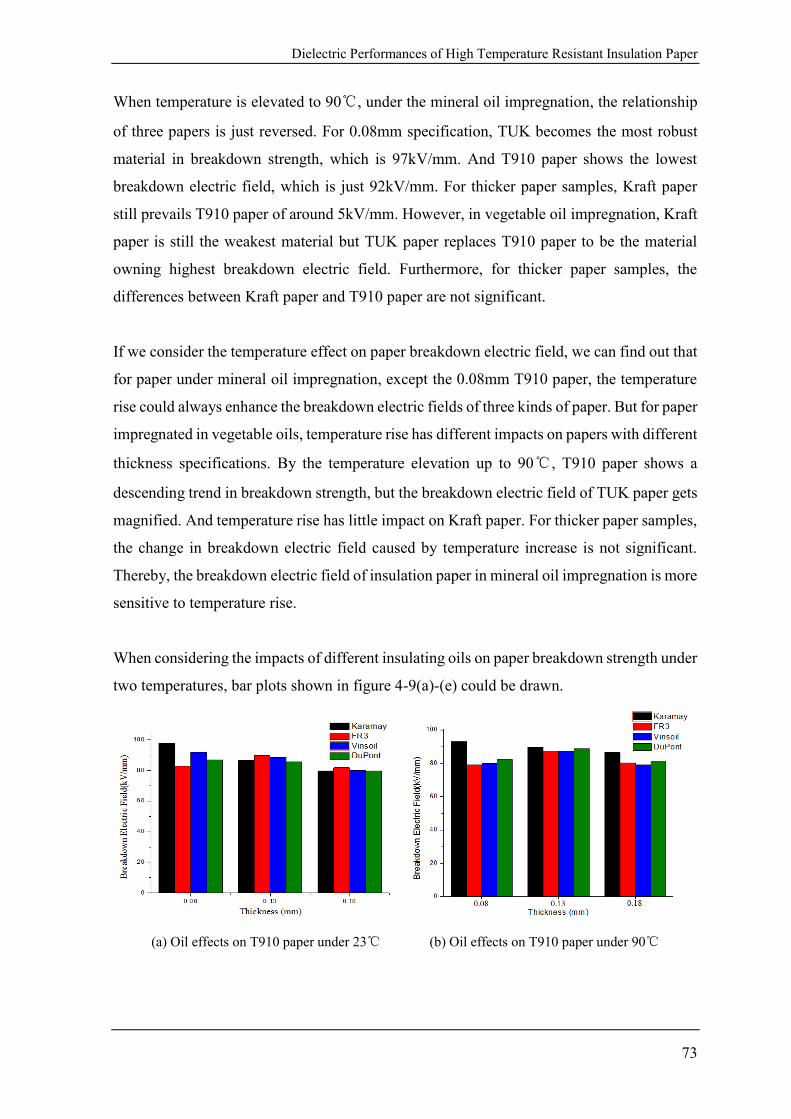
Dielectric Performances of High Temperature Resistant Insulation Paper
73
When temperature is elevated to 90℃, under the mineral oil impregnation, the relationship
of three papers is just reversed. For 0.08mm specification, TUK becomes the most robust
material in breakdown strength, which is 97kV/mm. And T910 paper shows the lowest
breakdown electric field, which is just 92kV/mm. For thicker paper samples, Kraft paper
still prevails T910 paper of around 5kV/mm. However, in vegetable oil impregnation, Kraft
paper is still the weakest material but TUK paper replaces T910 paper to be the material
owning highest breakdown electric field. Furthermore, for thicker paper samples, the
differences between Kraft paper and T910 paper are not significant.
If we consider the temperature effect on paper breakdown electric field, we can find out that
for paper under mineral oil impregnation, except the 0.08mm T910 paper, the temperature
rise could always enhance the breakdown electric fields of three kinds of paper. But for paper
impregnated in vegetable oils, temperature rise has different impacts on papers with different
thickness specifications. By the temperature elevation up to 90℃, T910 paper shows a
descending trend in breakdown strength, but the breakdown electric field of TUK paper gets
magnified. And temperature rise has little impact on Kraft paper. For thicker paper samples,
the change in breakdown electric field caused by temperature increase is not significant.
Thereby, the breakdown electric field of insulation paper in mineral oil impregnation is more
sensitive to temperature rise.
When considering the impacts of different insulating oils on paper breakdown strength under
two temperatures, bar plots shown in figure 4-9(a)-(e) could be drawn.
(a) Oil effects on T910 paper under 23℃ (b) Oil effects on T910 paper under 90℃
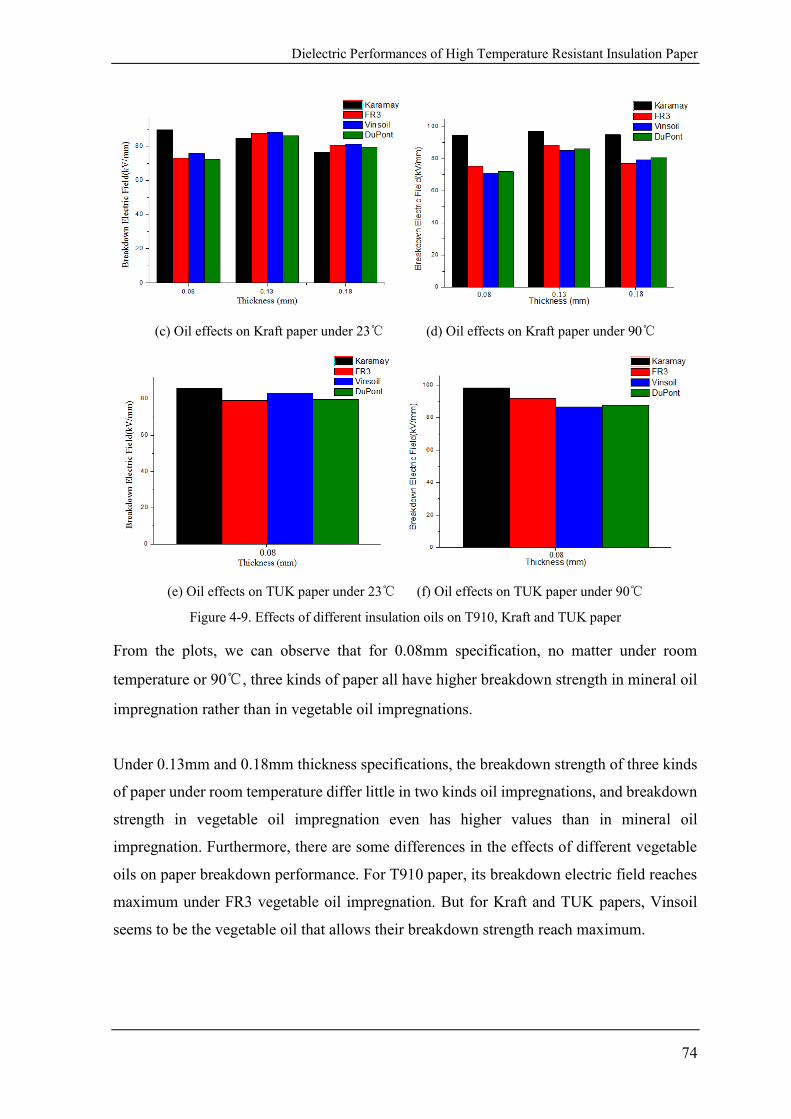
Dielectric Performances of High Temperature Resistant Insulation Paper
74
(c) Oil effects on Kraft paper under 23℃ (d) Oil effects on Kraft paper under 90℃
(e) Oil effects on TUK paper under 23℃ (f) Oil effects on TUK paper under 90℃
Figure 4-9. Effects of different insulation oils on T910, Kraft and TUK paper
From the plots, we can observe that for 0.08mm specification, no matter under room
temperature or 90℃, three kinds of paper all have higher breakdown strength in mineral oil
impregnation rather than in vegetable oil impregnations.
Under 0.13mm and 0.18mm thickness specifications, the breakdown strength of three kinds
of paper under room temperature differ little in two kinds oil impregnations, and breakdown
strength in vegetable oil impregnation even has higher values than in mineral oil
impregnation. Furthermore, there are some differences in the effects of different vegetable
oils on paper breakdown performance. For T910 paper, its breakdown electric field reaches
maximum under FR3 vegetable oil impregnation. But for Kraft and TUK papers, Vinsoil
seems to be the vegetable oil that allows their breakdown strength reach maximum.
Dielectric Performances of High Temperature Resistant Insulation Paper
75
However, when temperature is elevated to 90℃, mineral oil exhibits its advantage in higher
incurred electric field, especially for Kraft paper. The advantage of 0.13mm Kraft paper’s
breakdown strength in mineral oil over that in vegetable oil is around 10kV/mm. And for
0.18mm Kraft paper, the breakdown strength in mineral oil is approximately 15kV/mm over
that in vegetable oil. The advantages of T910 paper in mineral oil over in vegetable oil are
more moderate. The differences are only within 5kV/mm.
Physiochemical Performances of High Temperature Resistant Insulation Oil
76
5 Physiochemical Performances of High Temperature
Resistant Insulation Oil
The performance of insulation oil also has great influence on transformer healthy and safe
operation. Transformer insulation system usually consists of solid and liquid materials and
its insulation condition is determined by both materials. Insulation paper is immersed in
insulation oil and oil condition will affect the aging rate and operation condition of paper to
some extent. In this chapter, three key parameters indicating insulation oil behavior of all
four kinds of oil materials are investigated, including viscosity, total acid number and water
content. All the experiments are carried out towards oil samples unused and preconditioned
by degassing and dehydration. The differences among four oils are analyzed.
5.1 Viscosity
5.1.1 Test Method
When liquids are flowing, the nature of the inter-molecule friction is known as the viscidity
of liquid, whose magnitude is scaled by viscosity. The notion of viscosity of insulation oil is
the same as normal liquids, which is the internal friction. Under the external force, the
insulation oil will have a laminar flow phenomenon and there will exist internal friction
among macromolecules. The greater the internal friction of insulation oil, the bigger the
viscosity and the harder the oil could flow. This means that the insulation oil has a bad
performance on heat dissipation. Viscosity is a key thermal parameter of transformer oil,
indicating its cooling ability. At the meantime, viscosity is a mirror to reflect the aging
condition of insulation oil. After insulation oil is oxidized, its viscosity usually experiences
an increase. There are two commonly used viscosity types, kinematic viscosity and dynamic
viscosity.
According to Newton fluid law, during the flowing of fluid, the shear stress τ is proportional
to the velocity gradient of the fluid. The scaling factor is called kinematic viscosity.
dX
dV (5-1)
Where,
τ——shear stress,force applied per unit area,MPa, Pa, mPa;
Physiochemical Performances of High Temperature Resistant Insulation Oil
77
dX
dV——shear rate,velocity gradient formed in flowing layer,1/s;
η——kinematic viscosity,cp, 1cp=1mPa·s.
The dynamic viscosity is the ratio of the fluid kinematic viscosity and its density ρ under
same temperature. The unit of dynamic viscosity is m2/s. The calculation formula is as
following.
(5-2)
The thesis utilizes Brookfield DVII+Pro rotational viscometer to measure the kinematic
viscosity of oil samples according to ASTM D445 Standard Test Method for Kinematic
Viscosity of Transparent and Opaque Liquids (and Calculation of Dynamic Viscosity)[60].
The rotational viscometer adopts the viscosity rotational measurement principle. The
viscosity is determined by measuring the torque generated by the continuous rotation of a
rotor placed inside the oil sample under test. The torque is proportional to the resistance
formed by viscous dilatory effect of the rotor immersed in the samples and then proportional
to viscosity. The kinematic viscosity of each oil sample is measured under both 40℃ and
90℃. Two oil samples of each oil type are measured and the average result is calculated
according to the standard.
5.1.2 Test Results
The results of viscosity measurement under 40℃ and 90℃ of four kinds of oil are listed in
table 5-1.
Table 5-1 Comparison of Kinematic Viscosity Between Mineral Oil and Vegetable Oils
Temperature FR3 EBF #2 Vinsoil Karamay #45
40℃/cP 29.70 34.65 29.05 8.4
90℃/cP 8.43 9.00 8.16 2.51
From the table, we can find out that the viscosities of vegetable oils are much greater than
mineral oil on both two temperatures. The viscosity of vegetable oil is nearly four times of
that of mineral oil under 40℃, while under 90℃ the ratio becomes to 3.5. As the temperature
rises, both mineral oil and vegetable oil experience a decline in viscosity and the decreasing
levels of mineral oil and vegetable oil are close. As temperature rises from 40℃ to 90℃, the
Physiochemical Performances of High Temperature Resistant Insulation Oil
78
viscosities of vegetable oils drop around 72%, from 29~35cP to 8~9cP, while the viscosity
of mineral oil drops 70%, from 8.4cP to 2.51cP. Among the three vegetable oils, the viscosity
of DuPont EBF#2 is the greatest, while the viscosity of NARI vinsoil is the lowest.
The higher viscosity of vegetable oil is determined by its structural characteristic. As its
main component, the triglycerides have longer molecular chains and bigger average
molecular weight. This will hinder the flow of vegetable oil molecule and thus its viscosity
is greater than mineral oil. The greater viscosity is sort of disadvantage of vegetable oils. But
it could be partially compensated by reasonable design of transformer oil-flow structure and
strengthening of the cooling methods. Therefore, the conventional requirements on viscosity
aimed at mineral oil are not completely suitable for vegetable oils. Some international
standard organizations, e.g. ASTM, IEEE and IEC[61-63], have proposed new technical
specifications on vegetable oils. The novel requirements on viscosity of vegetable oils is
below 50cP under 40℃. All the test results meet that requirement.
5.2 Total Acid Number
5.2.1 Test Method
The total acid number is a key indicator on the insulation oil condition. As aging goes on,
the acids are accumulated in the oil and thus the total acid number of oil will increase.
Therefore, the total acid number could reflect the aging condition of insulation oil. Besides,
the low molecular acids are considered to threaten the healthy condition of insulation paper.
So the initial total acid number of oil should maintain at a low level. For traditional mineral
oil, the requirement on the initial total acid number of IEC and other international standards
is below 0.01mgKOH/g.
The total acid number is defined as the amount of KOH in mg to neutralize 1g sample under
test, and its unit is mgKOH/g. The measurement of total acid number of oil samples refers
to ASTM D664 Standard Test Method for Acid Number of Petroleum Products by
Potentiometric Titration[64]. The titration apparatus used is Metrohm 848 Titrino plus
titrator, whose buret accuracy is 1/10000. The test electrode is Metrohm 6.0229.100.
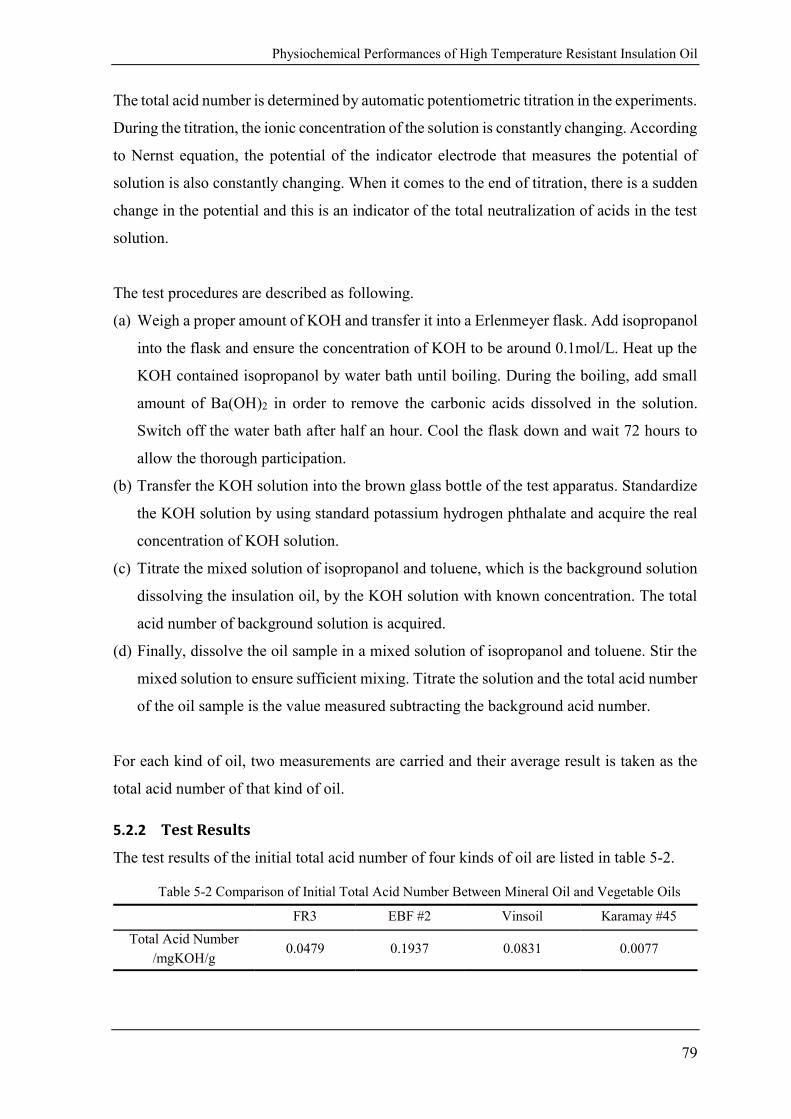
Physiochemical Performances of High Temperature Resistant Insulation Oil
79
The total acid number is determined by automatic potentiometric titration in the experiments.
During the titration, the ionic concentration of the solution is constantly changing. According
to Nernst equation, the potential of the indicator electrode that measures the potential of
solution is also constantly changing. When it comes to the end of titration, there is a sudden
change in the potential and this is an indicator of the total neutralization of acids in the test
solution.
The test procedures are described as following.
(a) Weigh a proper amount of KOH and transfer it into a Erlenmeyer flask. Add isopropanol
into the flask and ensure the concentration of KOH to be around 0.1mol/L. Heat up the
KOH contained isopropanol by water bath until boiling. During the boiling, add small
amount of Ba(OH)2 in order to remove the carbonic acids dissolved in the solution.
Switch off the water bath after half an hour. Cool the flask down and wait 72 hours to
allow the thorough participation.
(b) Transfer the KOH solution into the brown glass bottle of the test apparatus. Standardize
the KOH solution by using standard potassium hydrogen phthalate and acquire the real
concentration of KOH solution.
(c) Titrate the mixed solution of isopropanol and toluene, which is the background solution
dissolving the insulation oil, by the KOH solution with known concentration. The total
acid number of background solution is acquired.
(d) Finally, dissolve the oil sample in a mixed solution of isopropanol and toluene. Stir the
mixed solution to ensure sufficient mixing. Titrate the solution and the total acid number
of the oil sample is the value measured subtracting the background acid number.
For each kind of oil, two measurements are carried and their average result is taken as the
total acid number of that kind of oil.
5.2.2 Test Results
The test results of the initial total acid number of four kinds of oil are listed in table 5-2.
Table 5-2 Comparison of Initial Total Acid Number Between Mineral Oil and Vegetable Oils
FR3 EBF #2 Vinsoil Karamay #45
Total Acid Number
/mgKOH/g 0.0479 0.1937 0.0831 0.0077
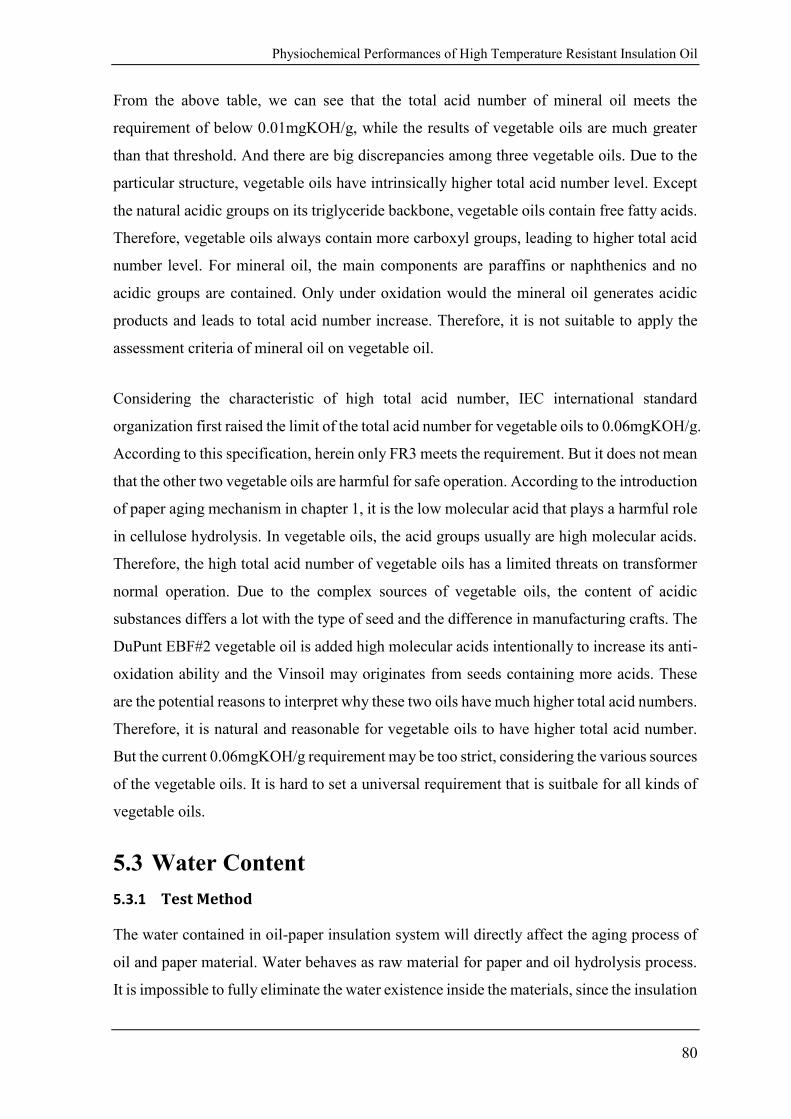
Physiochemical Performances of High Temperature Resistant Insulation Oil
80
From the above table, we can see that the total acid number of mineral oil meets the
requirement of below 0.01mgKOH/g, while the results of vegetable oils are much greater
than that threshold. And there are big discrepancies among three vegetable oils. Due to the
particular structure, vegetable oils have intrinsically higher total acid number level. Except
the natural acidic groups on its triglyceride backbone, vegetable oils contain free fatty acids.
Therefore, vegetable oils always contain more carboxyl groups, leading to higher total acid
number level. For mineral oil, the main components are paraffins or naphthenics and no
acidic groups are contained. Only under oxidation would the mineral oil generates acidic
products and leads to total acid number increase. Therefore, it is not suitable to apply the
assessment criteria of mineral oil on vegetable oil.
Considering the characteristic of high total acid number, IEC international standard
organization first raised the limit of the total acid number for vegetable oils to 0.06mgKOH/g.
According to this specification, herein only FR3 meets the requirement. But it does not mean
that the other two vegetable oils are harmful for safe operation. According to the introduction
of paper aging mechanism in chapter 1, it is the low molecular acid that plays a harmful role
in cellulose hydrolysis. In vegetable oils, the acid groups usually are high molecular acids.
Therefore, the high total acid number of vegetable oils has a limited threats on transformer
normal operation. Due to the complex sources of vegetable oils, the content of acidic
substances differs a lot with the type of seed and the difference in manufacturing crafts. The
DuPunt EBF#2 vegetable oil is added high molecular acids intentionally to increase its anti-
oxidation ability and the Vinsoil may originates from seeds containing more acids. These
are the potential reasons to interpret why these two oils have much higher total acid numbers.
Therefore, it is natural and reasonable for vegetable oils to have higher total acid number.
But the current 0.06mgKOH/g requirement may be too strict, considering the various sources
of the vegetable oils. It is hard to set a universal requirement that is suitbale for all kinds of
vegetable oils.
5.3 Water Content
5.3.1 Test Method
The water contained in oil-paper insulation system will directly affect the aging process of
oil and paper material. Water behaves as raw material for paper and oil hydrolysis process.
It is impossible to fully eliminate the water existence inside the materials, since the insulation
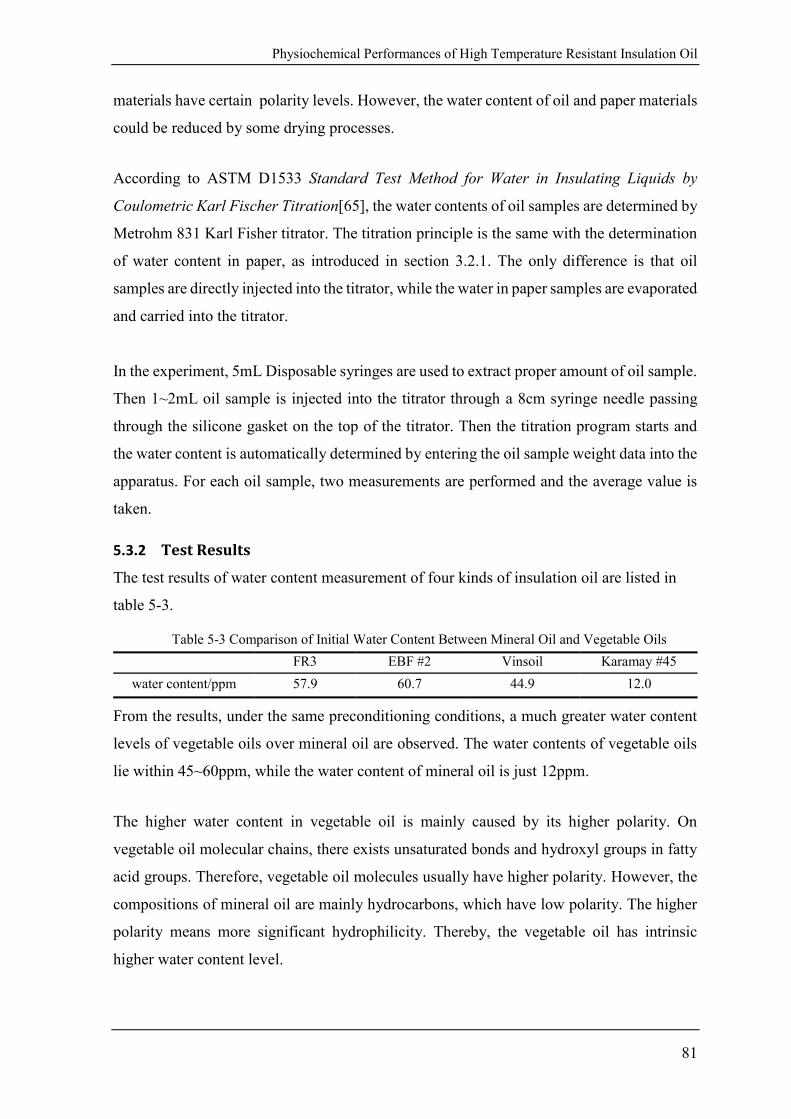
Physiochemical Performances of High Temperature Resistant Insulation Oil
81
materials have certain polarity levels. However, the water content of oil and paper materials
could be reduced by some drying processes.
According to ASTM D1533 Standard Test Method for Water in Insulating Liquids by
Coulometric Karl Fischer Titration[65], the water contents of oil samples are determined by
Metrohm 831 Karl Fisher titrator. The titration principle is the same with the determination
of water content in paper, as introduced in section 3.2.1. The only difference is that oil
samples are directly injected into the titrator, while the water in paper samples are evaporated
and carried into the titrator.
In the experiment, 5mL Disposable syringes are used to extract proper amount of oil sample.
Then 1~2mL oil sample is injected into the titrator through a 8cm syringe needle passing
through the silicone gasket on the top of the titrator. Then the titration program starts and
the water content is automatically determined by entering the oil sample weight data into the
apparatus. For each oil sample, two measurements are performed and the average value is
taken.
5.3.2 Test Results
The test results of water content measurement of four kinds of insulation oil are listed in
table 5-3.
Table 5-3 Comparison of Initial Water Content Between Mineral Oil and Vegetable Oils
FR3 EBF #2 Vinsoil Karamay #45
water content/ppm 57.9 60.7 44.9 12.0
From the results, under the same preconditioning conditions, a much greater water content
levels of vegetable oils over mineral oil are observed. The water contents of vegetable oils
lie within 45~60ppm, while the water content of mineral oil is just 12ppm.
The higher water content in vegetable oil is mainly caused by its higher polarity. On
vegetable oil molecular chains, there exists unsaturated bonds and hydroxyl groups in fatty
acid groups. Therefore, vegetable oil molecules usually have higher polarity. However, the
compositions of mineral oil are mainly hydrocarbons, which have low polarity. The higher
polarity means more significant hydrophilicity. Thereby, the vegetable oil has intrinsic
higher water content level.
Physiochemical Performances of High Temperature Resistant Insulation Oil
82
Main international standard organizations have established the water content restrictions for
mineral oil and vegetable oil separately. The upper limit of water content for mineral oil
before operation is 20ppm and the upper limit for vegetable oil is 200ppm. The test results
of all four oil samples after preconditioning meet the requirements of relevant standard.
Results and Analysis of Accelerated Aging Experiment of High Temperature Resistant Insulation System
83
6 Results and Analysis of Accelerated Aging Experiment
of High Temperature Resistant Insulation System
Good insulation materials should not only have excellent initial insulating properties, but
also maintain a stable and healthy state during the long-term operation. The comparison of
initial performances of insulating materials is not sufficient enough to reveal the advantages
and disadvantages thoroughly. The changes of key parameters during the long-term run
should also be investigated. Due to the time limitation, the aging experiment usually elevates
the temperature in order to accelerate the aging and thus acquire the anticipated outcome in
a short time. For a traditional 55℃ temperature-rise Kraft paper insulation system, assuming
the room temperature to be 30℃, the designed hot spot temperature inside transformer is
95℃. Under this temperature, Kraft paper could run steadily and healthily for many years,
as long as 30 years according to CIGRE D1.323 report. Therefore, the thesis adopts 150℃
as the aging temperature. According to Montsinger 6~8℃ rule, the aging rate is sharply
increased and the life of material is substantially shortened, and thus an obvious change in
properties could be observed. TUK paper has been applied for more than 50 years and it has
been commonly acknowledged that it has a 10~15℃ leading in thermal class over Kraft
paper.
In this chapter, the thesis more focuses on the novel high-temperature resistant materials.
Therefore, T910 and DMD papers are chosen as the solid aging objectives, and Kraft paper
is also aged as a base comparison material. All paper materials are aged in FR3 vegetable
oil impregnation. This chapter mainly introduces the test results from a point of view of the
changing in the properties of paper and oil materials. The test methods are consistent with
the experiments of initial paper and oil properties and have been described in former chapters.
Thus the detailed test methods are omitted in this chapter.
6.1 Variation in Insulation Paper Performance Before
and After Aging
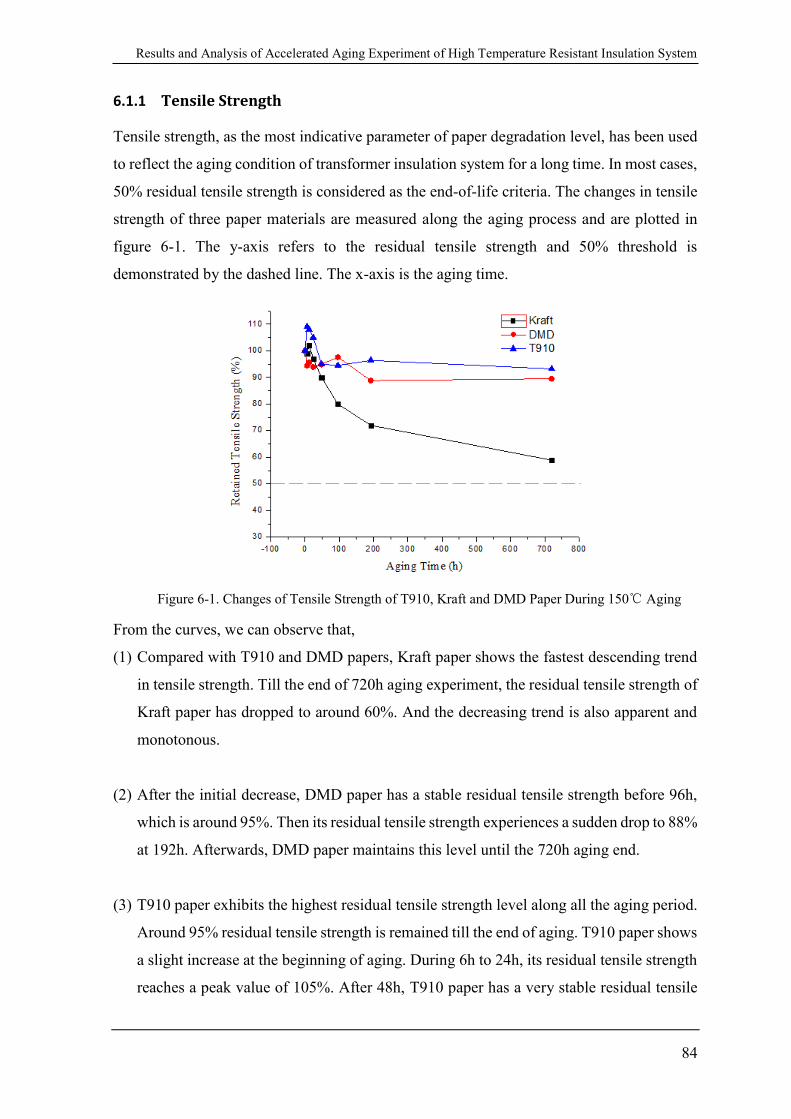
Results and Analysis of Accelerated Aging Experiment of High Temperature Resistant Insulation System
84
6.1.1 Tensile Strength
Tensile strength, as the most indicative parameter of paper degradation level, has been used
to reflect the aging condition of transformer insulation system for a long time. In most cases,
50% residual tensile strength is considered as the end-of-life criteria. The changes in tensile
strength of three paper materials are measured along the aging process and are plotted in
figure 6-1. The y-axis refers to the residual tensile strength and 50% threshold is
demonstrated by the dashed line. The x-axis is the aging time.
Figure 6-1. Changes of Tensile Strength of T910, Kraft and DMD Paper During 150℃ Aging
From the curves, we can observe that,
(1) Compared with T910 and DMD papers, Kraft paper shows the fastest descending trend
in tensile strength. Till the end of 720h aging experiment, the residual tensile strength of
Kraft paper has dropped to around 60%. And the decreasing trend is also apparent and
monotonous.
(2) After the initial decrease, DMD paper has a stable residual tensile strength before 96h,
which is around 95%. Then its residual tensile strength experiences a sudden drop to 88%
at 192h. Afterwards, DMD paper maintains this level until the 720h aging end.
(3) T910 paper exhibits the highest residual tensile strength level along all the aging period.
Around 95% residual tensile strength is remained till the end of aging. T910 paper shows
a slight increase at the beginning of aging. During 6h to 24h, its residual tensile strength
reaches a peak value of 105%. After 48h, T910 paper has a very stable residual tensile
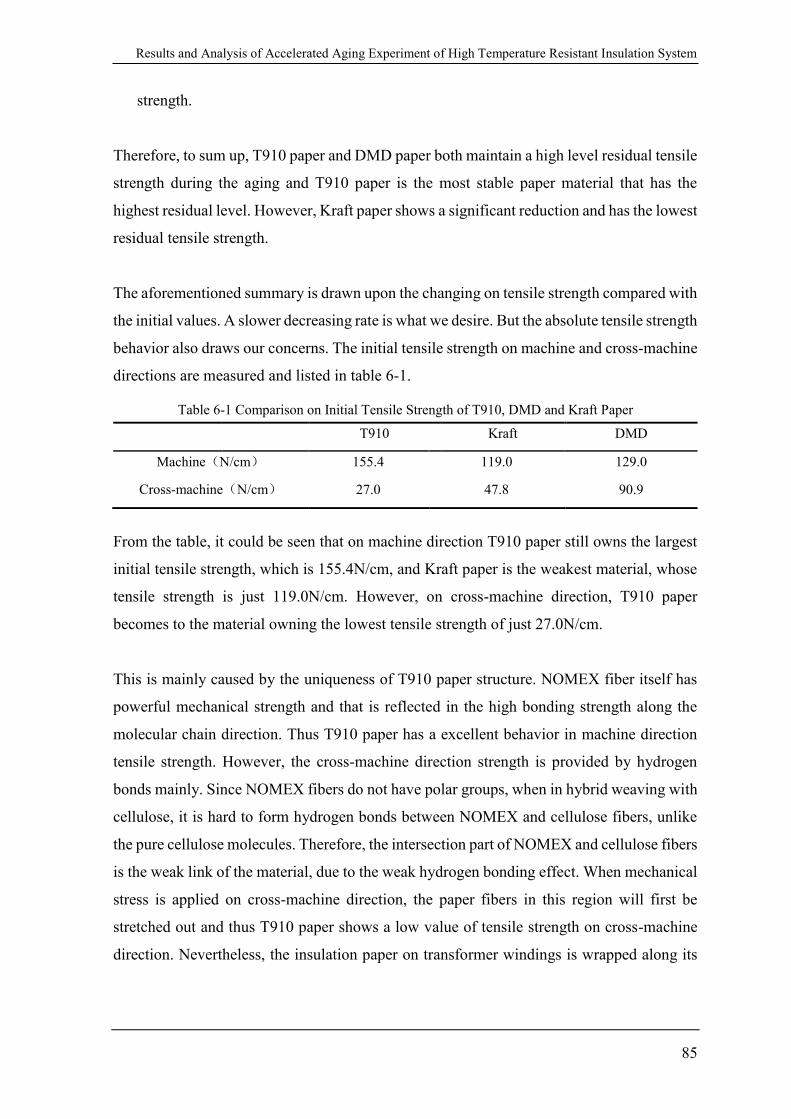
Results and Analysis of Accelerated Aging Experiment of High Temperature Resistant Insulation System
85
strength.
Therefore, to sum up, T910 paper and DMD paper both maintain a high level residual tensile
strength during the aging and T910 paper is the most stable paper material that has the
highest residual level. However, Kraft paper shows a significant reduction and has the lowest
residual tensile strength.
The aforementioned summary is drawn upon the changing on tensile strength compared with
the initial values. A slower decreasing rate is what we desire. But the absolute tensile strength
behavior also draws our concerns. The initial tensile strength on machine and cross-machine
directions are measured and listed in table 6-1.
Table 6-1 Comparison on Initial Tensile Strength of T910, DMD and Kraft Paper
T910 Kraft DMD
Machine(N/cm) 155.4 119.0 129.0
Cross-machine(N/cm) 27.0 47.8 90.9
From the table, it could be seen that on machine direction T910 paper still owns the largest
initial tensile strength, which is 155.4N/cm, and Kraft paper is the weakest material, whose
tensile strength is just 119.0N/cm. However, on cross-machine direction, T910 paper
becomes to the material owning the lowest tensile strength of just 27.0N/cm.
This is mainly caused by the uniqueness of T910 paper structure. NOMEX fiber itself has
powerful mechanical strength and that is reflected in the high bonding strength along the
molecular chain direction. Thus T910 paper has a excellent behavior in machine direction
tensile strength. However, the cross-machine direction strength is provided by hydrogen
bonds mainly. Since NOMEX fibers do not have polar groups, when in hybrid weaving with
cellulose, it is hard to form hydrogen bonds between NOMEX and cellulose fibers, unlike
the pure cellulose molecules. Therefore, the intersection part of NOMEX and cellulose fibers
is the weak link of the material, due to the weak hydrogen bonding effect. When mechanical
stress is applied on cross-machine direction, the paper fibers in this region will first be
stretched out and thus T910 paper shows a low value of tensile strength on cross-machine
direction. Nevertheless, the insulation paper on transformer windings is wrapped along its
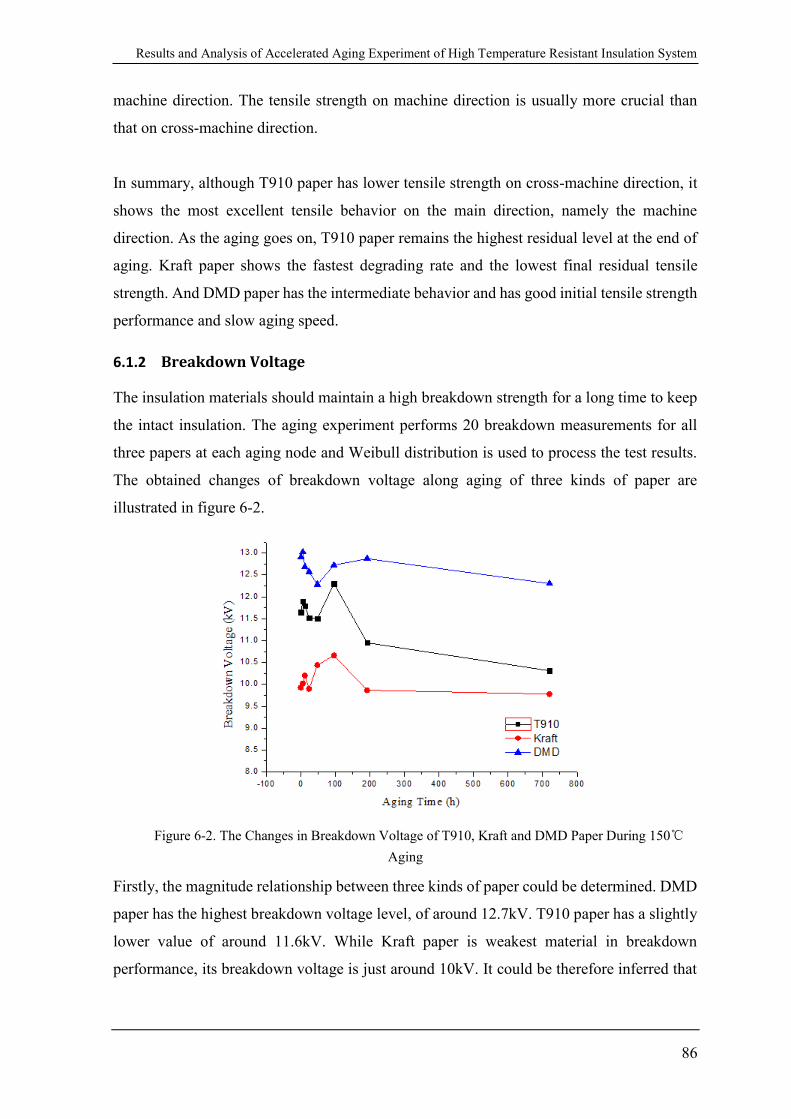
Results and Analysis of Accelerated Aging Experiment of High Temperature Resistant Insulation System
86
machine direction. The tensile strength on machine direction is usually more crucial than
that on cross-machine direction.
In summary, although T910 paper has lower tensile strength on cross-machine direction, it
shows the most excellent tensile behavior on the main direction, namely the machine
direction. As the aging goes on, T910 paper remains the highest residual level at the end of
aging. Kraft paper shows the fastest degrading rate and the lowest final residual tensile
strength. And DMD paper has the intermediate behavior and has good initial tensile strength
performance and slow aging speed.
6.1.2 Breakdown Voltage
The insulation materials should maintain a high breakdown strength for a long time to keep
the intact insulation. The aging experiment performs 20 breakdown measurements for all
three papers at each aging node and Weibull distribution is used to process the test results.
The obtained changes of breakdown voltage along aging of three kinds of paper are
illustrated in figure 6-2.
Figure 6-2. The Changes in Breakdown Voltage of T910, Kraft and DMD Paper During 150℃
Aging
Firstly, the magnitude relationship between three kinds of paper could be determined. DMD
paper has the highest breakdown voltage level, of around 12.7kV. T910 paper has a slightly
lower value of around 11.6kV. While Kraft paper is weakest material in breakdown
performance, its breakdown voltage is just around 10kV. It could be therefore inferred that
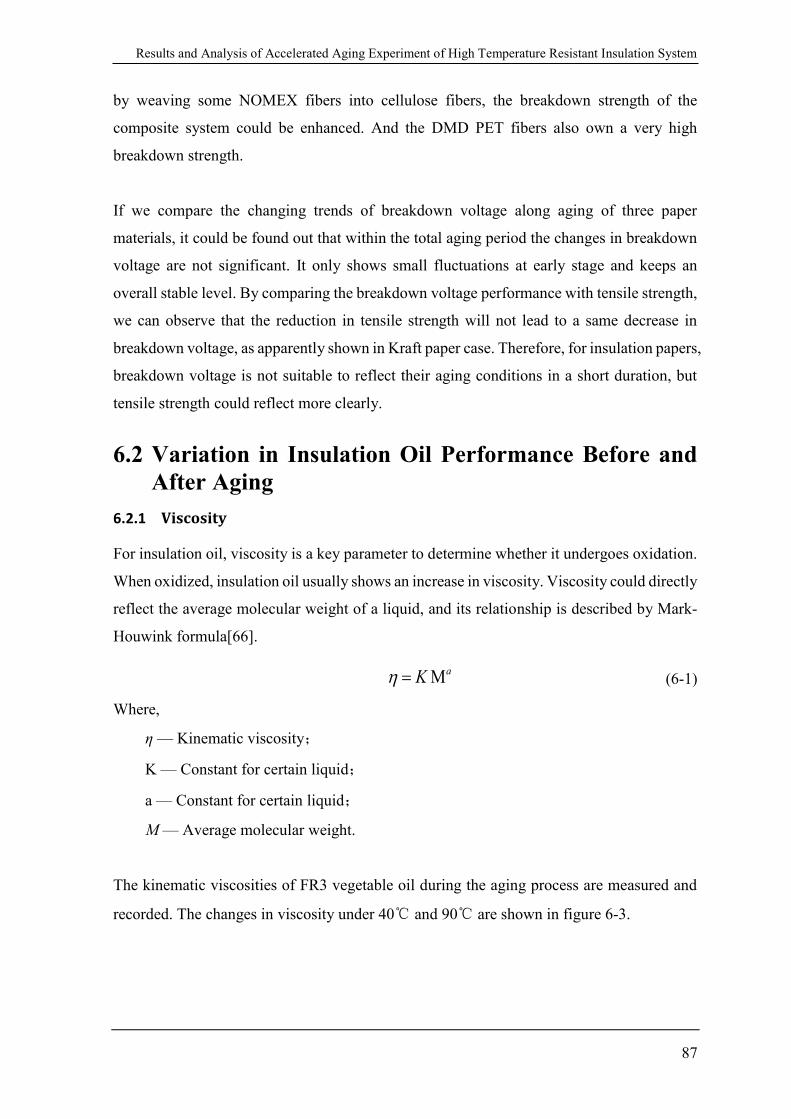
Results and Analysis of Accelerated Aging Experiment of High Temperature Resistant Insulation System
87
by weaving some NOMEX fibers into cellulose fibers, the breakdown strength of the
composite system could be enhanced. And the DMD PET fibers also own a very high
breakdown strength.
If we compare the changing trends of breakdown voltage along aging of three paper
materials, it could be found out that within the total aging period the changes in breakdown
voltage are not significant. It only shows small fluctuations at early stage and keeps an
overall stable level. By comparing the breakdown voltage performance with tensile strength,
we can observe that the reduction in tensile strength will not lead to a same decrease in
breakdown voltage, as apparently shown in Kraft paper case. Therefore, for insulation papers,
breakdown voltage is not suitable to reflect their aging conditions in a short duration, but
tensile strength could reflect more clearly.
6.2 Variation in Insulation Oil Performance Before and
After Aging
6.2.1 Viscosity
For insulation oil, viscosity is a key parameter to determine whether it undergoes oxidation.
When oxidized, insulation oil usually shows an increase in viscosity. Viscosity could directly
reflect the average molecular weight of a liquid, and its relationship is described by Mark-
Houwink formula[66].
MaK (6-1)
Where,
η — Kinematic viscosity;
K — Constant for certain liquid;
a — Constant for certain liquid;
M — Average molecular weight.
The kinematic viscosities of FR3 vegetable oil during the aging process are measured and
recorded. The changes in viscosity under 40℃ and 90℃ are shown in figure 6-3.
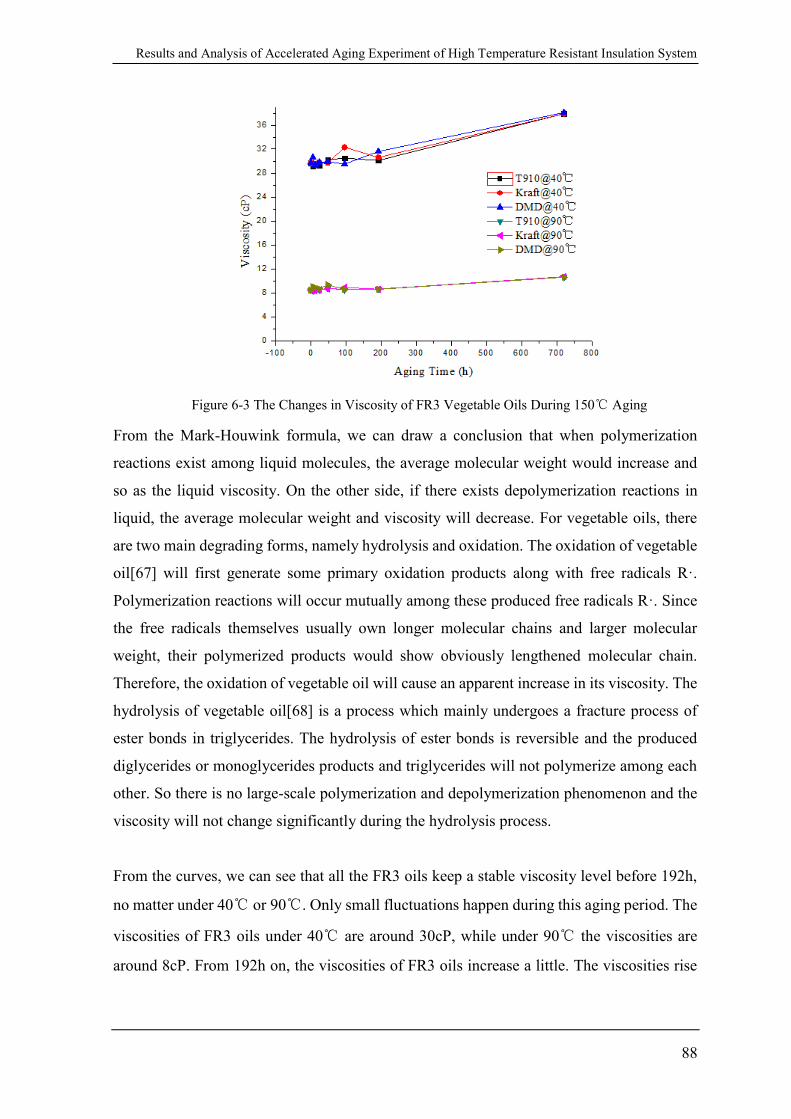
Results and Analysis of Accelerated Aging Experiment of High Temperature Resistant Insulation System
88
Figure 6-3 The Changes in Viscosity of FR3 Vegetable Oils During 150℃ Aging
From the Mark-Houwink formula, we can draw a conclusion that when polymerization
reactions exist among liquid molecules, the average molecular weight would increase and
so as the liquid viscosity. On the other side, if there exists depolymerization reactions in
liquid, the average molecular weight and viscosity will decrease. For vegetable oils, there
are two main degrading forms, namely hydrolysis and oxidation. The oxidation of vegetable
oil[67] will first generate some primary oxidation products along with free radicals R·.
Polymerization reactions will occur mutually among these produced free radicals R·. Since
the free radicals themselves usually own longer molecular chains and larger molecular
weight, their polymerized products would show obviously lengthened molecular chain.
Therefore, the oxidation of vegetable oil will cause an apparent increase in its viscosity. The
hydrolysis of vegetable oil[68] is a process which mainly undergoes a fracture process of
ester bonds in triglycerides. The hydrolysis of ester bonds is reversible and the produced
diglycerides or monoglycerides products and triglycerides will not polymerize among each
other. So there is no large-scale polymerization and depolymerization phenomenon and the
viscosity will not change significantly during the hydrolysis process.
From the curves, we can see that all the FR3 oils keep a stable viscosity level before 192h,
no matter under 40℃ or 90℃. Only small fluctuations happen during this aging period. The
viscosities of FR3 oils under 40℃ are around 30cP, while under 90℃ the viscosities are
around 8cP. From 192h on, the viscosities of FR3 oils increase a little. The viscosities rise
Results and Analysis of Accelerated Aging Experiment of High Temperature Resistant Insulation System
89
up to around 36cP under 40℃ and the increases under 90℃ are not apparent. Therefore, it
could be considered that the vegetable oils are not significantly oxidized before 192h, but
after 192h the vegetable oils are slightly oxidized. The aging vessels are filled in nitrogen to
exclude air and are kept airtight all the time. The effect of oxygen on vegetable oil aging
should be limited. The slight increase on viscosity after 192h may attribute to the air
intrusion during the sampling process. Considering the increases are not significant, the
influence of oxidation on vegetable oil is still limited. The aging process of vegetable oil is
mainly dominated by hydrolysis.
6.2.2 Total Acid Number
The total acid number is a key parameter to indicate whether the traditional mineral oil is
oxidized or not. Mineral oil molecules have no acidic groups or ester bonds that could be
hydrolyzed. But the oxidation of mineral oil will create some hydroxyls attached onto the
molecular chain. Thus a obvious total acid number of mineral oil is usually considered as
caused by oxidation. However, the situation is quite different for vegetable oil. The total acid
numbers of vegetable oils during aging process are measured and the test results are shown
in figure 6-4
Figure 6-4 The Changes in Total Acid Number of FR3 Vegetable Oils During 150℃ Aging
From the curves, we can observe that the total acid numbers of FR3 vegetable oils
cooperating three kinds of paper all increase sharply as aging going on. The total acid
numbers of impregnation FR3 oils of T910, Kraft and DMD paper reach 2.75mgKOH/g,
Results and Analysis of Accelerated Aging Experiment of High Temperature Resistant Insulation System
90
2.25mgKOH/g and 2.0mgKOH/g respectively. The ascending trends of total acid numbers
of three FR3 oils are all monotonous.
From the results of the aforementioned viscosity measurements, a conclusion could be drawn
that vegetable oils mainly endure the hydrolysis as the aging form, instead of oxidation. The
increase in total acid number of vegetable oil is mainly caused by its hydrolysis and this is a
big difference with mineral oil. As the hydrolysis of vegetable oil goes on, the ester bonds
on triglycerides backbone are broken up. And triglycerides will degrade to diglycerides,
monoglycerides and finally glycerin step by step. A long chain fatty acid could be formed
by each fracture of ester bond. Therefore, the complete hydrolysis of each triglycerides could
generate three long chain fatty acids. Thus the total acid number is increased obviously by
the hydrolysis of vegetable oil. This corresponds to what is observed in the experiments. The
long chain fatty acids created by the hydrolysis of vegetable oil are usually water-insoluble
high molecular acids, which have limited threats on insulation paper condition.
Except hydrolysis, the oxidation of vegetable oil will also increase its total acid number level.
Therefore, in real applications, the total acid number could reflect vegetable oil aging
condition, but it could not be used to discuss the effect of oxidation or hydrolysis individually.
6.2.3 DGA
The dissolved gas analysis(DGA) is a common evaluation method to determine the
transformer operation condition. A large quantity of on-site experiences have been
accumulated for many years. Due to the short application time of vegetable oil immersed
transformer, the demand for DGA of vegetable oil is higher and most DGA results of
vegetable oil are coming from laboratory. The gases generated by vegetable oil under fault
conditions share the same types with the gases generated by conventional mineral oil, but
the gas contents are different. The commonly gases measured by DGA are CH4, C2H6, C2H4,
C2H2, H2, CO and CO2. Compared with mineral oil, vegetable oil usually has higher gas
content in CH4, C2H6 and C2H4. The overheating of vegetable oil would incur a substantial
generation of CO and CO2. The production of hydrocarbons is related to the fracture of C-H
and C-C bonds on the backbones of mineral and vegetable oils. The active H and CH groups,
namely free radicals, produced by the fractures would combine each other and then form
hydrocarbons like H2, CH4, C2H6 and so on.
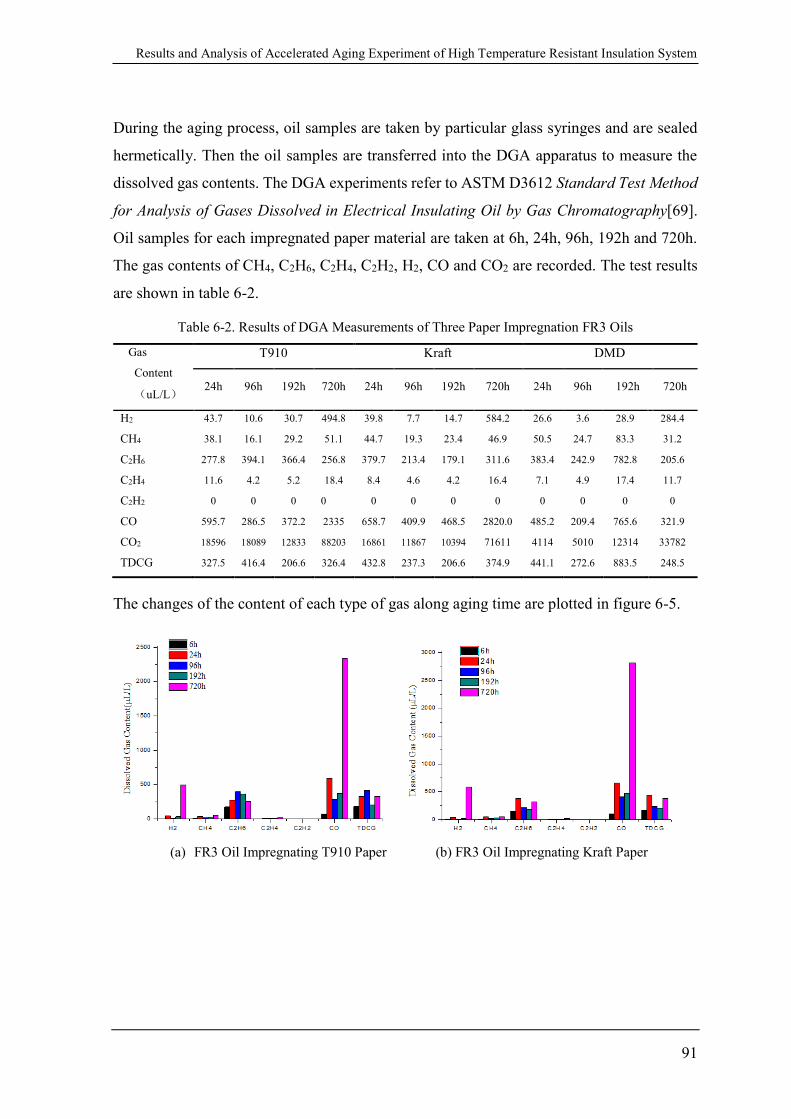
Results and Analysis of Accelerated Aging Experiment of High Temperature Resistant Insulation System
91
During the aging process, oil samples are taken by particular glass syringes and are sealed
hermetically. Then the oil samples are transferred into the DGA apparatus to measure the
dissolved gas contents. The DGA experiments refer to ASTM D3612 Standard Test Method
for Analysis of Gases Dissolved in Electrical Insulating Oil by Gas Chromatography[69].
Oil samples for each impregnated paper material are taken at 6h, 24h, 96h, 192h and 720h.
The gas contents of CH4, C2H6, C2H4, C2H2, H2, CO and CO2 are recorded. The test results
are shown in table 6-2.
Table 6-2. Results of DGA Measurements of Three Paper Impregnation FR3 Oils
Gas
Content
(uL/L)
T910 Kraft DMD
24h 96h 192h 720h 24h 96h 192h 720h 24h 96h 192h 720h
H2 43.7 10.6 30.7 494.8 39.8 7.7 14.7 584.2 26.6 3.6 28.9 284.4
CH4 38.1 16.1 29.2 51.1 44.7 19.3 23.4 46.9 50.5 24.7 83.3 31.2
C2H6 277.8 394.1 366.4 256.8 379.7 213.4 179.1 311.6 383.4 242.9 782.8 205.6
C2H4 11.6 4.2 5.2 18.4 8.4 4.6 4.2 16.4 7.1 4.9 17.4 11.7
C2H2 0 0 0 0 0 0 0 0 0 0 0 0
CO 595.7 286.5 372.2 2335 658.7 409.9 468.5 2820.0 485.2 209.4 765.6 321.9
CO2 18596 18089 12833 88203 16861 11867 10394 71611 4114 5010 12314 33782
TDCG 327.5 416.4 206.6 326.4 432.8 237.3 206.6 374.9 441.1 272.6 883.5 248.5
The changes of the content of each type of gas along aging time are plotted in figure 6-5.
(a) FR3 Oil Impregnating T910 Paper (b) FR3 Oil Impregnating Kraft Paper
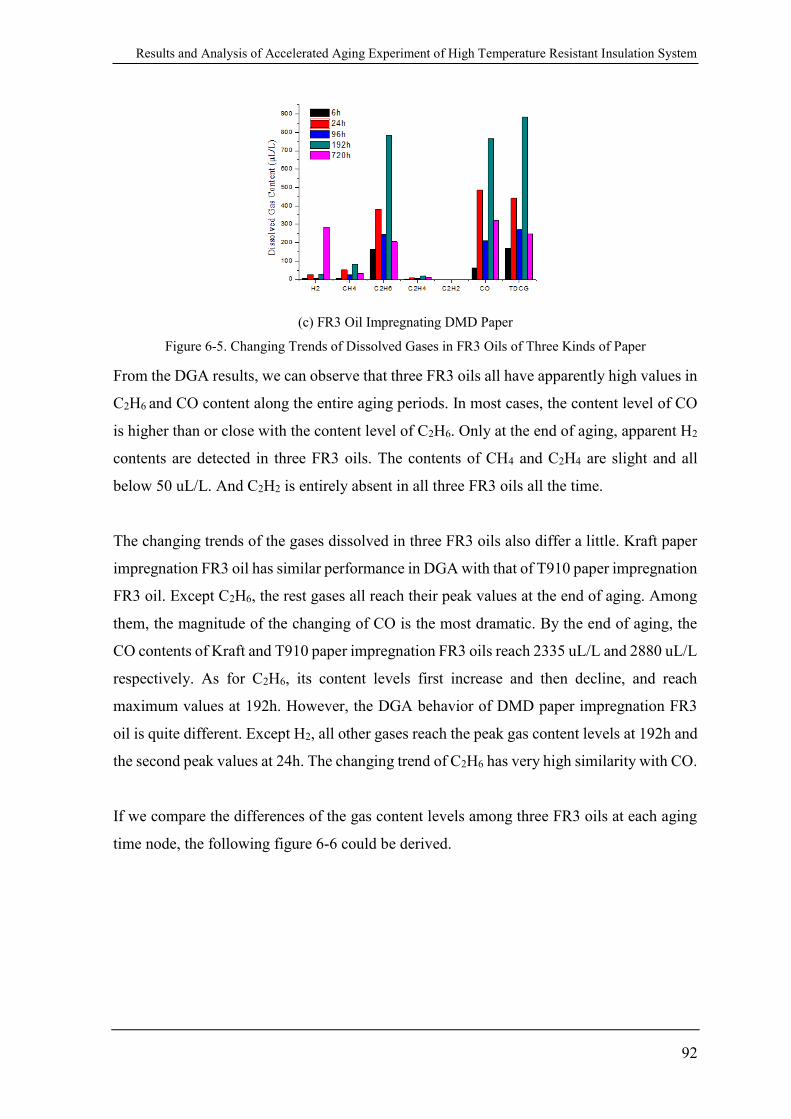
Results and Analysis of Accelerated Aging Experiment of High Temperature Resistant Insulation System
92
(c) FR3 Oil Impregnating DMD Paper
Figure 6-5. Changing Trends of Dissolved Gases in FR3 Oils of Three Kinds of Paper
From the DGA results, we can observe that three FR3 oils all have apparently high values in
C2H6 and CO content along the entire aging periods. In most cases, the content level of CO
is higher than or close with the content level of C2H6. Only at the end of aging, apparent H2
contents are detected in three FR3 oils. The contents of CH4 and C2H4 are slight and all
below 50 uL/L. And C2H2 is entirely absent in all three FR3 oils all the time.
The changing trends of the gases dissolved in three FR3 oils also differ a little. Kraft paper
impregnation FR3 oil has similar performance in DGA with that of T910 paper impregnation
FR3 oil. Except C2H6, the rest gases all reach their peak values at the end of aging. Among
them, the magnitude of the changing of CO is the most dramatic. By the end of aging, the
CO contents of Kraft and T910 paper impregnation FR3 oils reach 2335 uL/L and 2880 uL/L
respectively. As for C2H6, its content levels first increase and then decline, and reach
maximum values at 192h. However, the DGA behavior of DMD paper impregnation FR3
oil is quite different. Except H2, all other gases reach the peak gas content levels at 192h and
the second peak values at 24h. The changing trend of C2H6 has very high similarity with CO.
If we compare the differences of the gas content levels among three FR3 oils at each aging
time node, the following figure 6-6 could be derived.
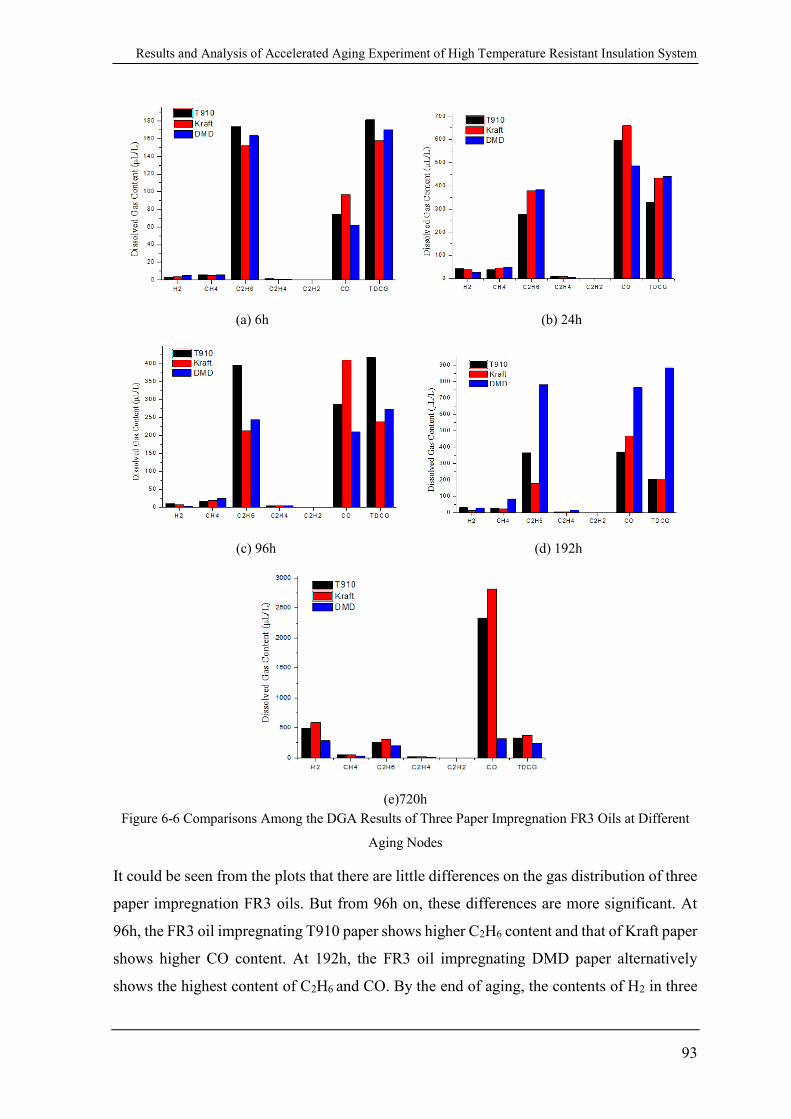
Results and Analysis of Accelerated Aging Experiment of High Temperature Resistant Insulation System
93
(a) 6h (b) 24h
(c) 96h (d) 192h
(e)720h
Figure 6-6 Comparisons Among the DGA Results of Three Paper Impregnation FR3 Oils at Different
Aging Nodes
It could be seen from the plots that there are little differences on the gas distribution of three
paper impregnation FR3 oils. But from 96h on, these differences are more significant. At
96h, the FR3 oil impregnating T910 paper shows higher C2H6 content and that of Kraft paper
shows higher CO content. At 192h, the FR3 oil impregnating DMD paper alternatively
shows the highest content of C2H6 and CO. By the end of aging, the contents of H2 in three
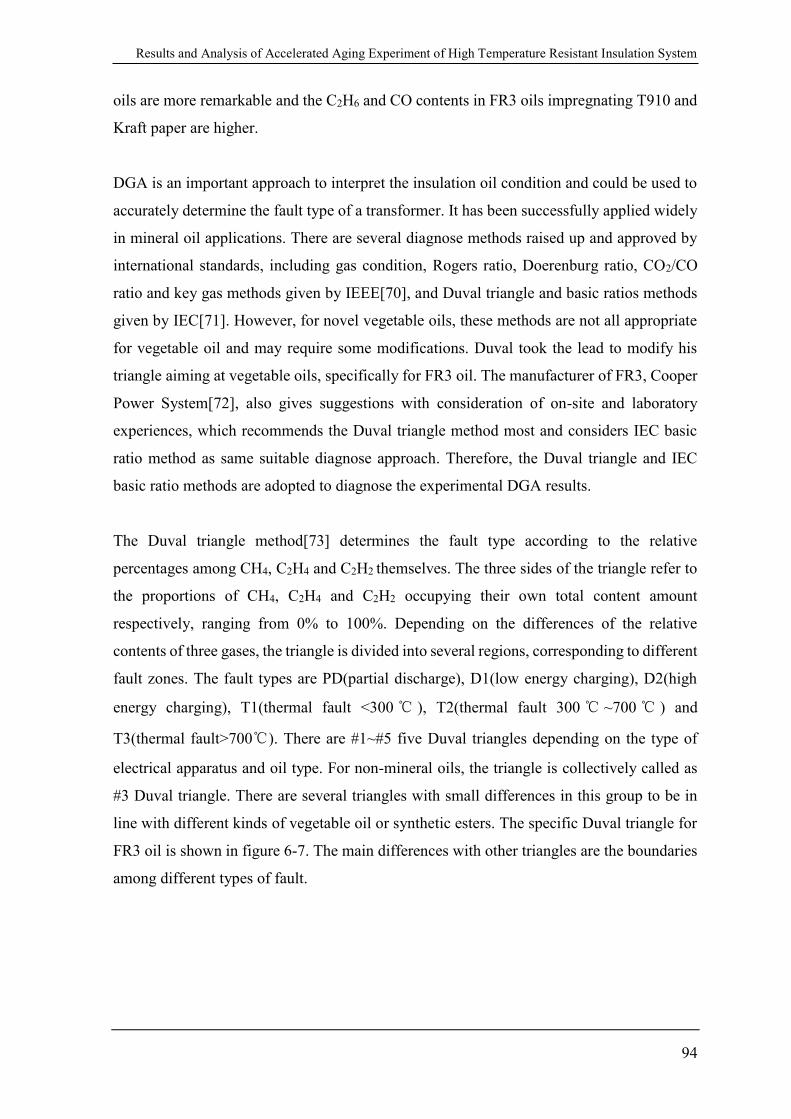
Results and Analysis of Accelerated Aging Experiment of High Temperature Resistant Insulation System
94
oils are more remarkable and the C2H6 and CO contents in FR3 oils impregnating T910 and
Kraft paper are higher.
DGA is an important approach to interpret the insulation oil condition and could be used to
accurately determine the fault type of a transformer. It has been successfully applied widely
in mineral oil applications. There are several diagnose methods raised up and approved by
international standards, including gas condition, Rogers ratio, Doerenburg ratio, CO2/CO
ratio and key gas methods given by IEEE[70], and Duval triangle and basic ratios methods
given by IEC[71]. However, for novel vegetable oils, these methods are not all appropriate
for vegetable oil and may require some modifications. Duval took the lead to modify his
triangle aiming at vegetable oils, specifically for FR3 oil. The manufacturer of FR3, Cooper
Power System[72], also gives suggestions with consideration of on-site and laboratory
experiences, which recommends the Duval triangle method most and considers IEC basic
ratio method as same suitable diagnose approach. Therefore, the Duval triangle and IEC
basic ratio methods are adopted to diagnose the experimental DGA results.
The Duval triangle method[73] determines the fault type according to the relative
percentages among CH4, C2H4 and C2H2 themselves. The three sides of the triangle refer to
the proportions of CH4, C2H4 and C2H2 occupying their own total content amount
respectively, ranging from 0% to 100%. Depending on the differences of the relative
contents of three gases, the triangle is divided into several regions, corresponding to different
fault zones. The fault types are PD(partial discharge), D1(low energy charging), D2(high
energy charging), T1(thermal fault <300 ℃ ), T2(thermal fault 300 ℃ ~700 ℃ ) and
T3(thermal fault>700℃). There are #1~#5 five Duval triangles depending on the type of
electrical apparatus and oil type. For non-mineral oils, the triangle is collectively called as
#3 Duval triangle. There are several triangles with small differences in this group to be in
line with different kinds of vegetable oil or synthetic esters. The specific Duval triangle for
FR3 oil is shown in figure 6-7. The main differences with other triangles are the boundaries
among different types of fault.
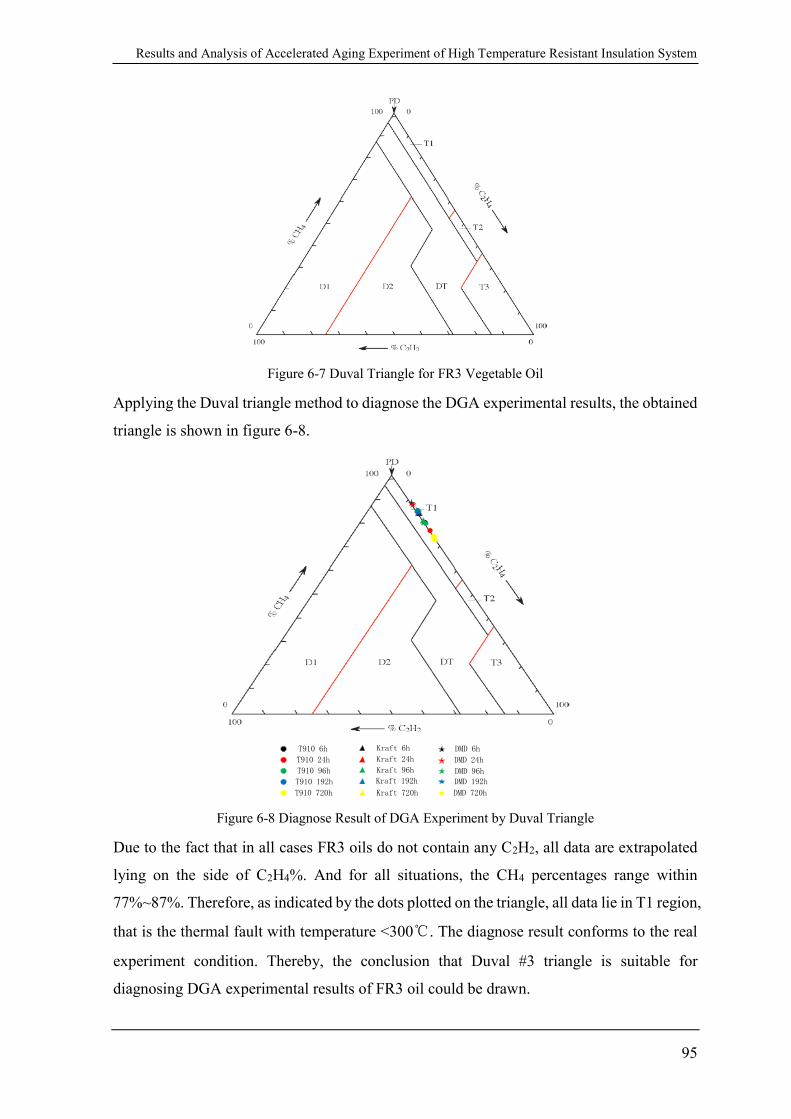
Results and Analysis of Accelerated Aging Experiment of High Temperature Resistant Insulation System
95
Figure 6-7 Duval Triangle for FR3 Vegetable Oil
Applying the Duval triangle method to diagnose the DGA experimental results, the obtained
triangle is shown in figure 6-8.
T910 6h
T910 24h
T910 96h
T910 192h
Kraft 6h
Kraft 24h
Kraft 96h
Kraft 192h
DMD 6h
DMD 24h
DMD 96h
DMD 192h
DMD 720hKraft 720hT910 720h
Figure 6-8 Diagnose Result of DGA Experiment by Duval Triangle
Due to the fact that in all cases FR3 oils do not contain any C2H2, all data are extrapolated
lying on the side of C2H4%. And for all situations, the CH4 percentages range within
77%~87%. Therefore, as indicated by the dots plotted on the triangle, all data lie in T1 region,
that is the thermal fault with temperature <300℃. The diagnose result conforms to the real
experiment condition. Thereby, the conclusion that Duval #3 triangle is suitable for
diagnosing DGA experimental results of FR3 oil could be drawn.
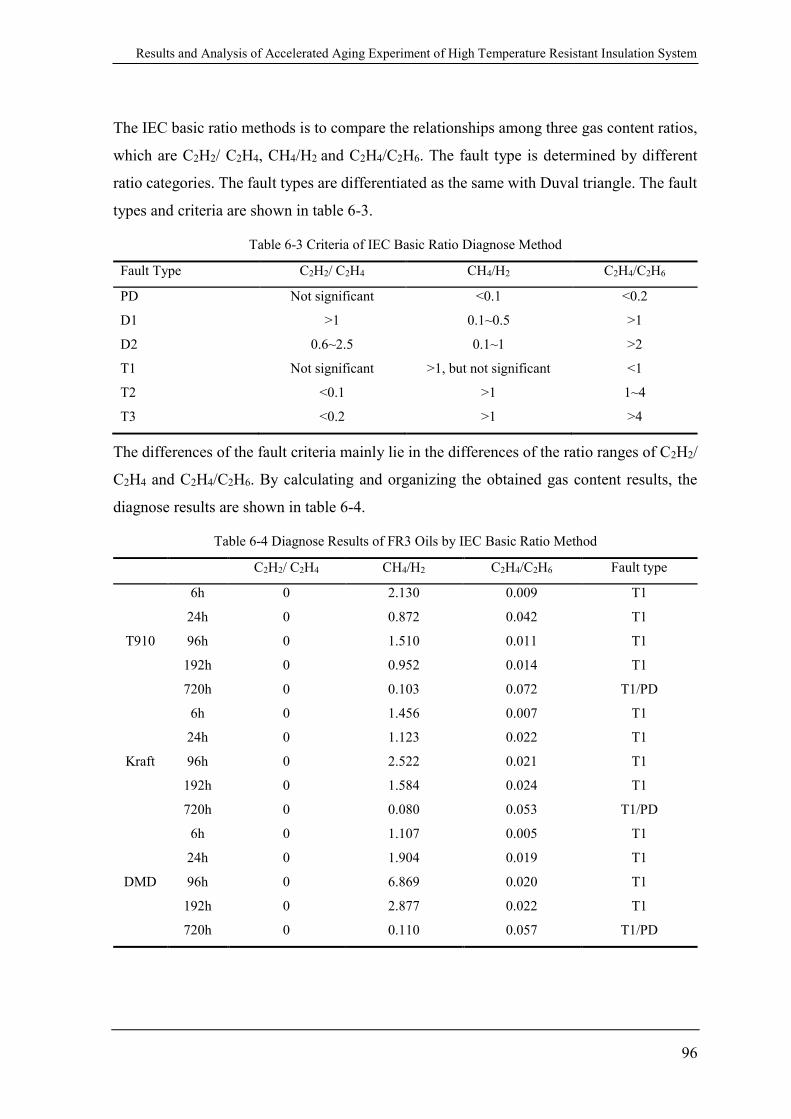
Results and Analysis of Accelerated Aging Experiment of High Temperature Resistant Insulation System
96
The IEC basic ratio methods is to compare the relationships among three gas content ratios,
which are C2H2/ C2H4, CH4/H2 and C2H4/C2H6. The fault type is determined by different
ratio categories. The fault types are differentiated as the same with Duval triangle. The fault
types and criteria are shown in table 6-3.
Table 6-3 Criteria of IEC Basic Ratio Diagnose Method
Fault Type C2H2/ C2H4 CH4/H2 C2H4/C2H6
PD Not significant <0.1 <0.2
D1 >1 0.1~0.5 >1
D2 0.6~2.5 0.1~1 >2
T1 Not significant >1, but not significant <1
T2 <0.1 >1 1~4
T3 <0.2 >1 >4
The differences of the fault criteria mainly lie in the differences of the ratio ranges of C2H2/
C2H4 and C2H4/C2H6. By calculating and organizing the obtained gas content results, the
diagnose results are shown in table 6-4.
Table 6-4 Diagnose Results of FR3 Oils by IEC Basic Ratio Method
C2H2/ C2H4 CH4/H2 C2H4/C2H6 Fault type
T910
6h 0 2.130 0.009 T1
24h 0 0.872 0.042 T1
96h 0 1.510 0.011 T1
192h 0 0.952 0.014 T1
720h 0 0.103 0.072 T1/PD
Kraft
6h 0 1.456 0.007 T1
24h 0 1.123 0.022 T1
96h 0 2.522 0.021 T1
192h 0 1.584 0.024 T1
720h 0 0.080 0.053 T1/PD
DMD
6h 0 1.107 0.005 T1
24h 0 1.904 0.019 T1
96h 0 6.869 0.020 T1
192h 0 2.877 0.022 T1
720h 0 0.110 0.057 T1/PD
Results and Analysis of Accelerated Aging Experiment of High Temperature Resistant Insulation System
97
From the results, it could be observed that, under the diagnose of this method, all the data
except 720h case are extrapolated as T1 thermal fault, while the data of 720h is interpreted
as whether T1 thermal fault or PD fault. Therefore, IEC basic ratio method is suitable for
most experimental results in the thesis except for the small inconsistency at 720h data with
Duval triangle diagnose result.
For traditional mineral oil, the ratio of CO2/CO is commonly used to reflect the aging
condition of insulation paper. Under normal conditions, this ratio should be above 7. Once
the cellulose starts to degrade, to be more specific, which refers mainly to oxidization and
pyrolysis, the amount of CO will increase dramatically leading to a drop in this ratio. IEC
and IEEE both take the limitation of below 3 of the CO2/CO ratio as the signal of an apparent
occurrence of cellulose deterioration. However, the vegetable oil itself would generate a
large amount of carbon oxides, which could shows several orders of magnitude higher than
that generated by mineral oil. The level of carbon oxides contents generated by vegetable oil
may prevail the level of gas generated by cellulose. From the results, we can calculate the
CO2/CO ratios of FR3 oils impregnating T910 and Kraft papers, which are both above 7 and
most of which are higher than 20. Therefore, according to the standards, it could not be
considered that the cellulose undergoes an apparent aging. However, this is obviously
inconsistent with the apparent drop in tensile strength of Kraft paper. This is probably due
to that the main degrading form of the cellulose fibers is hydrolysis and will not generate a
large amount of CO. Besides, the determination of CO2 may be interfered by the gases in the
testing environment. Errors could be induced by the air intrusion during the sample
transferring and testing. Overall, the levels calculated from the DGA test results could not
accurately reveal the real deterioration condition of insulation paper.
Discussion on the Aging Processes and Mechanisms of High Temperature Resistant Insulation System
98
7 Discussion on the Aging Processes and Mechanisms of
High Temperature Resistant Insulation System
The aging of oil and paper materials is a complex process and should be analyzed integrally
in combination with several parameters. Based on the aging experimental results, this
chapter mainly aims at analyzing and extropolating the mechanisms of the aging of paper
and oil materials.
7.1 Analysis of Aging Mechanisms of Paper and Oil
Mmaterials
From the changes in vegetable oils viscosity, it could be determined that oxygen has limited
impact on paper and oil aging. The aging of paper and oil is dominated by hydrolysis
thereafter. Both paper and oil undergo hydrolysis.
For cellulose based paper, the hydrolysis of paper will incur fractures on its molecular chain
and hydroxyl groups are attached to the ends of fracture. Thus the hydrophicility of paper is
increased. The hydrolysis process of cellulose is catalyzed by low molecular water-solutable
acids. After hydrolysis, a dehydration process will follow and happen to cellulose itself.
Furanic compounds intermediate products are produced, along with more water molecules
production. Theoretically speaking, the hydrolysis of cellulose is initiated by one water
molecule and followed by three water molecules production in the dehydration stage. Thus,
there is a two water molecules net production and they behave as reaction source for further
hydrolysis[14]. Some unstable furanic compounds, e.g. 2FAL, will deform into low
molecular acids and then in turn the cellulose hydrolysis rate is auto-accelerated. The
hydrolysis of cellulose and PET are described in figure 1-8 and figure 1-11 in chapter 1.
When molecular chain fracture numbers reach to some certain extents, the long molecular
chain is seperated into several short molecular chains. The former strong chemical bonding
effect is transformed into weaker hydrogen bonding effect. The hydrolysis positions on
molecular chains become to weak links. Therefore, a drop in tensile strength could be
observed macroscopically, especially for Kraft paper.
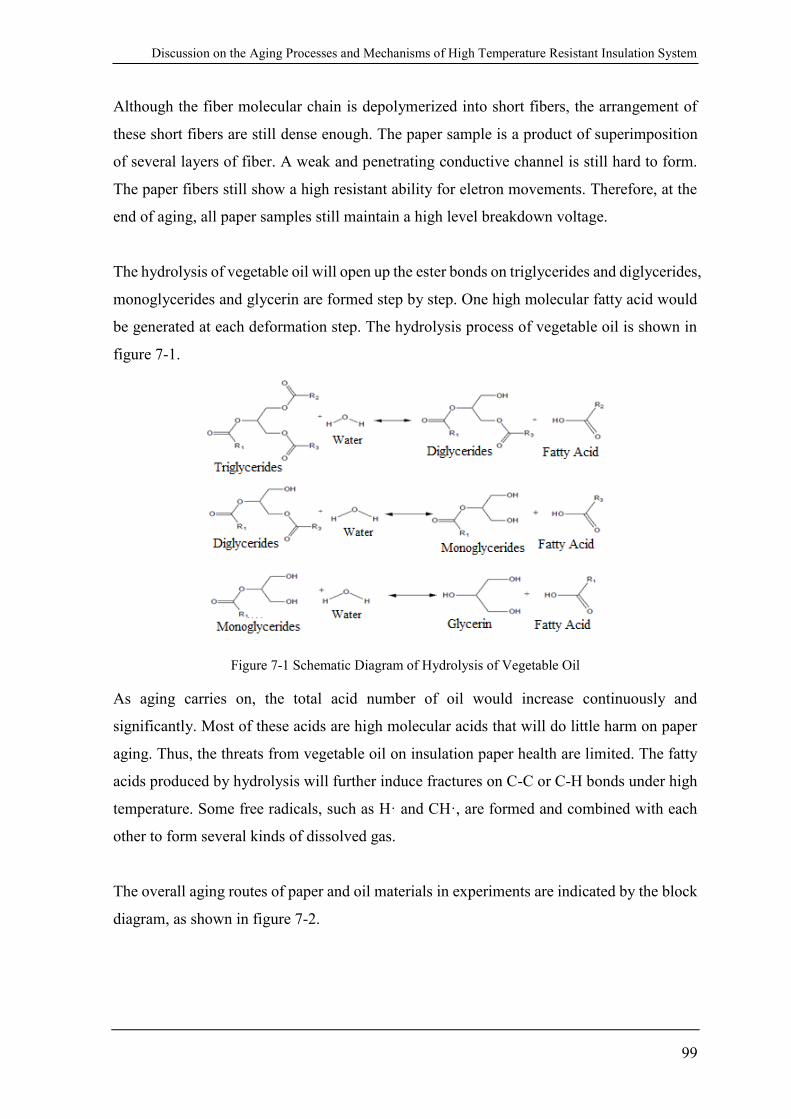
Discussion on the Aging Processes and Mechanisms of High Temperature Resistant Insulation System
99
Although the fiber molecular chain is depolymerized into short fibers, the arrangement of
these short fibers are still dense enough. The paper sample is a product of superimposition
of several layers of fiber. A weak and penetrating conductive channel is still hard to form.
The paper fibers still show a high resistant ability for eletron movements. Therefore, at the
end of aging, all paper samples still maintain a high level breakdown voltage.
The hydrolysis of vegetable oil will open up the ester bonds on triglycerides and diglycerides,
monoglycerides and glycerin are formed step by step. One high molecular fatty acid would
be generated at each deformation step. The hydrolysis process of vegetable oil is shown in
figure 7-1.
Figure 7-1 Schematic Diagram of Hydrolysis of Vegetable Oil
As aging carries on, the total acid number of oil would increase continuously and
significantly. Most of these acids are high molecular acids that will do little harm on paper
aging. Thus, the threats from vegetable oil on insulation paper health are limited. The fatty
acids produced by hydrolysis will further induce fractures on C-C or C-H bonds under high
temperature. Some free radicals, such as H· and CH·, are formed and combined with each
other to form several kinds of dissolved gas.
The overall aging routes of paper and oil materials in experiments are indicated by the block
diagram, as shown in figure 7-2.
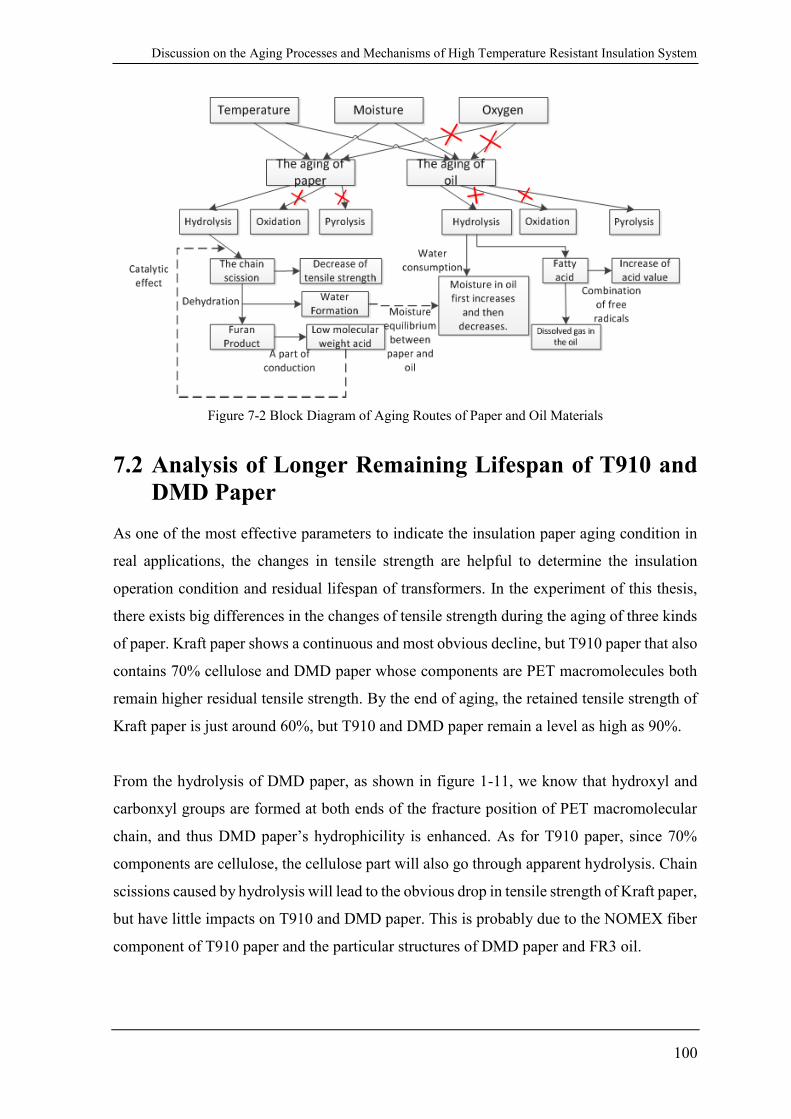
Discussion on the Aging Processes and Mechanisms of High Temperature Resistant Insulation System
100
Figure 7-2 Block Diagram of Aging Routes of Paper and Oil Materials
7.2 Analysis of Longer Remaining Lifespan of T910 and
DMD Paper
As one of the most effective parameters to indicate the insulation paper aging condition in
real applications, the changes in tensile strength are helpful to determine the insulation
operation condition and residual lifespan of transformers. In the experiment of this thesis,
there exists big differences in the changes of tensile strength during the aging of three kinds
of paper. Kraft paper shows a continuous and most obvious decline, but T910 paper that also
contains 70% cellulose and DMD paper whose components are PET macromolecules both
remain higher residual tensile strength. By the end of aging, the retained tensile strength of
Kraft paper is just around 60%, but T910 and DMD paper remain a level as high as 90%.
From the hydrolysis of DMD paper, as shown in figure 1-11, we know that hydroxyl and
carbonxyl groups are formed at both ends of the fracture position of PET macromolecular
chain, and thus DMD paper’s hydrophicility is enhanced. As for T910 paper, since 70%
components are cellulose, the cellulose part will also go through apparent hydrolysis. Chain
scissions caused by hydrolysis will lead to the obvious drop in tensile strength of Kraft paper,
but have little impacts on T910 and DMD paper. This is probably due to the NOMEX fiber
component of T910 paper and the particular structures of DMD paper and FR3 oil.

Discussion on the Aging Processes and Mechanisms of High Temperature Resistant Insulation System
101
For T910 paper, its external layers are mixed woven by NOMEX fibers and cellulose fibers.
From the characteristics of NOMEX fiber and its aging process, we know NOMEX fibers
have extremly high machanical and dielectric strength and the chain scissions of NOMEX
fibers happen only under high temperature(>250℃). It could be considered that under the
experimental condition of this thesis, no apparent declines in mechanical strength will occur
to NOMEX fibers. Although the cellulose fibers in T910 paper undergoes severe chain
scissions, the external NOMEX fibers would function as protective and bearing effect due
to its own high tensile strength and thermal resistance, as the role of steel reinforcement in
bridge. When nearby cellulose fibers are broken up, NOMEX fibers could steel maintain its
molecular chain integrity. The robust and stable chemical bonding of NOMEX fiber under
150℃ would provide enduring bracing of T910 paper. Therefore, T910 paper could own a
high level of retained tensile strength along the entire aging period.
For DMD paper, since PET and FR3 molecules both own ester bonds on their backbones,
there would exist more obvious and strong transesterification effect when they are
hydrolyzed simultaneously. The transesterification effect was first proposed to explain the
prolonged lifespan of Kraft paper in vegetable oils and has been introduced in section 1.4 in
chapter 1. The long chain fatty acids hydrolyzed from triglycerides are esterified with the
hydroxyl groups on cellulose. Thus long side chains are attached onto the cellulose chain
and prevent cellulose from the intrusion of water, and the life of cellulose based paper is
extended. The hydrolysis of PET and triglycerides will both create hydroxyl and carbonxyl
groups on each ends. The three hydroxyls on glycerin produced by hydrolysis of
triglycerides could react and esterify with carbonxyls on several ends produced by hydrolysis
of PET. The backbone of glycerin will reconnect the broken-up PET molecules, which
functions as bridging and crosslinking. The broken PET molecules are strengthened in this
way. The transesterification process is described in figure 7-3. Unlike the transesterification
between FR3 oil and Kraft paper, the molecular chain of PET could be strengthened as
bridged or crosslinked during the transesterification. The strengthening effect is more robust
than that in Kraft paper. Therefore, DMD paper shows a more stable tensile strength
performance.
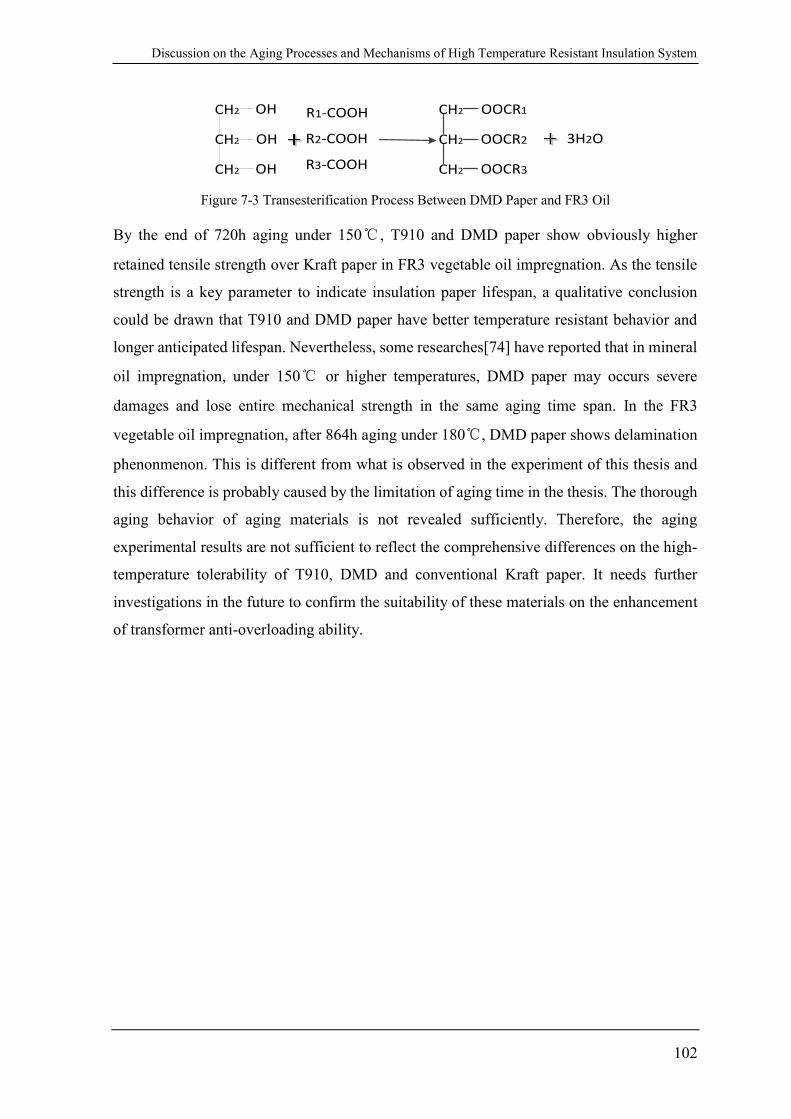
Discussion on the Aging Processes and Mechanisms of High Temperature Resistant Insulation System
102
CH2
CH2
CH2
OH
OH
OH
R1-COOH
R2-COOH
CH2
CH2
CH2
OOCR1
OOCR2
OOCR3R3-COOH
3H2O
Figure 7-3 Transesterification Process Between DMD Paper and FR3 Oil
By the end of 720h aging under 150℃, T910 and DMD paper show obviously higher
retained tensile strength over Kraft paper in FR3 vegetable oil impregnation. As the tensile
strength is a key parameter to indicate insulation paper lifespan, a qualitative conclusion
could be drawn that T910 and DMD paper have better temperature resistant behavior and
longer anticipated lifespan. Nevertheless, some researches[74] have reported that in mineral
oil impregnation, under 150℃ or higher temperatures, DMD paper may occurs severe
damages and lose entire mechanical strength in the same aging time span. In the FR3
vegetable oil impregnation, after 864h aging under 180℃, DMD paper shows delamination
phenonmenon. This is different from what is observed in the experiment of this thesis and
this difference is probably caused by the limitation of aging time in the thesis. The thorough
aging behavior of aging materials is not revealed sufficiently. Therefore, the aging
experimental results are not sufficient to reflect the comprehensive differences on the high-
temperature tolerability of T910, DMD and conventional Kraft paper. It needs further
investigations in the future to confirm the suitability of these materials on the enhancement
of transformer anti-overloading ability.

Conclusions and Prospects
103
8 Conclusions and Prospects
8.1 Conclusions of the Thesis
The thesis analyzes the fundamental properies of T910, TUK and Kraft paper and performs
acceleareted aging test under 150℃ on T910, DMD and Kraft paper impregnated in FR3
vegetable oil. The following conclusions could be drawn.
(1) The fundamental properties comparison test results show that T910 paper has lower
density and water content and higher oil absorption value. On initial tensile strength,
TUK and Kraft paper show higher level, but T910 still meets the requirement of relevant
standard. Compared with T910 paper, TUK and Kraft paper have lower dissipation factor.
And relative dielectric constants of three paper increase as the thickness goes up.
Moreover, T910 paper owns higher breakdown electric field in air and most oil
impregnation cases. And the impact of temperature rising on paper breakdown strength
in mineral oil impregnation is more significant. For insulation oil initial physiochemical
properties, all vegetable oils show higher water content, viscosity and total acid number.
(2) The thesis analyzes and compares the accelerated aging performances of T910, DMD
and Kraft papers in FR3 vegetable oil impregnation under 150℃ for up to 720h. As aging
going on, there is no significant change in paper breakdown voltage, whose fluctuation
magnitude during aging is no larger than 10%. The Kraft paper shows obvious and
monotonous decline in tensile strength, retaining 60% of initial tensile strength at the
end of aging. T910 and DMD papers both maintain residual tensile strengths higher than
90% along the entire aging duration. The total acid numbers of FR3 oils all keep
increasing and the viscosities exhibit rather stable levels. The results of DGA
measurements show that all three FR3 oils impregnating three kinds of paper dissolve
C2H6 and CO in large quantities during the aging process, and the results are diagnosed
as T1 thermal fault by IEC standard.
(3) The NOMEX fibers contained in T910 paper provide a supportive effect as the fibers
possess high mechanical strength and high temperature resistance. There exists

Conclusions and Prospects
104
transesterification process during the hydrolysis aging of DMD paper in FR3 oil, the
broken PET molecules are bridged or crosslinked and thus its structural strength is
enhanced. Therefore, by the end of 720h aging, the tensile strengths of T910 and DMD
papers remain high levels. Although the retained tensile strengths of T910 and DMD
papers are higher than Kraft paper, due to the limitation of aging duration, the thorough
aging performances of different paper materials are not revealed sufficiently. It needs
further investigations to confirm their high temperature resistance.
8.2 Prospects of the Thesis
(1) The thesis only performs the aging experiment under one single temperature and has not
observed a decline of tensile strength below 50% retained tensile strength. Thus a longer
aging duration is anticipated in order to investigate the changes of the properties of oil
and paper materials more sufficiently and comprehensively.
(2) The single temperature aging experiment could not derive the thermal class and the
thermal index of the aged materials directly. According to relevant standards, at least
three temperature levels should be implemented with at least four aging time nodes
under each temperature level, in order to calculate the thermal index. Therefore, in future
works, more temperature levels and longer aging time could be supplemented to obtain
the thermal classes of the materials and to directly compare and verify the temperature
resistances.
(3) Calculate the temperature rise conditions at different positions on transformer winding
and in insulation oil. Investigate the impacts of winding temperature rising on the
lifespan of insulation paper. Thus, more proofs could be provided to verify the
improvement of transformer anti-overloading ability by applying high temperature
resistant insulation system.
Bibliography
105
9 Bibliography
[1]. Montsinger VM. Loading Transformers By Temperature[J]. American Institute of Electrical
Engineers, Transactions of the 1930;49(2):776-790.
[2]. McShane CP, Gauger GA, Luksich J. Fire resistant natural ester dielectric fluid and novel insulation
system for its use[C]. IEEE Transmission and Distribution Conference, Vols 1 & 2 1999:890-894.
[3]. Frimpong GK, Oommen TV, Asano R. A Survey of Aging Characteristics of Cellulose Insulation in
Natural Ester and Mineral Oil[J]. IEEE Electrical Insulation Magazine 2011;27(5):36-48.
[4]. Schaible M. Electrical Insulating Papers - an Overview[J]. Electrical Insulation Magazine, IEEE
1987;3(1):8-12.
[5]. Prevost TA, Oommen TV. Cellulose insulation in oil-filled power transformers: Part I - history and
development[J]. Electrical Insulation Magazine, IEEE 2006;22(1):28-35.
[6]. Ford JG, Leonard MG, Gainer GC, et al. Insuldur-Another Milestone in Transformer Insulation
Development[J]. Power Apparatus and Systems, Part III Transactions of the American Institute of
Electrical Engineers 1958;77(3):804-808.
[7]. Oommen TV, Prevost TA. Cellulose insulation in oil-filled power transformers: Part II - Maintaining
insulation integrity and life[J]. IEEE Electrical Insulation Magazine 2006;22(2):5-14.
[8]. Simpson RW. Flexible Laminates: Key Insulation for Motors and Generators[J]. Electrical Insulation
Magazine, IEEE 1986;2(1):9-13.
[9]. Emsley AM, Stevens GC. Review of Chemical Indicators of Degradation of Cellulosic Electrical
Paper Insulation in Oil-Filled Transformers[J]. IEEE P-Sci Meas Tech 1994;141(5):324-334.
[10]. Cigre D1.01.10 Ageing of Cellulose in Mineral-oil insulated Transformers[R]. 2007.
[11]. Prevost TA. Thermally upgraded insulation in transformers[C]. Proceedings: Electrical Insulation
Conference and Electrical Manufacturing Conference 2005:120-125.
[12]. Kanuga, K. Degradation of polyester film exposed to accelerated indoor damp heat aging[J].
Photovoltaic Specialists Conference (PVSC), 37th IEEE; 2011 19-24.
[13]. Cigre A2-35.Experiences in Service with New Insulating Liquids[R].2010.
[14]. Lundgaard LE, Hansen W, Linhjell D, et al. Aging of oil-impregnated paper in power transformers[J].
IEEE Transactions on Power Deliver 2004;19(1):230-239.
[15]. Lundgaard L E HW, Ingebrugtsn S.et al. Aging of Kraft Paper by Acid Catalyed Hydrolysis[C]. IEEE
International Conference on Dielectric Liguids, 2005:281-384.
[16]. Lundgaard LE, Hansen W, Ingebrigtsen S. Ageing of mineral oil impregnated cellulose by acid
catalysis[J]. IEEE Transactions on Dielect Electric Insulation 2008;15(2):540-546.
[17]. Lelekakis N, Martin D, Wijaya J. Ageing Rate of Paper Insulation used in Power Transformers Part
1: Oil/paper System with Low Oxygen Concentration[J]. IEEE Transactions on Dielect Electric
Insulation 2012;19(6):1999-2008.
[18]. Emsley AM, Xiao X, Heywood RJ, et al. Degradation of cellulosic insulation in power transformers.
Part 3: effects of oxygen and water on ageing in oil[C]. Science, Measurement and Technology, IEE
Proceedings - 2000;147(3):115-119.
[19]. Emsley AM. The kinetics and mechanism of degradation of cellulosic insulation in power
transformers[J]. Polymers Degradation and Stability 1994;44:343-349.
[20]. Furanic Compounds in Dielectric Liquid Samples: Review and Update of Diagnostic Interpretation
and Estimation of hulation Ageing[C]. 7th lntemational Conference on Properties and Applications
of Dielectric Materials; 2003.
[21]. Emsley AM, Xiao X, Heywood RJ, et al. Degradation of cellulosic insulation in power transformers.
Part 2: Formation of furan products in insulating oil[J]. IEEE P-Sci Meas Tech 2000;147(3):110-114.
[22]. Villain F, Coudane J, Vert M. Thermal-Degradation of Polyethylene Terephthalate - Study of
Polymer Stabilization[J]. Polymer Degradation and Stability 1995;49(3):393-397.
[23]. Samperi F, Puglisi C, Alicata R, et al. Thermal degradation of poly(ethylene terephthalate) at the
processing temperature[J]. Polymer Degradation and Stability 2004;83(1):3-10.
[24]. D. A. Chatfield, R.W.Mickelson,and J.H.Futrell. Analysis of the Products of Thermal Decomposition
of an Aromatic Polyamide Fabric[J]. Polymer Science 1979;17:1367-1381.
[25]. Y.P.K. and E.M.P, et al. Thermal Degradation of Some Aromatic Polyamides and Their Model
Diamides[J]. Polymer Science 1981;19:2817-2834.
Bibliography
106
[26]. Villar-Rodil S, Paredes JI, Martinez-Alonso A, et al. Atomic force microscopy and infrared
spectroscopy studies of the thermal degradation of Nomex aramid fibers[J]. Chemical Material
2001;13(11):4297-4304.
[27]. Power J. and James.R.B.Thermal Degradation of Aramids:Part I--Pyrolysis/Gas
Chromatography/Mass Spectrometry of Poly(1,3-Phenylene Isophthalamide) and Pply(1,4-
Phenylene Terephthalamide)[J]. Polymer Degradation and Stability 1982;4:139-392.
[28]. Dakin TW. Electrical Insulation Deterioration Treated as a Chemical Rate Phenomenon[J]. American
Institute of Electrical Engineers, Transactions of the 1948;67(1):113-122.
[29]. Gasser, H. P. et al. Determining the ageing parameters of cellulosic insulation in a transformer[C].
High Voltage Engineering, 1999 Eleventh International Symposium on ; .
[30]. Heywood RJ, Emsley AM, Ali M. Degradation of cellulosic insulation in power transformers. Part
1: Factors affecting the measurement of the average viscometric degree of polymerisation of new
and aged electrical papers[J]. IEEE P-Sci Meas Tech 2000;147(2):86-90.
[31]. Krause C, Dreier L, Fehlmann A, et al. The Degree of Polymerization of Cellulosic Insulation:
Review of Measuring Technologies and its Significance on Equipment[C]. 2014 Electrical Insulation
Conference 2014:267-271.
[32]. Emsley AM, Heywood RJ, Ali M, et al. Degradation of cellulosic insulation in power transformers.
Part 4: Effects of ageing on the tensile strength of paper[J]. IEEE P-Sci Meas Tech 2000;147(6):285-
290.
[33]. Khan IU, Wang ZD, Cotton I, et al. Dissolved gas analysis of alternative fluids for power
transformers[J]. IEEE Electrical Insulation Magzine. 2007;23(5):5-14.
[34]. Oommen TV. Vegetable Oils for Liquid-Filled Transformers[J]. IEEE Electrical Insulation Magzine.
2002;18(1): 6-11.
[35]. Fofana I. 50 years in the development of insulating liquids[J]. Electrical Insulation Magazine, IEEE
2013;29(5):13-25.
[36]. Stockton DP, Bland JR, McClanahan T, et al. Seed-oil-based coolants for transformers[J]. Industry
Applications Magazine, IEEE 2009;15(1):68-74.
[37]. IEC 62332-2. ELECTRICAL INSULATION SYSTEMS (EIS) – THERMAL EVALUATION OF
COMBINED LIQUID AND SOLID COMPONENTS -Part 2: Simplified Test[S]. 2013.
[38]. IEEE Standard Test Procedure for Thermal Evaluation of Insulation Systems for Liquid-Immersed
Distribution and Power Transformers[S]. C57.100. 2011.
[39]. IEC 62332-1. ELECTRICAL INSULATION SYSTEMS (EIS) – THERMAL EVALUATION OF
COMBINED LIQUID AND SOLID COMPONENTS -Part 2: General requirements[S]. 2005.
[40]. McShane, C. P. et al. Aging of paper insulation in natural ester dielectric fluid[C]. Transmission and
Distribution Conference and Exposition, 2001 IEEE/PES; 2001 2001.
[41]. Oommen TV, Claiborne C, Le H. BIOTEMP paper aging study[R]. Unpublished ABB ETI Report
Feb. 2001.
[42]. Nattrass D. Functional life test on transformers filled with a biodegradable electrical insulating fluid
(Biotemp)[R]. Unpublished ABB ETI Report Nov. 1998.
[43]. Lanni A. Functional life tests on revised BIOTEMP™ formulation[R]. Unpublished ABB ETI
Report Mar. 1999.
[44]. Liao RJ, Liang SW, Yang LJ, et al. The Improvement of Resisting Thermal Aging Performance for
Ester-immersed Paper Insulation and Study on Its Reason[C], 2008.
[45]. Tenbohlen S, Koch M. Aging Performance and Moisture Solubility of Vegetable Oils for Power
Transformers[J]. IEEE T Power Deliver 2010;25(2):825-830.
[46]. Jr. RA, Cheim L, Cherry D, et al. Thermal evaluation of cellulosic board in natural ester fluid for
hybrid insulation systems[C]. 78th Annual International Conference of Doble Clients, Boston, MA
2011.
[47]. Liao RJ, Liang SW, Yang LJ, et al. The Improvement of Resisting Thermal Aging Performance for
Ester-immersed Paper Insulation and Study on Its Reason[C]. 2008 IEEE Conference on Electrical
Insulation and Dielectric Phenomena 2008:633-636.
[48]. IEC 60126-4. Electrical insulating materials - Thermal endurance properties - Part 4-1: Ageing ovens
- Single-chamber ovens[S]. 2006.
[49]. ASTM D202 Standard Test Methods for Sampling and Testing Untreated Paper Used for Electrical
Insulation[S]. 2008. [50]. ASTM D644. Standard Test Method for Moisture Content of Paper and Paperboard by Oven
Bibliography
107
Drying[S]. 2007.
[51]. ASTM D3277. Standard Test Methods for Moisture Content of Oil-Impregnated Cellulosic
Insulation[S]. 2001.
[52]. PAGE DH. [J]TAPPI 1969;52:674.
[53]. ASTM D1305. Standard Specification for Electrical Insulating Paper and Paperboard—Sulfate
(Kraft) Layer Type[S]. 2009.
[54]. ASTM D3394. Standard Test Methods for Sampling and Testing Electrical Insulating Board[S]. 2009.
[55]. Kurtinec M, Hamar R, Pihera J. Complex Permittivity Models of Composite Dielectrics[J]. 2007
IEEE International Conference on Solid Dielectrics, Vols 1 and 2 2007:39-42.
[56]. Niklasson GA, Granqvist CG, Hunderi O. Effective medium models for the optical properties of
inhomogeneous materials[J]. Applied optics 1981;20(1):26-30.
[57]. Morgan VT. Effects of frequency, temperature, compression, and air pressure on the dielectric
properties of a multilayer stack of dry kraft paper[J]. IEEE Transactions on Dielectric Electrical
Insulation 1998;5(1):125-131.
[58]. Stuart 0. Nelson.Permittivity and density relationships for granular and powdered materials[C].
Antennas and Propagation Society International Symposium, 2004 IEEE; 2004 20-25 June 2004.
[59]. ASTM D149. Standard Test Method for Dielectric Breakdown Voltage and Dielectric Strength of
Solid Electrical Insulating Materials at Commercial Power Frequencies[S]. 2013.
[60]. ASTM D445. Standard Test Method for Kinematic Viscosity of Transparent and Opaque Liquids
(and Calculation of Dynamic Viscosity) [S]. 2014.
[61]. ASTM D6871. Standard Specification for Natural (Vegetable Oil) Ester Fluids Used in Electrical
Apparatus[S]. 2008.
[62]. IEEE Guide for Acceptance and Maintenance of Natural Ester Fluids in Transformers[S]. IEEE Std
C57147-2008 2008:1-31.
[63]. IEC 62770.Fluids for electrotechnical applications - Unused natural esters for transformers and
similar electrical equipment[S]. 2013
[64]. ASTM D664. Standard Test Method for Acid Number of Petroleum Products by Potentiometric
Titration[S]. 2011.
[65]. ASTM D1533. Standard Test Method for Water in Insulating Liquids by Coulometric Karl Fischer
Titration[S]. 2012.
[66]. R J Young, PJ Lovell. Introduction to Polymers[M], Nelson Thornes: Cheltenham, 2000.
[67]. E Souza, G Belinato, R Otero, et al. Thermal Oxidative Stability of Vegetable Oils as Metal Heat
Treatment Quenchants[J]. Journal of ASTM International, 2011, 9(1):1-30.
[68]. Rooney D, Weatherley LR. The effect of reaction conditions upon lipase catalysed hydrolysis of high
oleate sunflower oil in a stirred liquid-liquid reactor[J]. Process Biochemistry 2001;36(10):947-953.
[69]. ASTM D3612. Standard Test Method for Analysis of Gases Dissolved in Electrical Insulating Oil by
Gas Chromatography[S]. 2009.
[70]. IEEE Guide for the Interpretation of Gases Generated in Oil-Immersed Transformers[S]. IEEE Std
C57104-2008:1-36.
[71]. IEC 60599. Mineral oil-impregnated electrical equipment in service — Guide to the interpretation
of dissolved and free gases analysis[S]. 1999.
[72]. Dissolved Gas Guide of Envirotemp FR3 Fluid[R]. Cooper Power System. 2006.
[73]. Duval M. The Duval Triangle for Load Tap Changers, Non-Mineral Oils and Low Temperature
Faults in Transformers[J]. IEEE Electrc Insulation Magzine 2008;24(6):22-29.
[74]. Xiaojing Zhang, et.al. High-temperatrue Insulation System Thermal Evaluation for Fluid Filled
Transformers[C]. IEEE Electrical Insulation Conference. unpublished paper. 2016
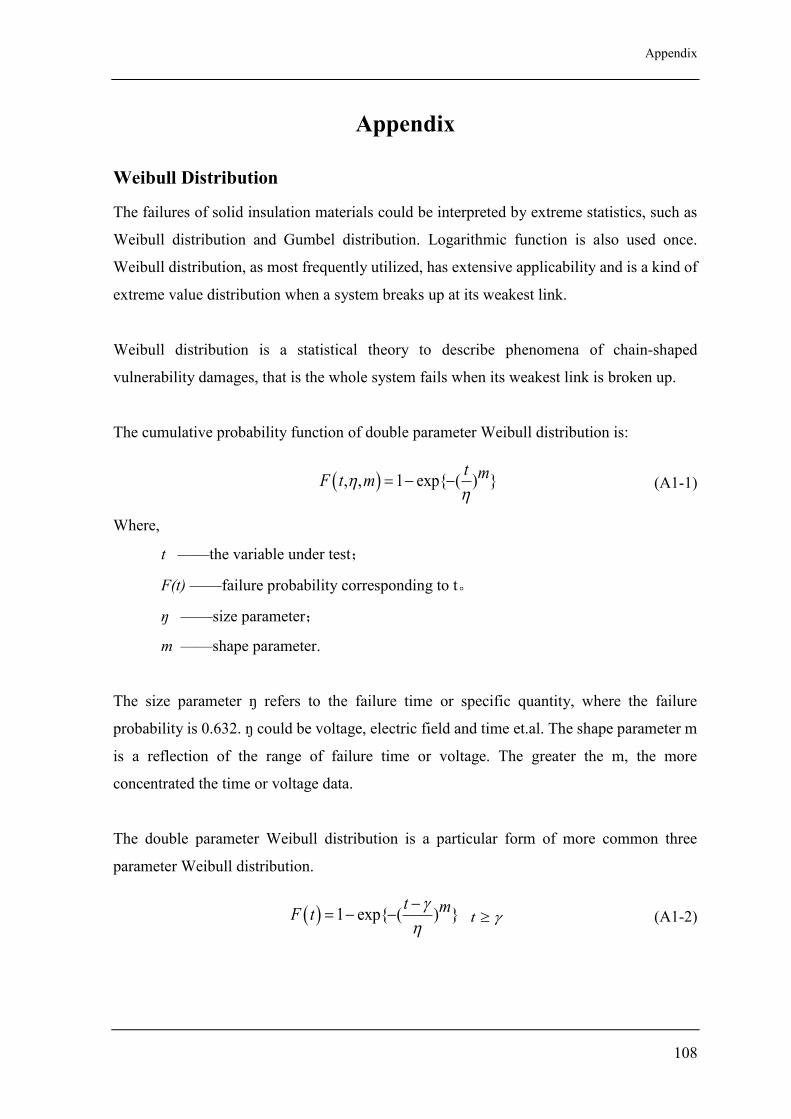
Appendix
108
Appendix
Weibull Distribution
The failures of solid insulation materials could be interpreted by extreme statistics, such as
Weibull distribution and Gumbel distribution. Logarithmic function is also used once.
Weibull distribution, as most frequently utilized, has extensive applicability and is a kind of
extreme value distribution when a system breaks up at its weakest link.
Weibull distribution is a statistical theory to describe phenomena of chain-shaped
vulnerability damages, that is the whole system fails when its weakest link is broken up.
The cumulative probability function of double parameter Weibull distribution is:
, , 1 exp{ ( ) }t mF t m
(A1-1)
Where,
t ——the variable under test;
F(t) ——failure probability corresponding to t。
ŋ ——size parameter;
m ——shape parameter.
The size parameter ŋ refers to the failure time or specific quantity, where the failure
probability is 0.632. ŋ could be voltage, electric field and time et.al. The shape parameter m
is a reflection of the range of failure time or voltage. The greater the m, the more
concentrated the time or voltage data.
The double parameter Weibull distribution is a particular form of more common three
parameter Weibull distribution.
1 exp{ ( ) }t mF t
t (A1-2)
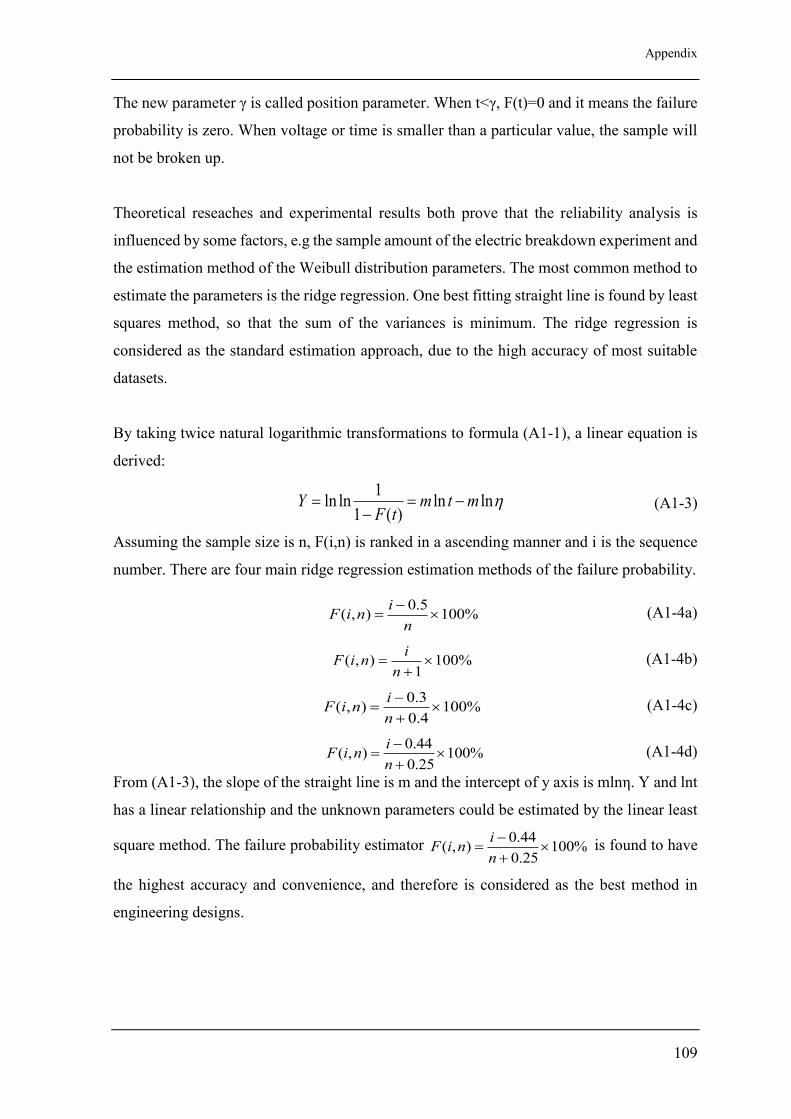
Appendix
109
The new parameter γ is called position parameter. When t<γ, F(t)=0 and it means the failure
probability is zero. When voltage or time is smaller than a particular value, the sample will
not be broken up.
Theoretical reseaches and experimental results both prove that the reliability analysis is
influenced by some factors, e.g the sample amount of the electric breakdown experiment and
the estimation method of the Weibull distribution parameters. The most common method to
estimate the parameters is the ridge regression. One best fitting straight line is found by least
squares method, so that the sum of the variances is minimum. The ridge regression is
considered as the standard estimation approach, due to the high accuracy of most suitable
datasets.
By taking twice natural logarithmic transformations to formula (A1-1), a linear equation is
derived:
1
ln ln ln ln1 ( )
Y m t mF t
(A1-3)
Assuming the sample size is n, F(i,n) is ranked in a ascending manner and i is the sequence
number. There are four main ridge regression estimation methods of the failure probability.
0.5
( , ) 100%i
F i nn
(A1-4a)
( , ) 100%1
iF i n
n
(A1-4b)
0.3
( , ) 100%0.4
iF i n
n
(A1-4c)
0.44
( , ) 100%0.25
iF i n
n
(A1-4d)
From (A1-3), the slope of the straight line is m and the intercept of y axis is mlnη. Y and lnt
has a linear relationship and the unknown parameters could be estimated by the linear least
square method. The failure probability estimator 0.44
( , ) 100%0.25
iF i n
n
is found to have
the highest accuracy and convenience, and therefore is considered as the best method in
engineering designs.
Acknowledge
110
Acknowledges
My deepest gratitude goes first and foremost to my supervisor, Prof. Giovanni
Dotelli, for his instructive advices, corrections and useful suggestions on my
thesis. I am deeply grateful of his help in the completion of this thesis. Without
his continuous and illuminating instruction, this thesis could not have reached
its present form.
High tribute shall be paid to Mr. Saverio Latorrata. The many times discussions
with him about the thesis enlighten my ideas very much and his kind helps and
suggestions have made my thesis completed more smoothly and effectively.
Special thanks shall go to my friends who have put considerable time and efforts
into their comments on the draft.
Finally, I am indebted to my belove parents and girlfriend for their consistent
supports and encouragements.


![POLITECNICO DI MILANO · POLITECNICO DI MILANO Scuola di Ingegneria Industriale HGHOO¶,QIRUPD]LRQH Corso di Laurea Magistrale in Ingegneria Energetica Appropriate solutions for upgrading](https://static.fdocuments.net/doc/165x107/5e90ed354f9fe10fa628a408/politecnico-di-milano-politecnico-di-milano-scuola-di-ingegneria-industriale-hghooqirupdlrqh.jpg)