
Policy Studies Inc. and Center for Policy Research ...
47
Transcript of Policy Studies Inc. and Center for Policy Research ...


Policy Studies Inc. and Center for Policy Research produced this product under Contract#105-00-8300 (Task Order #31) for the Department of Health and Human Services, Administration forChildren and Families, Office of Child Support Enforcement, May 2004.

Table of Contents
Page Preface 1. Why Look At Arrears? ..........................................................................................1 2. Ask Questions That Interest You ..........................................................................7 3. Make a Few Decisions, Rules, and Definitions.....................................................9 4. Deciding What Types of Information to Collect...................................................11 5. Start By Looking at Case-Level Patterns. .............................................................15 6. Next, Look at NCP-Level Patterns........................................................................21 7. Add Wage Information..........................................................................................25 8. Using the Wage Data.............................................................................................29 9. Special Questions to Address With Arrears Data From Multiple Years...............31 10. Simulations and Estimations .................................................................................35 Contacts and Resources ...................................................................................................39

Preface
One of my top priorities for the Child Support Enforcement (CSE) program has been to gain a greater understanding of child support debt, since the amount of unpaid child support debt in the United States is growing at an alarming rate. With more knowledge about the composition of unpaid child support debt, we should be able to design and implement more effective strategies to collect arrears from those who have the ability to pay and develop more appropriate policies for low-income parents who are unable to pay. This Guide, Understanding Child Support Debt, provides a framework for State CSE program staff to examine child support debt. Such debt analyses should not focus on how to write off debt. Instead, they should first be aimed at generating insights into how we can make smarter use of our technological tools and other resources to increase child support collections from parents who are able to pay. For example, we need to fully use all existing tools such as the National Directory of New Hires, Passport Denial Program, Multi-State Financial Institution Data Match, and Federal Tax Refund Intercept. In addition, we need to take actions to prevent the accumulation of large amounts of debt and find new tools and resources to help get the debt paid. The Office of Child Support Enforcement and the Assistant Secretary for Planning and Evaluation have a contract with the Urban Institute to conduct a “Child Support Debt Analysis Study” in nine States with the largest caseloads. The aim of this study is to understand the composition of child support debt, the causes for dramatic growth, and what steps may be taken to curb future arrears growth. At the national level, we are already learning a number of interesting things about child support debt. Our national data indicate, for example, that: Approximately one-half of the debt is owed to the government. Most debtors owe small amounts, but most of the debt is held by persons who owe large
amounts. Only 20 percent of debtors owe more than $20,000, but they hold 65 percent of the national debt.
According to State Workforce Agencies’ quarterly wage data, it appears that most debtors have little or no income. However, many of the people who have no quarterly wage records have other sources of income. Some are receiving government benefits. Some have substantial bank accounts, and others receive a Federal tax refund even though no quarterly wages are reported.
As highlighted in the Guide, the CSE community has already begun studying child support debt in order to better manage arrears. Such efforts include adopting new procedures, setting more appropriate orders for low-income parents, and/or expanding resources to enhance collection capabilities. I hope this Guide enables you and your staff to gain better insights into managing child support debt, reducing its growth, and enhancing our ability to increase collections on behalf of America’s children. Sherri Z. Heller, Ed.D. Commissioner Office of Child Support Enforcement
Understanding Child Support Debt Page 1
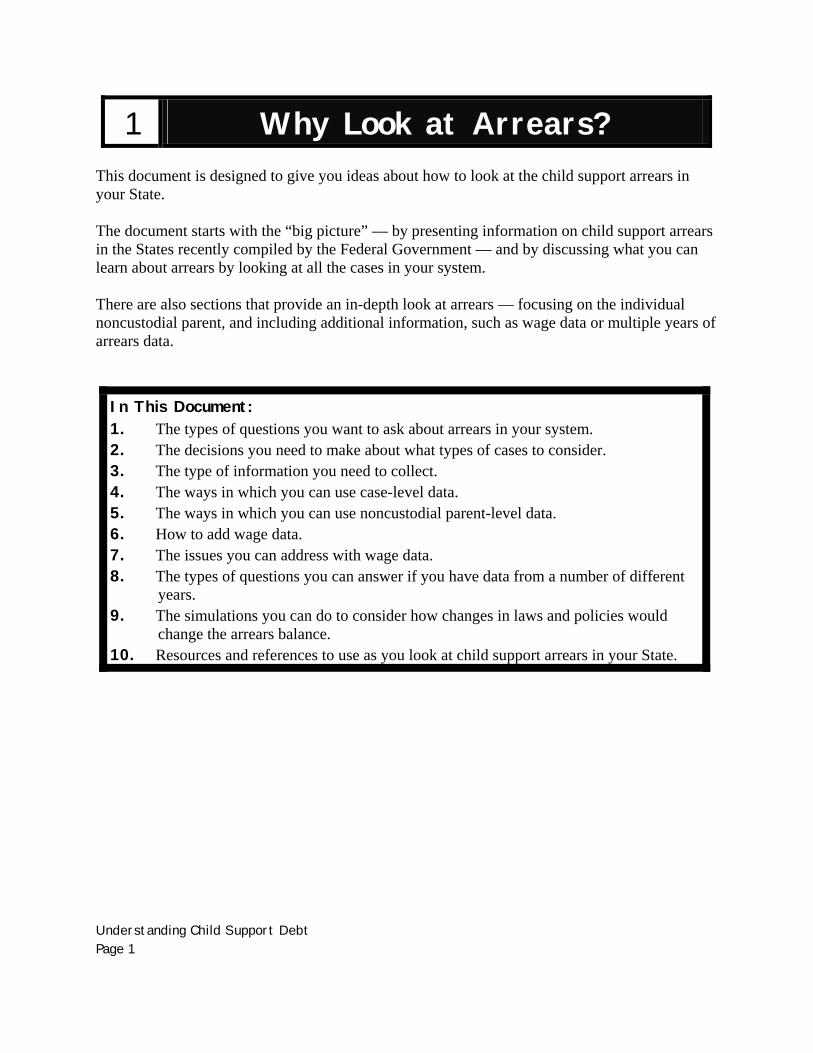
1 Why Look at Arrears? This document is designed to give you ideas about how to look at the child support arrears in your State. The document starts with the “big picture” — by presenting information on child support arrears in the States recently compiled by the Federal Government — and by discussing what you can learn about arrears by looking at all the cases in your system. There are also sections that provide an in-depth look at arrears — focusing on the individual noncustodial parent, and including additional information, such as wage data or multiple years of arrears data.
In This Document: 1. The types of questions you want to ask about arrears in your system. 2. The decisions you need to make about what types of cases to consider. 3. The type of information you need to collect. 4. The ways in which you can use case-level data. 5. The ways in which you can use noncustodial parent-level data. 6. How to add wage data. 7. The issues you can address with wage data. 8. The types of questions you can answer if you have data from a number of different
years. 9. The simulations you can do to consider how changes in laws and policies would
change the arrears balance. 10. Resources and references to use as you look at child support arrears in your State.

Understanding Child Support Debt Page 2
There are a number of reasons to look at child support arrears in your State. A profile of the arrears in your child support system can help you inform policymakers about the nature and scope of the problem. It can lead to the development of new tools to help child support workers better sort and work their cases. The study findings can translate into new legislation and pilot projects. Finally, a study of arrears can lead to the allocation of additional staff and funds for the Child Support Enforcement program. For example, Texas used the results of its Arrears Analysis to:
Add arrears information to an application available to line workers to prioritize cases; Enable child support workers to generate case lists with certain arrears characteristics; Merge arrears information with other child support attributes and payment patterns; Mix and match arrears information with other case and/or noncustodial parent (NCP)
characteristics; Sort cases with certain arrears characteristics by region, child support office, or worker; Initiate enforcement and other needed actions in cases identified through this sorting process;
and Present aggregate arrears patterns for the State as a whole as well as certain regions and
offices. California used the information generated in The Collectibility Study to pass legislation, adopt new procedures, and/or initiate pilot projects to:
Require courts to use the low-income adjustment to the child support guidelines in order to generate more appropriate orders for low-income parents;
Use the lower minimum wage, rather than the minimum basic standard for adequate care to presume income when actual information is missing, for the purposes of establishing a child support order;
Allow custodial parents, noncustodial parents, and the child support agency up to 12 months to set aside child support orders in cases where income is presumed if actual income information is presented;
Require child support agencies to use automation to try to identify actual income for noncustodial parents rather than using presumed income;
Expand the financial institutions data match to enhance its collections capabilities; Initiate a compromise of arrears program for noncustodial parents who owe at least $5,000 in
State debt to promote payment of current support and generate at least some payment of State-owed arrears at amounts to be determined based on individual assets, earnings, and expenses; and
Add 23 staff members to the State child support agency to implement these measures and $1 million for local child support agencies.
Colorado used its Understanding Child Support Arrears Study in 2000 to convene a strategic planning committee exclusively dedicated to arrears management. Comprised of State- and
Understanding Child Support Debt Page 3
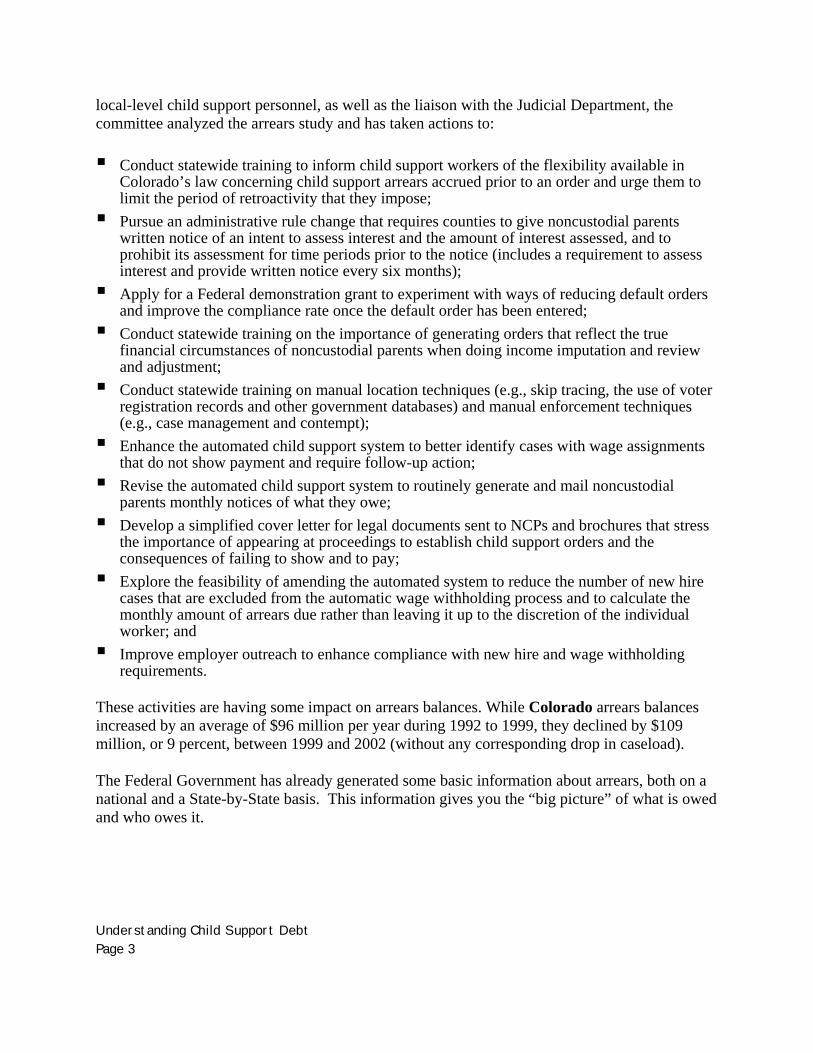
local-level child support personnel, as well as the liaison with the Judicial Department, the committee analyzed the arrears study and has taken actions to: Conduct statewide training to inform child support workers of the flexibility available in
Colorado’s law concerning child support arrears accrued prior to an order and urge them to limit the period of retroactivity that they impose;
Pursue an administrative rule change that requires counties to give noncustodial parents written notice of an intent to assess interest and the amount of interest assessed, and to prohibit its assessment for time periods prior to the notice (includes a requirement to assess interest and provide written notice every six months);
Apply for a Federal demonstration grant to experiment with ways of reducing default orders and improve the compliance rate once the default order has been entered;
Conduct statewide training on the importance of generating orders that reflect the true financial circumstances of noncustodial parents when doing income imputation and review and adjustment;
Conduct statewide training on manual location techniques (e.g., skip tracing, the use of voter registration records and other government databases) and manual enforcement techniques (e.g., case management and contempt);
Enhance the automated child support system to better identify cases with wage assignments that do not show payment and require follow-up action;
Revise the automated child support system to routinely generate and mail noncustodial parents monthly notices of what they owe;
Develop a simplified cover letter for legal documents sent to NCPs and brochures that stress the importance of appearing at proceedings to establish child support orders and the consequences of failing to show and to pay;
Explore the feasibility of amending the automated system to reduce the number of new hire cases that are excluded from the automatic wage withholding process and to calculate the monthly amount of arrears due rather than leaving it up to the discretion of the individual worker; and
Improve employer outreach to enhance compliance with new hire and wage withholding requirements.
These activities are having some impact on arrears balances. While Colorado arrears balances increased by an average of $96 million per year during 1992 to 1999, they declined by $109 million, or 9 percent, between 1999 and 2002 (without any corresponding drop in caseload). The Federal Government has already generated some basic information about arrears, both on a national and a State-by-State basis. This information gives you the “big picture” of what is owed and who owes it.
Understanding Child Support Debt Page 4
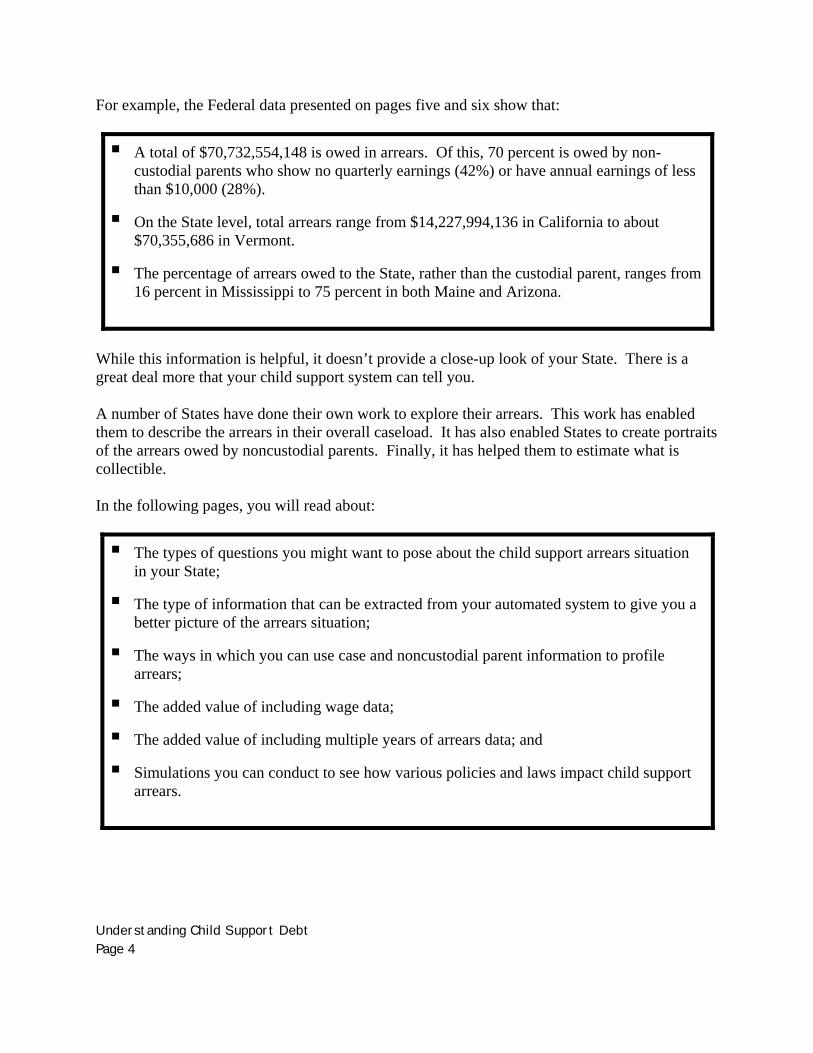
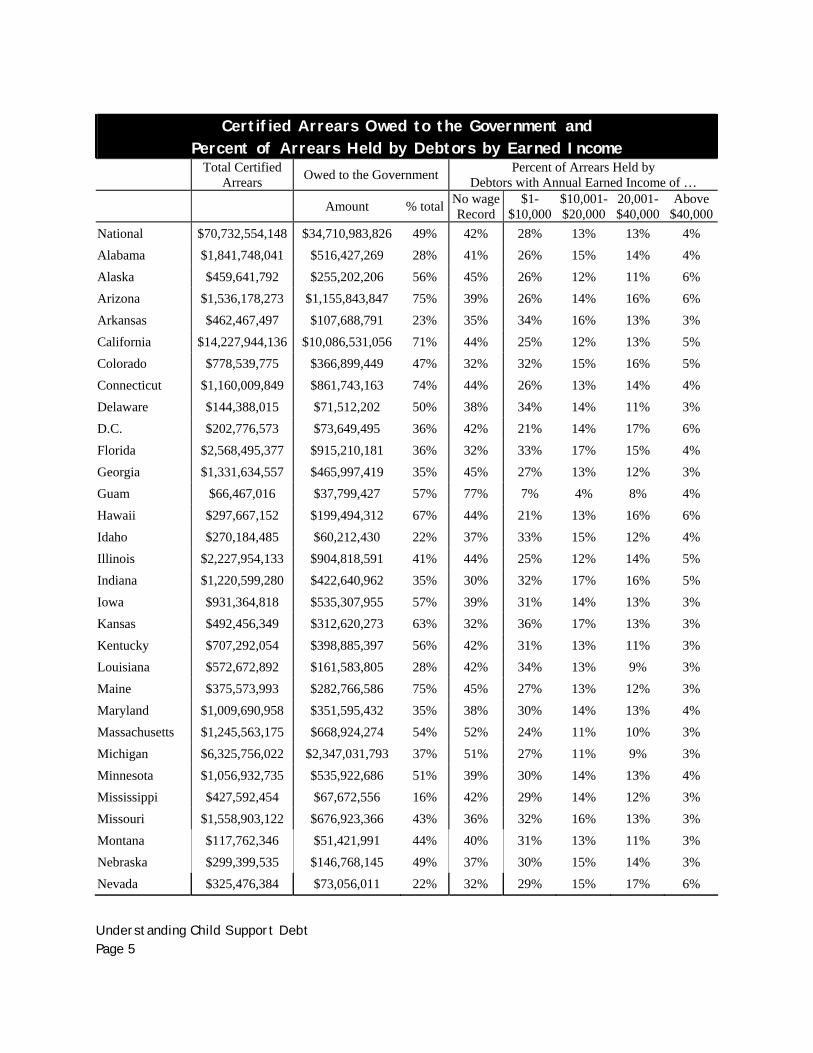
For example, the Federal data presented on pages five and six show that:
A total of $70,732,554,148 is owed in arrears. Of this, 70 percent is owed by non-custodial parents who show no quarterly earnings (42%) or have annual earnings of less than $10,000 (28%).
On the State level, total arrears range from $14,227,994,136 in California to about $70,355,686 in Vermont.
The percentage of arrears owed to the State, rather than the custodial parent, ranges from 16 percent in Mississippi to 75 percent in both Maine and Arizona.
While this information is helpful, it doesn’t provide a close-up look of your State. There is a great deal more that your child support system can tell you. A number of States have done their own work to explore their arrears. This work has enabled them to describe the arrears in their overall caseload. It has also enabled States to create portraits of the arrears owed by noncustodial parents. Finally, it has helped them to estimate what is collectible. In the following pages, you will read about:
The types of questions you might want to pose about the child support arrears situation in your State;
The type of information that can be extracted from your automated system to give you a better picture of the arrears situation;
The ways in which you can use case and noncustodial parent information to profile arrears;
The added value of including wage data;
The added value of including multiple years of arrears data; and
Simulations you can conduct to see how various policies and laws impact child support arrears.
Understanding Child Support Debt Page 5
Certified Arrears Owed to the Government and
Percent of Arrears Held by Debtors by Earned Income Total Certified
Arrears Owed to the Government Percent of Arrears Held by Debtors with Annual Earned Income of …
Amount % total No wage Record
$1-$10,000
$10,001-$20,000
20,001-$40,000
Above $40,000
National $70,732,554,148 $34,710,983,826 49% 42% 28% 13% 13% 4% Alabama $1,841,748,041 $516,427,269 28% 41% 26% 15% 14% 4% Alaska $459,641,792 $255,202,206 56% 45% 26% 12% 11% 6% Arizona $1,536,178,273 $1,155,843,847 75% 39% 26% 14% 16% 6% Arkansas $462,467,497 $107,688,791 23% 35% 34% 16% 13% 3% California $14,227,944,136 $10,086,531,056 71% 44% 25% 12% 13% 5% Colorado $778,539,775 $366,899,449 47% 32% 32% 15% 16% 5% Connecticut $1,160,009,849 $861,743,163 74% 44% 26% 13% 14% 4% Delaware $144,388,015 $71,512,202 50% 38% 34% 14% 11% 3% D.C. $202,776,573 $73,649,495 36% 42% 21% 14% 17% 6% Florida $2,568,495,377 $915,210,181 36% 32% 33% 17% 15% 4% Georgia $1,331,634,557 $465,997,419 35% 45% 27% 13% 12% 3% Guam $66,467,016 $37,799,427 57% 77% 7% 4% 8% 4% Hawaii $297,667,152 $199,494,312 67% 44% 21% 13% 16% 6% Idaho $270,184,485 $60,212,430 22% 37% 33% 15% 12% 4% Illinois $2,227,954,133 $904,818,591 41% 44% 25% 12% 14% 5% Indiana $1,220,599,280 $422,640,962 35% 30% 32% 17% 16% 5% Iowa $931,364,818 $535,307,955 57% 39% 31% 14% 13% 3% Kansas $492,456,349 $312,620,273 63% 32% 36% 17% 13% 3% Kentucky $707,292,054 $398,885,397 56% 42% 31% 13% 11% 3% Louisiana $572,672,892 $161,583,805 28% 42% 34% 13% 9% 3% Maine $375,573,993 $282,766,586 75% 45% 27% 13% 12% 3% Maryland $1,009,690,958 $351,595,432 35% 38% 30% 14% 13% 4% Massachusetts $1,245,563,175 $668,924,274 54% 52% 24% 11% 10% 3% Michigan $6,325,756,022 $2,347,031,793 37% 51% 27% 11% 9% 3% Minnesota $1,056,932,735 $535,922,686 51% 39% 30% 14% 13% 4% Mississippi $427,592,454 $67,672,556 16% 42% 29% 14% 12% 3% Missouri $1,558,903,122 $676,923,366 43% 36% 32% 16% 13% 3% Montana $117,762,346 $51,421,991 44% 40% 31% 13% 11% 3% Nebraska $299,399,535 $146,768,145 49% 37% 30% 15% 14% 3% Nevada $325,476,384 $73,056,011 22% 32% 29% 15% 17% 6%

Understanding Child Support Debt Page 6
Certified Arrears Owed to the Government and Percent of Arrears Held by Debtors by Earned Income
Total Certified Arrears Owed to the Government Percent of Arrears Held by
Debtors with Annual Earned Income of …
Amount % total No wage Record
$1-$10,000
$10,001-$20,000
20,001-$40,000
Above $40,000
New Hampshire $144,188,113 $62,636,615 43% 39% 26% 15% 15% 5%
New Jersey $1,419,384,086 $662,226,895 47% 44% 29% 12% 11% 4% New Mexico $262,162,902 $115,014,007 44% 28% 30% 19% 18% 5% New York $2,809,432,089 $1,537,944,859 55% 56% 23% 9% 8% 3% North Carolina $935,060,681 $346,406,458 37% 38% 35% 15% 11% 2% North Dakota $103,168,494 $59,132,295 57% 35% 33% 15% 14% 3% Ohio $2,635,986,167 $1,205,928,983 46% 39% 31% 14% 12% 4% Oklahoma $618,160,509 $314,317,512 51% 33% 33% 16% 14% 4% Oregon $686,489,505 $311,780,712 45% 42% 30% 13% 11% 4% Pennsylvania $1,377,768,176 $719,197,999 52% 39% 32% 14% 12% 4% Puerto Rico $217,543,014 $25,587,714 12% 41% 29% 14% 11% 4% Rhode Island $120,460,659 $65,111,223 54% 47% 25% 13% 12% 3% South Carolina $509,486,832 $215,008,648 42% 42% 30% 13% 12% 3% South Dakota $108,397,997 $53,404,160 49% 35% 37% 15% 11% 2% Tennessee $1,084,044,134 $385,668,431 36% 37% 28% 15% 15% 5% Texas $8,333,977,089 $2,928,530,871 35% 41% 25% 13% 15% 5% Utah $226,806,989 $115,861,544 51% 32% 37% 15% 12% 3% Vermont $70,355,686 $38,914,262 55% 40% 28% 14% 14% 4% Virgin Islands $16,394,306 $4,564,860 28% 66% 14% 7% 9% 5% Virginia $1,286,775,902 $502,093,739 39% 37% 32% 15% 13% 4% Washington $1,554,836,527 $868,400,056 56% 39% 32% 13% 12% 4% West Virginia $327,082,117 $125,603,767 38% 41% 29% 14% 13% 4% Wisconsin $1,506,157,940 $876,798,888 58% 40% 32% 14% 12% 3% Wyoming $135,301,446 $58,698,258 43% 31% 31% 17% 16% 5% OCSE Federal Offset Program Data as of April 2003. Based on a match of debtors with the Quarterly Wage File for the last four quarters.

Understanding Child Support Debt Page 7
2 Ask Questions That Interest You To guide your look at child support arrears in your State, begin by deciding what questions interest you. There are many potential questions. Once you have a list of questions, you can narrow them down to what you have the time, data, and resources to consider. You will encounter additional examples of the research questions that can be asked in the other sections of this document. Here are just a few examples to start the thought process: How are arrears distributed in your caseload? Are there many cases with modest arrears or
fewer cases with large arrears?
Are child support arrears distributed throughout the State in a manner proportionate to county caseloads? Are they concentrated in certain jurisdictions or regions?
How much of your arrears balances are comprised of unpaid child support? Unpaid medical support? Retroactive support? Interest and penalties?
Are interstate cases a significant percentage of the arrears caseload? Are interstate cases more likely to involve arrears than are intrastate cases?
On average, how many cases do noncustodial parents with arrears have open?
How many noncustodial parents with arrears also owe current support, and how many only owe arrears?
How common is it for a noncustodial parent to owe arrears on multiple cases?
What kind of increase occurs when you move from the average arrears per case to the average arrears per noncustodial parent?
What percentage of arrears cases are in an enforcement caseload awaiting locate?
How long have cases with arrears been open in the system? What percentages are relatively new cases and, what percentages have been open for many years?
What are the current arrears payment patterns? What percentage of noncustodial parents made a payment towards arrears in the past year?
What enforcement actions have been taken in cases with arrears?

Understanding Child Support Debt Page 8
Understanding Child Support Debt Page 9
3 Make A Few Decisions, Rules,
and Definitions Another useful step prior to generating the data is to make some basic decisions about what will be included in your analysis. Among the basic questions you need to answer are the following: Will you use all the cases on the system, or will you take a sample of cases?
Some States (e.g., Texas and California) used all the cases in the child support system to look at those with arrears, which is the preferred way to go. However, if you need to pull some information manually (rather than relying on an electronic database), you may need to work with only a sample of cases. For example, Colorado used a sample of 386 randomly selected cases from the 85,271 cases in the system owing $1,500 or more. This provided estimates that were plus or minus five points from the actual figure, with a 95 percent level of confidence. A statistician can help you determine how many cases you need in your sample in order to be able to generalize to all your cases. Do you need data on cases with arrears and cases without arrears?
Many of the questions you may have about arrears can be answered by looking only at cases with arrears. For example, among cases with arrears, what is the average amount owed? Or, how many of the cases with arrears showed any payment in the past 12 months? On the other hand, some questions may require that you compare cases with and without arrears. For example, you need cases with and without arrears to answer the question, “What percent of noncustodial parents earning less than $10,000 annually have arrears?” Do you want to include all cases with arrears, or only those cases with arrears greater than
some specified amount? Some States (e.g., Texas) have looked at their arrears by including all cases that owe $1 or more in arrears. Other States (e.g., Colorado) set a minimum threshold for inclusion – for example, you could set the minimum at $50 or at $1,500. Your decision should be based on how accurate and up-to-date you feel your system is in posting payments and adjusting arrears balances. If an arrears balance of $10 is likely to be an error, or the result of lags in the posting of payments, it may be better to include only those cases exceeding some higher amount, such as a $50 minimum. If your system is generally pretty accurate, it is easier and better to include every case with arrears.

Understanding Child Support Debt Page 10
How do you want to handle cases with multiple obligees?
You will probably discover that some cases have arrears owed to multiple people, such as the custodial parent and a grandparent who once had custody of the children. You will need to decide whether to add the arrears and treat it as one case, or keep the arrears separate and treat them as two cases. Colorado treated cases with multiple obligees as a single case. Do you want to restrict your analysis to unpaid child support, or do you want to look at
interest and penalties as well? If your State routinely charges interest and penalties, these amounts may be significant and worth considering. In other States, interest and/or penalties are rarely charged and/or collected, and it may not be worth the effort to collect data on these items. Does your automated system contain quarterly wage data from your State Workforce
Agency? If your system does not maintain wage data, it may be necessary to collect data on earnings from your State Workforce Agency. The more quarters of earnings information you have, the more accurate your analysis will be. For example, the California arrears study used three years of quarterly wage data and was able to identify income for 61 percent of debtors. The Child Support Debt Analysis Study being conducted by the Urban Institute, under contract with OCSE and the Assistant Secretary for Planning and Evaluation for the nine States with the largest caseloads, will use 18 months of wage information. If your automated system does include wage data, how many quarters of data are available?
Generally, the more quarters of data that are available, the more accurate your wage estimates will be. Wages from a single quarter may be subject to seasonal fluctuations or may not be representative of typical earnings. The results will be more accurate if you have multiple quarters of data available. Some States archive wage data and will have it available for six to twelve quarters. Others delete old wage information as new earnings are posted, so it will be impossible to go far back in time.
Understanding Child Support Debt Page 11
4 Deciding What Types of Information to Collect
The number and type of questions you can address depend on the amount and type of information you maintain on your automated child support system and decide to extract. For example:
If you maintain and extract background information about cases with arrears, you will be able to describe things like the TANF or interstate status of cases with arrears or their age.
If you maintain and extract background information about NCPs, you will be able to profile the types of noncustodial parents with arrears, including age, marital status, and whether they have ever shown evidence of verified employment.
If you maintain and extract information on types of orders and the source of orders, you might be able to assess relationships between default orders and arrears balances, or arrears generated due to medical support orders.
If you extract payment information and earnings for similar time periods, you will be able to look at the relationship between earnings and payments. The most accurate assessments will involve a month-by-month extraction of obligation owed and payments made, and the collection of wage data for each of these quarters.
Deciding what to collect is always a matter of balancing what you need to know against the time and resources you have to extract and run the data. Listed below, and on pages 12 and 13, are some of the data elements that have been used in other studies of child support arrears and a brief rationale for their inclusion.
\ Possible Data Elements to Collect NCP Name and Social Security Number (SSN)
You need an SSN to merge child support data with wage data maintained by the State Workforce Agency.
Case Number and NCP Identifier
You may need a person ID to “roll-up” the data to compute total obligations, payments, and arrears balances held by NCPs with multiple cases.
Enforcing County/Region
You need to identify where the case is assigned if you want to “map” cases with arrears.
Intrastate/ Interstate
Status
You need to identify the intrastate or interstate status of the case to determine arrears balances in both groups and whether out-of-State cases generate disproportionate arrears balances.
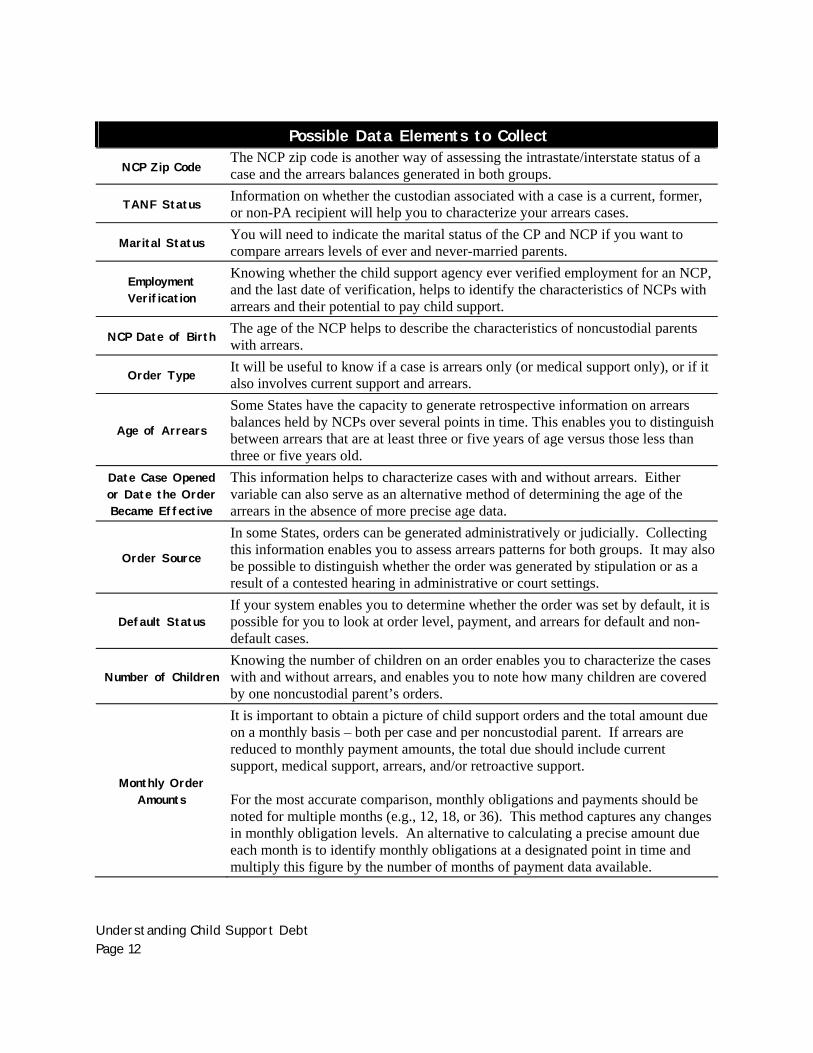
Understanding Child Support Debt Page 12
\ Possible Data Elements to Collect
NCP Zip Code The NCP zip code is another way of assessing the intrastate/interstate status of a case and the arrears balances generated in both groups.
TANF Status Information on whether the custodian associated with a case is a current, former, or non-PA recipient will help you to characterize your arrears cases.
Marital Status You will need to indicate the marital status of the CP and NCP if you want to compare arrears levels of ever and never-married parents.
Employment Verification
Knowing whether the child support agency ever verified employment for an NCP, and the last date of verification, helps to identify the characteristics of NCPs with arrears and their potential to pay child support.
NCP Date of Birth The age of the NCP helps to describe the characteristics of noncustodial parents with arrears.
Order Type It will be useful to know if a case is arrears only (or medical support only), or if it also involves current support and arrears.
Age of Arrears
Some States have the capacity to generate retrospective information on arrears balances held by NCPs over several points in time. This enables you to distinguish between arrears that are at least three or five years of age versus those less than three or five years old.
Date Case Opened or Date the Order Became Effective
This information helps to characterize cases with and without arrears. Either variable can also serve as an alternative method of determining the age of the arrears in the absence of more precise age data.
Order Source
In some States, orders can be generated administratively or judicially. Collecting this information enables you to assess arrears patterns for both groups. It may also be possible to distinguish whether the order was generated by stipulation or as a result of a contested hearing in administrative or court settings.
Default Status If your system enables you to determine whether the order was set by default, it is possible for you to look at order level, payment, and arrears for default and non-default cases.
Number of Children Knowing the number of children on an order enables you to characterize the cases with and without arrears, and enables you to note how many children are covered by one noncustodial parent’s orders.
Monthly Order Amounts
It is important to obtain a picture of child support orders and the total amount due on a monthly basis – both per case and per noncustodial parent. If arrears are reduced to monthly payment amounts, the total due should include current support, medical support, arrears, and/or retroactive support. For the most accurate comparison, monthly obligations and payments should be noted for multiple months (e.g., 12, 18, or 36). This method captures any changes in monthly obligation levels. An alternative to calculating a precise amount due each month is to identify monthly obligations at a designated point in time and multiply this figure by the number of months of payment data available.

Understanding Child Support Debt Page 13
\ Possible Data Elements to Collect
Wage Withholding The existence of a wage withholding order at a designated point in time or on the date of extract is an important indicator of employment and capacity to pay child support.
Monthly Payments
Payment data for multiple months (e.g., 12, 18, or 36 months) affords the most accurate picture of payment behavior in arrears cases. It can be compared with order amount and monthly earnings to provide a fuller understanding of the magnitude of the child support obligation and payment capacity. It will be important to track amounts of payment allocated to various “buckets.” This would include payments allocated to current support, medical support, arrears, interest, and penalties.
Payment Source
Payment sources can provide information on how arrears are being collected. A payment source could be noted for each payment included in the data set, or it could be recorded as “ever occurring” over the span of time covered by the payment data.
Arrears Balances
It is worth noting what amount of the total arrears (at a given point in time) is the result of unpaid child support, retroactive support, or medical support. If the State differentiates between arrears that have been reduced to judgment and those that have not, it will be necessary to add across both.
Assigned Versus Unassigned Balances
It is also important to note the amount of arrears due to the State and the amount due to the custodial parent for each arrears type (current support, retroactive, and medical).
Interest and Penalties
If the State routinely charges interest and penalties, it is useful to know how much of the arrears balance is due to interest and penalties. It will also be useful to know how much of the interest and penalties is due to the State versus the custodial parent.
Enforcement Actions
States may be interested in assessing the amount of enforcement activity in cases with arrears. This may speak to the issue of collectibility. If the cases have been aggressively worked, without arrears collections, their future collectibility is questionable.
Wage Data
If the automated child support system does not include wage data, or if only the most current quarter is recorded, wage data will have to be gathered from the State Workforce Agency. Multiple quarters of wage data will provide the most accurate assessment of earnings. To be most useful, the quarters of wage data that are collected should correspond to the time period for which payment data are collected. Keep in mind that most State Workforce Agencies have considerable lags in the posting of data — often six months or more. It may be best to begin by determining the time period for which wage data is available, and collect payment data for this time period.

Understanding Child Support Debt Page 14
Understanding Child Support Debt Page 15
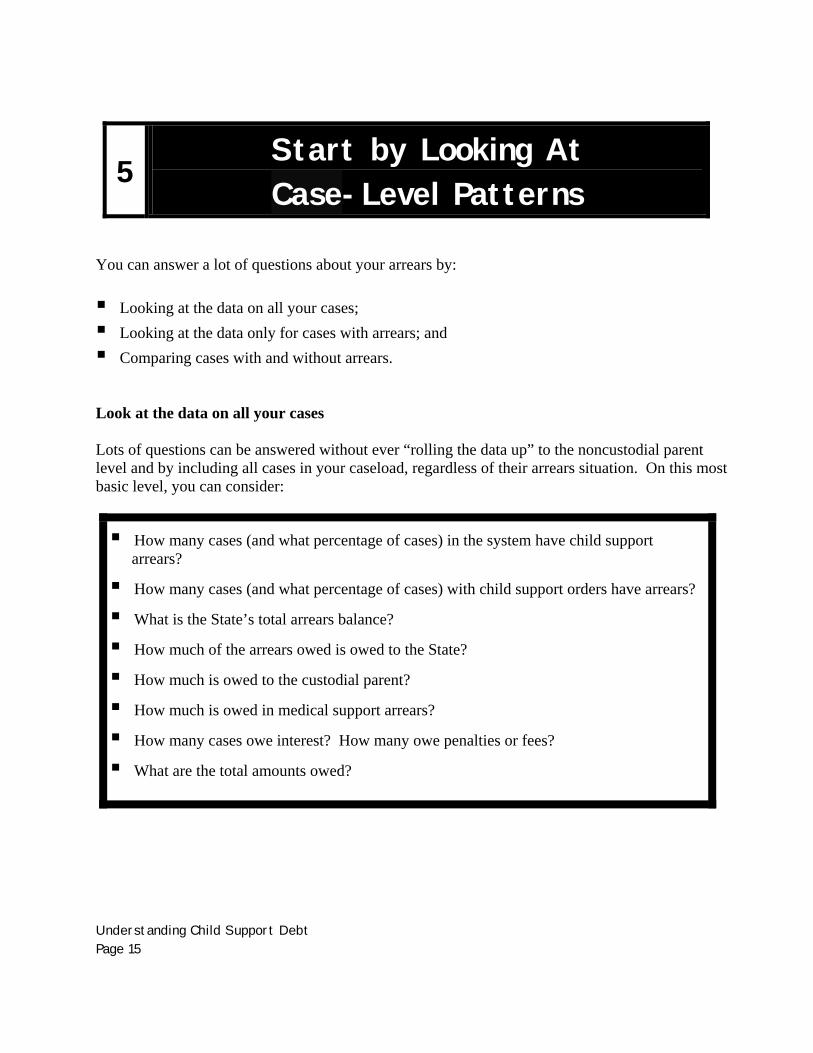
5 Start by Looking At Case-Level Patterns
You can answer a lot of questions about your arrears by: Looking at the data on all your cases; Looking at the data only for cases with arrears; and Comparing cases with and without arrears.
Look at the data on all your cases Lots of questions can be answered without ever “rolling the data up” to the noncustodial parent level and by including all cases in your caseload, regardless of their arrears situation. On this most basic level, you can consider:
How many cases (and what percentage of cases) in the system have child support arrears?
How many cases (and what percentage of cases) with child support orders have arrears?
What is the State’s total arrears balance?
How much of the arrears owed is owed to the State?
How much is owed to the custodial parent?
How much is owed in medical support arrears?
How many cases owe interest? How many owe penalties or fees?
What are the total amounts owed?

Understanding Child Support Debt Page 16
Texas started with this approach and looked at all 633,839 open cases in the State. Here are just a few examples of what they found:
Texa
s Arr
ears
Ana
lysi
s ■ F
igur
e 1
10.0%
48.0%
42.0%
TANF arrearsFormer TANF arrearsNever TANF arrears
$906,366,784
$4,760,369,664
$3,292,550,912
$8,959,287,296Arrears by TANF Status
Arrears Amounts by TANF Status
All cases
Arrears By TANF Status
Texa
s Arr
ears
Stu
dy ■ F
igur
e 2
150,487
54,032 67,43695,468
66,853 48,184 62,046 54,16222,348 12,037
$0-$999$1,000-$2,499
$4,500-$4,999$5,000-$9,999
$10,000-$14,999$15,000-$19,999
$20,000-$29,999$30,000-$49,999
$50,000-$74,999$75,000+
Analysis of All Cases by Arrears Group
Arrears Category
24% 8% 11% 15% 11% 8% 10% 8% 4% 1 % =100%
Look at only those cases with arrears You can answer another group of questions by looking only at those cases with arrears. In fact, most of the items you just looked at using all your cases can also be looked at using only those cases with arrears. This will give you a slightly different perspective on the arrears situation.

Understanding Child Support Debt Page 17
Examples of the questions you might want to consider using only cases with arrears include the following: On average, how much is owed in cases with arrears? How much is owed to the State and how much is owed to the custodial parent? Among cases with medical support arrears, what is the average amount of the arrears? Among cases owing interest, penalties, or fees, how much is owed on average? How long, on average, have cases with arrears been in the system? How many of the cases with arrears also have current support due? How many (what percentage) of the arrears cases are interstate cases? How many of the cases with arrears were established by default? What is payment like among
default-order cases? Among those cases with arrears, what do payments look like? How much of the arrears owed
was paid in a given period of time (e.g., 3, 6, or 12 months)? The following figures from Colorado and California show some of the issues that can be addressed by looking at just those cases with arrears.
Col
orad
o A
rrea
rs S
tudy
■ F
igur
e 3
73.0%
14.0% 13.0%
IntrastateInterstate - repondingInterstate - Initiating
7.08.0
0.3
14.0Interstate Status ofCases With Arrears
Number of Years Cases With Arrears Have Been Open
Interstate Status and Length of Time Open
Average Median Range

Understanding Child Support Debt Page 18
Col
orad
o A
rrea
rs S
tudy
■ F
igur
e 4
49.0%
34.0%
3.0% 14.0%
Never marriedDivorcedSeparatedMarried
Marital Relationship BetweenParents in Cases With Arrears
32%
15%
Percent of arrears cases with retrRetroactive support as a percentag
Retroactive Support (Money owed to the State for Public Benefits Paid
Prior to the Establishment of an Order)
oactive support
e
Marital Cases and Retroactive Support OwedCases with Arrears
Cal
iforn
ia A
rrea
rs S
tudy
■ F
igur
e 5
$11,313$9,001
57%69%
Arrears Levels and Payments by Debtors withDefault Orders and Similar Debtors without
Default Orders
Average ArrearsAverage Percent Who Paid Support
Over a One-Year Period
Default CasesNon-Default Cases
Profiles of Cases With and Without Arrears If you have information on cases with arrears and those without, you are able to do a number of interesting comparisons. For example, you would be able to explore the following questions:
Are cases with arrears older than those without arrears? Are cases with arrears more likely to have been established by default order than cases without
arrears?
Understanding Child Support Debt Page 19
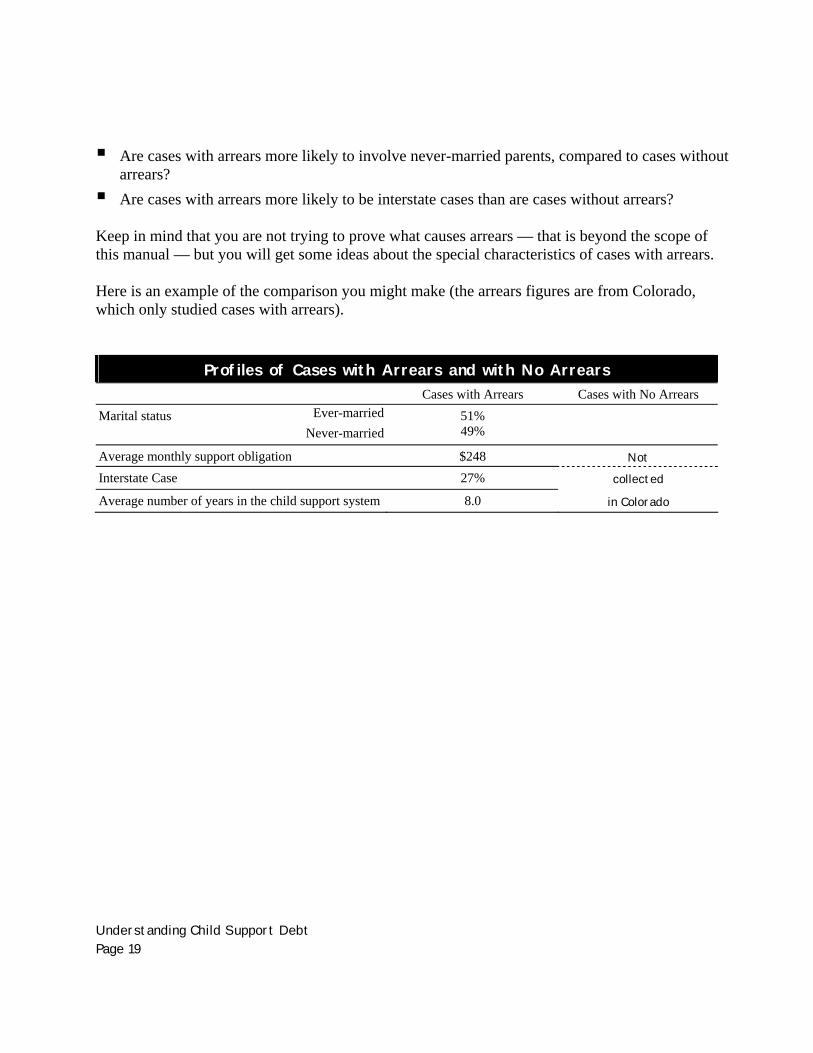
Are cases with arrears more likely to involve never-married parents, compared to cases without
arrears? Are cases with arrears more likely to be interstate cases than are cases without arrears?
Keep in mind that you are not trying to prove what causes arrears — that is beyond the scope of this manual — but you will get some ideas about the special characteristics of cases with arrears. Here is an example of the comparison you might make (the arrears figures are from Colorado, which only studied cases with arrears).
Profiles of Cases with Arrears and with No Arrears
Cases with Arrears Cases with No Arrears Ever-marriedMarital status
Never-married51% 49%
Average monthly support obligation $248 Not Interstate Case 27% collected
Average number of years in the child support system 8.0 in Colorado

Understanding Child Support Debt Page 20
Understanding Child Support Debt Page 21
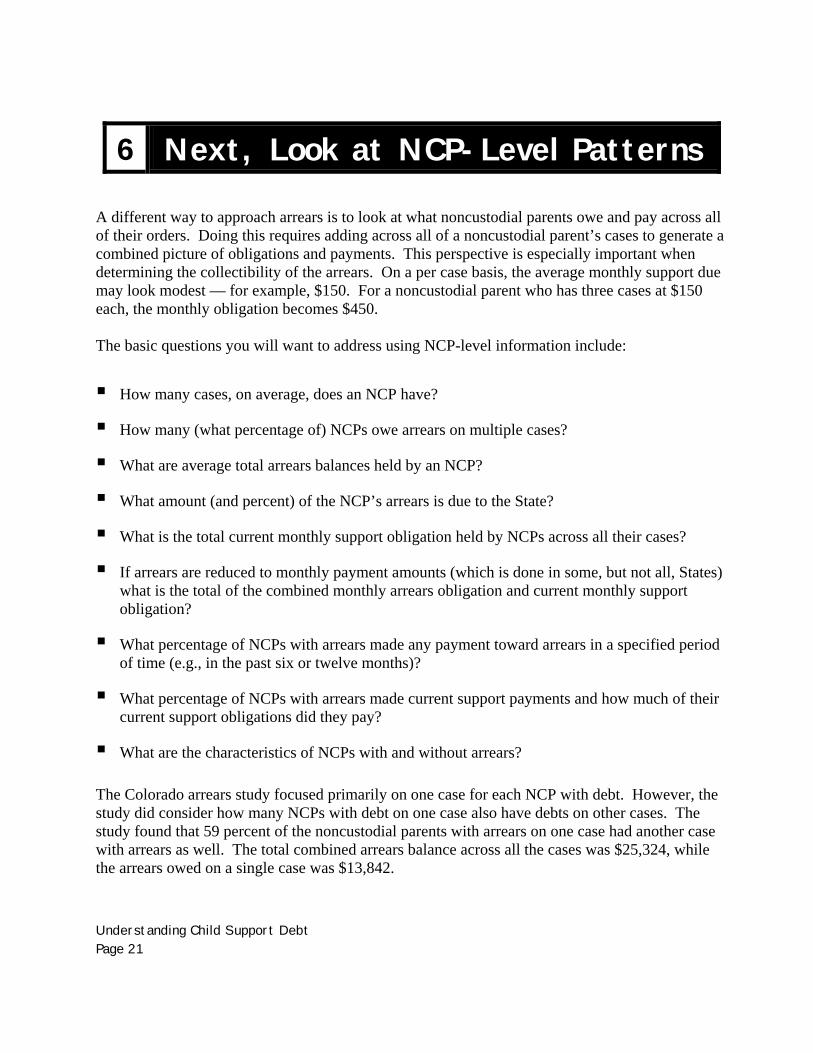
6 Next, Look at NCP-Level Patterns A different way to approach arrears is to look at what noncustodial parents owe and pay across all of their orders. Doing this requires adding across all of a noncustodial parent’s cases to generate a combined picture of obligations and payments. This perspective is especially important when determining the collectibility of the arrears. On a per case basis, the average monthly support due may look modest — for example, $150. For a noncustodial parent who has three cases at $150 each, the monthly obligation becomes $450. The basic questions you will want to address using NCP-level information include:
How many cases, on average, does an NCP have?
How many (what percentage of) NCPs owe arrears on multiple cases?
What are average total arrears balances held by an NCP?
What amount (and percent) of the NCP’s arrears is due to the State?
What is the total current monthly support obligation held by NCPs across all their cases?
If arrears are reduced to monthly payment amounts (which is done in some, but not all, States) what is the total of the combined monthly arrears obligation and current monthly support obligation?
What percentage of NCPs with arrears made any payment toward arrears in a specified period of time (e.g., in the past six or twelve months)?
What percentage of NCPs with arrears made current support payments and how much of their current support obligations did they pay?
What are the characteristics of NCPs with and without arrears? The Colorado arrears study focused primarily on one case for each NCP with debt. However, the study did consider how many NCPs with debt on one case also have debts on other cases. The study found that 59 percent of the noncustodial parents with arrears on one case had another case with arrears as well. The total combined arrears balance across all the cases was $25,324, while the arrears owed on a single case was $13,842.
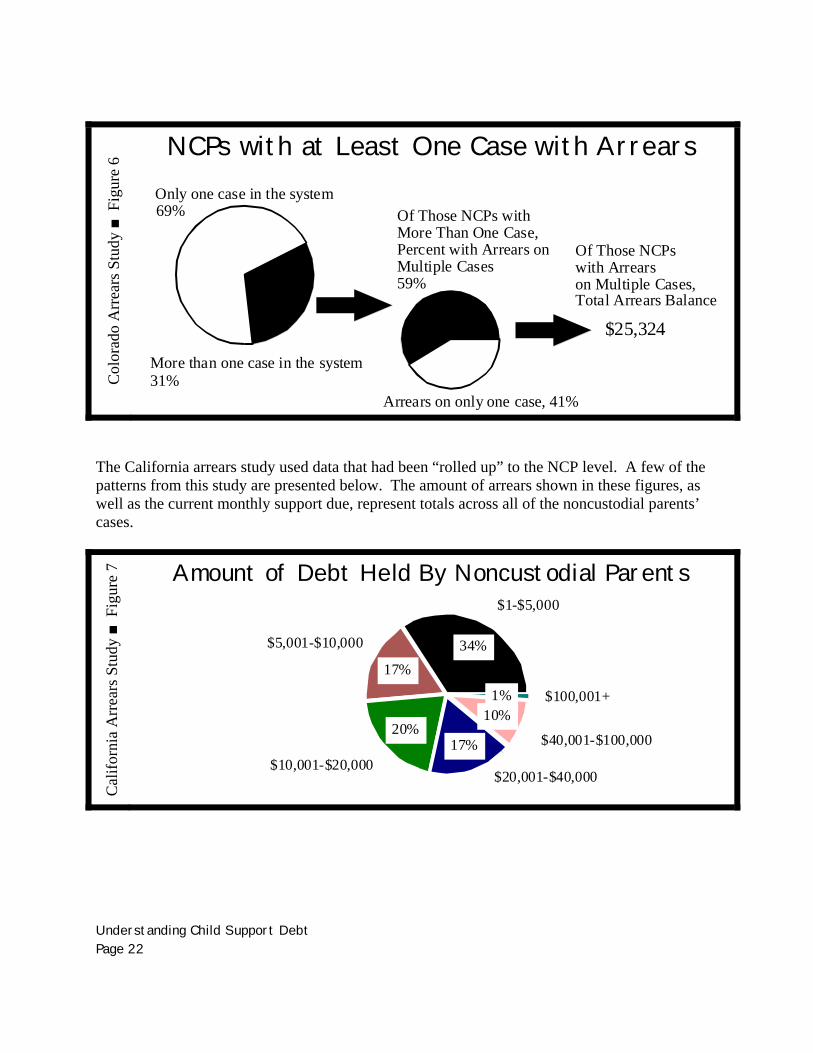
Understanding Child Support Debt Page 22
Col
orad
o A
rrea
rs S
tudy
■ F
igur
e 6 NCPs with at Least One Case with Arrears
Only one case in the system69% Of Those NCPs with
More Than One Case,Percent with Arrears onMultiple Cases59%
Arrears on only one case, 41%
Of Those NCPs with Arrears on Multiple Cases, Total Arrears Balance
$25,324
More than one case in the system31%
The California arrears study used data that had been “rolled up” to the NCP level. A few of the patterns from this study are presented below. The amount of arrears shown in these figures, as well as the current monthly support due, represent totals across all of the noncustodial parents’ cases.
Cal
iforn
ia A
rrea
rs S
tudy
■ F
igur
e 7 Amount of Debt Held By Noncustodial Parents
$1-$5,000
34%$5,001-$10,000
17%
$10,001-$20,000
20%
$20,001-$40,000
17% $40,001-$100,000
10%$100,001+1%
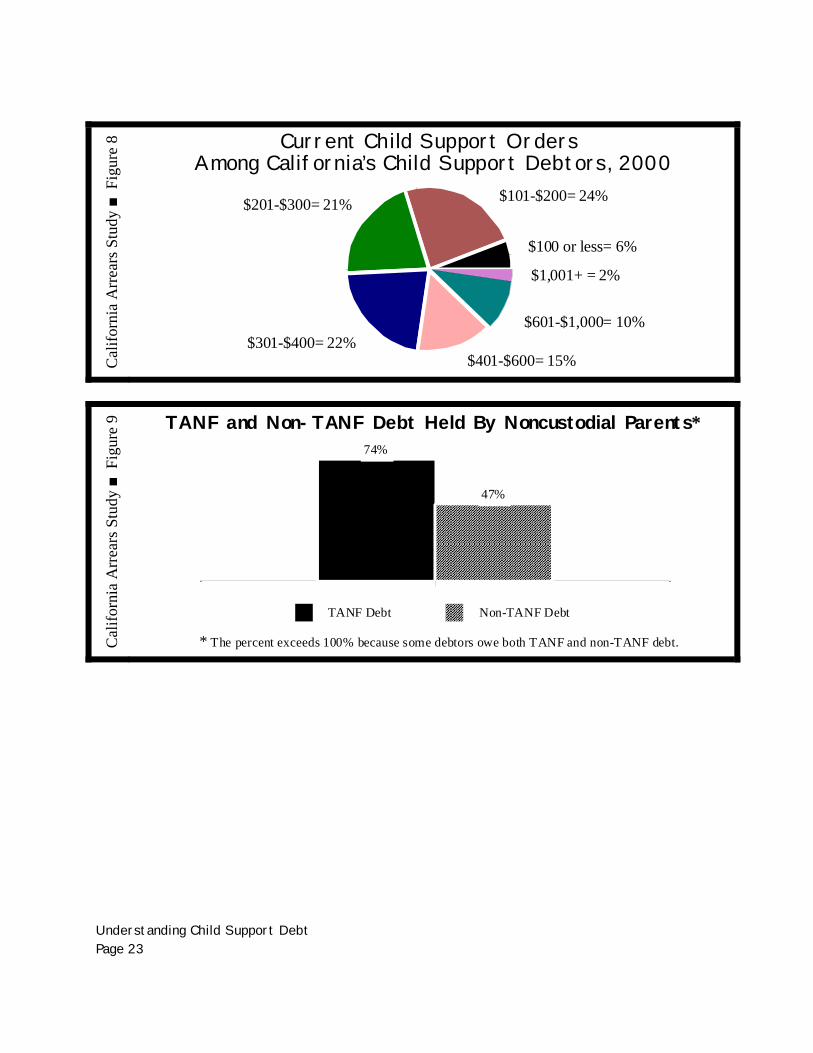
Understanding Child Support Debt Page 23
Cal
iforn
ia A
rrea
rs S
tudy
■ F
igur
e 8 Current Child Support Orders
Among California’s Child Support Debtors, 2000
$100 or less= 6%
$101-$200= 24%$201-$300= 21%
$301-$400= 22%$401-$600= 15%
$601-$1,000= 10%
$1,001+ = 2%
Cal
iforn
ia A
rrea
rs S
tudy
■ F
igur
e 9 TANF and Non-TANF Debt Held By Noncustodial Parents*
74%
47%
TANF Debt Non-TANF Debt
* The percent exceeds 100% because some debtors owe both TANF and non-TANF debt.

Understanding Child Support Debt Page 24
Understanding Child Support Debt Page 25
7 Add Wage Information
By adding information about earnings to the NCP level information, you are able to consider the collectibility issue in greater depth. Wage information also provides valuable insights into who owes arrears in your child support system. Child support automated systems vary widely with respect to what, if any, wage data are available internally. Some systems have only the wage data that are available from child support worksheets. Other systems have one or more quarters of data from the State unemployment insurance
agency. Unfortunately, child support worksheet data become dated and are often not kept in files maintained by the child support agency. As a result, they can provide very limited information about the noncustodial parent’s current earnings and payment capacity. In Colorado, income information from child support worksheets was available in only 20 percent of arrears cases in the study sample. Quarterly wage data maintained by the State Workforce Agency provide the best single source of information for earnings on noncustodial parents. In her study of California arrears, Sorenson, et. al.,1 checked all child support debtors through three years of quarterly earnings from the State Workforce Agency, three years of California tax records from the Franchise Tax Board, quarterly wage earnings outside of California from the Federal Office of Child Support Enforcement, bank account balances from the Financial Institution Data Match (FIDM), records from the California Department of Corrections, Medicaid, and death records. The Financial Institution Data Match, the Department of Corrections, Medicaid, and death records could not provide current earnings data, but were useful in understanding whether the debtor was in the workforce. The results of the data matches are shown below. Of all child support debtors, 61 percent were found in at least one of the three years of State Workforce Agency data. While data from other systems could account for another 24 percent of the noncustodial parents, the single biggest return on time spent in a data match clearly came from State Workforce Agency records.
1Sorenson, E., H. Koball, K. Pomper, C. Zimbman. Examining Child Support Arrears in California: The Collectibility Study. The Urban Institute, 2003.
Understanding Child Support Debt Page 26
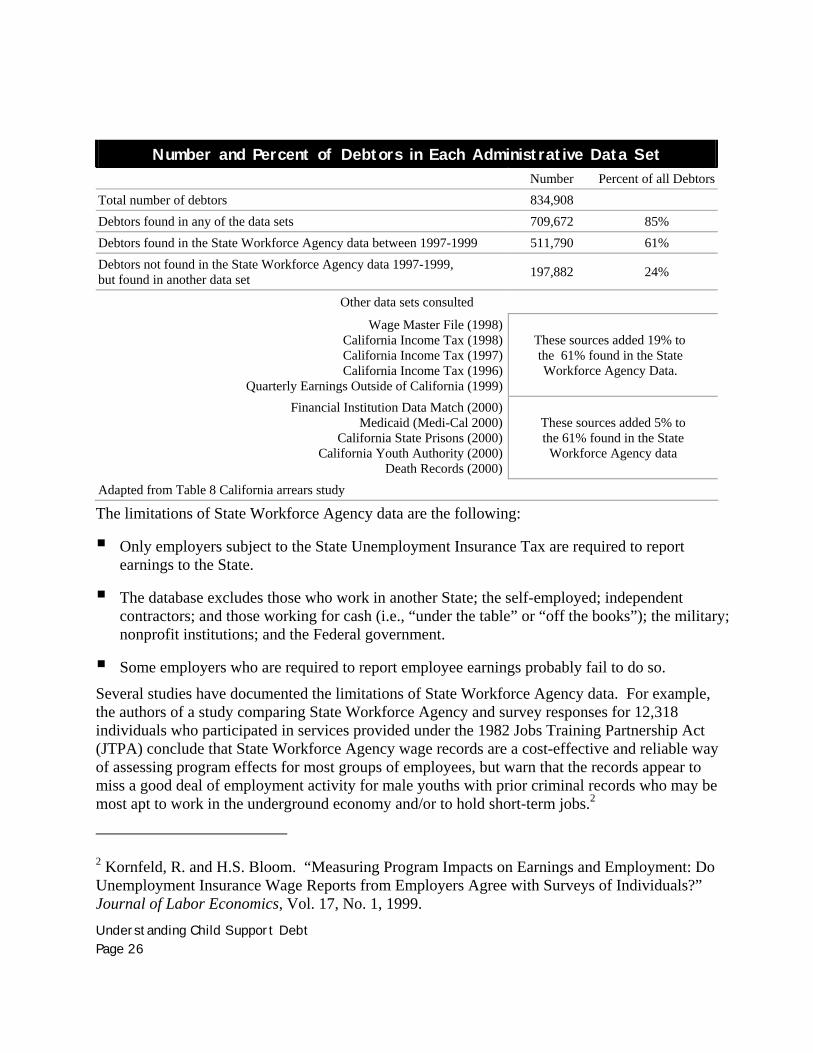
Number and Percent of Debtors in Each Administrative Data Set
Number Percent of all DebtorsTotal number of debtors 834,908 Debtors found in any of the data sets 709,672 85% Debtors found in the State Workforce Agency data between 1997-1999 511,790 61% Debtors not found in the State Workforce Agency data 1997-1999, but found in another data set 197,882 24%
Other data sets consulted
Wage Master File (1998)California Income Tax (1998)California Income Tax (1997)California Income Tax (1996)
Quarterly Earnings Outside of California (1999)
These sources added 19% to the 61% found in the State Workforce Agency Data.
Financial Institution Data Match (2000)Medicaid (Medi-Cal 2000)
California State Prisons (2000)California Youth Authority (2000)
Death Records (2000)
These sources added 5% to the 61% found in the State
Workforce Agency data
Adapted from Table 8 California arrears study
The limitations of State Workforce Agency data are the following:
Only employers subject to the State Unemployment Insurance Tax are required to report earnings to the State.
The database excludes those who work in another State; the self-employed; independent contractors; and those working for cash (i.e., “under the table” or “off the books”); the military; nonprofit institutions; and the Federal government.
Some employers who are required to report employee earnings probably fail to do so.
Several studies have documented the limitations of State Workforce Agency data. For example, the authors of a study comparing State Workforce Agency and survey responses for 12,318 individuals who participated in services provided under the 1982 Jobs Training Partnership Act (JTPA) conclude that State Workforce Agency wage records are a cost-effective and reliable way of assessing program effects for most groups of employees, but warn that the records appear to miss a good deal of employment activity for male youths with prior criminal records who may be most apt to work in the underground economy and/or to hold short-term jobs.2
2 Kornfeld, R. and H.S. Bloom. “Measuring Program Impacts on Earnings and Employment: Do Unemployment Insurance Wage Reports from Employers Agree with Surveys of Individuals?” Journal of Labor Economics, Vol. 17, No. 1, 1999.
Understanding Child Support Debt Page 27
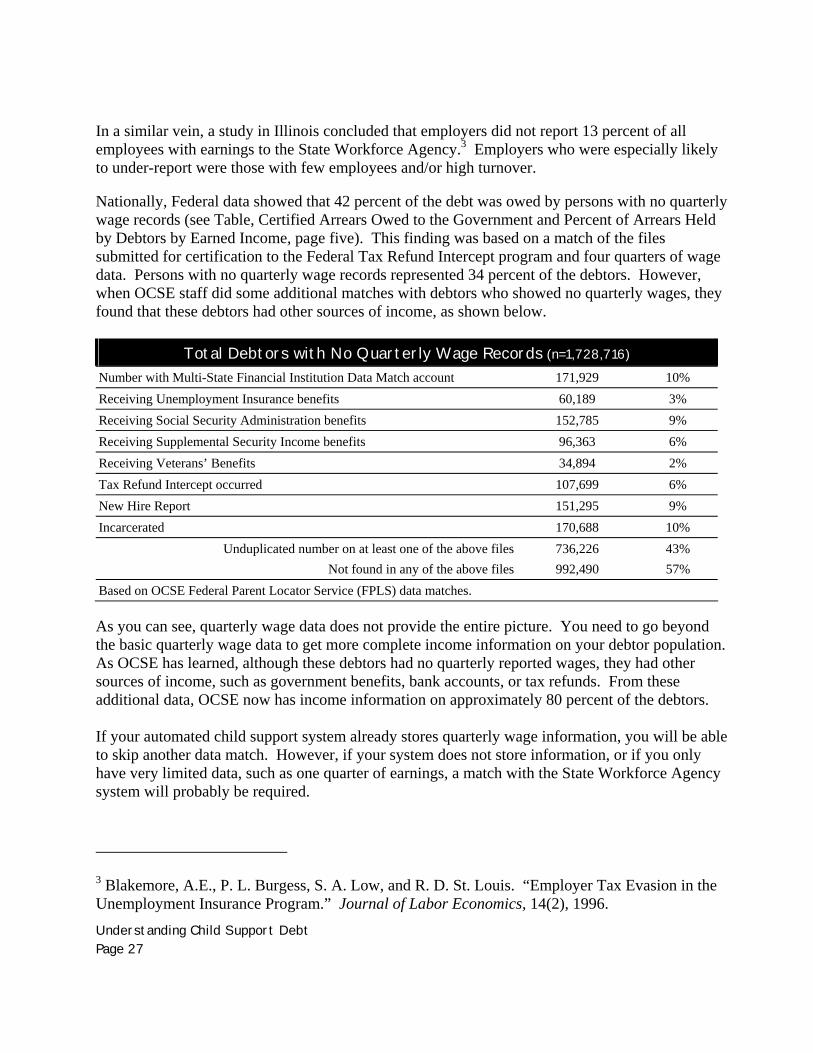
In a similar vein, a study in Illinois concluded that employers did not report 13 percent of all employees with earnings to the State Workforce Agency.3 Employers who were especially likely to under-report were those with few employees and/or high turnover. Nationally, Federal data showed that 42 percent of the debt was owed by persons with no quarterly wage records (see Table, Certified Arrears Owed to the Government and Percent of Arrears Held by Debtors by Earned Income, page five). This finding was based on a match of the files submitted for certification to the Federal Tax Refund Intercept program and four quarters of wage data. Persons with no quarterly wage records represented 34 percent of the debtors. However, when OCSE staff did some additional matches with debtors who showed no quarterly wages, they found that these debtors had other sources of income, as shown below.
Total Debtors with No Quarterly Wage Records (n=1,728,716)
Number with Multi-State Financial Institution Data Match account 171,929 10% Receiving Unemployment Insurance benefits 60,189 3% Receiving Social Security Administration benefits 152,785 9% Receiving Supplemental Security Income benefits 96,363 6% Receiving Veterans’ Benefits 34,894 2% Tax Refund Intercept occurred 107,699 6% New Hire Report 151,295 9% Incarcerated 170,688 10%
Unduplicated number on at least one of the above files 736,226 43% Not found in any of the above files 992,490 57%
Based on OCSE Federal Parent Locator Service (FPLS) data matches. As you can see, quarterly wage data does not provide the entire picture. You need to go beyond the basic quarterly wage data to get more complete income information on your debtor population. As OCSE has learned, although these debtors had no quarterly reported wages, they had other sources of income, such as government benefits, bank accounts, or tax refunds. From these additional data, OCSE now has income information on approximately 80 percent of the debtors. If your automated child support system already stores quarterly wage information, you will be able to skip another data match. However, if your system does not store information, or if you only have very limited data, such as one quarter of earnings, a match with the State Workforce Agency system will probably be required.
3 Blakemore, A.E., P. L. Burgess, S. A. Low, and R. D. St. Louis. “Employer Tax Evasion in the Unemployment Insurance Program.” Journal of Labor Economics, 14(2), 1996.
Understanding Child Support Debt Page 28
In general, the more quarters of recent earnings you have, the better your analysis will be. Knowing an individual’s earnings for a single quarter is helpful, but it may not be a very accurate representation of the noncustodial parent’s earnings. A single quarter may be subject to fluctuations from overtime, or seasonal work. The individual may have found or lost a job that quarter. By collecting several consecutive quarters of data, your estimates about earnings will be more accurate. Keep in mind when doing a data match with State Workforce Agency records that there is often a lag of six months or more in posting employer wage reports on the database. If you are going to look at earnings and payments, you need to be sure that you are collecting the proper quarters of wage data to match the payment period of interest. For example, if you decide to do an analysis of debt in January 2004, the most recent State Workforce Agency wage information that you can reliably use will probably be the second quarter of 2003 (April to June 2003). In this example, you would want to collect child support obligation and payment data for a period also ending June 2003.
Understanding Child Support Debt Page 29
8 Using the Wage Data
Once you have gathered wage data (and, if necessary, merged it with the child support information), you can look at a variety of questions that deal with ability to pay. For example, you might ask: How is debt distributed among noncustodial parents of different income levels?
What proportion of monthly income is obligated to the current monthly support order?
If arrears are reduced to a monthly amount due, what proportion of monthly income is
obligated to current monthly support plus the monthly arrears obligation? How do payments towards arrears vary across noncustodial parents of different income levels?
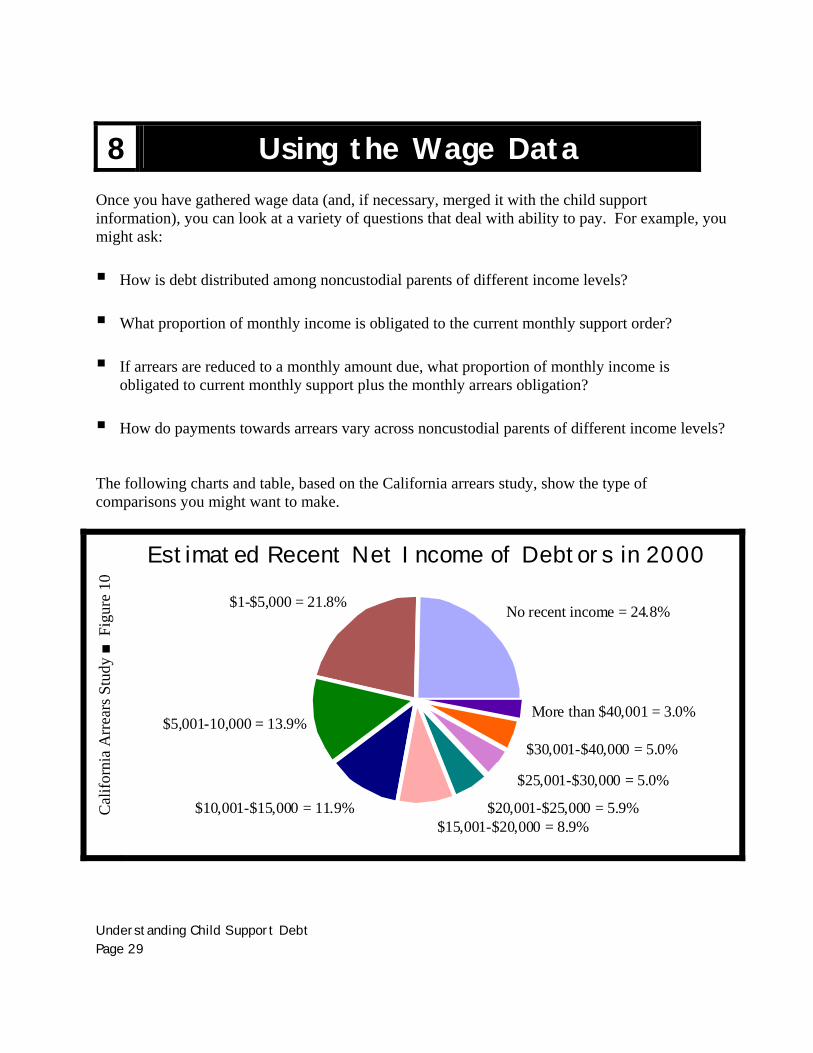
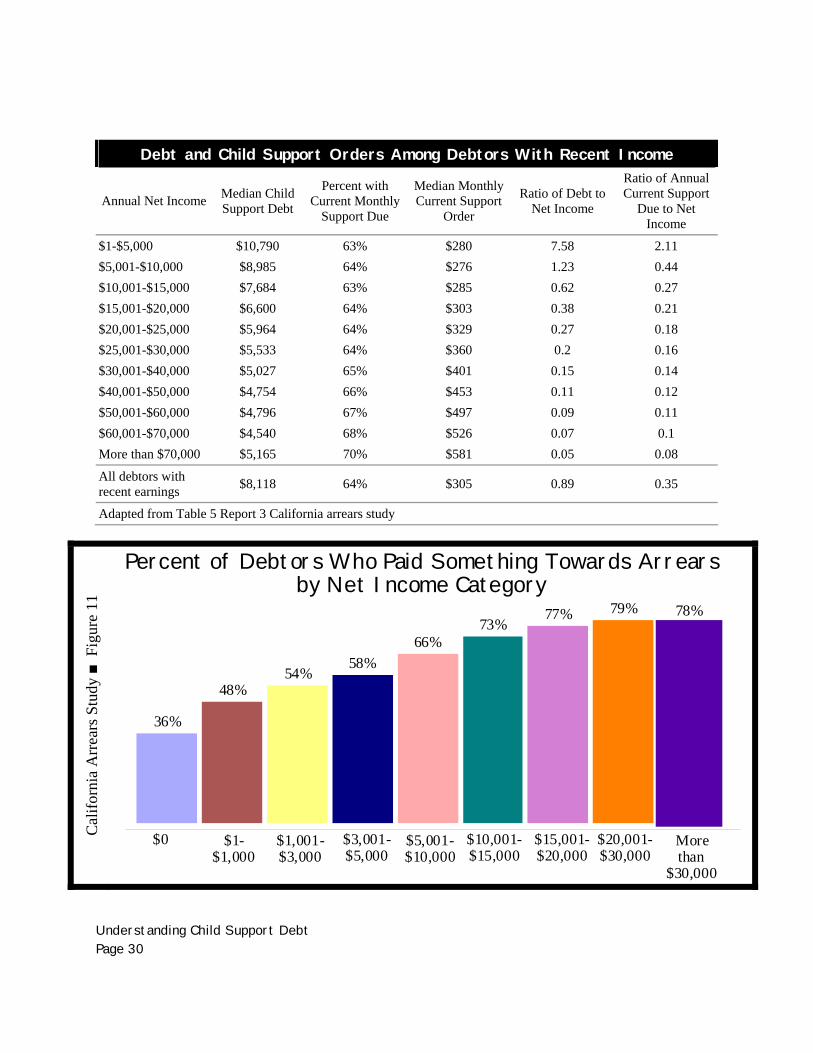
The following charts and table, based on the California arrears study, show the type of comparisons you might want to make.
Cal
iforn
ia A
rrea
rs S
tudy
■ F
igur
e 10
Estimated Recent Net Income of Debtors in 2000
No recent income = 24.8%$1-$5,000 = 21.8%
$5,001-10,000 = 13.9%
$10,001-$15,000 = 11.9%$15,001-$20,000 = 8.9%
$20,001-$25,000 = 5.9%
$25,001-$30,000 = 5.0%
$30,001-$40,000 = 5.0%
More than $40,001 = 3.0%
Understanding Child Support Debt Page 30
Debt and Child Support Orders Among Debtors With Recent Income
Annual Net Income Median Child Support Debt
Percent with Current Monthly
Support Due
Median Monthly Current Support
Order
Ratio of Debt to Net Income
Ratio of Annual Current Support
Due to Net Income
$1-$5,000 $10,790 63% $280 7.58 2.11 $5,001-$10,000 $8,985 64% $276 1.23 0.44 $10,001-$15,000 $7,684 63% $285 0.62 0.27 $15,001-$20,000 $6,600 64% $303 0.38 0.21 $20,001-$25,000 $5,964 64% $329 0.27 0.18 $25,001-$30,000 $5,533 64% $360 0.2 0.16 $30,001-$40,000 $5,027 65% $401 0.15 0.14 $40,001-$50,000 $4,754 66% $453 0.11 0.12 $50,001-$60,000 $4,796 67% $497 0.09 0.11 $60,001-$70,000 $4,540 68% $526 0.07 0.1 More than $70,000 $5,165 70% $581 0.05 0.08
All debtors with recent earnings $8,118 64% $305 0.89 0.35
Adapted from Table 5 Report 3 California arrears study
Cal
iforn
ia A
rrea
rs S
tudy
■ F
igur
e 11
Percent of Debtors Who Paid Something Towards Arrearsby Net Income Category
36%
48%54%
58%66%
73%77% 79% 78%
$0 $1-$1,000
$1,001-$3,000
$3,001-$5,000
$5,001-$10,000
$10,001-$15,000
$15,001-$20,000
$20,001-$30,000
Morethan
$30,000
Understanding Child Support Debt Page 31
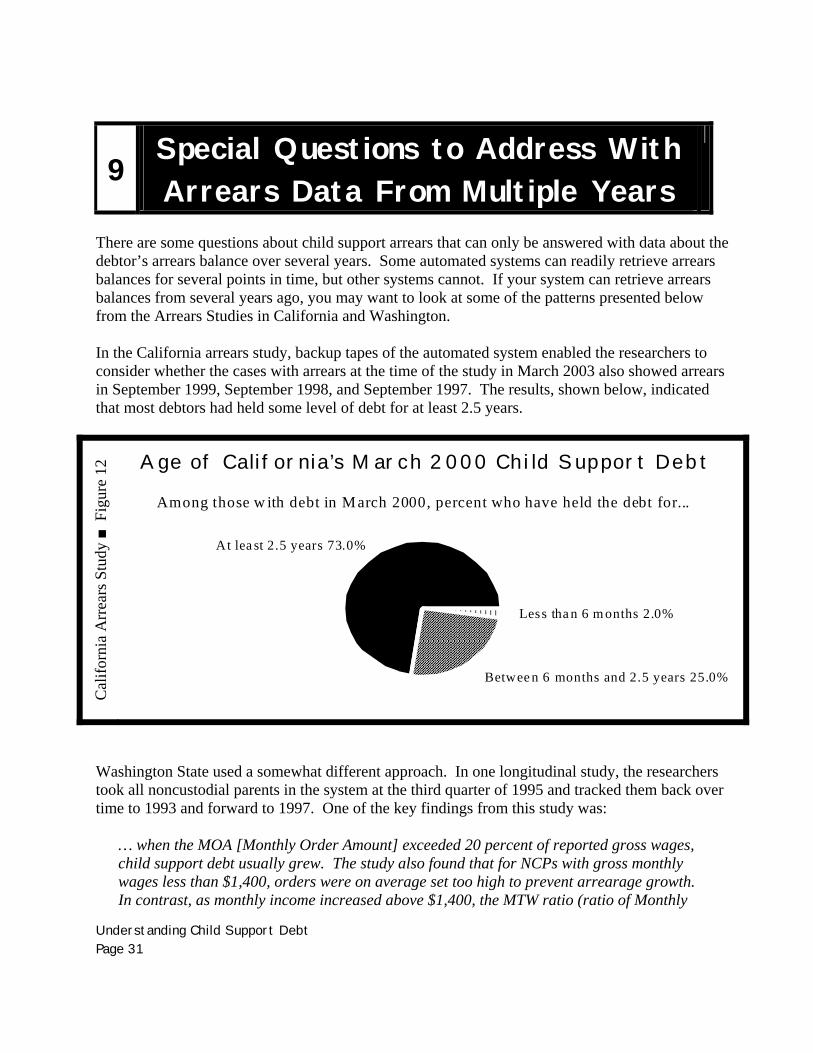
9 Special Questions to Address With Arrears Data From Multiple Years
There are some questions about child support arrears that can only be answered with data about the debtor’s arrears balance over several years. Some automated systems can readily retrieve arrears balances for several points in time, but other systems cannot. If your system can retrieve arrears balances from several years ago, you may want to look at some of the patterns presented below from the Arrears Studies in California and Washington. In the California arrears study, backup tapes of the automated system enabled the researchers to consider whether the cases with arrears at the time of the study in March 2003 also showed arrears in September 1999, September 1998, and September 1997. The results, shown below, indicated that most debtors had held some level of debt for at least 2.5 years.
Cal
iforn
ia A
rrea
rs S
tudy
■ F
igur
e 12
Age of California’s M arch 2 000 Chi ld Support Debt
At lea st 2.5 years 73.0%
Betwee n 6 months and 2.5 years 25.0%
Less tha n 6 m onths 2.0%
Among those w ith debt in M arch 2000, percent who have held the debt for...
Washington State used a somewhat different approach. In one longitudinal study, the researchers took all noncustodial parents in the system at the third quarter of 1995 and tracked them back over time to 1993 and forward to 1997. One of the key findings from this study was:
… when the MOA [Monthly Order Amount] exceeded 20 percent of reported gross wages, child support debt usually grew. The study also found that for NCPs with gross monthly wages less than $1,400, orders were on average set too high to prevent arrearage growth. In contrast, as monthly income increased above $1,400, the MTW ratio (ratio of Monthly

Understanding Child Support Debt Page 32
Order Amount to Monthly Wages) gradually fell, so that orders were set much lower than NCPs could have paid. This finding suggests that … If the order exceeds the “practical limit” of 20 percent of gross income, as opposed to the legal limits imposed by child support guidelines, some debt growth is likely.
In another Washington study, the researchers selected approximately 200 debtors from each of the four debt patterns identified in the longitudinal study: those with consistently growing debt, those with consistently declining debt, those with intermittent increases and decreases, and those with no change in the debt level. Those with no change in debt levels included some parents with arrears-only cases who made no payments, some cases with current support orders who fully paid monthly support due but did not touch their arrears, and 29 parents for whom the child support agency had never established an order. The last group — those without orders — was included because it represents an important group of hard-to-work cases in the State. The following three figures show some of the highlights of the analysis of these four groups of debtors. Median child support orders, wages, and ratios are used because they are less sensitive to extreme values.
Was
hing
ton
Arr
ears
Stu
dy ■ F
igur
e 13
Monthly Order Amounts By Noncustodial Parent’s Debt Pattern
$335
$67
$184 $202
Steadily increasing debtSteadily decreasing debt
Intermittently decreasing debtNo change in debt over time
Median monthly support due
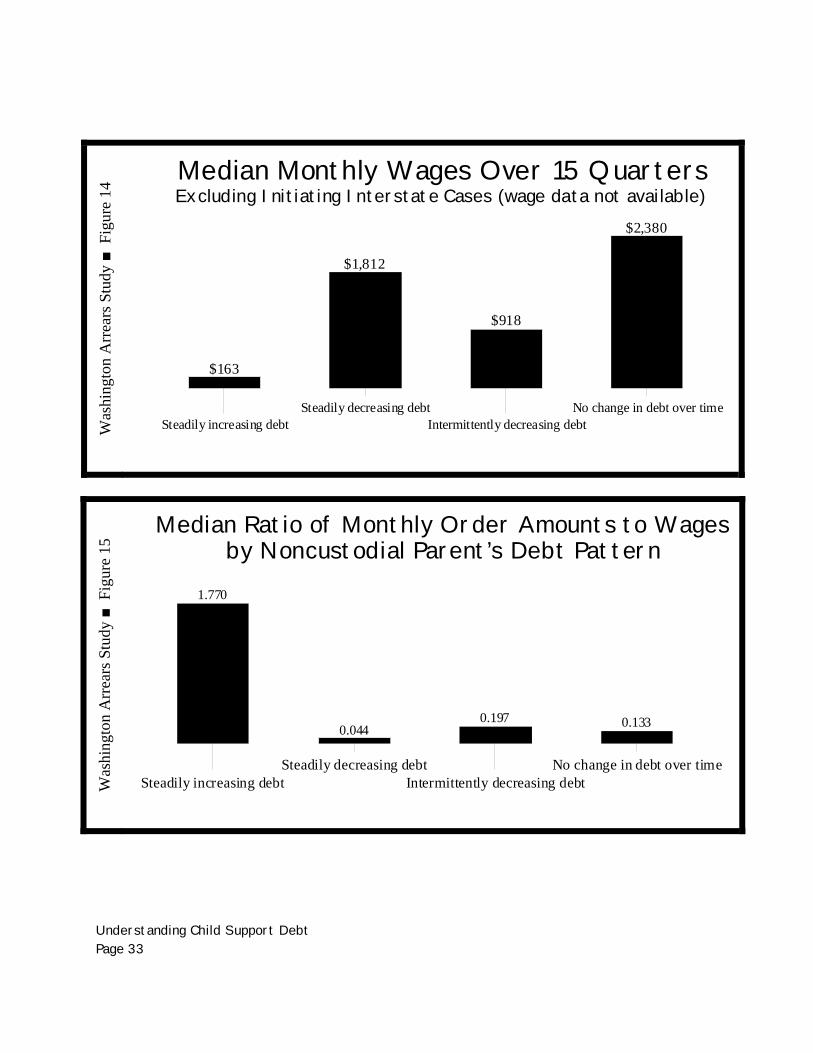
Understanding Child Support Debt Page 33
W
ashi
ngto
n A
rrea
rs S
tudy
■ F
igur
e 14
Median Monthly Wages Over 15 QuartersExcluding Initiating Interstate Cases (wage data not available)
$163
$1,812
$918
$2,380
Steadily increasing debtSteadily decreasing debt
Intermittently decreasing debtNo change in debt over time
Was
hing
ton
Arr
ears
Stu
dy ■ F
igur
e 15
Median Ratio of Monthly Order Amounts to Wagesby Noncustodial Parent’s Debt Pattern
1.770
0.0440.197 0.133
Steadily increasing debtSteadily decreasing debt
Intermittently decreasing debtNo change in debt over time

Understanding Child Support Debt Page 34
Understanding Child Support Debt Page 35
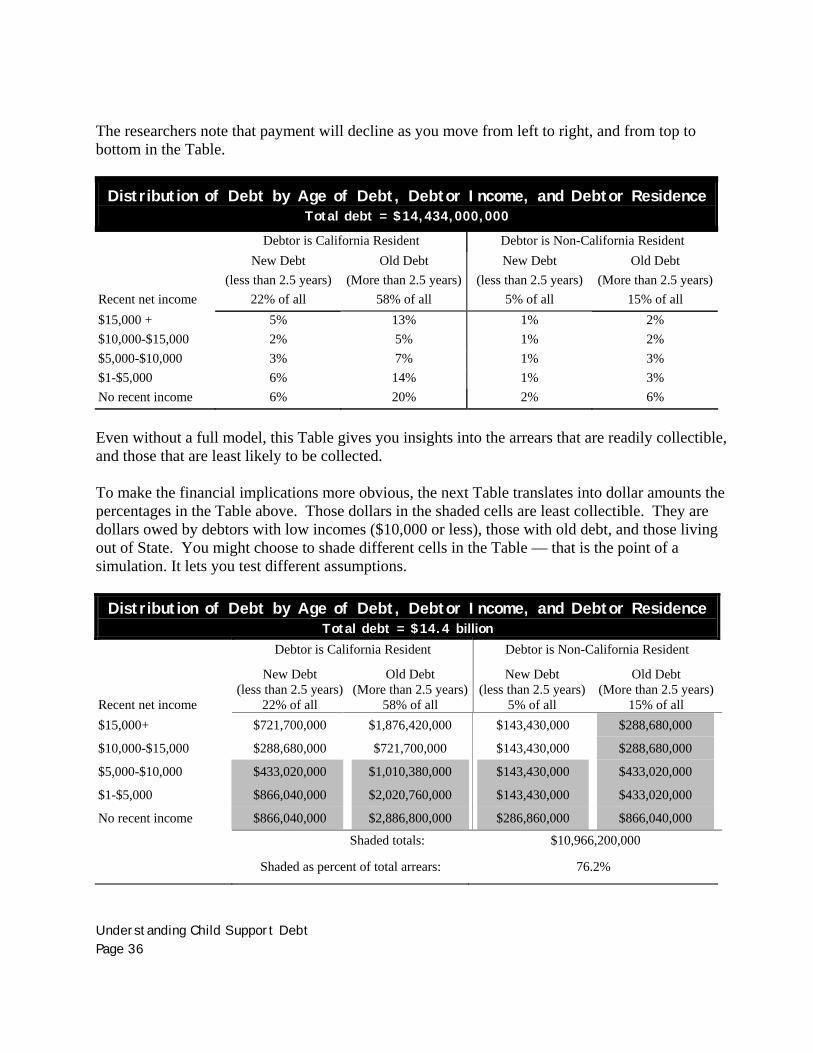
10 Simulations and Estimations Once a data set has been created, economists and policy analysts often use the information to play out various hypothetical scenarios. Doing estimates and simulations can be complicated, and this Guide is not intended to provide step-by-step instructions. However, this discussion may give you some ideas about how your data can be used for these purposes. The first step is to pick a “what if” scenario that is of interest. These hypothetical tests are most useful if they are practical in the real world. For example, States have flexibility in the decision to assess retroactive support and the length of time that can be counted in establishing the amount of retroactive support that is due. As a result, it might be helpful to test how overall arrears balances will be reduced by eliminating retroactive support obligations or limiting the period of retroactivity to three years rather than going back to the birth of the child. Some estimations also require that you provide some assumptions. This can be problematic, because the resulting estimate is only as accurate as the estimates producing it. For example, if you conduct data matches with the Department of Corrections and know which of the debtors in your system are incarcerated, you may want to estimate how much the arrears balance would decline if the order had been modified to a nominal amount when the individual entered prison. In the absence of accurate information on the CSE system on prison entry and release dates, you may need to base your arrears estimates on the date the noncustodial parent first appears in the match and the length of an average sentence. Although simulations and estimates can be very complex and difficult, requiring the help of statisticians, you can often get an interesting perspective on the State’s child support arrears with some simple calculations. Some examples from California and Colorado are provided below. In the California Study, the researchers develop a “collectibility model” that provides estimates of the arrears that might be collected over a ten-year period. This requires making assumptions about how much might be paid and how much new arrears will accrue. The model predicts that $3.5 billion could be collected over ten years. Given the rate of new arrears accruing, researchers estimate that the State’s arrears will easily double during 10 years, producing arrears of $34 billion by 2010. The following Table from the California arrears study shows the percentage of the State’s $14.4 billion dollar debt held by various groups of debtors. The Table considers three variables that the researchers found were related to payment: residence inside or outside of California, recent net incomes, and those holding arrears for 2.5 years or more and those with arrears for less than 2.5 years.
Understanding Child Support Debt Page 36
The researchers note that payment will decline as you move from left to right, and from top to bottom in the Table.
Distribution of Debt by Age of Debt, Debtor Income, and Debtor Residence Total debt = $14,434,000,000 Debtor is California Resident Debtor is Non-California Resident
Recent net income
New Debt (less than 2.5 years)
22% of all
Old Debt (More than 2.5 years)
58% of all
New Debt (less than 2.5 years)
5% of all
Old Debt (More than 2.5 years)
15% of all $15,000 + 5% 13% 1% 2% $10,000-$15,000 2% 5% 1% 2% $5,000-$10,000 3% 7% 1% 3% $1-$5,000 6% 14% 1% 3% No recent income 6% 20% 2% 6%
Even without a full model, this Table gives you insights into the arrears that are readily collectible, and those that are least likely to be collected. To make the financial implications more obvious, the next Table translates into dollar amounts the percentages in the Table above. Those dollars in the shaded cells are least collectible. They are dollars owed by debtors with low incomes ($10,000 or less), those with old debt, and those living out of State. You might choose to shade different cells in the Table — that is the point of a simulation. It lets you test different assumptions. Distribution of Debt by Age of Debt, Debtor Income, and Debtor Residence
Total debt = $14.4 billion Debtor is California Resident Debtor is Non-California Resident
Recent net income
New Debt (less than 2.5 years)
22% of all
Old Debt (More than 2.5 years)
58% of all
New Debt (less than 2.5 years)
5% of all
Old Debt (More than 2.5 years)
15% of all $15,000+ $721,700,000 $1,876,420,000 $143,430,000 $288,680,000
$10,000-$15,000 $288,680,000 $721,700,000 $143,430,000 $288,680,000
$5,000-$10,000 $433,020,000 $1,010,380,000 $143,430,000 $433,020,000
$1-$5,000 $866,040,000 $2,020,760,000 $143,430,000 $433,020,000
No recent income $866,040,000 $2,886,800,000 $286,860,000 $866,040,000
Shaded totals: $10,966,200,000
Shaded as percent of total arrears: 76.2%

Understanding Child Support Debt Page 37
Colorado used the information generated in its arrears study to estimate the reductions in the arrears balance that the State would realize through the adoption of several policy changes. One involved eliminating retroactive support owed to the State and limiting the State-owed retroactive arrears to three years. State-owed retroactive support is called “child support debt” in Colorado. Its simulated elimination would lead to a 15 percent decline in State arrears balances ($178,882,357), while the reduction of retroactivity to three years would reduce arrears balances by $65,884,586 or 5.6 percent. Impact on Arrears Totals if Child Support Debt Is Set to $0 Current Figures Arrears Estimates if Child Support
Debt is Set to $0 Amount Reduced if Child Support Debt is Set to $0
IV-A Permanent $551,675,231 $372,792,874 $178,882,357 IV-A Pre-Assistance $86,687,409 $8,687,409 $0 Non-IV-A $326,823,278 $326,823,278 $0 Non-IV-A Post $279,992,445 $279,992,445 $0 IV-E $7,248,888 $7,248,888 $0 Non-IV-E $5,831,684 $5,831,684 $0 Non-IV-D $401,626 $401,626 $0 Administrative $722,245 $722,245 $0 Total $1,181,382,806 $1,002,500,449 $178,882,357
Child support debt $178,882,357 $0 $178,882,357 Retroactive support $46,335,409 $46,335,409 $0
Impact on Arrears Totals if Only Three Years of Child Support Debt Is Retained
Current Figures Arrears Estimates if Only 3 Years of Child Support Debt is Retained
Amount Reduced if 3 Years of Child Support Debt is Retained
IV-A Permanent $551,675,231 $485,790,642 $65,884,589 IV-A Pre-Assistance $86,687,409 $8,687,409 $0 Non-IV-A $326,823,278 $326,823,278 $0 Non-IV-A Post $279,992,445 $279,992,445 $0 IV-E $7,248,888 $7,248,888 $0 Non-IV-E $5,831,684 $5,831,684 $0 Non-IV-D $401,626 $401,626 $0 Administrative $722,245 $722,245 $0 Total $1,181,382,806 $1,115,498,220 $65,884,586
Child support debt $178,882,357 $112,997,768 $65,884,586 Retroactive support $46,335,409 $46,335,409 $0
Source: Colorado Child Support Arrears Study
Understanding Child Support Debt Page 38
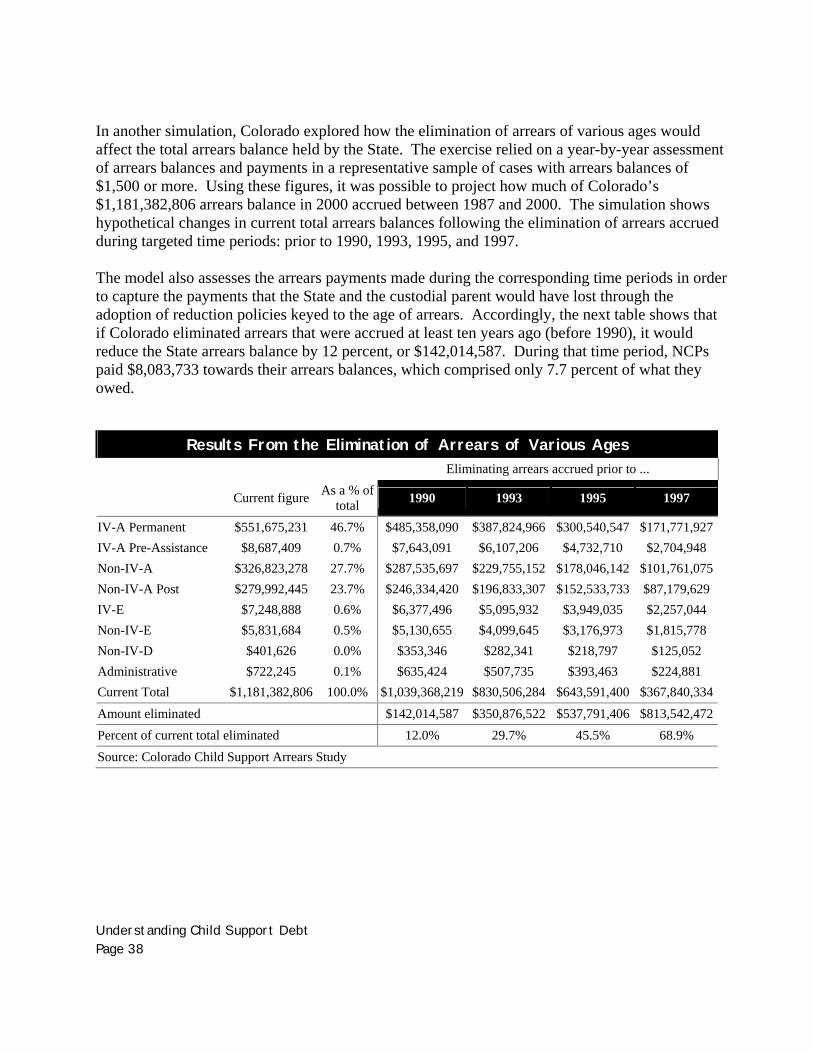
In another simulation, Colorado explored how the elimination of arrears of various ages would affect the total arrears balance held by the State. The exercise relied on a year-by-year assessment of arrears balances and payments in a representative sample of cases with arrears balances of $1,500 or more. Using these figures, it was possible to project how much of Colorado’s $1,181,382,806 arrears balance in 2000 accrued between 1987 and 2000. The simulation shows hypothetical changes in current total arrears balances following the elimination of arrears accrued during targeted time periods: prior to 1990, 1993, 1995, and 1997. The model also assesses the arrears payments made during the corresponding time periods in order to capture the payments that the State and the custodial parent would have lost through the adoption of reduction policies keyed to the age of arrears. Accordingly, the next table shows that if Colorado eliminated arrears that were accrued at least ten years ago (before 1990), it would reduce the State arrears balance by 12 percent, or $142,014,587. During that time period, NCPs paid $8,083,733 towards their arrears balances, which comprised only 7.7 percent of what they owed.
Results From the Elimination of Arrears of Various Ages Eliminating arrears accrued prior to ... Current figure As a % of
total 1990 1993 1995 1997
IV-A Permanent $551,675,231 46.7% $485,358,090 $387,824,966 $300,540,547 $171,771,927IV-A Pre-Assistance $8,687,409 0.7% $7,643,091 $6,107,206 $4,732,710 $2,704,948 Non-IV-A $326,823,278 27.7% $287,535,697 $229,755,152 $178,046,142 $101,761,075Non-IV-A Post $279,992,445 23.7% $246,334,420 $196,833,307 $152,533,733 $87,179,629 IV-E $7,248,888 0.6% $6,377,496 $5,095,932 $3,949,035 $2,257,044 Non-IV-E $5,831,684 0.5% $5,130,655 $4,099,645 $3,176,973 $1,815,778 Non-IV-D $401,626 0.0% $353,346 $282,341 $218,797 $125,052 Administrative $722,245 0.1% $635,424 $507,735 $393,463 $224,881 Current Total $1,181,382,806 100.0% $1,039,368,219 $830,506,284 $643,591,400 $367,840,334Amount eliminated $142,014,587 $350,876,522 $537,791,406 $813,542,472Percent of current total eliminated 12.0% 29.7% 45.5% 68.9% Source: Colorado Child Support Arrears Study
Understanding Child Support Debt Page 39
Contacts and Resources
California
Contact: Curtis L. Child, IV-D Director Department of Child Support Services PO Box 419064 Mail Station-10 Rancho Cordova, CA 95741-9064 916-464-5300
[email protected] Resource: Examining Child Support Arrears in California: The Collectibility Study Elaine Sorenson, Ph.D., Heather Koball, Ph.D., Kate Pomper, and Chava Zibman The Urban Institute 2100 M Street, NW Washington, DC 20037 March 2003 Prepared for the California Department of Child Support Services
http://www.childsup.cahwnet.gov [go to Examining Child Support Arrears in California under “What’s New”]
Colorado Contact: Pauline Burton, IV-D Director Colorado Division of Child Support Enforcement Colorado Department of Human Services 1575 Sherman Street Denver, CO 80204 303-866-5050
[email protected] Resource: New Approaches to Child Support Arrears: A Survey of State Policies and Practices. Understanding Child Support Arrears in Colorado. Dropping Debt: An Evaluation of Colorado's Debt and Retroactive Support Initiative. An Evaluation of the Colorado Arrears Forgiveness Demonstration Project. Jessica Pearson, Ph.D. and Nancy Thoennes, Ph.D. Center for Policy Research 1570 Emerson Street Denver, CO 80218 303-837-1555 Report to the Colorado Department of Human Services, May 2002
http://www.childsupport.state.co.us/home/resourcesIndex.jsp or
http://www.centerforpolicyresearch.org/reports

Understanding Child Support Debt Page 40
Texas Contact: Cynthia Bryant, IV-D Director Office of the Attorney General, Child Support Division PO Box 12017 Austin, TX 78711-2017 512-460-6000
[email protected] Resource: Arrears Analysis IV-D Agency State of Texas March 2002 Dan Hamerstom Office of the Attorney General, Child Support Division PO Box 12017 Austin, TX 78711-2017 512-460-6306
WashingtonContact: Ray Weaver, IV-D Director Division of Child Support Washington State Department of Social and Health Services PO Box 9162 Olympia, WA 98507 360-664-5441
[email protected] Resource: Determining the Composition and Collectibility of Child Support Arrearages Volume 1: The Longitudinal Analysis Carl Formoso, Ph.D. May 2003
http://www.dshs.wa.gov/dcs [use the DCS Reports button on the left] Volume 2: The Case Assessment Jo Peters, Ph.D. June 2003
http://www.dshs.wa.gov/dcs/pdf/caseassessmentfinal.pdf Division of Child Support Washington State Department of Social and Health Services PO Box 9162 Olympia, WA 98507
Report for Grant 90-FD-0027 to the Office of Child Support Enforcement, Administration for Children and Families, U.S. Department of Health and Human Services.


