POLICY RESEARCH CENTER - NCAI
5
1 Climate Change and Global Warming – Overview, Definitions, and Indicators NATIONAL CONGRESS OF AMERICAN INDIANS POLICY RESEARCH CENTER October 2018 Research Policy Update Climate Change: Definitions, Impacts, Data Key Point: Climate Change is a complex situation that has a wide range of impacts that will affect tribes differently by region. Tribes can track their local indicators through several data sources. What is Climate Change? Climate change is the altering of average weather conditions that continues over multiple decades or longer. 1 It includes global temperature changes of the ocean, land, and atmosphere (cooling and warming), shifts in precipitation, increased frequency and intensity of severe weather events, and changes to other features of earth’s climate system (land surface, atmosphere, oceans, and ice). 2 How is Global Warming different from Climate Change? Global warming is the overall upward trend of global temperatures due to the increased levels of greenhouse gasses. 3 As noted above, global warming is only one aspect of climate change. In the last 100 years, the average global surface temperature has increased about 1.4 0 F. 4 What Causes Global Warming? Greenhouse gasses (GHG), such as carbon dioxide (CO2), occur naturally in the environment and play a vital role in the normal carbon cycle. Figure 1a shows how solar radiation from the sun heats the earth. Normal levels of CO2 in the earth’s atmosphere absorb the heat (solar radiation), maintain a livable temperature, and excess heat escapes back into space. Figure 1b shows how the buildup of GHG in earth’s atmosphere absorbs the excess heat and prevents heat that normally leaves earth’s atmosphere from being released back into space. Ultimately, this processes increases the overall heat levels within earth’s atmosphere. 5 The Greenhouse Gas Effect is the buildup of GHG in the earth’s atmosphere that absorb excess amounts of heat and keeps the heat within earth’s atmosphere i.e. a cause of global warming. Normal Atmospheric Conditions Figure 1a Increased Atmospheric Greenhouse Gasses Figure 1b Buildup of GHG Figure 1: Illustration of Normal Atmospheric Conditions compared to Conditions Related to Increased Atmospheric Greenhouse Gasses (GHG)
Transcript of POLICY RESEARCH CENTER - NCAI
1
Climate Change and Global Warming – Overview, Definitions, and Indicators
NATIONAL CONGRESS OF AMERICAN INDIANS
POLICY RESEARCH CENTER
October 2018
Research Policy Update
Climate Change: Definitions, Impacts, Data Key Point:
Climate Change is a complex situation that has a wide range of impacts that will affect tribes differently by region. Tribes can track their local indicators through several data sources.
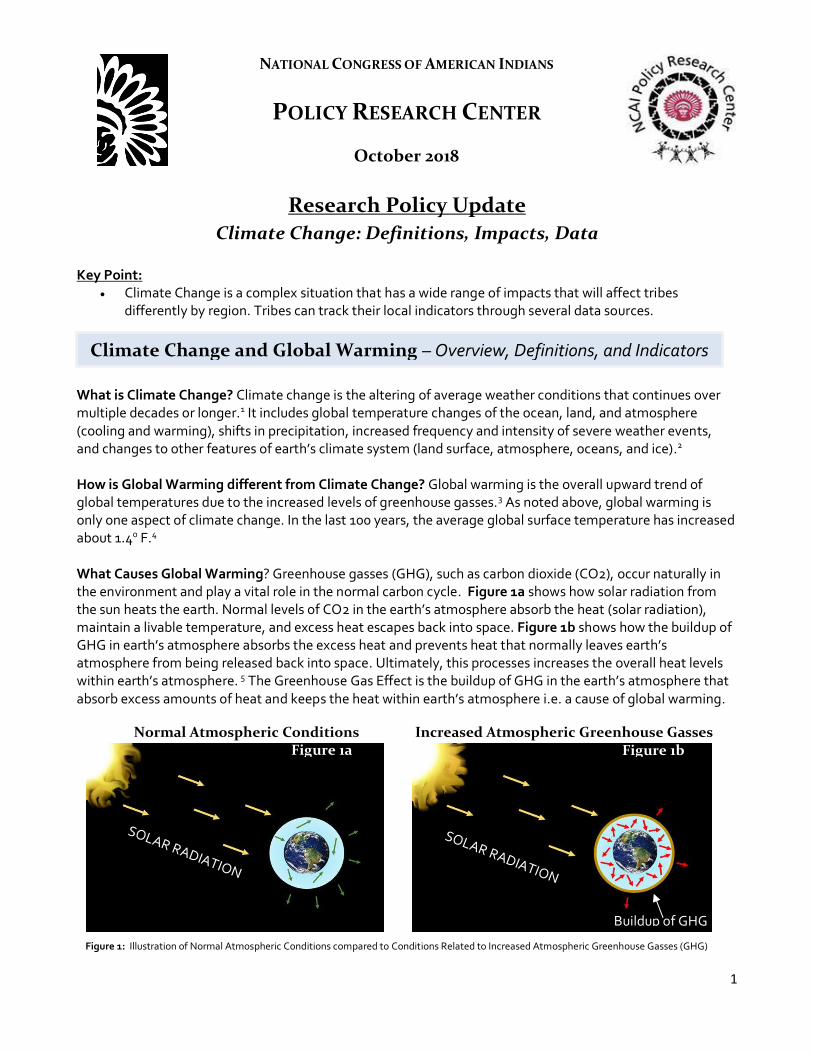
What is Climate Change? Climate change is the altering of average weather conditions that continues over multiple decades or longer.1 It includes global temperature changes of the ocean, land, and atmosphere (cooling and warming), shifts in precipitation, increased frequency and intensity of severe weather events, and changes to other features of earth’s climate system (land surface, atmosphere, oceans, and ice).2 How is Global Warming different from Climate Change? Global warming is the overall upward trend of global temperatures due to the increased levels of greenhouse gasses.3 As noted above, global warming is only one aspect of climate change. In the last 100 years, the average global surface temperature has increased about 1.40 F.4 What Causes Global Warming? Greenhouse gasses (GHG), such as carbon dioxide (CO2), occur naturally in the environment and play a vital role in the normal carbon cycle. Figure 1a shows how solar radiation from the sun heats the earth. Normal levels of CO2 in the earth’s atmosphere absorb the heat (solar radiation), maintain a livable temperature, and excess heat escapes back into space. Figure 1b shows how the buildup of GHG in earth’s atmosphere absorbs the excess heat and prevents heat that normally leaves earth’s atmosphere from being released back into space. Ultimately, this processes increases the overall heat levels within earth’s atmosphere. 5 The Greenhouse Gas Effect is the buildup of GHG in the earth’s atmosphere that absorb excess amounts of heat and keeps the heat within earth’s atmosphere i.e. a cause of global warming.
Normal Atmospheric Conditions Figure 1a
Increased Atmospheric Greenhouse Gasses Figure 1b
Buildup of GHG
Figure 1: Illustration of Normal Atmospheric Conditions compared to Conditions Related to Increased Atmospheric Greenhouse Gasses (GHG)
2
What are the Indicators of Climate Change?
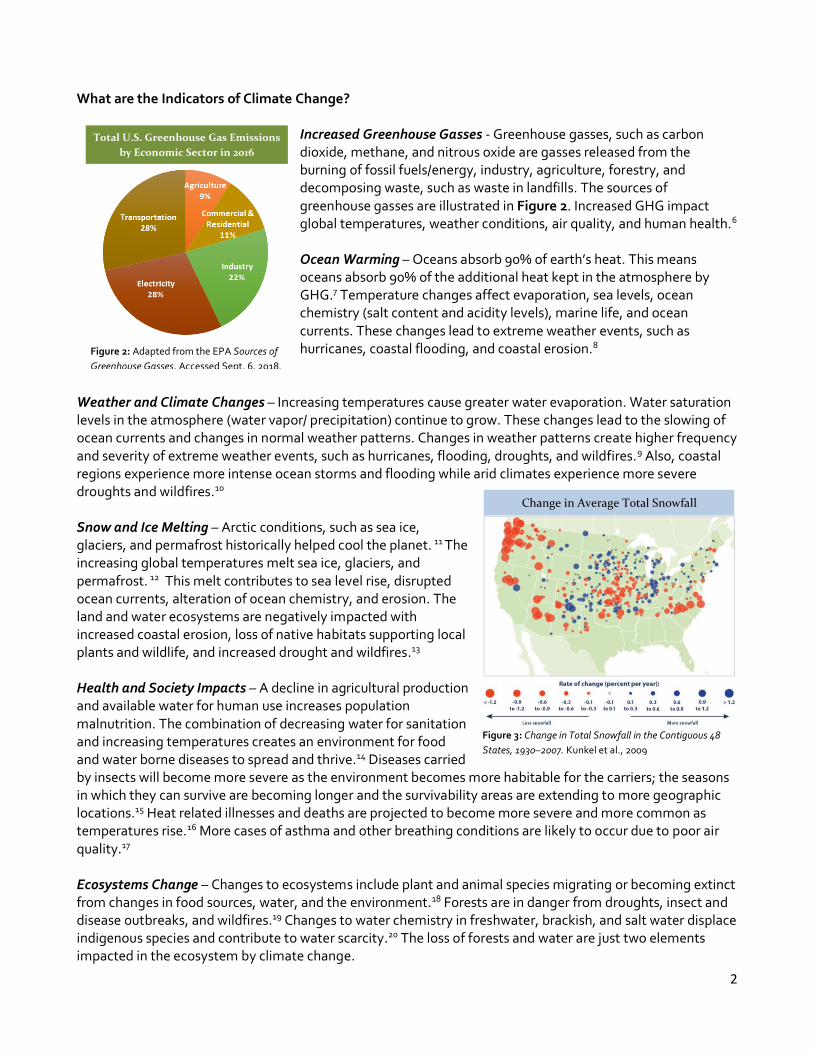
Increased Greenhouse Gasses - Greenhouse gasses, such as carbon dioxide, methane, and nitrous oxide are gasses released from the burning of fossil fuels/energy, industry, agriculture, forestry, and decomposing waste, such as waste in landfills. The sources of greenhouse gasses are illustrated in Figure 2. Increased GHG impact global temperatures, weather conditions, air quality, and human health.6 Ocean Warming – Oceans absorb 90% of earth’s heat. This means oceans absorb 90% of the additional heat kept in the atmosphere by GHG.7 Temperature changes affect evaporation, sea levels, ocean chemistry (salt content and acidity levels), marine life, and ocean currents. These changes lead to extreme weather events, such as hurricanes, coastal flooding, and coastal erosion.8
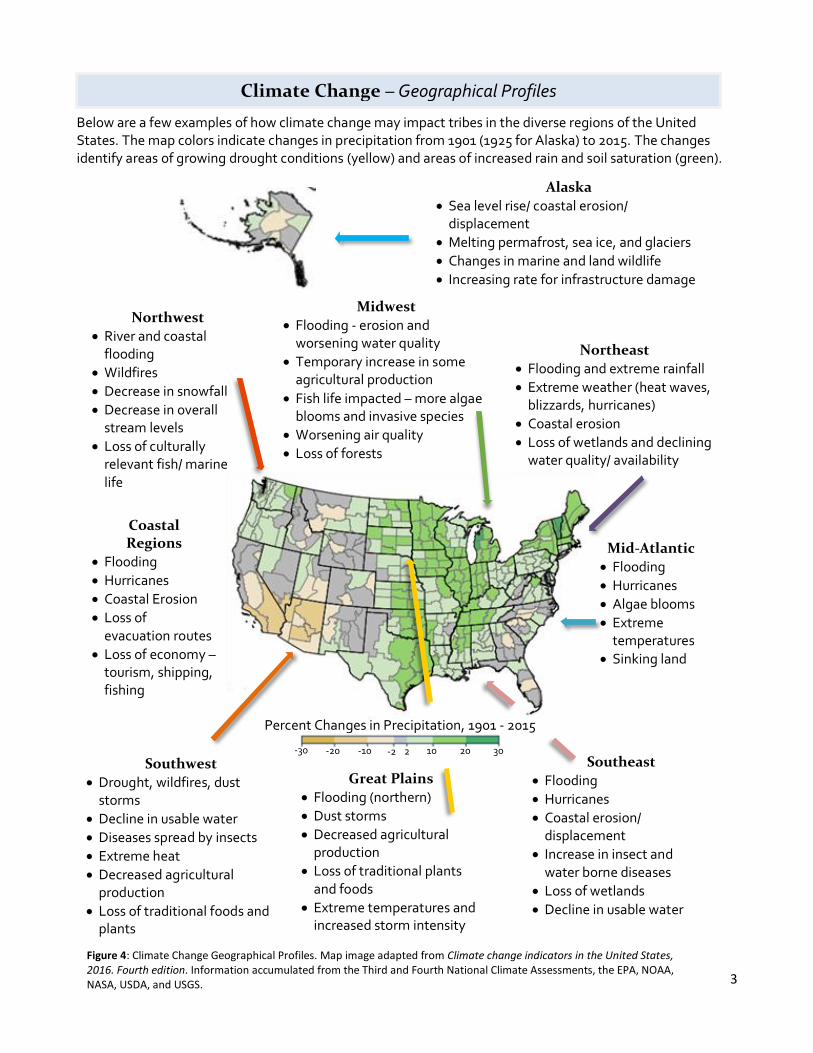
Weather and Climate Changes – Increasing temperatures cause greater water evaporation. Water saturation levels in the atmosphere (water vapor/ precipitation) continue to grow. These changes lead to the slowing of ocean currents and changes in normal weather patterns. Changes in weather patterns create higher frequency and severity of extreme weather events, such as hurricanes, flooding, droughts, and wildfires.9 Also, coastal regions experience more intense ocean storms and flooding while arid climates experience more severe droughts and wildfires.10 Snow and Ice Melting – Arctic conditions, such as sea ice, glaciers, and permafrost historically helped cool the planet. 11 The increasing global temperatures melt sea ice, glaciers, and permafrost. 12 This melt contributes to sea level rise, disrupted ocean currents, alteration of ocean chemistry, and erosion. The land and water ecosystems are negatively impacted with increased coastal erosion, loss of native habitats supporting local plants and wildlife, and increased drought and wildfires.13 Health and Society Impacts – A decline in agricultural production and available water for human use increases population malnutrition. The combination of decreasing water for sanitation and increasing temperatures creates an environment for food and water borne diseases to spread and thrive.14 Diseases carried by insects will become more severe as the environment becomes more habitable for the carriers; the seasons in which they can survive are becoming longer and the survivability areas are extending to more geographic locations.15 Heat related illnesses and deaths are projected to become more severe and more common as temperatures rise.16 More cases of asthma and other breathing conditions are likely to occur due to poor air quality.17 Ecosystems Change – Changes to ecosystems include plant and animal species migrating or becoming extinct from changes in food sources, water, and the environment.18 Forests are in danger from droughts, insect and disease outbreaks, and wildfires.19 Changes to water chemistry in freshwater, brackish, and salt water displace indigenous species and contribute to water scarcity.20 The loss of forests and water are just two elements impacted in the ecosystem by climate change.
Total U.S. Greenhouse Gas Emissions
by Economic Sector in 2016
Figure 2: Adapted from the EPA Sources of
Greenhouse Gasses. Accessed Sept. 6, 2018.
Figure 3: Change in Total Snowfall in the Contiguous 48
States, 1930–2007. Kunkel et al., 2009
Change in Average Total Snowfall
3
Climate Change – Geographical Profiles
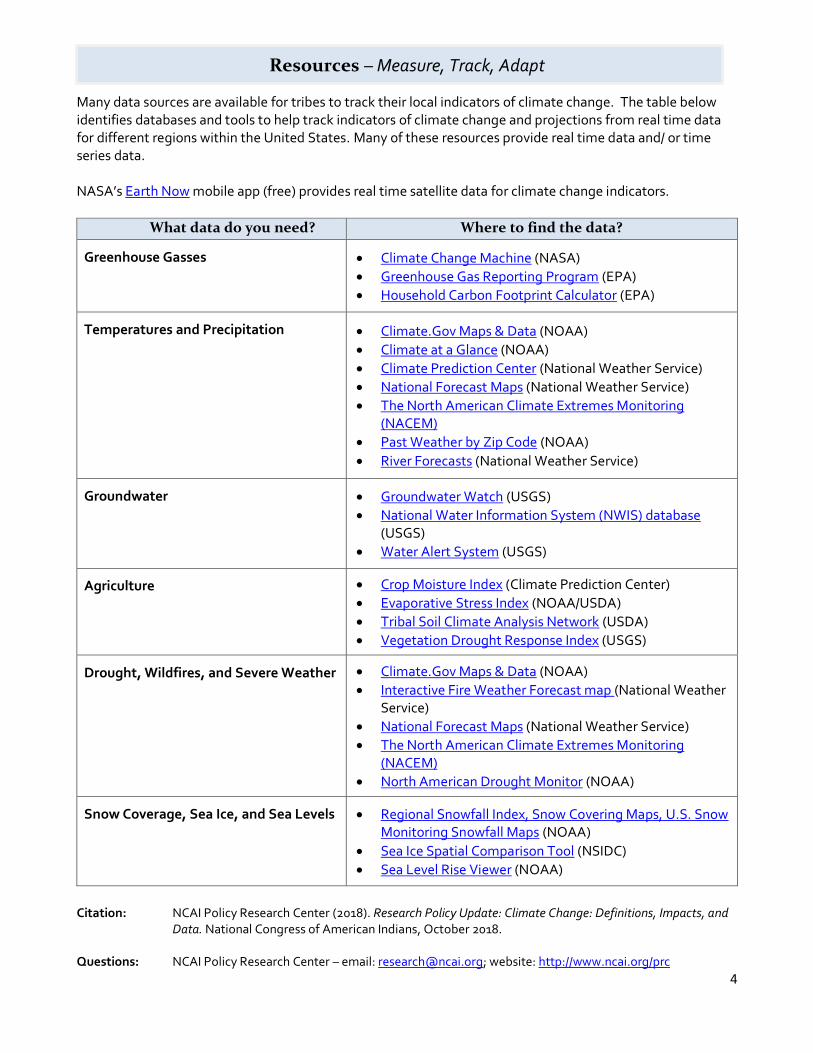
Below are a few examples of how climate change may impact tribes in the diverse regions of the United States. The map colors indicate changes in precipitation from 1901 (1925 for Alaska) to 2015. The changes identify areas of growing drought conditions (yellow) and areas of increased rain and soil saturation (green).
Alaska
Sea level rise/ coastal erosion/ displacement
Melting permafrost, sea ice, and glaciers
Changes in marine and land wildlife
Increasing rate for infrastructure damage
Northwest
River and coastal flooding
Wildfires
Decrease in snowfall
Decrease in overall stream levels
Loss of culturally relevant fish/ marine life
Northeast
Flooding and extreme rainfall
Extreme weather (heat waves, blizzards, hurricanes)
Coastal erosion
Loss of wetlands and declining water quality/ availability
Midwest
Flooding - erosion and worsening water quality
Temporary increase in some agricultural production
Fish life impacted – more algae blooms and invasive species
Worsening air quality
Loss of forests
Southwest
Drought, wildfires, dust storms
Decline in usable water
Diseases spread by insects
Extreme heat
Decreased agricultural production
Loss of traditional foods and plants
Southeast
Flooding
Hurricanes
Coastal erosion/ displacement
Increase in insect and water borne diseases
Loss of wetlands
Decline in usable water
Great Plains
Flooding (northern)
Dust storms
Decreased agricultural production
Loss of traditional plants and foods
Extreme temperatures and increased storm intensity
Mid-Atlantic
Flooding
Hurricanes
Algae blooms
Extreme temperatures
Sinking land
Coastal Regions
Flooding
Hurricanes
Coastal Erosion
Loss of evacuation routes
Loss of economy – tourism, shipping, fishing
Percent Changes in Precipitation, 1901 - 2015
-30 -20 -10 -2 2 10 20 30
Figure 4: Climate Change Geographical Profiles. Map image adapted from Climate change indicators in the United States, 2016. Fourth edition. Information accumulated from the Third and Fourth National Climate Assessments, the EPA, NOAA, NASA, USDA, and USGS.
4
Resources – Measure, Track, Adapt
Many data sources are available for tribes to track their local indicators of climate change. The table below identifies databases and tools to help track indicators of climate change and projections from real time data for different regions within the United States. Many of these resources provide real time data and/ or time series data. NASA’s Earth Now mobile app (free) provides real time satellite data for climate change indicators.
What data do you need? Where to find the data?
Greenhouse Gasses Climate Change Machine (NASA)
Greenhouse Gas Reporting Program (EPA)
Household Carbon Footprint Calculator (EPA)
Temperatures and Precipitation Climate.Gov Maps & Data (NOAA)
Climate at a Glance (NOAA)
Climate Prediction Center (National Weather Service)
National Forecast Maps (National Weather Service)
The North American Climate Extremes Monitoring (NACEM)
Past Weather by Zip Code (NOAA)
River Forecasts (National Weather Service)
Groundwater Groundwater Watch (USGS)
National Water Information System (NWIS) database (USGS)
Water Alert System (USGS)
Agriculture Crop Moisture Index (Climate Prediction Center)
Evaporative Stress Index (NOAA/USDA)
Tribal Soil Climate Analysis Network (USDA)
Vegetation Drought Response Index (USGS)
Drought, Wildfires, and Severe Weather Climate.Gov Maps & Data (NOAA)
Interactive Fire Weather Forecast map (National Weather Service)
National Forecast Maps (National Weather Service)
The North American Climate Extremes Monitoring (NACEM)
North American Drought Monitor (NOAA)
Snow Coverage, Sea Ice, and Sea Levels Regional Snowfall Index, Snow Covering Maps, U.S. Snow Monitoring Snowfall Maps (NOAA)
Sea Ice Spatial Comparison Tool (NSIDC)
Sea Level Rise Viewer (NOAA)
Citation: NCAI Policy Research Center (2018). Research Policy Update: Climate Change: Definitions, Impacts, and
Data. National Congress of American Indians, October 2018. Questions: NCAI Policy Research Center – email: [email protected]; website: http://www.ncai.org/prc
http://www.cpc.ncep.noaa.gov/products/Global_Monsoons/American_Monsoons/NAMS_precip_monitoring.shtml
5
1 GlobalChange.org. https://www.globalchange.gov/climate-change/glossary. 2 Walsh, J., D. Wuebbles, K. Hayhoe, J. Kossin, K. Kunkel, G. Stephens, P. Thorne, R. Vose, M. Wehner, J. Willis, D. Anderson, S. Doney, R. Feely, P. Hennon, V. Kharin, T. Knutson, F. Landerer, T. Lenton, J. Kennedy, and R. Somerville, 2014: Ch. 2: Our Changing Climate. Climate Change Impacts in the United States: The Third National Climate Assessment, J. M. Melillo, Terese (T.C.) Richmond, and G. W. Yohe, Eds., U.S. Global Change Research Program, 19-67. doi:10.7930/J0KW5CXT. 3 What’s in a name? Weather, global warming and climate change, National Aeronautics and Space Administration, Accessed on August 31, 2018 at https://climate.nasa.gov/resources/global-warming/. 4 National Academy of Sciences. 2014. Climate Change: Evidence and Causes. Washington, DC: The National Academies Press. doi.org/10.17226/18730. 5 IPCC, 2014: Climate Change 2014: Synthesis Report. Contribution of Working Groups I, II and III to the Fifth Assessment Report of the Intergovernmental Panel o Climate Change [Core Writing Team, R.K. Pachauri and L.A. Meyer (eds.)]. IPCC, Geneva, Switzerland, 151 pp. in IPCC ARS Synthesis Report website. View at http://ar5-syr.ipcc.ch/. 6 Inglis, G. N., Farnsworth, A., Lunt, D., Foster, G. L., Hollis, C. J., Pagani, M., & Raynham, L. (2015). Descent toward the Icehouse: Eocene sea surface
cooling inferred from GDGT distributions. Paleoceanography and Paleoclimatology, 30(7), 1000-1020. doi.org/10.1002/2014PA002723. 7 Dahlman, LuAnn and Lindsey. Climate Change: Ocean Heat Content. National Oceanic and Atmospheric Administration. Accessed September 10, 2018. https://www.climate.gov/news-features/understanding-climate/climate-change-ocean-heat-content. 8 U.S. Environmental Protection Agency. 2016. Climate change indicators in the United States, 2016. Fourth edition. EPA 430-R-16-004, pg. 31-38. www.epa.gov/climate-indicators. 9 U.S. Environmental Protection Agency. 2016. Climate change indicators in the United States, 2016. Fourth edition. EPA 430-R-16-004, pg. 17-30.
www.epa.gov/climate-indicators. 10 Georgakakos, A., P. Fleming, M. Dettinger, C. Peters-Lidard, Terese (T.C.) Richmond, K. Reckhow, K. White, and D. Yates, 2014: Ch. 3: Water Resources. Climate Change Impacts in the United States: The Third National Climate Assessment, J. M. Melillo, Terese (T.C.) Richmond, and G. W. Yohe, Eds., U.S. Global Change Research Program, 69-112. doi:10.7930/ J0G44N6T. 11 Taylor, P.C., W. Maslowski, J. Perlwitz, and D.J. Wuebbles, 2017: Arctic changes and their effects on Alaska and the rest of the United States. In: Climate Science Special Report: Fourth National Climate Assessment, Volume I [Wuebbles, D.J., D.W. Fahey, K.A. Hibbard, D.J. Dokken, B.C. Stewart, and T.K. Maycock (eds.)]. U.S. Global Change Research Program, Washington, DC, USA, pp. 303-332, doi:10.7930/J00863GK. 12 U.S. Environmental Protection Agency. 2016. Climate change indicators in the United States, 2016. Fourth edition. EPA 430-R-16-004, pg. 40-52. www.epa.gov/climate-indicators. 13 Taylor, P.C., W. Maslowski, J. Perlwitz, and D.J. Wuebbles, 2017: Arctic changes and their effects on Alaska and the rest of the United States. In: Climate Science Special Report: Fourth National Climate Assessment, Volume I [Wuebbles, D.J., D.W. Fahey, K.A. Hibbard, D.J. Dokken, B.C. Stewart, and T.K. Maycock (eds.)]. U.S. Global Change Research Program, Washington, DC, USA, pp. 303-332, doi:10.7930/J00863GK. 14 Hatfield, J., G. Takle, R. Grotjahn, P. Holden, R. C. Izaurralde, T. Mader, E. Marshall, and D. Liverman, 2014: Ch. 6: Agriculture. Climate Change
Impacts in the United States: The Third National Climate Assessment, J. M. Melillo, Terese (T.C.) Richmond, and G. W. Yohe, Eds., U.S. Global Change Research Program, 150-174. doi:10.7930/J02Z13FR. 15 Luber, G., K. Knowlton, J. Balbus, H. Frumkin, M. Hayden, J. Hess, M. McGeehin, N. Sheats, L. Backer, C. B. Beard, K. L. Ebi, E. Maibach, R. S. Ostfeld, C. Wiedinmyer, E. Zielinski-Gutiérrez, and L. Ziska, 2014: Ch. 9: Human Health. Climate Change Impacts in the United States: The Third National Climate Assessment, J. M. Melillo, Terese (T.C.) Richmond, and G. W. Yohe, Eds., U.S. Global Change Research Program, 220-256. doi:10.7930/J0PN93H5. 16 U.S. Environmental Protection Agency, U.S. Centers for Disease Control. 2016. Climate Change and Extreme Heat: What You Can Do to Prepare, EPA 430-R-16-061. https://archive.epa.gov/epa/sites/production/files/2016-10/documents/extreme-heat-guidebook.pdf. 17 D’Amato G, Pawankar R, Vitale C, et al. Climate Change and Air Pollution: Effects on Respiratory Allergy. Allergy, Asthma & Immunology Research. 2016;8(5):391-395. doi:10.4168/aair.2016.8.5.391. 18 Groffman, P. M., P. Kareiva, S. Carter, N. B. Grimm, J. Lawler, M. Mack, V. Matzek, and H. Tallis, 2014: Ch. 8: Ecosystems, Biodiversity, and Ecosystem Services. Climate Change Impacts in the United States: The Third National Climate Assessment, J. M. Melillo, Terese (T.C.) Richmond, and G. W. Yohe, Eds., U.S. Global Change Research Program, 195-219. doi:10.7930/J0TD9V7H. 19 Joyce, L. A., S. W. Running, D. D. Breshears, V. H. Dale, R. W. Malmsheimer, R. N. Sampson, B. Sohngen, and C. W. Woodall, 2014: Ch. 7: Forests. Climate Change Impacts in the United States: The Third National Climate Assessment, J. M. Melillo, Terese (T.C.) Richmond, and G. W. Yohe, Eds., U.S. Global Change Research Program, 175-194. doi:10.7930/J0Z60KZC. 20 National Academies of Sciences, Engineering, and Medicine. 2018. U.S.-Iran Discussion on Environmental Trends: Proceedings of a Workshop–in Brief. Washington, DC: The National Academies Press. doi.org/10.17226/25155. Figure 3: Kunkel, K.E., M. Palecki, L. Ensor, K.G. Hubbard, D. Robinson, K. Redmond, and D. Easterling. 2009. Trends in twentieth-century U.S. snowfall using a quality-controlled dataset. J. Atmos. Ocean. Tech. 26:33–44. Accessed from the EPA Climate Change Indicators: Snowfall, September 11, 2018. https://www.epa.gov/climate-indicators/climate-change-indicators-snowfall.
References