POLICY REFORMS FOR SMALLHOLDER AGRICULTURE: AN …
265
POLICY REFORMS FOR SMALLHOLDER AGRICULTURE: AN ANALYSIS USING HOUSEHOLD DATA FOR VIETNAM by Huy Quynh Nguyen A thesis submitted for the degree of Doctor of Philosophy of the Australian National University. CRAWFORD SCHOOL OF PUBLIC POLICY ANU COLLEGE OF ASIA AND THE PACIFIC THE AUSTRALIAN NATIONAL UNIVERSITY CANBERRA, JANUARY 2016 © Copyright by Huy Quynh Nguyen (2016) All Rights Reserved
Transcript of POLICY REFORMS FOR SMALLHOLDER AGRICULTURE: AN …

POLICY REFORMS FOR SMALLHOLDER AGRICULTURE:
AN ANALYSIS USING HOUSEHOLD DATA FOR VIETNAM
by
Huy Quynh Nguyen
A thesis submitted for the degree of Doctor of Philosophy
of the Australian National University.
CRAWFORD SCHOOL OF PUBLIC POLICY
ANU COLLEGE OF ASIA AND THE PACIFIC
THE AUSTRALIAN NATIONAL UNIVERSITY
CANBERRA, JANUARY 2016
© Copyright by Huy Quynh Nguyen (2016)
All Rights Reserved

ii
Declaration
I, Huy Quynh NGUYEN, declare that this thesis, submitted in fulfilment
of the requirements for the award of Doctor of Philosophy, in the Arndt-
Corden Department of Economics, Crawford School of Public Policy,
College of Asia and the Pacific, The Australian National University, is
wholly my own work unless otherwise referenced or acknowledged. This
thesis has not been submitted for qualifications at any other academic
institution.
Huy Quynh Nguyen
January 2016

iii
Acknowledgements
I would like to express my special thanks to the chairperson of my supervisory panel,
Professor Peter Warr for his huge support, advice, helpful discussion and
encouragement throughout the course of this study. I am indebted to him for his own
valuable time and effort to support me. I would also like to thank Dr. Robert Sparrow,
my secondary supervisor for his excellent help in suggesting useful ideas and revising
the mathematical and econometrics content in this thesis.
I am also grateful to other members of the academic staff, friends and my fellow PhD
scholars for their valuable comments on my PhD economic seminars at the Australian
National University. I would also like to acknowledge helpful comments from
participants at the Asia Conference on Economic and Business Research, Singapore,
2014, and the 89th Annual Conference of Agricultural Economic Society at University
of Warwick, United Kingdom in 2015.
I would like to thank Dr. Megan Poore for her helpful comments about academic
writing skills. I would also like to express my special thanks to Cris Carey, a
professional editor, for helping me in editing this thesis.
This thesis was undertaken with the financial support of an Ausaid scholarship. I am
grateful to this generous support. Thanks to Billie Headon, Ngan Le, Heeok Kyung,
and other professional staffs at Arndt-Corden Department of Economics, Crawford
School of Public Policy for their administrative support. I would like to thank the
National Academy of Public Administration of Vietnam where I am working for
supporting me to study in Australia.
Finally, I would like to thank my parents and friends for their support and
encouragement. Most of all, I am grateful and indebted to my wife, Le Lan Phuong,
my two sons, Nguyen Le Minh and Nguyen Le Quang. Without their support,
understanding, patience, tolerance and love during the last four years, this thesis would
not be completed. I dedicate this work to my family.
iv
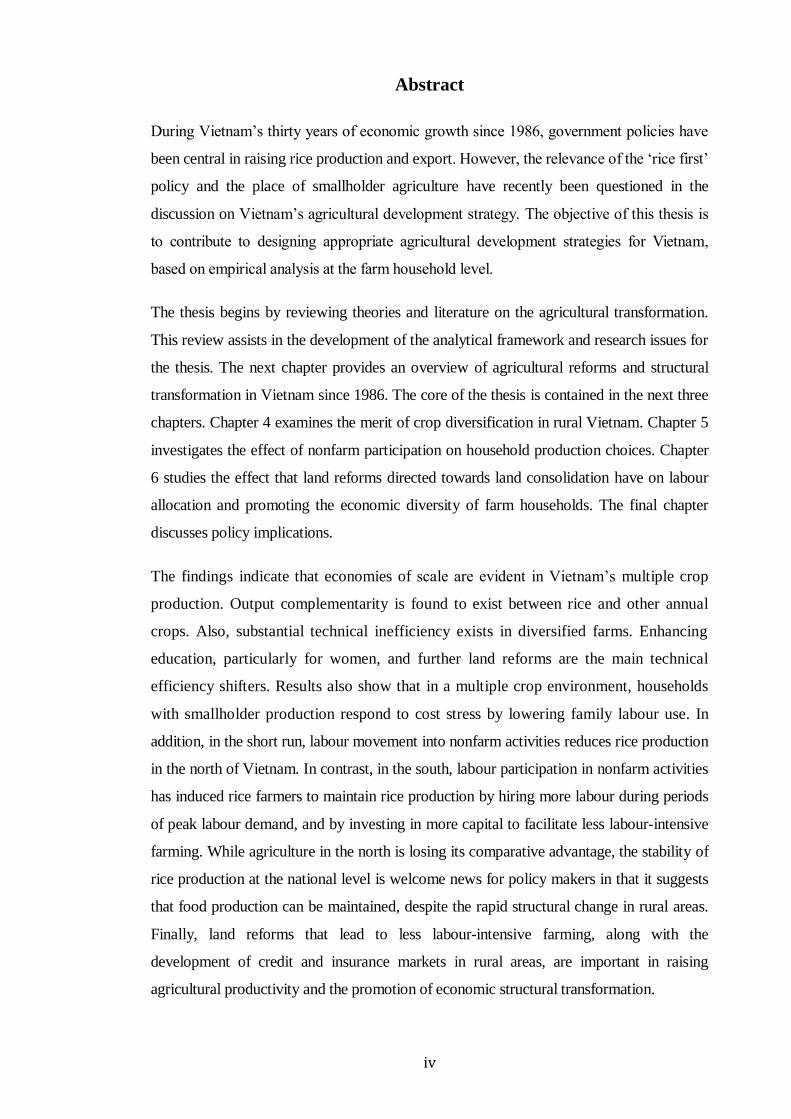
Abstract
During Vietnam’s thirty years of economic growth since 1986, government policies have
been central in raising rice production and export. However, the relevance of the ‘rice first’
policy and the place of smallholder agriculture have recently been questioned in the
discussion on Vietnam’s agricultural development strategy. The objective of this thesis is
to contribute to designing appropriate agricultural development strategies for Vietnam,
based on empirical analysis at the farm household level.
The thesis begins by reviewing theories and literature on the agricultural transformation.
This review assists in the development of the analytical framework and research issues for
the thesis. The next chapter provides an overview of agricultural reforms and structural
transformation in Vietnam since 1986. The core of the thesis is contained in the next three
chapters. Chapter 4 examines the merit of crop diversification in rural Vietnam. Chapter 5
investigates the effect of nonfarm participation on household production choices. Chapter
6 studies the effect that land reforms directed towards land consolidation have on labour
allocation and promoting the economic diversity of farm households. The final chapter
discusses policy implications.
The findings indicate that economies of scale are evident in Vietnam’s multiple crop
production. Output complementarity is found to exist between rice and other annual
crops. Also, substantial technical inefficiency exists in diversified farms. Enhancing
education, particularly for women, and further land reforms are the main technical
efficiency shifters. Results also show that in a multiple crop environment, households
with smallholder production respond to cost stress by lowering family labour use. In
addition, in the short run, labour movement into nonfarm activities reduces rice production
in the north of Vietnam. In contrast, in the south, labour participation in nonfarm activities
has induced rice farmers to maintain rice production by hiring more labour during periods
of peak labour demand, and by investing in more capital to facilitate less labour-intensive
farming. While agriculture in the north is losing its comparative advantage, the stability of
rice production at the national level is welcome news for policy makers in that it suggests
that food production can be maintained, despite the rapid structural change in rural areas.
Finally, land reforms that lead to less labour-intensive farming, along with the
development of credit and insurance markets in rural areas, are important in raising
agricultural productivity and the promotion of economic structural transformation.

v
In general, in light of increasing rural wages and structural change, Vietnam’s
agricultural transformation replicates the early East Asian experience, characterised by
the dominance of smallholder agriculture. There has so far been no definitive policy
resolution of the optimal structure of Vietnam’s smallholder agriculture. The balance
between efficiency and equity, between lowering production costs and raising prices,
is a challenge for policy makers. The findings suggest policies for maintaining the
comparative advantage of agriculture. The government should relax the ‘rice first’
policy to improve household welfare. In addition, land reforms responding to less
labour-intensive farming, and the development of the nonfarm economy, should play a
central role in restructuring smallholder agriculture.

vi
List of Abbreviations and Acronyms
ADB Asian Development Bank
AHM Agricultural Household Model
CPI Consumer Price Index
DHM Double Hurdle Model
FAO Food and Agriculture Organization of the United Nations
FD First Difference
FE Fixed Effect Estimation
GSO General Statistic Office of Vietnam
IFPRI International Food Policy Research Institute
LDCs Less Developed Countries
MARD Ministry of Agriculture and Rural Development
MES Morishima Elasticity of Substitution
MOLISA Ministry of Labour – Invalids and Social Affairs
MPL Marginal Product of Labour
NELM New Economics of Labour Migration
OLS Ordinary Least Squares Estimation
RE Random Effect Estimation
SOE State-Owned Enterprise
SPF Stochastic Production Frontier
2SLS Two State Least Squares
TE Technical Efficiency
UNDP United Nations Development Program
VHLSS Vietnam Household Living Standards Survey
VLSS Vietnam Living Standards Survey
VND Vietnamese Dong (Vietnamese currency)
WB World Bank
vii
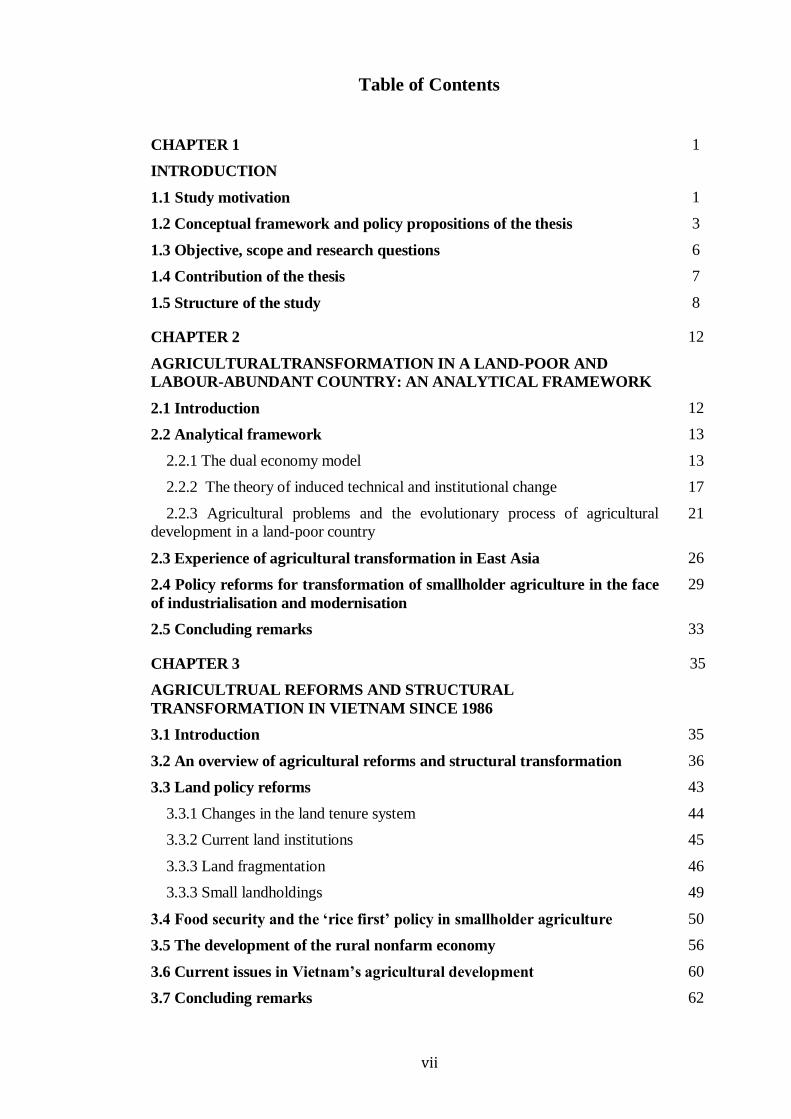
Table of Contents
CHAPTER 1
INTRODUCTION
1
1.1 Study motivation 1
1.2 Conceptual framework and policy propositions of the thesis 3
1.3 Objective, scope and research questions 6
1.4 Contribution of the thesis 7
1.5 Structure of the study 8
CHAPTER 2
AGRICULTURALTRANSFORMATION IN A LAND-POOR AND
LABOUR-ABUNDANT COUNTRY: AN ANALYTICAL FRAMEWORK
12
2.1 Introduction 12
2.2 Analytical framework 13
2.2.1 The dual economy model 13
2.2.2 The theory of induced technical and institutional change 17
2.2.3 Agricultural problems and the evolutionary process of agricultural
development in a land-poor country
21
2.3 Experience of agricultural transformation in East Asia 26
2.4 Policy reforms for transformation of smallholder agriculture in the face
of industrialisation and modernisation
29
2.5 Concluding remarks 33
CHAPTER 3
AGRICULTRUAL REFORMS AND STRUCTURAL
TRANSFORMATION IN VIETNAM SINCE 1986
35
3.1 Introduction 35
3.2 An overview of agricultural reforms and structural transformation 36
3.3 Land policy reforms 43
3.3.1 Changes in the land tenure system 44
3.3.2 Current land institutions 45
3.3.3 Land fragmentation 46
3.3.3 Small landholdings 49
3.4 Food security and the ‘rice first’ policy in smallholder agriculture 50
3.5 The development of the rural nonfarm economy 56
3.6 Current issues in Vietnam’s agricultural development 60
3.7 Concluding remarks 62

viii
CHAPTER 4
CROP DIVERSIFICATION AND ECONOMIC PERFORMANCE
OF DIVERSIFIED FARMS
64
4.1 Introduction 64
4.2 Literature review 67
4.2.1 Economies of diversification in agricultural production 68
4.2.2 Input distance function and its application in the literature 70
4.3 Research method 72
4.3.1 Theoretical framework 72
4.3.2 Functional form 75
4.4 Empirical implementation 77
4.4.1 The econometric specification 77
4.4.2 Identification 79
4.4.3 The performance measures 80
4.4.4 Data 85
4.5 Empirical results 88
4.5.1 Crop diversification from the survey sample 88
4.5.2 Tests of hypotheses for model selection 91
4.5.3 Measures of economic performance 93
4.5.4 Elasticity of substitution and complementarity 96
4.5.5 Technical efficiency 100
4.6 Concluding remarks 102
Appendices of Chapter 4 105
CHAPTER 5
IMPACTS OF NONFARM PARTICIPATION ON HOUSEHOLD
PRODUCTION CHOICES IN SMALLHOLDER AGRICULTURE
113
5.1 Introduction 113
5.2 Literature review 116
5.2.1 Definition 116
5.2.2 Literature on the effect of nonfarm participation on agricultural
production
116
5.2.3 Literature on the determinants of rural nonfarm employment and
incomes
120
5.3 Research methodology 121
5.3.1 Theoretical model 121
5.3.2 Empirical model 124
ix
5.3.3 Identification 125
5.4 Survey sample data and trends of agricultural production and nonfarm
activities
130
5.4.1 Data and variables 130
5.4.2 Agricultural production from survey samples 133
5.4.3 Trends of nonfarm activities and income diversification in Vietnam from
survey samples
136
5.5 Empirical results 144
5.5.1 Results of first-stage regression 144
5.5.2 The effect of participation in nonfarm activities on rice production 145
5.5.3 The effect of nonfarm activities on agricultural revenue 147
5.5.4 The effect of nonfarm participation on agricultural inputs 151
5.5.5 The effect of nonfarm activities on rural household welfare 154
5.5.6 Further test of the consistency of empirical results using the matching
technique
155
5.6 Conclusions 157
Appendices of Chapter 5 161
CHAPTER 6
THE IMPACT OF LAND FRAGMENTATION ON LABOUR
ALLOCATION AND ECONOMIC DIVERSITY OF FARM
HOUSEHOLDS
170
6.1 Introduction 170
6.2 Literature review 173
6.2.1 Agricultural growth, household labour allocation and structural
transformation
173
6.2.2 The role of the reduction of land fragmentation in fostering structural
transformation, agricultural productivity, and nonfarm development
175
6.3 Methodology 177
6.3.1 Theoretical framework 177
6.3.1.1 Theoretical research on the impact of agricultural technical change
on labour allocation of farm households
177
6.3.1.2 Model framework for the impact of land fragmentation on the labour
allocation and economic diversification
183
6.3.2 Empirical models 185
6.4 Controlling the bias in econometric models 187
6.4.1 Controlling for unobserved heterogeneity 187
6.4.2 Controlling for unobserved shocks 187
6.4.3 Controlling for the sample selection bias to examine the effect of land
fragmentation on nonfarm outcomes
189

x
6.5 Functional forms 190
6.5.1 The effect of land fragmentation on nonfarm outcomes: nonfarm labour
supply and nonfarm profits
190
6.5.2 The effect of land fragmentation on farm outcomes: productivity, labour
supply, profits, and the number of individuals in farming activities
191
6.6 Data 192
6.6.1 Measurement of land fragmentation 194
6.6.2 Evidence of land fragmentation from survey samples 194
6.7 Empirical results 196
6.7.1 Nonfarm outcomes: nonfarm labour supply and nonfarm profits 197
6.7.2 Farm outcomes: productivity, labour supply and farm profits 200
6.7.3 Robustness to controlling for market wages 202
6.8. Concluding remarks 204
Appendices of Chapter 6 207
CHAPTER 7
CONSLUSIONS AND POLICY IMPLICATIONS
220
7.1 Main findings 220
7.2 Policy implications 225
7.2.1 Crop diversification strategy 225
7.2.2 The development of the nonfarm economy 226
7.2.3 Land reforms directed toward land consolidation 227
7.2.4 Input supporting policy 227
7.3 Directions for future research 228
BIBLIOGRAPHY 230

xi
List of Tables
Page
Table 3.1: Major changes in agricultural policies, 1986-2013 38
Table 3.2: Land fragmentation in Vietnam, 2010 47
Table 3.3: The structure of households by scale of use of land for paddy farming,
2006 and 2011
49
Table 3.4: Farm household’s monthly income per capita from different sources,
Mekong River Delta, 2009 (1000 VND)
54
Table 3.5: Land use patterns in the Mekong River Delta, 1980-2008 (1000 ha) 55
Table 3.6: The growth of rural wages in Vietnam, 2005-2012 59
Table 4.1: Definitions, units of measurement and summary statistics for all variables
in the empirical analysis
88
Table 4.2: Tests of hypotheses 91
Table 4.3: Monotonicity condition check 92
Table 4.4: Elasticities of input distance function at sample means (first order
components)
94
Table 4.5: Mean of output cross, and own indirect elasticity of shadow prices with
respect to inputs (εij), Vietnam
97
Table 4.6: The indirect Morishima elasticity of substitution 99
Table 4.7: Technical efficiency in annual crop production in Vietnam, VHLSS 2006 101
Table 4.8: Technical inefficiency model 102
Table 5.1: Characteristics of agricultural production measures, 2004 and 2006,
Vietnam
134
Table 5.2: Changes in farm outputs and inputs between 2004 and 2006, rural Vietnam 135
Table 5.3: Percentage of rural individuals in nonfarm activities 137
Table 5.4: Human capital statistics for household members between sectors, Vietnam,
2004 and 2006
139
Table 5.5: Sources of income in rural Vietnam by farm sizes, 2004-2006 142
Table 5.6: Sources of incomes in rural Vietnam, by quintile of per capital
expenditure, 2004-2006
143

xii
Table 5.7: Results of first stage regression (2SLS) 145
Table 5.8: The effects of nonfarm participation on rice output in rural Vietnam, 2004-
2006
146
Table 5.9: The effects of nonfarm participation on agricultural and non-rice agricultural
revenue in rural Vietnam, 2004 and 2006
150
Table 5.10: The effects of changes in number of individuals participating in nonfarm
activities on agricultural inputs in rural Vietnam, 2004 and 2006
152
Table 5.11: Changes in the share of hours working in nonfarm activities on
agricultural inputs, rural Vietnam, 2004 and 2006
153
Table 5.12: The effects of nonfarm participation on household welfare in rural
Vietnam, 2004 and 2006
154
Table 5.13: The effects of nonfarm participation on rice production, farm income and
household expenditure using matching method, 2004 and 2006
156
Table 5.14: The effects of nonfarm participation on agricultural inputs using
matching method, 2004 and 2006
157
Table 6.1: Summary statistics of variables in the model 193
Table 6.2: Land fragmentation in Vietnam, 2004-2006 195
Table 6.3: The Spearman correlation coefficient between land fragmentation and
farm sizes
196
Table 6.4: The effect of land fragmentation on nonfarm outcomes without selection
correction using double hurdle model and first difference
198
Table 6.5: The effect of land fragmentation on nonfarm outcomes with selection
correction using the approach of Wooldridge (1995)
199
Table 6.6: The effect of land fragmentation on farm outcomes using first difference 201
Table 6.7: Determinants of farm and nonfarm labour supply using first difference
method and controlling hour wages
203
Table 7.1: Summary of research questions and main findings in Chapter 4, 5 and 6 222
xiii
List of Figures
Page
Figure 1.1: Conceptual framework showing agricultural transformation in the process
of industrialization and the central role of technical changes and institutional
innovations
4
Figure 2.1: Labour allocation in the Fei-Ranis model 15
Figure 2.2: The Hayami-Ruttan model of induced technical change in agriculture 18
Figure 2.3: The agricultural problems and agricultural transformation in Asian land-
poor countries at different stages of economic development
23
Figure 2.4: Illustration of optimum farm size in low-wage economies 24
Figure 2.5: Illustration of optimum farm size in high-wage economies 25
Figure 2.6: Policy phases in supporting agricultural transformation 30
Figure 2.7: Challenges and policy framework for smallholder agriculture in Asia 31
Figure 3.1: Growth rate in GDP and the main sectors, 1986-2007 (per cent per year) 40
Figure 3.2: Shares of GDP by sectors, Vietnam, 1986-2007 (per cent) 42
Figure 3.3: Shares of employment by sectors, Vietnam, 1986-2007 (per cent) 42
Figure 3.4: Employment trends in some Asian countries 43
Figure 3.5: The growth rate of rice output in Vietnam, 1986-2014 (per cent) 51
Figure 3.6: Margin proportion earned by rice farmers in the Mekong River Delta (per
cent)
52
Figure 3.7: Rice production costs in the Mekong River Delta (1000 VND per hectare) 53
Figure 3.8: Vietnam’s employment shift from agriculture to non-agriculture 57
Figure 3.9: Employment structure: rural population aged 15 years old and over in the
main job, by economic sectors (per cent)
58
Figure 3.10: Structure of monthly income per capita in rural Vietnam (per cent) 59
Figure 4.1: Input distance function, overutilization of X1, reproduced from Grosskopf
et al. (1995, p. 280)
74
Figure 4.2: Annual crop diversification index by regions 89
Figure 4.3: Land use patterns of rice growing households from surveyed sample 90
Figure 4.4: Distribution of technical efficiency indices 100
xiv
Figure 5.1: Trends of part-time farming in rural areas 138
Figure 5.2: The structure of two groups of households by regions from the VHLSS
2004-2006
140
Figure 5.3: Differences in rice production of a farm household, North and South
Vietnam
141
Figure 5.4: The density function of real per capita expenditure of two groups of
households
143

xv
List of Appendices
Page
Appendix 4.1: First derivative and second derivative of the input distance function 105
Appendix 4.2: Investigating the possibility of simultaneous equation bias in the
estimation of the distance function
106
Appendix 4.3: Parameter estimates of the stochastic input distance function including
inefficiency effects
110
Appendix 5.1: Rural household characteristics by farm and nonfarm involvement status
in Vietnam, 2004 and 2006
161
Appendix 5.2: Summary statistics from panel sample 162
Appendix 5.3: First stage regression 163
Appendix 5.4: Effect of changes in nonfarm individuals on agricultural production
using OLS estimates in rural Vietnam
164
Appendix 5.5: Effect of changes in nonfarm individuals on agricultural production
using OLS estimates, northern Vietnam
165
Appendix 5.6: Effect of changes in nonfarm individuals on agricultural production
using OLS estimates, southern Vietnam
166
Appendix 5.7: Effect of changes in nonfarm individuals on agricultural production
using 2SLS estimates, rural Vietnam
167
Appendix 5.8: Effect of changes in nonfarm individuals on agricultural production
using 2SLS estimates, northern Vietnam
168
Appendix 5.9: Effect of changes in nonfarm individuals on agricultural production
using 2SLS estimates, southern Vietnam
169
Appendix 6.1: Mathematical proof of theoretical research in section 6.3.1 207
Appendix 6.2: Average farm size for agricultural household (ha) 208
Appendix 6.3: The effects of land fragmentation on farm outcomes using the first
difference method-log of plots
209
Appendix 6.4: The effects of land fragmentation on farm outcomes using the first
difference method-the Simpson index
210
Appendix 6.5: The effects of land fragmentation on nonfarm outcomes without
selection correction using first difference method-the Simpson index
211

xvi
Appendix 6.6: The effects of land fragmentation on nonfarm outcomes without
selection correction using first difference-log of plots
212
Appendix 6.7: The effects of land fragmentation on nonfarm outcomes using double
hurdle model
213
Appendix 6.8: The effect of land fragmentation on nonfarm outcomes using
Wooldridge (1995)
216
Appendix 6.9: Factors influencing the land fragmentation of a farm household using
first difference
218
Appendix 6.10: Testing the endogeneity of land fragmentation using the control
function
219

1
Chapter 1
Introduction
1.1 Study motivation
Vietnam started its economic reforms in 1986, and has subsequently transformed itself
from a poor to a middle-income country (World Bank 2011a). Economic growth has
brought about great achievements in poverty reduction and rising incomes. According
to the World Bank (2011a), Vietnam’s GDP per capita was USD 1,543 in 2011,
compared with USD 437.1 in 1986. The proportion of people living below the poverty
line fell from 58 per cent in 1993 to 14 per cent in 2011. In addition, prolonged
economic growth has also enabled Vietnam to improve social welfare and the living
standards of most households (World Bank 2007 and 2011a).
Many factors have contributed to Vietnam’s economic success, including agricultural
reforms. In the late 1980s, Vietnam’s agricultural collective system was at a crossroads in
the setting of stagnant agricultural production, and the successes in agricultural production
promoted by the household responsibility system adopted in China in 1979. Consequently,
the Vietnamese government decided to decollectivize the agricultural system under
Resolution 10 in 1988, and allocated land to farm households, which contributed greatly to
raising both food production and rural households’ welfare (Minot and Goletti 1998;
Benjamin and Brandt 2004; Dang et al. 2006). As a result, from a country with a food
shortage in the late 1980s, Vietnam has become one of world’s leading rice exporters
(Fforde and Seneque 1995, p.108; Glewwe et al. 2004; World Bank 2012). During the
thirty years of economic growth, government policies have been central in improving rice
production to meet increasing domestic demand, while at the same time expanding
Vietnam’s rice exports. However, Vietnam’s agricultural sector is again at a crossroads in
the new setting of the development of the nonfarm economy, along with rising wages in
both urban and rural areas, and the dynamic evolution of the food system.
With continued economic growth, the proportion of agriculture in Vietnam’s GDP has
fallen rapidly since 1986. The agricultural growth rate has slowed since 1999, and the
absolute number of total employment in agriculture has started to decrease (Dang et al.
2006). The rising trends of abandoning paddy fields and crop switching have concerned
2
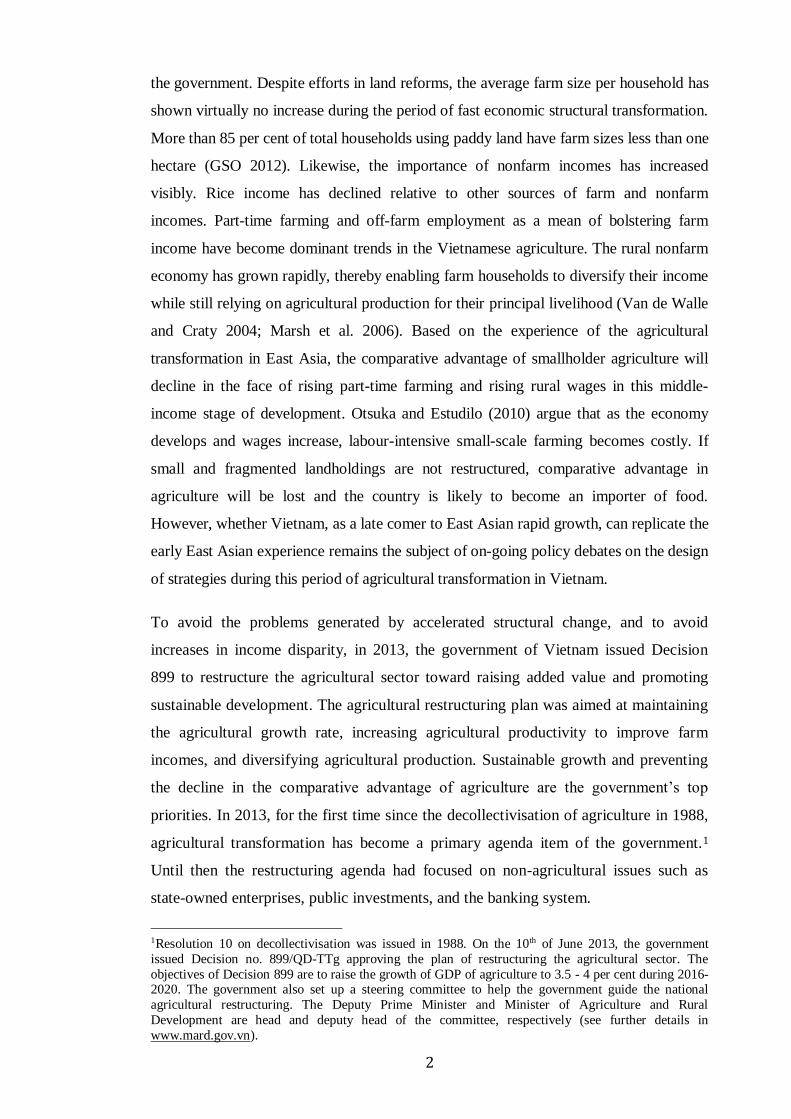
the government. Despite efforts in land reforms, the average farm size per household has
shown virtually no increase during the period of fast economic structural transformation.
More than 85 per cent of total households using paddy land have farm sizes less than one
hectare (GSO 2012). Likewise, the importance of nonfarm incomes has increased
visibly. Rice income has declined relative to other sources of farm and nonfarm
incomes. Part-time farming and off-farm employment as a mean of bolstering farm
income have become dominant trends in the Vietnamese agriculture. The rural nonfarm
economy has grown rapidly, thereby enabling farm households to diversify their income
while still relying on agricultural production for their principal livelihood (Van de Walle
and Craty 2004; Marsh et al. 2006). Based on the experience of the agricultural
transformation in East Asia, the comparative advantage of smallholder agriculture will
decline in the face of rising part-time farming and rising rural wages in this middle-
income stage of development. Otsuka and Estudilo (2010) argue that as the economy
develops and wages increase, labour-intensive small-scale farming becomes costly. If
small and fragmented landholdings are not restructured, comparative advantage in
agriculture will be lost and the country is likely to become an importer of food.
However, whether Vietnam, as a late comer to East Asian rapid growth, can replicate the
early East Asian experience remains the subject of on-going policy debates on the design
of strategies during this period of agricultural transformation in Vietnam.
To avoid the problems generated by accelerated structural change, and to avoid
increases in income disparity, in 2013, the government of Vietnam issued Decision
899 to restructure the agricultural sector toward raising added value and promoting
sustainable development. The agricultural restructuring plan was aimed at maintaining
the agricultural growth rate, increasing agricultural productivity to improve farm
incomes, and diversifying agricultural production. Sustainable growth and preventing
the decline in the comparative advantage of agriculture are the government’s top
priorities. In 2013, for the first time since the decollectivisation of agriculture in 1988,
agricultural transformation has become a primary agenda item of the government.1
Until then the restructuring agenda had focused on non-agricultural issues such as
state-owned enterprises, public investments, and the banking system.
1Resolution 10 on decollectivisation was issued in 1988. On the 10th of June 2013, the government
issued Decision no. 899/QD-TTg approving the plan of restructuring the agricultural sector. The
objectives of Decision 899 are to raise the growth of GDP of agriculture to 3.5 - 4 per cent during 2016-2020. The government also set up a steering committee to help the government guide the national
agricultural restructuring. The Deputy Prime Minister and Minister of Agriculture and Rural
Development are head and deputy head of the committee, respectively (see further details in
www.mard.gov.vn).

3
However, in order to restructure the agricultural sector successfully, the government must
learn what works for small farmers, and understand how small farmers make decisions in
new settings. Timmer (2013) argues that the future of food security in Asia depends on the
performance of small farmers. Similarly, Otsuka (2015) claims that the big question for
the future of small farms in Asia, particularly in land-poor countries like Vietnam, is about
the role of land reforms. Taylor and Lybbert (2015) argue that the biggest difference
between agriculture and most other sectors is that agricultural production decisions are
almost always made within economic units that also function as households. As a result,
responding to the changing needs of small farm households is a major challenge that needs
to be addressed by the government (Hazell et al. 2010). Hazell and Rahman (2014)
conclude that the survival of small farms in the transformation process depends on how
they adapt to their changing economic environment. The authors argue that the key
adjustments are the diversification into higher-value products, expansion of nonfarm
sources of income employment, and land reforms. Moreover, policies are needed to raise
agricultural productivity, which is the most effective way to deal with food insecurity
(Warr 2014). Thus, new challenges require an analytical and empirical understanding of
what is happening to agricultural transformation at the household level, to support the
design of effective policies.
1.2. Conceptual framework and policy propositions of the thesis
The voluminous literature on agricultural transformation under new settings reflects the
complexity of the subject, and shows the difficulty in combining theoretical concepts
and empirical studies at the micro level. Research has examined the agricultural
transformation along three broad dimensions. 2 The first dimension is the dynamic
evolution of the food system in light of the growth and production of high-value
commodities, more diverse diets and the sustainable intensification in agricultural
production. The second dimension concerns the impact of the nonfarm economy and
part-time farming on household production choices. The final one is the role of
technological changes and institutional innovation, particularly land institutions, in
maintaining the comparative advantage of agriculture in land-poor countries.
As illustrated in Figure 1.1, the increase in incomes has led to a shift in food
consumption from grains and other staple crops to high-value products such as fruits,
vegetables, and livestock. Until recently, policies mainly focused on a single commodity
2The literature on each of these dimensions is reviewed in Chapters 4, 5, and 6 of the thesis.

4
because the Vietnamese government chose to link the strategy of food self-sufficiency
almost exclusively to rice (McPherson 2012; Tran et al. 2013). However, the role of rice
is changing in Asia (Timmer 2014). Economic growth and structural transformation
have resulted in the dynamic evolution of the food system into higher-value
commodities. Moreover, this dynamic evolution has been induced by the consumption
and production linkages arising from technological changes and institutional innovations
(Hayami and Ruttan 1985; Haggblade et al. 2007). This relationship is expressed by the
broken line in Figure 1.1. New policies are required to further the diversification of
production and promote agricultural productivity growth. Therefore, it seems reasonable
to postulate the following policy proposition:
Proposition 1: Economic growth and increasing incomes result in changes in food
systems. With the growth of consumption and production of high value
commodities, diversion of resources from the staple cereal sector to commodities
with higher income elasticities becomes important in maintaining incentives for
the use of resources in agricultural production. Thus, new patterns of product
combination and resource use have to be developed, instead of intensive mono-
crop systems.
Figure 1.1 Conceptual framework showing agricultural transformation in the
process of industrialization and the central role of technical changes and
institutional innovations
As the economy grows, the development of the nonfarm economy and part-time farming
in small farms significantly increases nonfarm incomes, thereby affecting household
production choices. There are four possible choices that small farms can make: (1)
Farmers can reduce rice production as labour moves into nonfarm sectors. (2) They may
Development of the
nonfarm sector
Technical changes
and institutional
innovations
The dynamic
evolution of food
system
Farm incomes and labour
Nonfarm incomes and labour

5
hire labour to substitute for the loss of family members, leaving agricultural production
unaffected. Economic theories do not show unambiguous predictions in terms of the
magnitude or signs of the effects (Taylor and Lybbert 2015). (3) Farm households can
apply less labour-intensive farming, or reorganize agricultural production by spending
more effort on farm from the remaining labour in the family in order to keep output
stable. (4) Households can spend nonfarm incomes on relaxing the liquidity constraints
on agricultural production, e.g. investing in capital or hiring more labour. These
arguments result in the following policy proposition:
Proposition 2: In land-poor countries at the middle-income stage, as the economy
develops and wages rise rapidly, low income from grain production causes the
consequent move by farmers into nonfarm sectors as a means of improving
household income, thereby increasing part-time farming and resulting in a decline
in agricultural production. As a result, policies that keep food production stable
place food self-sufficiency in conflict with the goals of improved household
welfare and rural structural transformation.
Otsuka (2013) concludes that the agricultural sector in Asia will lose its comparative
advantage in the process of industrialization with increasing part-time farming and wage
rates if land reforms fail to expand farm sizes and reduce land fragmentation. This
current study hypothesizes that technical changes and institutional innovations play a
vital role in maintaining the comparative advantage of agriculture, and increasing
agricultural productivity. Without technical changes and institutional innovations,
agricultural incomes are likely to fall seriously behind nonfarm incomes, thus
widening rural-urban inequalities (Hayami and Ruttan 1985). Thus, to validate these
arguments, this study postulates the following proposition:
Proposition 3: In the face of industrialization and rapidly increasing rural wages,
technical change and institutional innovations are key strategies to improve
agricultural productivity and prevent the comparative advantage of agriculture
from declining when agricultural productivity growth reaches its threshold in
spite of increasing supporting policies. Land reforms directed toward land
consolidation, which result in increasing labour-saving farming and more
mechanization, are important strategies in the long term during the transitional
period from middle-income stage to high-income stage.

6
Although technical changes and institutional innovations play an important role in
maintaining the comparative advantage of agriculture, the application of productivity-
improving technical change is likely to be limited to small farms with access to seasonal
finance and markets (Dorward et al. 2004). Dorward et al. (2004) thus suggest that the
government should intervene to assist farmers to reduce transaction costs and risk when
accessing seasonal finance, and input and output markets. Furthermore, according to
Dorward et al. (2004), it is important to invest in institutional innovations that supply
agricultural services, and in developing input supply systems. This consideration leads to
the following policy proposition:
Proposition 4: Small farms respond to increasing cost stress by reducing farm
labour. Therefore, subsidies may be necessary to make input purchases for
improved technologies both profitable and affordable. This may be contrary to
arguments dominating development policies on subsidies.
1.3 The objective, scope, and research questions
The objective of this thesis is to contribute to the discussion on appropriate agricultural
development strategies for Vietnam based on empirical analysis at the farm household
level. While the Vietnamese government is reviewing the system of current policies and
strategies to implement Decision 899, which aims to restructure the agricultural sector,
this thesis contributes to the discussion of policy formation and strategies. It also
provides some insights into small-scale Vietnamese farming facing industrialization and
economic structural transformation.
The scope of policy reforms during agricultural transformation is broad.3 Thus, this
thesis mainly focuses on four issues (stated above in the policy propositions) in the
context of Vietnam. First, it examines crop diversification and the economic
performance of diversified farms. Second, the thesis pays special attention to the
increasing importance of the nonfarm economy and its implication for households’
agricultural production choices. Third, this thesis attempts to evaluate the impact that
land reforms directed towards land consolidation have on labour allocation and the
economy diversity of farm households. Fourth, it examines the response of farm
households to increasing cost stress in annual crop production. These issues are
frequently posed in the debates on agricultural policies in Vietnam. In addition,
3Agricultural transformation is defined as a significant change in the pattern of product combination,
production sequences, and resource use in agriculture (Hayami and Ruttan 1985, p. 428).

7
agricultural transformation includes several sub-sectors such as livestock, annual and
perennial crops, forestry, and aquaculture. Thus, this thesis mainly concentrates on small
farm households who produce annual crops.
There are underlying issues that must be identified in order to understand farmers’
decision-making and farm household behavior in the face of new settings. To do so,
the thesis attempts to answer the following questions:
i) Crop diversification: Does crop diversification result in scale and output
complementarity in agricultural production? How can technical efficiency be improved
in a multi-output environment? How does farm labour respond to increasing cost stress
in multi-crop production? These questions are answered in Chapter 4.
ii) The development of the nonfarm economy: What choices of agricultural production
do small farms make when household members participate in nonfarm activities and
part-time farming increases? Are nonfarm activities of farm households complementary
to agricultural production? These questions are answered in Chapter 5.
iii) Technical changes and institutional innovation (land reforms directed toward land
consolidation): Do land reforms directed towards land consolidation affect labour
allocation and economic diversity in farm households? And if so, how? This question is
dealt with in Chapter 6.
In addition to the above research questions, the thesis further contributes to the
literature on agricultural research. First, the role of sustainable intensification in
agriculture is also investigated by examining the economics of diversification of
annual crop producing farms. Second, the concept of the elasticity of substitution in
agricultural production is used, instead of using multivariate regression estimation, to
evaluate the response of family labour to rising cost stress in farm production. Third, it
provides evidence on the linkages between the farm and nonfarm sectors, particularly
reverse linkage, which is rarely studied in the literature. Finally, it analyses the role of
Hicks-neutral and factor-biased technical changes in structural transformation in
developing countries, using both theoretical and empirical evidence.
1.4 Contribution of the thesis
The thesis is distinguished from other studies on agriculture and rural development in
at least three aspects. First, the above specific issues are important for policy, but have

8
not previously been investigated in the context of Vietnam. 4 Second, the thesis
develops theoretical frameworks to support an empirical analysis of crop
diversification, nonfarm participation, and land reforms directed towards land
consolidation in Vietnam. It contributes to theoretical studies by examining the role of
agricultural productivity growth on structural transformation under the different
assumptions of Hicks-neutral and factor-biased technical change. The thesis is also the
first study to apply the elasticity of substitution in evaluating household behaviour in
labour allocation in light of the increasing cost stress in agricultural production in
Vietnam. These frameworks can then also be applied in other developing countries.
Finally, the thesis contributes to the existing literature on new directions for
smallholder agriculture. In addition, it highlights current issues facing agricultural
development and rural structural transformation in Vietnam, including policies directed
toward crop diversification, the development of rural nonfarm economies, and land
reforms. The analysis contributes to the discussion on restructuring the agricultural
sector, and supporting policy makers in designing appropriate policies and strategies.
Detailed contributions are described in each chapter.
In order to implement the objectives, the thesis employs a national dataset of the
VHLSS 2004 and 2006 surveys for the core chapters. Both are nationally
representative surveys and cover a variety of household information such as income,
expenditure, employment, agricultural production, and other household characteristics.
Moreover, the VHLSS surveys also cover communal characteristics. VHLSS 2004 and
2006 each include a panel sample, representing half of the total sample. The details
and descriptions of VHLSS are presented in each core chapter. Besides the application
of household data, this thesis also uses data provided by the General Statistics Office
of Vietnam (GSO) and the Ministry of Agriculture and Rural Development (MARD).
1.5 Structure of the study
The thesis has seven chapters. Chapter 2 introduces the analytical framework of
agricultural transformation in a land-poor and labour-abundant country. The objective
of this chapter is to survey theories on the agricultural transformation process, which
facilitates the development of the analytical framework and research issues for the thesis.
It also aims to clarify the main problems facing smallholder agriculture and strategies
4See the detailed literature reviews in Chapters 4, 5 and 6.
9
needed to cope with them. It mainly focuses on theoretical frameworks that are relevant
for the context of Vietnam. The chapter begins with an analysis of the Fei-Ranis dual
economy model, which is an extension of the Lewis model (1954). It discusses the
movement of labour from agriculture to industry, or from farm to nonfarm sectors, in a
dual economy model and the impact of this process on the agricultural transformation.
Next, this chapter discusses technical changes and institutional innovations in
agricultural development discussed by Hayami and Ruttan (1985). This theory plays an
important role in policy reforms, particularly land reforms and product diversification.
The chapter also reviews the analysis of agricultural problems by Schultz (1953 and
1978) and Hayami (2004 and 2007), and the evolutionary processes of agricultural
development in land-poor countries developed by Otsuka (2013 and 2015), Otsuka and
Estudillo (2010). The experience of agricultural transformation in selected East Asian
countries is also reviewed. Finally, the chapter provides a framework of policy reforms
for transformation of smallholder agriculture, which emphasises product diversification,
the development of a rural nonfarm economy and land reforms.
An overview of agricultural reforms and structural transformation in Vietnam are
presented in Chapter 3. The discussion surveys the evolution of agricultural reforms,
which provides the policy setting for examining the themes of crop diversification,
nonfarm participation and part-time farming, and land reforms in rural Vietnam in the
ensuing chapters. In addition, this chapter provides insights into Vietnam’s smallholder
agriculture in the light of increasing industrialization. First, the chapter examines land
policy reforms. The causes and problems of land fragmentation are analyzed. Second,
a detailed examination is carried out on food security and the ‘rice first’ policy. Finally,
the chapter discusses the development of the rural nonfarm economy, part-time
farming and rural wages in Vietnam. After examining the development of the
Vietnamese agricultural sector, it then focuses on current issues in Vietnam’s
agricultural transformation, which are empirically studied in the next chapters.
The core of the thesis consists of Chapter 4 to 6 dealing with crop diversification
(Chapter 4), nonfarm participation and household production choices (Chapter 5), and
the effect of land reforms toward land consolidation (Chapter 6). Chapter 4 focuses on
investigating the economies of diversification, determinants of technical efficiency, and
responses of family labour to increasing cost stress in a multi-output environment. This
chapter applies the method proposed by Paul and Nehring (2005), which is widely used
in the literature, in looking for the evidence of scale economies, economies of scope,
10
output complementarity, and technical efficiency in multi-crop production. In addition,
this chapter uses the method developed by Blackorby and Russell (1989), and Grosskopf
et al. (1995) to compute the cross and own elasticity of shadow prices with respect to
input, and the Morishima elasticity of substitution, which support the study of household
behaviour in response to rising cost stress in farm production. This study estimates the
input distance function to measure the economic performance of diversified farms. The
model is transformed into a stochastic production frontier perspective, which can be
estimated by maximum likelihood techniques (Paul and Nehring 2005).
Chapter 5 investigates the effect of nonfarm participation on household production
choices in rural Vietnam. While the previous chapter provides new insights into changes
from the ‘rice first’ policy to crop diversification, this chapter explicitly studies the
backward linkage in agricultural production from an increasingly important aspect:
nonfarm development and part-time farming. The potential impact of nonfarm
participation on household production choices is quite complex (Taylor and Lybbert
2015). Therefore, this chapter applies different methods such as OLS, 2SLS, and matching
techniques to estimate the model using total, north, and south survey samples. It covers the
impact on rice production, farm revenue and non-rice farm revenue, and crop and
livestock expenses. In addition, this chapter investigates the effect of nonfarm participation
on total real household expenditure. By using different methods, it is possible to check the
consistency of the empirical results.
Within the narrower context of this thesis, Chapter 6 rounds off the analytical core. It aims
at evaluating the effect that land reforms directed towards land consolidation have on the
labour allocation and economic diversity of farm households. The overview in Chapter 3
introduces equity-oriented land reform and its impacts. Chapter 6 further analyses the
impact of land fragmentation. It begins empirically by providing a theoretical framework
to determine the effect of land fragmentation on labour allocation. It extends the approach
of Jia and Petrick (2013), who argue that the impact is theoretically ambiguous. By using
the approach of agricultural technical changes, and the specification developed by
Acemoglu (2010) and Bustos et al. (2013), the chapter first attempts to evaluate
whether the effect of land fragmentation is theoretically determined. Regarding the
empirical analysis, this chapter examines the impact of land fragmentation on nonfarm
outcomes as nonfarm labour supply, and nonfarm profits, and farm outcomes such as
farm labour supply, profits and output. In addition, the chapter investigates whether or
not the change in land fragmentation in Vietnam is likely to be driven by factors such

11
as plot exchange, or land market transactions using household survey samples.
The final chapter, Chapter 7, summarizes the main findings of the thesis. By providing the
evidence of small farms’ behaviour and decision-making processes in the new settings,
this chapter discusses policy implications for achieving successful outcomes of the
transformation of smallholder agriculture in Vietnam. The findings of the thesis
support policy makers in designing appropriate strategies on restructuring the
agricultural sector. The chapter ends with suggestions for further research on selected
issues that emerge from the study.

12
Chapter 2
Agricultural transformation in a land-poor and labour-
abundant country: an analytical framework
2.1. Introduction
In most societies, the growth of agricultural output is essential to the development
process despite the declining role of the agricultural sector during economic structural
transformation (Thirlwall 2006; Perkins et al. 2006). Taylor and Lybbert (2015) find that
a one per cent growth in agriculture is associated with nearly a half (0.45) percentage
point increase in non-agricultural growth. While there have been theoretical studies on
the role of agricultural growth to economic development, the process of agricultural
transformation itself has also received the attention of most development economists.5
The dual economy models developed by Lewis (1954), and then extended by Fei and
Ranis (1961), present the impact of structural transformation on agriculture until the
economy reaches the Lewis turning point (Fei and Ranis 1964). Experience during
agricultural transformation in East Asian economies, which have small and fragmented
landholdings in common, has shown that the agricultural sector lost its comparative
advantage during industrialization process (Otsuka 2013 and 2015; Otsuka and Estudillo
2010). Given that the majority of farms are small in Asia, a major issue for smallholder
agriculture is how to improve agricultural productivity and income. Focus is increasingly
being shifted to technical change and institutional innovations during rapid economic
structural change.
The objective of this chapter is to survey theories of the agricultural transformation
process itself; this assists the development of the analytical framework for the thesis. It
also aims to answer the question of what are main problems facing smallholder agriculture
and strategies to cope with. Policy reforms are developed by identifying problems in the
5 Agricultural transformation is defined as a significant change in the pattern of product combination, production sequences, and resource use in agriculture (Hayami and Ruttan 1985, p. 428). There are
some books discussing agricultural transformation including “Transforming Traditional Agriculture”
Schultz (1964), “Subsistence Agriculture and Economic Development” Wharton (1969), and
“Agricultural Development: an International Perspective” Hayami and Ruttan (1985).
13
agricultural transformation in land-poor and labour-abundant countries. 6 The focus is
mainly on theoretical frameworks that are relevant to the context of Vietnam. World Bank
(2011a) shows that Vietnam has become a lower-middle-income economy.7
This chapter is structured as the follows. Section 2.2 reviews relevant theories on
agricultural transformation. There are two groups of theories selected: (1) the dual
economy model by Ranis and Fei (1961); and (2) the theory of technical changes and
institutional innovations by Hayami and Ruttan (1971 and 1985). This section also
reviews the evolutionary process of agricultural transformation developed by Schultz
(1978), Hayami (2007), and Otsuka (2013). It is a summary of the agricultural
transformation in land-poor countries, particularly in Asia, which has common features
in agricultural development. Section 2.3 presents the experience of agricultural
transformation in East Asia, which have the same characteristic of small and fragmented
landholdings in agricultural production as Vietnam. The analytical framework of policy
reforms is developed in Section 2.4, which provides the key arguments and ideas for
underpinning the topics of this thesis.
2.2 Analytical framework
2.2.1 The dual economy model
This section reviews the model of a dual economy, first developed by Lewis (1954) and
then further extended by Fei and Ranis (1961). The dual economy model describes the
evolution of thought on agricultural development in a labour surplus country. The
section mainly focuses on the model extended by Fei and Ranis (named Fei-Ranis model
in this chapter) because the Lewis model neglects the role of the agricultural sector in
promoting the development of the industrial sector (Taylor and Lybbert 2015). The Fei–
Ranis model shows the importance of investing in agriculture if a country wants its
industrial sector to grow. It describes the relationship between the agricultural and
industrial sectors.8 The movement of labour from agriculture to industry is the central
process around which the theory is constructed. In the industrial sector, profit
maximization operates in competitive markets as postulated by the neoclassical
6 Land-poor countries are defined as countries with small and fragmented landholdings during the
economic structural transformation. Small farms are defined as farms with less than two hectares of crop land and those depending on household members for most of the labour (Hazell and Rahman 2014). 7 According to World Bank’s classification. In 2011, GNI of Vietnam was USD 1010 USD (World
Bank 2011a). 8 For further details in the Fei-Ranis model, see Fei and Ranis (1961, 1964, 1997).

14
economists. In addition, labour is paid the value of its marginal product. Demand for
labour in this sector depends on the availability of capital, technological advances, and
the demand for industrial goods. In the agricultural sector, traditional methods of
production employ simple techniques with a low level of capital. Furthermore, the wage
rates are institutionally determined at or near the subsistence level, in the tradition of
classical economics.
In the agricultural sector, there is an excess supply of labour at the institutionally
determined wage. This situation ensures perfectly elastic supply of labour from
agriculture to industry. If the industrial sector wishes to employ workers, it must pay a
higher wage rate set slightly above the subsistence level to compensate for the higher
costs of living over the subsistence economy. Given a labour surplus at this wage rate,
output growth in the industrial sector does not increase wages, but raises the share of
profits in the national incomes. Fei and Ranis argue that under these conditions, it is
possible to transfer labour from the agricultural sector to the industrial sector without
reducing agricultural output, and without increasing the wage rate in the industrial
sector during the early stages of development. Moreover, they also argue that the
movement of one worker from the agricultural sector to the industrial sector results in
an agricultural surplus. In this system, agriculture contributes both workers and surplus
production in the form of a wage fund for the expansion of the industrial sector.
Based on product dualism, Fei and Ranis (1964) elaborate on features of the marginal
product of labour in the agricultural sector in three periods. The first period starts with
zero marginal products in agriculture so that a shift in labour from agriculture to
industry does not reduce the former’s output. In the second period, however, the
marginal product becomes positive, labour reallocation does not force the agricultural
wages to rise, as long as in agriculture the marginal product is less than the wage rate.
Agricultural output reduces and the terms of trade between two sectors are changed in
favour of the agricultural sector. If migration continues, the commercialisation point is
reached. As a result, the third period begins when the marginal product reaches the
wages, causing a further shift in labour to the industrial sector, and accelerating both
the marginal product and wages in the agricultural sector to the same degree. This is
defined as the commercialisation point. This period marks the end of the take-off and
the beginning of self-sustained growth.
15
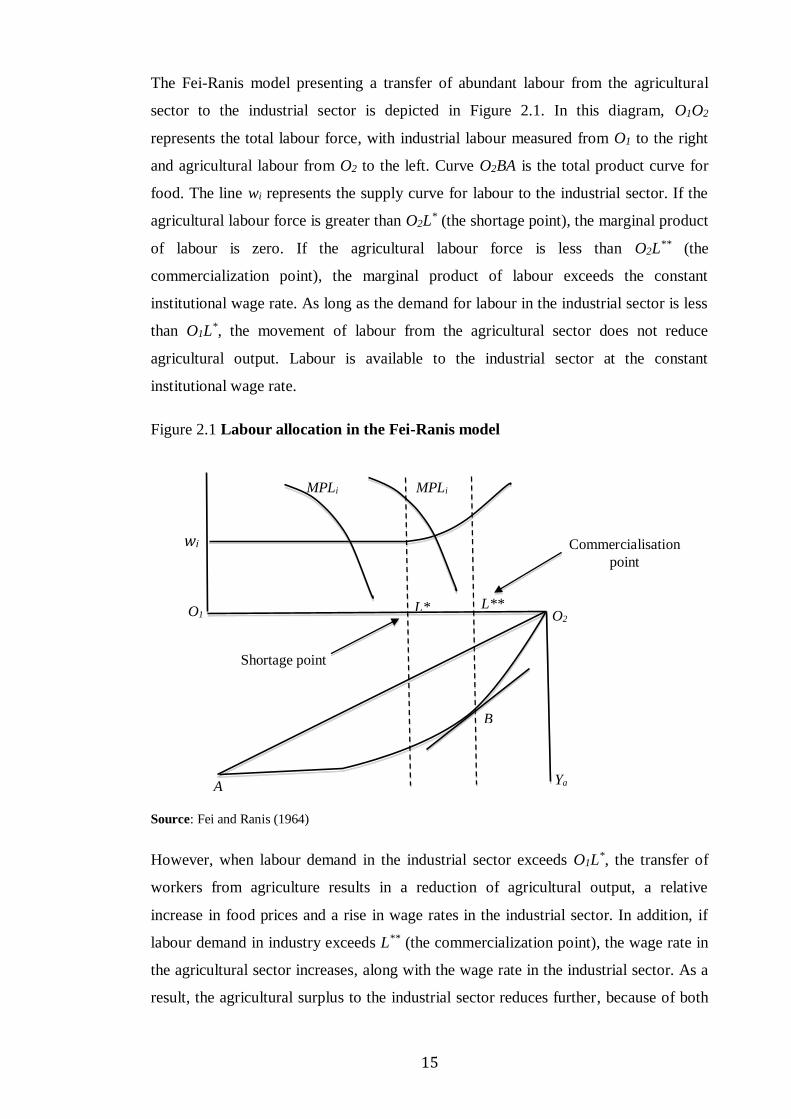
The Fei-Ranis model presenting a transfer of abundant labour from the agricultural
sector to the industrial sector is depicted in Figure 2.1. In this diagram, O1O2
represents the total labour force, with industrial labour measured from O1 to the right
and agricultural labour from O2 to the left. Curve O2BA is the total product curve for
food. The line wi represents the supply curve for labour to the industrial sector. If the
agricultural labour force is greater than O2L* (the shortage point), the marginal product
of labour is zero. If the agricultural labour force is less than O2L** (the
commercialization point), the marginal product of labour exceeds the constant
institutional wage rate. As long as the demand for labour in the industrial sector is less
than O1L*, the movement of labour from the agricultural sector does not reduce
agricultural output. Labour is available to the industrial sector at the constant
institutional wage rate.
Figure 2.1 Labour allocation in the Fei-Ranis model
Source: Fei and Ranis (1964)
However, when labour demand in the industrial sector exceeds O1L*, the transfer of
workers from agriculture results in a reduction of agricultural output, a relative
increase in food prices and a rise in wage rates in the industrial sector. In addition, if
labour demand in industry exceeds L** (the commercialization point), the wage rate in
the agricultural sector increases, along with the wage rate in the industrial sector. As a
result, the agricultural surplus to the industrial sector reduces further, because of both
O1 L**
MPLi
L*
wi
O2
Ya
B
A
MPLi
Commercialisation
point
Shortage point

16
the effect of the decline in the agricultural labour force on production, and the rise in
food consumption from higher wages received by agricultural workers.
The Fei-Ranis model emphasizes that at the “commercialisation point”, the marginal
product of labour exceeds the institutionally determined wage rates in agriculture.
Therefore, the industrial sector is required to raise the industrial wage to compete with
the agricultural sector for labour. The commercialization point in the Fei-Ranis model
is bolstered by two effects that are further intensified because of the international
context. 9 These include the ‘push’ effects of technology change in agriculture in
conjunction with the ‘pull’ of industrial labour demand, both domestically and
internationally. Further, Fei and Ranis decompose technological change into two
components. First, innovation intensity implies the adaptation of external technology
to domestic production. This technology permits output to expand without increasing
capital or labour stock. Second, a factor bias of production is related to the selection of
imported technology, whether labour using or capital using.
Implicit in the discussion so far is the hypothesis that the transfer of labour from
agriculture to industry stimulates agricultural transformation in a labour-abundant
country. This transfer only reduces agricultural output if there is no labour surplus in
the agricultural sector and rural wages rise. However, the dual economy model carries
with its various notable limitations that have been observed over the past several
decades. One criticism is that a labour surplus issue appears to ignore the
microeconomic foundation. Taylor and Lybbert (2015) claim that the dual economy
model does not provide insights into what happens on a micro level to enable people to
move up economically by participating in off-farm employment. There is no feedback
of nonfarm participation on agricultural investments in the dual economy model.
In addition, Dixit (1970) shows that one of the most serious limitations in the Fei-Ranis
model is that the treatment of productivity gain in agriculture is a result of neutral and
exogenous shifts in the production function without any capital accumulation in the
agricultural sector. Hayami and Ruttan (1985) point out that technical changes are
difficult for an economy in the early phases of economic development. Nevertheless, it
is applied in the agricultural sector when it becomes available. For instance, agricultural
households can substitute labour workers by applying more labour saving machinery in
9 As noted earlier, a commercialisation point coincides with the Lewis turning point in the Lewis model
(Fei and Ranis 1961).
17
agricultural production, and thus coping with the increasing trend in wage rates in the
agricultural sector in the Fei-Ranis model.
2.2.2 The theory of induced technical and institutional change
The purpose of this section is to review the theory of induced technical and
institutional change in the process of agricultural transformation developed by Hayami
and Ruttan (1971 and 1985) (named Hayami-Ruttan model in the chapter). The
arguments in this theory are relevant for a better understanding of the important role of
technical change and institutional innovations on the growth of agricultural
productivity in developing countries. It should be noted that the focus of the thesis is to
emphasize policies to promote both agricultural productivity and incomes of farm
households in maintaining food security in the face of the rapidly economic structural
change in Vietnam.
In the previous section, the Fei-Ranis model examines structural change in a labour-
abundant country in the process of industrialization at the aggregate level. The Hayami-
Ruttan model relaxes the assumption in the Fei-Ranis model by allowing technical
changes and institutions as endogenous to the economic system and agricultural
transformation. The Hayami-Ruttan model is examined in two sections. First, it
addresses the role of technical changes in economic development when labour is
transferred from agriculture to industry. Second, it discusses the theory of induced
institutional innovation and the implications of property rights, efficiency and equity in
agricultural policy.
2.2.2.1 A model of induced technical change in agricultural transformation
Technical change is defined as any change in production coefficients resulting from the
purposeful resource-using activity directed to the development of new knowledge
embodied in designs, materials, or organizations (Hayami and Ruttan 1985, p. 86). This
definition is similar to the approach of Hicks (1963). According to Hicks’s definition,
technical changes developed to facilitate the substitution of other inputs for labour
“labour-saving” and ones developed to facilitate the substitution for other inputs for land
“land-saving”.10 In addition, technical changes such as new husbandry practices or new
varieties of seeds are not themselves substitutes for labour or land, but they are inputs,
10 See Hicks, ‘The Theory of Wages’ (1963), Hayami and Ruttan (1971 and 1985) for further details of
the definition of technical change and models.

18
which behave as catalysts to assist the substitution of the relatively scarce factors for the
less scarce factors. Hicks (1963) argues that rising wages motivate labour-saving
innovations. In agricultural economics, Hayami and Ruttan (1971 and 1985) further
contribute to the development of theories related to technical change.
Figure 2.2 The Hayami-Ruttan model of induced technical change in agriculture
Source: Hayami and Ruttan (1985)
The model of induced technical change in agriculture is described in Figure 2.2. There
are two phases in this model. It is assumed that the transformation from phase 0 to 1
causes the scarcity of labour relative to land in the agricultural sector, leading to the
decline in land rent relative to wage rates. In addition, the model assumes that the price
of technical change reduces relative to the wage rate for labour because it is facilitated
from industry. As can be seen in Figure 2.2, represents the innovation possibility
curve at phase zero. It is the envelope of less elastic unit isoquants that correspond.
captures a technical change, which is applied when the price ratio prevails. The point P
in the model is defined as the minimum cost equilibrium point with a certain optimal
combination of land, labour and nonhuman power to operate technical change. In this
simplified model, technical change can be machinery or organizational changes in
farm cultivation. Assume that machinery is substituted for labour in response to a
change in wages. The change in the price ratio from BB to ZZ results in the technical
Io*
I0
I0*
I0
I1*
I1
B
B
Z
Z land
lab
ou
r T
echnic
al
change
P
Q
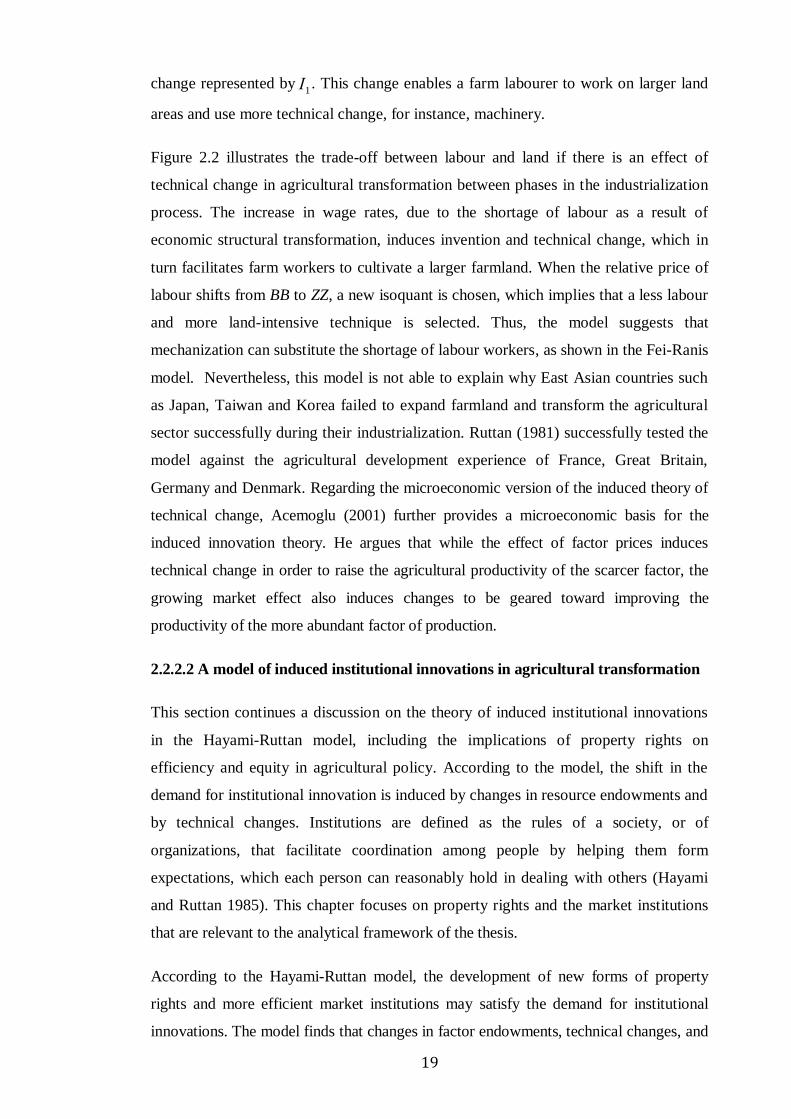
19
change represented by . This change enables a farm labourer to work on larger land
areas and use more technical change, for instance, machinery.
Figure 2.2 illustrates the trade-off between labour and land if there is an effect of
technical change in agricultural transformation between phases in the industrialization
process. The increase in wage rates, due to the shortage of labour as a result of
economic structural transformation, induces invention and technical change, which in
turn facilitates farm workers to cultivate a larger farmland. When the relative price of
labour shifts from BB to ZZ, a new isoquant is chosen, which implies that a less labour
and more land-intensive technique is selected. Thus, the model suggests that
mechanization can substitute the shortage of labour workers, as shown in the Fei-Ranis
model. Nevertheless, this model is not able to explain why East Asian countries such
as Japan, Taiwan and Korea failed to expand farmland and transform the agricultural
sector successfully during their industrialization. Ruttan (1981) successfully tested the
model against the agricultural development experience of France, Great Britain,
Germany and Denmark. Regarding the microeconomic version of the induced theory of
technical change, Acemoglu (2001) further provides a microeconomic basis for the
induced innovation theory. He argues that while the effect of factor prices induces
technical change in order to raise the agricultural productivity of the scarcer factor, the
growing market effect also induces changes to be geared toward improving the
productivity of the more abundant factor of production.
2.2.2.2 A model of induced institutional innovations in agricultural transformation
This section continues a discussion on the theory of induced institutional innovations
in the Hayami-Ruttan model, including the implications of property rights on
efficiency and equity in agricultural policy. According to the model, the shift in the
demand for institutional innovation is induced by changes in resource endowments and
by technical changes. Institutions are defined as the rules of a society, or of
organizations, that facilitate coordination among people by helping them form
expectations, which each person can reasonably hold in dealing with others (Hayami
and Ruttan 1985). This chapter focuses on property rights and the market institutions
that are relevant to the analytical framework of the thesis.
According to the Hayami-Ruttan model, the development of new forms of property
rights and more efficient market institutions may satisfy the demand for institutional
innovations. The model finds that changes in factor endowments, technical changes, and
I1
20
the growth in demand, induce changes in property rights and contractual arrangements to
enhance more efficient resource allocation through market. Moreover, it shows that
assigning more complete private property rights on land or other assets, is an
institutional innovation that facilitates the allocation of land more efficiently. The land
reform law that gives tenants stronger protection of their tenancy rights is a key such
innovation. More interestingly, the model points out that institutional innovation
increases efficiency at the expense of equity. On the contrary, institutions increase equity
at the expense of efficiency.
There are several studies on the role of land tenure security on economic growth and
agricultural development (Deininger and Feder 2009; Basley 1995; Brasselle et al. 2002;
Fenske 2011). Secure property rights to land and well-functioning land markets are
important in creating investment incentives, improving land allocations, developing
financial markets, and increasing farm households’ participation in off-farm labour
markets (Deininger and Feder 2009). Moreover, the level and likelihood of land conflicts
may decline when land rights are more secure (Fenske 2011). These studies support the
Hayami-Ruttan model’s view on institutional innovations
However, the agricultural transformation experience in East Asia in particular, and in other
land-poor countries in general has been different, particularly in light of increasing part-
time farming. These countries have maintained smallholder agriculture such as small
farms and highly fragmented landholdings during their industrialisation and modernisation
periods (Otsuka 2013). The average farm sizes showed no increase during the period of
rapid economic growth in Taiwan where there are strongly protected tenancy rights (Bain
1993). Japan and Korea also seem to have experienced a similar pattern. Land constraints
such as small and fragmented landholdings hinder mechanization in agricultural
production in land-poor countries (Otsuka and Estudillo 2010). Although the Hayami-
Ruttan model does not provide a comprehensive model of agricultural change in East Asia,
it supports a framework to improve agricultural productivity. This can be achieved through
the capacity to produce an ecologically adapted, and economically viable, agricultural
technology in each country and region. The model also shows that the expected returns to
political leaders from institutional changes that facilitate the opportunity to exploit technical
change are key inducements to institutional innovations (Hayami and Ruttan 1985). The
next section further explores the evolutionary changes of agricultural development in land-
poor countries, particularly in Asia.
21
2.2.3 Agricultural problems and the evolutionary process of agricultural
development in a land-poor country
The chapter further reviews agricultural problems at different stages of economic
development and agricultural transformation in land-poor countries. It adapts the
analysis of agricultural problems from Schultz (1953) and Hayami (2007), and
agricultural transformation in tropical Asia from Otsuka (2013), Otsuka et al. (2014),
and Yamauchi (2014). The agricultural problem is defined as a problem of overriding
concern to policy makers in terms of designing and implementing agricultural policies
(Hayami 2007).
Schultz (1953 and 1978) present the two different problems of low-income and high-
income countries. The ‘food problem’ occurs in low-income economies, which is
characterized by rapid population growth and the shortage in the supply of food relative to
the demand. Thus, governments’ agricultural policy in low-income countries focuses in
preventing the food shortage from occurring. In contrast, high-income countries face a
‘protection problem’ (Schultz 1953 and 1978). At the high-income stage, the capacity in
food production is strengthened by advanced technology. In addition, food prices and farm
incomes tend to decline. Supported by the powerful lobbying by farmers, the goal of
agricultural policies is to prevent agricultural incomes from declining. Consequently,
agricultural protection policies are widely used to protect the agricultural sector at the
expense of consumers and taxpayers. These two different policy approaches have been
identified as a major source of the disequilibrium of world agriculture (Hayami 2007;
World Bank 2008).
In addition to the theory on the two agricultural problems developed by Schultz (1953,
1978), Hayami (2004 and 2007) introduces an agricultural problem in middle-income
economies, based on Schultz’s theory. He argues that farm incomes tend to reduce relative
to nonfarm incomes due to the widening inter-sectoral productivity gap. Therefore, the
prime concern of governments at the middle-income stage is to prevent income inequality
from widening. Improving agricultural productivity through mechanization is important.
At the same time, policies are reoriented toward supporting farmers’ incomes. This
agricultural problem is known as the ‘disparity problem’ between sectors. Hayami (2007)
also points out that underlying the widening income inequality between sectors at the
middle-income stage is the reduction of the comparative advantage of agriculture.
Moreover, the rate of decline is likely to exceed the rate of labour transfer from agriculture

22
to industry in the dual economy model characterized by the weak absorption of rural
labour into the formal sector. As a result, when the economy reaches a high-income level,
protection measures have to be applied to keep social stability.
These three agricultural problems are integrated into the process of agricultural
transformation in land-poor Asian countries. This chapter reviews both theoretical and
empirical evidence, and provide a summary of agricultural transformation and the future
of small farms in Asian land-poor economies. 11 It provides the background for the
discussion on Vietnam’s agricultural development and challenges facing smallholder
agriculture in the following chapters. In order to illustrate the process of agricultural
transformation in land-poor countries, this chapter develops a model that captures the
theory of three agricultural problems by Schultz (1978) and Hayami (2004, 2007) with the
findings in the literature. This is the first attempt in the literature that provides an
integrated model on the agricultural development in land-poor countries. Furthermore, it
focuses more on agricultural transformation at the middle-income stage because it is more
relevant to the Vietnamese context.
Figure 2.3 shows the agricultural problems and agricultural transformation in land-poor
countries in Asia at different stages of economic development including low-income,
middle-income, high-income stages. Panel (1) describes the dominant agricultural
problems in world agriculture, while Panel (2) is a summary of the process of
agricultural transformation in land-poor economies in Asia. Otsuka (2013) argues that
land-poor countries in Asia have experienced the ‘common’ evolutionary process of
agricultural development. This process includes three following problems: food
insecurity and the role of green revolution at the low income level; the emergence of
nonfarm jobs; and rising income inequality between sectors at the middle-income stage;
and the reduction of food self-sufficiency associated with the reduction of the
comparative advantage of agriculture at the high-income level.
11 There have been several studies on agricultural transformation in Asian region and in a specified
Asian country (Haymi and Ruttan (1985) for theoretical studies and the case of Japan; Otsuka (2013) for
the analysis of common evolutionary processes of agricultural development in land-poor countries,
particularly in Asia; Yamauchi (2014) for empirical evidence in Indonesia).

23
Figure 2.3 The agricultural problems and agricultural transformation in Asian
land-poor countries at different stages of economic development
Source: Developed from Schultz (1978), Hayami (2007), Otsuka (2013) and the literature on the
agricultural transformation in Asia.
Land-poor countries in Asia account for 87 per cent of the world’s 450 million of
small farms (IFPRI 2007). These countries have experienced a similar pattern of
agricultural transformation as described in Figure 2.3. At the low-income stage, the
food insecurity problem is similar to the ‘food problem’ firstly used by Schultz (1953
and 1978). Prior to 1965, the prime concern of governments in tropical Asia in
designing agricultural policies was how to prevent a shortage of food (Otsuka 2013).
Food security strategy at this stage was food self-sufficiency, which resulted in the first
Green Revolution in tropical Asia. The Green Revolution, which took place between
1965 and 1995, contributed to improving rice yields in Asia in the late 1960s (Hazell
2009). It mainly focused on the application of technical changes such as high-yield
varieties, irrigation reform, improved fertilisers and pesticides, substantial public
investment and policy support for agriculture (Bain 1993; Hazell 2009). Some Asian
countries also carried out equity-oriented land reforms e.g. land reform in Taiwan in
the early 1950s, China in the late 1970s, and in Vietnam in the late 1980s. These land
reforms contributed to increasing rice outputs in Asia (Bain 1993; Huang et al. 2012;
Dang et al. 2006). The success of the Green Revolution enabled tropical Asian
Low-income
stage
Middle-income
stage
High-income
stage
Food
problem
Disparity
problem
Protection
problem
Dominant agricultural
problem
Food insecurity and green
revolution
Nonfarm jobs and farm
income
Declining
comparative advantage of
agriculture
Transformation
of smallholder agriculture in
Asia
Rising wage rates, part-time
farming, and high-value products
Small and fragmented
landholdings
Supply and demand
of rice and low wages
Small and fragmented
landholdings
(1)
(2)

24
countries to solve food insecurity problems and broaden opportunities for economic
growth and structural change during the transitional period from low-income stage to
middle-income stage (Thirwall 2006).
Nevertheless, the Asian Green Revolution had a significant impact on the demand and
supply of rice. In addition, wage rates were low at this phase (Hazell and Rahman 2014).
When wage is sufficiently low relative to machine rental, labour-intensive farming is
cheaper and more efficient (Otsuka et al. 2014). This view is developed and illustrated
by Otsuka et al. (2014) in Figure 2.4 by the lower average cost curve in low-wage
economies. It should be noted that in land-poor countries in Asia, food production was
characterized by small and fragmented landholdings during the transition to the middle-
income stage.
Figure 2.4 Illustration of optimum farm size in low-wage economies
Source: Otsuka et al. (2014)
At the middle-income stage, the disparity problem becomes the main concern when
nonfarm sectors grow faster than farm sectors (Hayami 2004 and 2007). In addition,
economic growth and improvement in cereal productivity affect supply and food
consumption. Consequently, income from rice tends to fall, or not increase as much,
relative to other sources of farm and nonfarm incomes. Given the hardship in small farms
associated with a lifestyle of long hours and low returns of agriculture, part-time or off-
farm employment is a means of bolstering income (Hazell and Rahman 2014; World Bank
2008). It is at the middle-income stage that the agricultural sector starts to face an income
problem, as shown by Hayami (2007).
Labour-saving
Labour-intensive
Average cost
Farm size A B
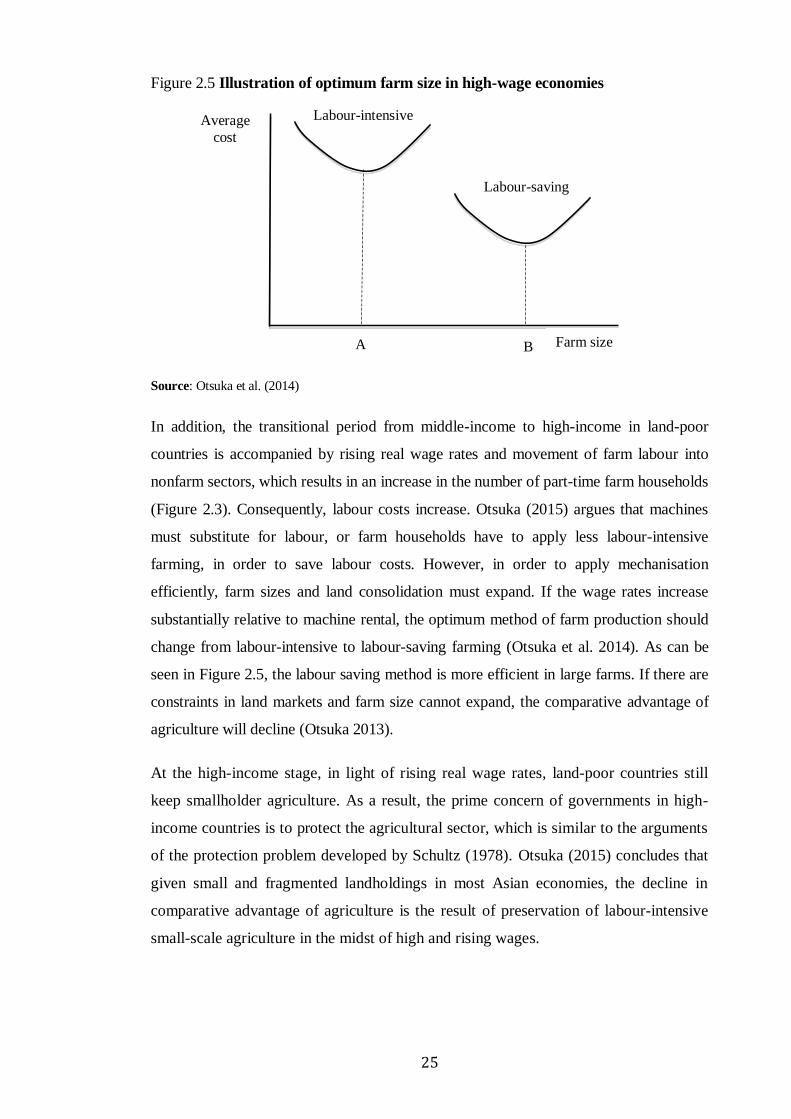
25
Figure 2.5 Illustration of optimum farm size in high-wage economies
Source: Otsuka et al. (2014)
In addition, the transitional period from middle-income to high-income in land-poor
countries is accompanied by rising real wage rates and movement of farm labour into
nonfarm sectors, which results in an increase in the number of part-time farm households
(Figure 2.3). Consequently, labour costs increase. Otsuka (2015) argues that machines
must substitute for labour, or farm households have to apply less labour-intensive
farming, in order to save labour costs. However, in order to apply mechanisation
efficiently, farm sizes and land consolidation must expand. If the wage rates increase
substantially relative to machine rental, the optimum method of farm production should
change from labour-intensive to labour-saving farming (Otsuka et al. 2014). As can be
seen in Figure 2.5, the labour saving method is more efficient in large farms. If there are
constraints in land markets and farm size cannot expand, the comparative advantage of
agriculture will decline (Otsuka 2013).
At the high-income stage, in light of rising real wage rates, land-poor countries still
keep smallholder agriculture. As a result, the prime concern of governments in high-
income countries is to protect the agricultural sector, which is similar to the arguments
of the protection problem developed by Schultz (1978). Otsuka (2015) concludes that
given small and fragmented landholdings in most Asian economies, the decline in
comparative advantage of agriculture is the result of preservation of labour-intensive
small-scale agriculture in the midst of high and rising wages.
Labour-saving
Labour-intensive Average
cost
Farm size A B
26
2.3 Experience of agricultural transformation in East Asia
This section surveys the agricultural transformation of the economies of Japan,
Taiwan, and China. The situation in Taiwan and China is similar to Vietnam’s labour
abundant and land-poor context. Otsuka and Estudillio (2010) show that the path of
agricultural transformation presented in Figure 2.3 can be followed by high-
performing Asian economies, unless labour-saving methods are efficiently applied.
This examination is set in the context of policy reforms that foster significant structural
change as well as challenges facing the agricultural sector, in order to identify the most
relevant comparisons for studying the Vietnamese experience during the restructuring
of smallholder agriculture.
Lessons drawn from agricultural transformation in Japan, Taiwan, and China include
that significant inefficiency in smallholder agriculture arises if farm sizes remain small
and land fragmentation remains severe during the industrialization process. Moreover,
the diversion of resources from rice production to the production of commodities with
higher income elasticities becomes important for maintaining incentives for the use of
resources in agricultural production (Hayami and Ruttan 1985). New patterns of
product combination and resource use, different from traditional rice monoculture,
need to be developed. The growth of agricultural productivity is important in
sustaining food security and the comparative advantage of agriculture (Warr 2014).
Japan was the first successfully industrialized country in East Asia. Its agricultural
sector was rapidly transformed after the Second World War. Japan carried out its land
reforms from 1946 to 1950, which reallocated land to famers and established a land
ceiling of 3 hectares for each farm household. This land reform caused severe land
fragmentation and small farm sizes (Hayami 1988). The average farm size was 0.8 - 1
hectare with 10 to 20 plots. Each plot covered 0.06 hectare and the average distance
between plots was 4 km (Ogura 1963). The number of farm households reduced by
only 20 per cent from 1960 to 1978 (Hayami and Ruttan 1985).
According to Hayami and Ruttan (1985), the increase in the number of part-time farm
households explains why there was so little reduction in the number of farm
households, in spite of the reduction of population in the agricultural sector. Between
1960 and 1978, the number of part-time farm households increased from 30 per cent to
70 per cent of total farm households. As a result, farmers with secure nonfarm

27
employment kept their agricultural land and worked on their farms in their spare time.
This created the difficulty faced by full-time farmers to expand their farm size.
In Japan, part-time farming mainly concentrates on rice production because the rice
sector receives support from the government (e.g. the procurement policy and
subsidies) (Hayami 1988). Rice farmers often sell rice through sole agents of
government rice marketing. Moreover, the system of agricultural research and
extension has traditionally been focused on the rice sector, which means rice
production is easier than other crops. However, Otsuka (2013) shows that the grain
self-sufficiency ratio in Japan has declined rapidly since 1961. Consequently, the
Japanese agricultural sector has lost its comparative advantage. It should be noted that
the rice self-sufficiency ratios also reduced significantly in other East Asian countries
in parallel with Japan (Otsuka 2013).
Regarding Taiwan, this country has been transformed from an agricultural to an
industrialized country, based on utilisation of labour abundance. Land reforms in the
period 1948-1956 resulted in the vast majority of small and fragmented landholdings
in the Taiwanese agriculture (Bain 1993). Taiwan started exporting its oversupply of
rice in 1952. In the early 1980s, the decline in the international rice price caused low
incomes for small farms and the consequent move by farmers into part-time off-farm
employment as a means of increasing household incomes (Bain 1993, p. 44). As a
result, Taiwan reduced rice production and changed to other crops with higher values.
In Taiwan, while the problems of farm sizes and land fragmentation were not solved in
the second land reforms in the early 1980s, rapid increase in real rural wages and low
agricultural prices during the industrialization process in the 1980s and 1990s led to high
production costs and low returns in agricultural production (Fu and Shei 1999). Bain
(1993) shows that “the Taiwan miracle” of industrial change was quite a different story
for agricultural development. Consequently, the agricultural sector lost its comparative
advantage. In order to maintain incentives in agricultural production, the Taiwanese
government has spent huge amount on price support and input subsidies, accounting for
30 per cent of the total agricultural budgets in the 1990s (Fu and Shei 1999).
In the second Taiwan land reform in the early 1980s, the government encouraged farm
households to consolidate their land. The land ceiling was demolished. Moreover, the
government supported credit for farmers to purchase more land. However, these
policies were not successful in reducing land fragmentation and small farm size (Bain,

28
1993). Bain argues that part-time farming can be attributed to the difference between
demand and supply of agricultural land. Young family members worked in cities and
industrial areas, while old people and women stayed in the rural areas. Furthermore,
nonfarm income also supplemented the household income, thereby reducing the
demand for land sales. Bain (1993) also shows that the expansion of the
industrialization process pushed the increase in land prices in rural areas, which in turn
discouraged farmers from expanding farm size or purchasing or renting neibouring
plots in order to reduce the problem of land fragmentation.
Similar to Taiwan, China is also an interesting case of a land-poor and labour-abundant
country that underwent a remarkable agricultural transformation in the process of
industrialisation. China started its land reform in 1978 by establishing the household
responsibility system and increasing the state purchase prices for agricultural products,
which led to a large improvement in agricultural production (Lin 1992; Perkins 1988).
Agricultural land was reallocated in egalitarian principles, which led to small farm sizes
and severe land fragmentation (Jia and Petrick 2013). According to Lin (1992),
agricultural outputs increased at the annual rate of 7.4 per cent from 1979 to 1984.
During this period, the reform brought incentives for farmers to increase agricultural
production. As a result, agricultural growth contributed to poverty reduction and pushed
the country out of the stagnation resulting from the Culture Revolution and the central-
planning mechanism in the 1970s. Agricultural growth has, however, slowed down since
1985. Lin (1992) argues that the reasons for the reduction of agricultural output were the
completeness of the household responsibility system in 1983, and the increase in
migration of rural labour to urban areas, along with and the development of the rural
nonfarm economy.
However, Otsuka (2013) shows that sharply rising rural wage rates in light of massive
migration to urban areas and participation in rural nonfarm sectors has been one of key
reasons explaining the declining agricultural growth in China, particularly since the
late 1990s. Moreover, Christiaensen (2011) finds that the average farm size remains
0.6 hectare - no remarkable increase in farm size has been observed in China during
the industrialisation process. The increase in part-time farming and rural wages will
lead to a decline in the comparative advantage of agriculture unless there is no
improvement in labour savings methods. It is noteworthy that China has maintained a
net trade deficit in grains since 2006 (OECD and FAO 2013). Otsuka (2013) also
predicts that the grain self-sufficiency ratio may decline in China unless the problems

29
of land constraints and farm income are solved. Consequently, China may become a
major importer of grains in the future, which may result in a sharp increase in world
food prices and trigger another food crisis.
2.4 Policy reforms for transformation of smallholder agriculture in the
face of industrialisation and modernisation
As the development of countries continues and incomes per capita rise, it is the normal
historical experience for workers to leave agriculture to get nonfarm jobs, and for farms
to consolidate and become larger and more mechanised. In addition, small farms that do
remain either move to high-value production or become part-time (Hazell 2010). Hazell
(2010) also argues that if this transition does not occur, farm incomes may fall seriously
behind nonfarm incomes, consequently widening rural-urban income inequality.
The theoretical models and experience of agricultural transformation in land-poor
countries show that smallholder agriculture plays a shrinking role in the process of
industrialisation. In Asia, cereals, mainly rice, served as a leading growth sector during
the green revolution in the 1960s to 1980s. However, as some Asian economies
successfully industrialise, smallholder agriculture based on rice is becoming less
relevant, and thus it is harder to avoid widening the income gaps between sectors and
regions (Otsuka 2015). Moreover, Headey at al. (2010) find that the reverse
transformation taking place in Asia could potentially result in a backlog of workers who
may leave agriculture. In this context, this chapter argues that policy reforms for
smallholder agriculture at the middle-income stage need to be designed to improve
agricultural productivity through technical change and institutional innovation. In
addition, the reforms need to support farmers to find higher-value opportunities in light
of the increase in part-time farming, rising rural wage rates and income disparity.
There have been several studies that provide a policy framework supporting the
agricultural transformation (Dorward et al. 2004; World Bank 2008; Anderson and
Martin 2009; Thapa and Gaiha 2014; Hazell and Rahman 2014). Anderson and Martin
(2009) show the declining comparative advantage of Asian agriculture and the
application of protection measures at the high-income stage. However, they mainly
concentrate on evaluating the effects of price and trade distortions in agriculture, and
not the policy frameworks needed to support agricultural transformation. Dorward et
al. (2004) review the institutional reforms and policies for pro-poor agricultural

30
growth, based on the summary of theoretical and empirical evidence. The authors
argue that because the market failures change in the course of development,
distinguishing policy phases in support of the agricultural sector is useful. Dorward et
al. (2004) develop three policy phases to support smallholder agriculture (Figure 1). In
Phase 1, the government plays a role in establishing the basics for improving food crop
production, such as investments in agricultural research, irrigation infrastructure and
land reforms for creating the conditions for pro-poor agricultural growth. This phase is
characterised by extensive low-productivity agriculture in a low-income country.
Figure 2.6 Policy phases in supporting agricultural transformation
Source: Dorward et al. (2004)
However, the application of productivity-improved technical change is likely to be
limited to small farms, with access to seasonal finance and markets once the basic
conditions are in place. Thus, Dorward et al. (2004) suggest that the government should
intervene in Phase 2 to facilitate farmers reduce transaction costs and risk when
accessing seasonal finance and input markets. Furthermore, it is essential to invest in
Phase 1:
Establishing the basics
Roads/irrigation
systems/research/extension/land
reforms
Extensive, low productivity
agriculture
Profitable intensive
technology. Uptake constrained by adequate
finance, input and output
markets Seasonal finance,
extension, input supply
systems Reliable local output
market
Effective farmer input
demand and surplus
production
Large volumes of finance
and input demand and
produce supply. Non-
agricultural linkages
Effective private sector
markets
Phase 2:
Kick-starting markets
Phase 3:
Withdrawal

31
institutional innovations that supply agricultural services, and in development of input
supply systems and reliable output markets. When farm households adapt to new
technologies and increase the transaction volumes of credit, input and outputs,
transaction costs will decline. The government intervention should then be withdrawn
and more attention paid to supporting the development of the rural nonfarm economy
(Phase 3).
Figure 2.7 Challenges and policy framework for smallholder agriculture in Asia
Source: Developed from ideas and arguments of Thapa and Gaiha (2014)
The policy phases initiated by Dorward et al. (2004) have no strategies that deal with
the emerging challenges for smallholder agriculture in middle-income countries like
Vietnam and China. This policy framework emphasises institutional support for
Challenges Policies
Growth of consumption and production of
high-value commodities (1)
Transformation of agrifood industry (2)
- Declining productivity growth of
major food crops
- Capital moving out of agriculture
- Environmental problems
- Land and tenure security
- Impact of climate change and water
shortage
- Risk and vulnerability
i) Technical change to address
environmental problems and yield
growth
ii) Institutional innovations for
productivity enhancement and
diversification:
- Farmer organizations
- Contract farming
- Supply chains and super markets
- Fiscal stimulus
Agricultural transformation

32
labour-demanding technical changes in order to promote growth in poor rural areas.
Regarding the agricultural sector in Asia and the Pacific, Thapa and Gaiha (2014)
discuss new challenges facing agricultural transformation and suggest. The chapter
reviews the ideas presented by Thapa and Gaiha (2014) and expresses these ideas in a
policy framework in Figure 2.7.
Figure 2.7 introduces the policy framework for smallholder agriculture in Asia
developed from Thapa and Gaiha (2014). It shows two recent transformations in Asia.
The first transformation in agriculture is the growth of consumption and the production
of high-value commodities - The increase in incomes has led to a shift in food
consumption from grains and other staple crops to higher-value products. The second
is the transformation of the agrifood industry - processing, wholesale, and retail. The
participation of small farms in value chains and the supermarket revolution in the retail
sector are born likely to have a substantial impact on agricultural production (Thapa
and Gaiha 2014; Hazell and Rahman 2014).
Regarding challenges facing small farm, Thapa and Gaiha (2014) show that the decline
in the productivity growth of major crops such as rice or wheat is one of the main
concerns of policy makers in the Asian region. Consequently, diminishing returns in
grain production result in capital moving out of agriculture. Hazell and Rahman (2014)
also find that the displacement of cereal land for other crops or industrial development,
and rising costs of production relative to the low price of cereals has made cereal
production less profitable. In addition, degradation of the environment and land quality
are also emerging challenges resulting from the intensive intensification of cereal
production (e.g. three rice crop seasons per year). At the same time, smallholders in
Asia and the Pacific must also cope with the negative impact of climate change, which
may cause floods, and salt water intrusion threatening crop yield and the livelihoods of
farmers (World Bank 2008). Intensive mono-crop systems such as rice system are
causing deterioration of the soil and water (Ali and Byerlee 2002).
As regards land and tenure security, Thapa and Gaiha (2014) support equity-oriented land
reforms, which seems in contradiction to the problems of small and scattered landholdings.
Thapa and Gaiha use the argument developed by Lipton (2006), i.e. small farms tend to be
more productive than large farms because of the inverse relationship between farm size
and productivity. However, Otsuka et al. (2013) conclude that the agricultural sector in
Asia will lose its comparative advantage in the process of industrialisation, and increasing

33
part-time farming and wage rates if land reforms fail to expand farm size and reduce land
fragmentation. In order to deal with new challenges facing smallholders, Thapa and Gaiha
(2014) develop a system of policies which include two components: technical changes and
institutional innovations. However, these suggested policies mainly focus on maintaining
and supporting small farms. The experience of the agricultural transformation in East
Asian economies has revealed the importance of land reforms, crop diversification, the
development of the rural nonfarm economy, input subsidies, increasing public spending in
agricultural research, and rural infrastructure. Suphannachart and Warr (2011) find that
public investment in agricultural research and development has a positive and significant
impact on TFP growth. In addition, Haggblade et al. (2007) also find that more public
spending on rural infrastructure reduces transaction costs and attracts more investment in
agricultural production.
2.5 Concluding remarks
This chapter provides a review of both theoretical and empirical literature on
agricultural transformation in a land-poor and labour-abundant country during
industrialisation and rapidly economic structural change. In addition, it supports the
development of the analytical framework in this current thesis. There are two key
theoretical models that are examined. First, the Fei-Ranis dual economy model in a
labour-abundant country is helpful for understanding the effect of economic structural
transformation on the agricultural sector. The model implies that the transfer of labour
from agriculture to industry causes a reduction of agricultural output if rural wages
rise. Second, the Hayami-Ruttan model is examined. It allows technical changes and
institutional innovations to be endogenous in the process of the agricultural
transformation. These innovations are important in improving agricultural productivity
and transforming the agricultural sector in light of rapidly economic structural change
in rural areas.
In addition to theoretical models, the chapter discusses agricultural problems and the
evolutionary processes of the agricultural sector in a land-poor country by reviewing
the three agricultural problem model developed by Schultz (1978) and Hayami (2004
and 2007), and the evolutionary process of agricultural development in Asia by Otsuka
(2013 and 2015). This discussion implies that in the face of rising rural wages and
movement of farm labour into nonfarm sectors, the comparative advantage of
agriculture will decline if there is no expansion of farm size and land consolidation in
34
those land-poor countries at the middle-income stage. Therefore, the policy framework
emphasizes the development of nonfarm sectors, crop diversification, input support,
and land reforms, which are also the research topics of the thesis. The remaining parts
of the current thesis examine these themes empirically in the context of the Vietnamese
economy. The literature review related to topics and answers to research questions are
introduced in each key essay in the thesis.

35
Chapter 3
Agricultural reforms and structural transformation in
Vietnam since economic reforms in 1986
“Vietnam needs to adopt the seemingly paradoxical stance of giving a high priority to
raising agricultural productivity while recognizing that success can come only as
agriculture declines as an employer of labour”
(World Bank 2000, pp. 12)
3.1 Introduction
Vietnam started its economic reforms in 1986, and has transformed from a central
planning economy to market economy (Glewwe et al. 2004). Economic growth has
brought about great achievements in poverty reduction and rising income. There have
been many factors contributing to the economic success of Vietnam, and agricultural
reform played an important role. Minot and Goletti (1998), Benjamin and Brandt (2004),
and Dang et al. (2006) argue that agricultural reforms in the late 1980s contributed
greatly to raising both food production and rural households’ welfare. Further significant
structural reform toward an open, market-oriented economy was introduced in the
early 1990s with the emphasis of private sectors, foreign direct investment,
manufacturing sectors and export-oriented trade. During the period 2000-2005,
Vietnam’s economic reform emphasised the liberalisation of investment and foreign
trade. Since the joining the WTO in 2006, Vietnam has focused on macroeconomic
stability, restructuring the state-owned enterprises, public spending and agriculture.
While past achievements in the agricultural sector are impressive, there are still great
challenges ahead. Income disparity between regions and sectors has become an
increasing concern since 2000 (World Bank 2014b). The rising inequality parallels the
decline in agricultural growth (World Bank 2014b). In addition, Vietnam has been
experiencing rapid industrialisation and rising wages, both affect the lives and
livelihoods of millions of small farms (World Bank 2012). The developments of
nonfarm sectors, an increase in part-time farming and environment degradation have
36
put more pressure on Vietnam’s food security, with its emphasis on intensive rice
production based on small and fragmented landholdings in the whole country.
This chapter surveys the evolution of agricultural reforms in Vietnam since 1986. It
starts by examining a process of agrarian transformation that has swept through rural
Vietnam since the mid-1980s, resulting in the replacement of collectivized production
by household farming. A key theme of this chapter is the policy transition toward
ensuring the comparative advantage of agriculture, food security, and structural
changes. This analysis provides the policy setting for examining crop diversification,
nonfarm participation, and land reforms in the ensuing chapters. It also aims to provide
insight into smallholder Vietnamese farming in the face of industrialisation. It
discusses the effects of Doimoi (economic reform) for agricultural production and
structural changes, and outlines the development constraints, and current issues facing
smallholder agriculture in Vietnam.
The structure of this chapter is as follows. Section 3.2 presents the overview of
economic reforms, agricultural growth and structural transformation in rural Vietnam.
Section 3.3 discusses changes in land policies. The ‘rice first’ policy in Vietnam’s food
security strategy is examined in section 3.4. Section 3.5 evaluates the emerging trends
of the rural nonfarm economy. The next section evaluates current issues facing
smallholder agriculture in Vietnam and suggests relevant strategies. The final provides
concluding remarks on Vietnam’s agricultural reforms.
3.2 An overview of agricultural reforms, and structural transformation
Agricultural cooperatives dominated production activities in rural areas after the
Vietnam War, from 1975 to 1988. These cooperatives were responsible for providing
raw material inputs, land, and machinery to farm households according to agricultural
production plans. In addition, they also took responsibility for controlling market
functions, and selling products to the state at controlled prices (Athukorala 2009). In
1980, agricultural cooperatives covered 65.6 per cent of farm households in rural
Vietnam (Dieu 2006). However, this collective model failed to create working
incentives for farm households (Kompas 2004). Consequently, agricultural production
stagnated and the country had to import food during the late 1970s and 1980s. The
period 1976-80 revealed a bad situation for agriculture and for the whole economy.
Agricultural output grew at only 1.9 per cent annually - Vietnam imported 1.6 million
tons of food per year (Cuc and Tiem 1996). The shortage of food resulted in increasing

37
concerns among policy makers about the efficiency of collectivized agriculture
(Ravallion and van de Walle 2008).
As a result, in order to cope with increasing food insecurity, Directive 100 CT/TW,
issued in 1981 by the Central Council of Secretaries of the Vietnam Communist Party,
created great reforms in agricultural production. The government introduced a contract
system for agriculture, the same as the household responsibility system in China in
1978. This improved and extended the contract system for groups of farmers in
cooperatives. Food production thereby increased to 15 million tons and kept increasing
by 640,000 tons each year (GSO 1987 and 1991). Food imports reduced to 1 million
tons for the whole period 1981-1985 (Dieu 2006).
Although these agricultural reforms were successful in increasing food production in
the early 1980s, the reform lost its momentum amid renewed efforts by politicians to
enforce the collectivization of agriculture (Athukorala 2009). In 1986 and 1987,
Vietnam had to import 700,000 tons of food each year to cope with famine (Cuc and
Tiem 1996). Many did not obtain adequate outputs to pay duty for cooperatives (Dieu
2006). Collectivized agriculture was widely deemed a failure. Therefore, the situation
required a new policy to cope with a new situation. The decision to abandon
collectivization and central planning in favor of a market-based economy was
officially made in 1986.
In 1986, Vietnam announced the reform policy named Doimoi at the Sixth Party
Congress. It aimed to transform the Vietnamese economy from a command economy
into a market-oriented system. The economic reforms were implemented over three
interrelated stages. The first in the 1980s was a gradual reform to increase the
efficiency in agricultural and industrial production. Then, from the late 1980s onward,
the policy shifted from a planned economy toward a more market-driven economy. At
that stage, state-owned enterprises were exposed to more market disciplines. Trade and
investment regimes were gradually liberalised. The third stage was marked by
extensive liberalisation of trade and investment which began in the early 2000s.
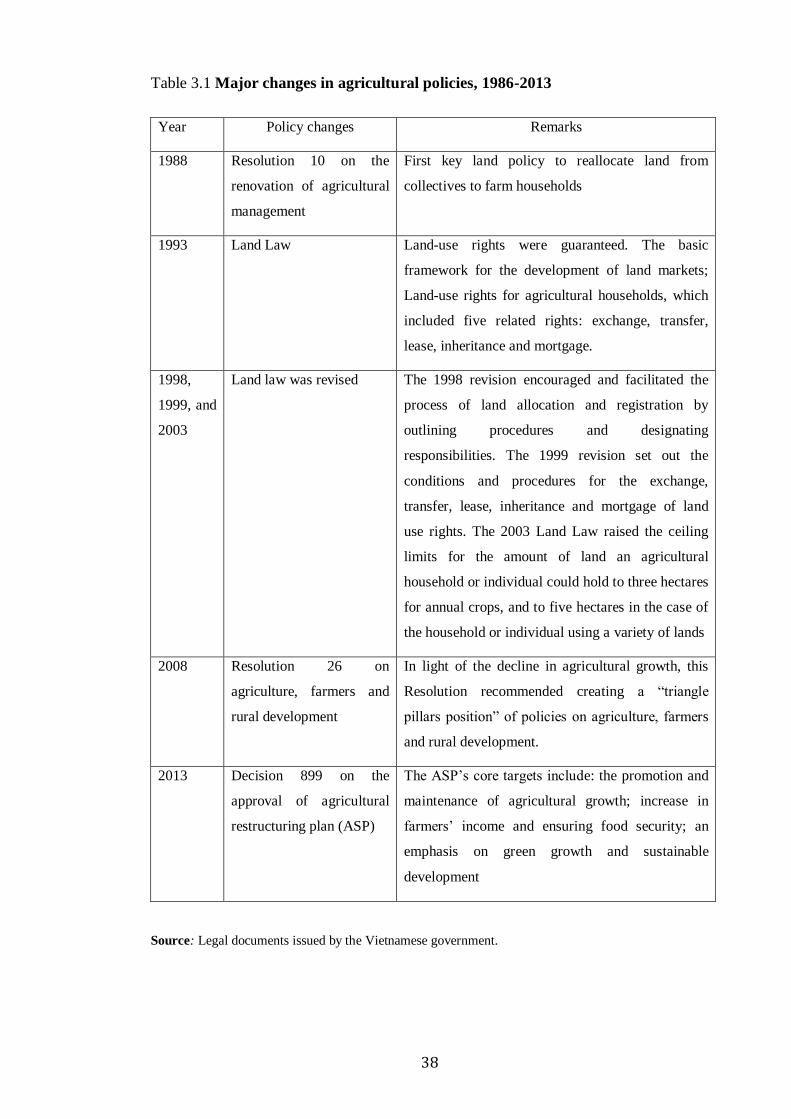
38
Table 3.1 Major changes in agricultural policies, 1986-2013
Year Policy changes Remarks
1988 Resolution 10 on the
renovation of agricultural
management
First key land policy to reallocate land from
collectives to farm households
1993 Land Law Land-use rights were guaranteed. The basic
framework for the development of land markets;
Land-use rights for agricultural households, which
included five related rights: exchange, transfer,
lease, inheritance and mortgage.
1998,
1999, and
2003
Land law was revised The 1998 revision encouraged and facilitated the
process of land allocation and registration by
outlining procedures and designating
responsibilities. The 1999 revision set out the
conditions and procedures for the exchange,
transfer, lease, inheritance and mortgage of land
use rights. The 2003 Land Law raised the ceiling
limits for the amount of land an agricultural
household or individual could hold to three hectares
for annual crops, and to five hectares in the case of
the household or individual using a variety of lands
2008 Resolution 26 on
agriculture, farmers and
rural development
In light of the decline in agricultural growth, this
Resolution recommended creating a “triangle
pillars position” of policies on agriculture, farmers
and rural development.
2013 Decision 899 on the
approval of agricultural
restructuring plan (ASP)
The ASP’s core targets include: the promotion and
maintenance of agricultural growth; increase in
farmers’ income and ensuring food security; an
emphasis on green growth and sustainable
development
Source: Legal documents issued by the Vietnamese government.

39
The most significant policy in the reform process for agriculture began earlier (Dang et
al. 2006). Agricultural reform milestones are summarized in Table 3.1. In 1988,
Resolution 10 was issued to meet the urgent needs of agricultural development. Farm
households had the right to use their agricultural land for 10 to 15 years, and were in full
control of the production process. The Resolution actually decollectivized agriculture.
The household became the primary producing entity instead of the cooperative. The
Resolution encouraged farmers to invest in agricultural production. Farm household
resources were mobilized. Farmers had taken the initiatives by adopting and exploiting
existing technical advances and infrastructure in order to improve agricultural
productivity (Dieu 2006).
The process of decollectivizing the agricultural system under Resolution 10 resulted in
a boost in agricultural output and improved living standards for farmers (Kompas
2004). The paddy equivalent output increased by 26 percent, rice yields rose by 30 per
cent from 1988 to 1992. Rice production reached 21.44 million tonnes in 1989 and 25
million tonnes in 1995. Vietnam started to export 1.4 million tonnes of rice in 1989
(Nguyen 2003). As a result, from a country running food shortage, Vietnam has
become one of the leading rice exporters of the world (Fforde and Seneque 1995, p.
108; Glewwe et al. 2004).12 The success of land reforms brought new opportunities for
rural development, providing farm households with significant incomes and improving
the living standard of farmers (Kerkvliet 2006).
12The overview of rice production will be discussed in details in Section 3.4 in this chapter.

40
Figure 3.1 Growth rate in GDP and the main sectors, Vietnam 1986-2007 (per cent
per year)
Source: General Statistics Office (GSO), 2002, 2003, 2008, and 2009b, The Statistical Yearbooks, The
Statistics Publishing House, Hanoi.
In addition to Resolution 10, the Land Law 1993 and the Decree 64 issued in 1993 also
allocated agricultural land to farmers in long-term, and provided farmers with five rights
of land use including the rights of transfer, exchange, lease, inheritance and mortgage.
As a result, Kompas (2004) and Dang et al. (2006) show that land and market reforms in
Vietnam induced farmers to work harder and provided more incentive to invest in land,
in spite of the relatively modest growth of most inputs, and little or no technological
change. The resulting surplus in agricultural production promoted the expansion of
manufacturing sectors and urbanisation. Moreover, these trends were consolidated with
the role of enterprise laws, foreign direct investment, and foreign trade. With significant
agricultural and market institutional reforms, Vietnam became a middle-income country
by 2010 (World Bank 2011a).
Although there was a fluctuation in Vietnam’s growth rates, the GDP of the economy
grew at nearly 7 per cent per annum from 1990 to 2007 (Figure 3.1). In the early reform
period, annual GDP growth rates increased considerably, from 4.3 per cent in 1986-1989
to 7.3 per cent during 1990-1994. There were different trends of sectoral growth rates.
Institutional reforms such as land and markets were the main sources of agricultural
growth in the early reform period (Kompas 2004; Dang et al. 2006; Benjamin and
-4
-2
0
2
4
6
8
10
12
14
16
1986 1987 1988 1989 1990 1991 1992 1993 1994 1995 1996 1997 1998 1999 2000 2001 2002 2003 2004 2005 2006 2007
GDP Agriculture Manufacture Service

41
Brandt 2004). The agricultural growth facilitated the successful transformation of
Vietnam’s economy. As can be seen in Figure 3.1, agriculture was a stabilizing factor in
economic growth over the whole period, particularly during the initial period of
economic reform and the Asian financial crisis in the late 1990s. Since 1999, however,
agricultural growth has shown a tendency to decline. It reduced to 3.7 per cent per year
in the period 2000-2005 and down further to 2.3 per cent in 2007 (see Figure 3.1).
From their examination, Dang et al. (2006) find that the increase in input usage of land,
labour and fertilizer explains the growth. However, input usage appears to be reaching
its limit for generating more growth. Other studies of Vietnamese agriculture find that
land fragmentation is one of main reasons for the reduction of agricultural growth as the
incentives lost their impact (Hung et al. 2007; Kompas et al. 2012). Otsuka (2013)
argues that the advantages of smallholder agriculture disappear if the wage rate
increases. However, the extent of the decline in the comparative advantage of agriculture
will be subject to the pace of farm size expansion and land consolidation. The World
Bank (2006) shows that compared with other regional countries, land fragmentation and
small landholding are the main contributors to Vietnam’s lower productivity compared
with regional countries. In addition to land constraints, rapid structural transformation is
another of key reason for the declining trend of agricultural growth in Vietnam (World
Bank, 2008).
As regards structural transformation in Vietnam since the Doi Moi in 1986, Figures 3.2
and 3.3 illustrate the trends of structural changes. The share of agriculture in GDP
increased from 38.1 per cent in 1986 to 46.3 per cent in 1988, and then reduced
continuously to approximately 18.7 per cent in 2007 (Figure 2.3). Similarly, the
agricultural sector employed over 70 per cent of the labour force in 1990. The share of
employment fell to 51.7 per cent in 2007, while the shares of employment in the
manufacturing and service sectors increased from 11.6 and 15.8 per cent in 1990 to 30
and 18.3 per cent in 2007, respectively (Figure 2.4). Employment in the agricultural
sector has declined rapidly since 2002.

42
Figure 3.2 Shares of GDP by sectors, Vietnam, 1986-2007 (per cent)
Source: General Statistics Office (GSO), 2002, 2006, 2008, 2009b and 2010.
The structural transformation reflects a common trend found in the industrialization process
of developing countries in the past decades. The World Bank (2014b) concludes that
Vietnam has undergone a fundamental structural transformation in the past 25 years with a
shift of employment from agriculture to wage employment in manufacturing, construction
and services. However, more than 60 per cent of the total labour force worked in the
agricultural sector in 2007 (GSO 2012). In the latest GSO’s agricultural census in 2011,
there were over 10 million farm households in the whole country. Thus, the agricultural
sector still plays an important role in the livelihood of millions of farm households.
Figure 3.3 Shares of employment by sectors, Vietnam, 1986-2007 (per cent)
Source: General Statistics Office (GSO), 2002, 2006, 2008, 2009b and 2010.
0
5
10
15
20
25
30
35
40
45
50
1986 1987 1988 1989 1990 1991 1992 1993 1994 1995 1996 1997 1998 1999 2000 2001 2002 2003 2004 2005 2006 2007
%
Agriculture Manufacture Service
0
10
20
30
40
50
60
70
80
1990 1991 1992 1993 1994 1995 1996 1997 1998 1999 2000 2001 2002 2003 2004 2005 2006 2007
%
Agriculture Manufacture Service
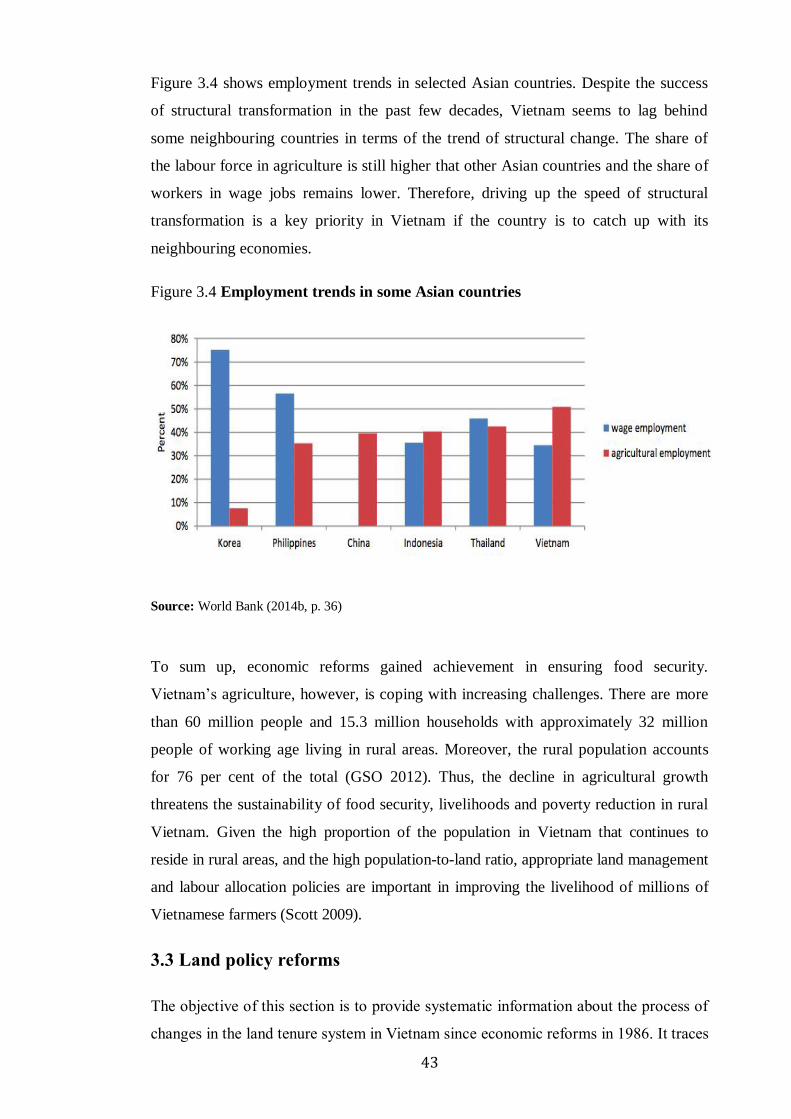
43
Figure 3.4 shows employment trends in selected Asian countries. Despite the success
of structural transformation in the past few decades, Vietnam seems to lag behind
some neighbouring countries in terms of the trend of structural change. The share of
the labour force in agriculture is still higher that other Asian countries and the share of
workers in wage jobs remains lower. Therefore, driving up the speed of structural
transformation is a key priority in Vietnam if the country is to catch up with its
neighbouring economies.
Figure 3.4 Employment trends in some Asian countries
Source: World Bank (2014b, p. 36)
To sum up, economic reforms gained achievement in ensuring food security.
Vietnam’s agriculture, however, is coping with increasing challenges. There are more
than 60 million people and 15.3 million households with approximately 32 million
people of working age living in rural areas. Moreover, the rural population accounts
for 76 per cent of the total (GSO 2012). Thus, the decline in agricultural growth
threatens the sustainability of food security, livelihoods and poverty reduction in rural
Vietnam. Given the high proportion of the population in Vietnam that continues to
reside in rural areas, and the high population-to-land ratio, appropriate land management
and labour allocation policies are important in improving the livelihood of millions of
Vietnamese farmers (Scott 2009).
3.3 Land policy reforms
The objective of this section is to provide systematic information about the process of
changes in the land tenure system in Vietnam since economic reforms in 1986. It traces

44
the major land issues facing farm households and policy makers by looking at changes
in the land tenure system. The study then explores the land allocation process, and
discusses the problems of small landholdings and land fragmentation.
3.3.1 Changes in the land tenure system
From 1986 to 1992, Vietnam mainly focused on the privatization of land use rights. In
April 1988, Resolution 10 on the renovation of agricultural economic management was
issued. Farm households replaced the dominant role of collectives as agricultural land
was reallocated from collectives to farms. Land, however, still belonged to all people
under the state’s management. The state also assigned land use rights from collectives
to farmers. This land policy gave farmers greater ‘production rights’, including the
right to sell their products (Marsh et al. 2006). Decollectivization process was
completed in 1992. Land use rights were finally allocated to farm households and were
non-transferable, which resulted in posing constraints on the full liberalisation of
agriculture and inefficient land use management (Le Cao Doan 1995). Therefore, the
next land policy reform strengthened the development of the land-use rights market by
issuance of a new land law in 1993.
As discussed earlier, the 1993 land law guaranteed long-term land use rights for farm
households which included five related rights: exchange, transfer, and lease, inherit
and mortgage. These rights were valid within the contracted period. Moreover, this law
increased tenure security over the land allocated. Land users were granted a formal
certificate of land-use rights. The long-term contract periods were 20 years for annual
crops and 50 years for perennial crops, and the period could be extended. This law also
set up a ceiling on the amount of land to be distributed to agricultural households. For
annual crops, the limit was two hectares in the Central and Northern provinces and
three hectares in the Southern provinces, and ten hectares for perennials.
The land law was revised in 1998, 1999 and 2003. The 1998 revision moved a step
further toward ensuring the rights and obligations of farm households; strengthening
land transactions; and registration. It also added the land-use right as a capital
contribution for joint investments. The revised 1998 land law dictated that every
transaction related to changes of land needs to be officially approved by local
authorities. This includes reshaping land plots, changing the land tenure rights, using
land as a mortgage at banks for borrowings, altering the land use duration, and
subleasing land. The land law revision in 1999 showed the conditions and procedures for
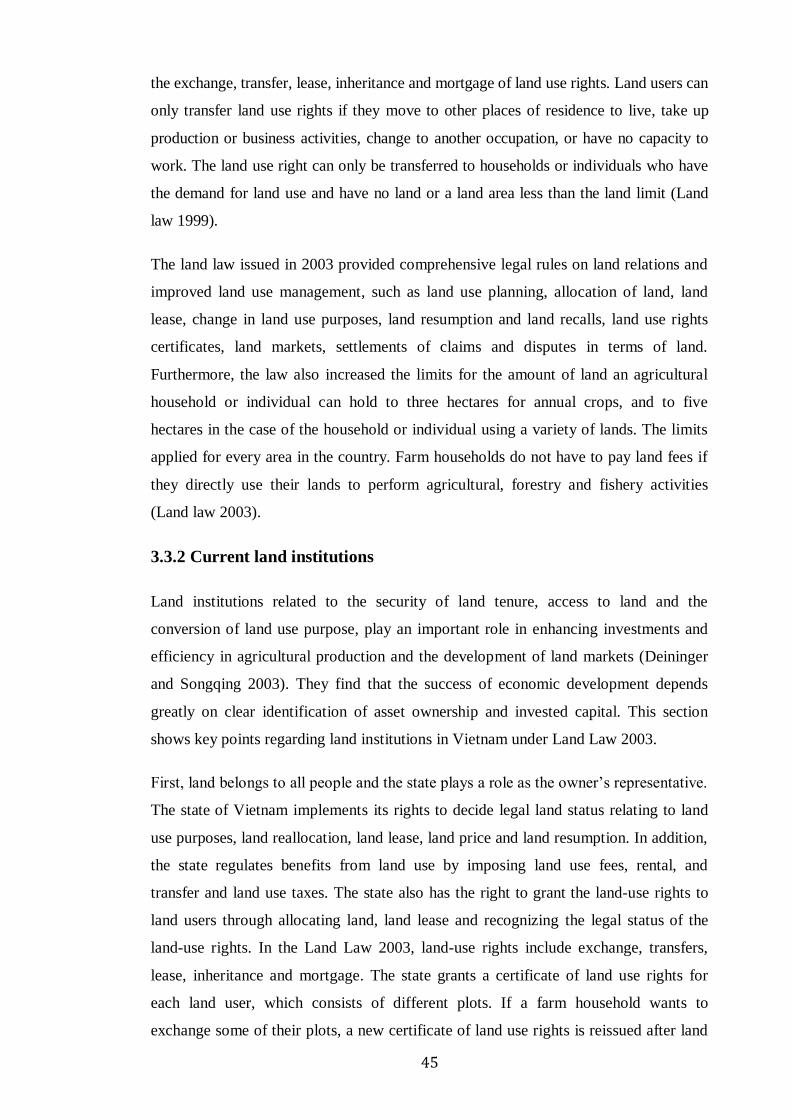
45
the exchange, transfer, lease, inheritance and mortgage of land use rights. Land users can
only transfer land use rights if they move to other places of residence to live, take up
production or business activities, change to another occupation, or have no capacity to
work. The land use right can only be transferred to households or individuals who have
the demand for land use and have no land or a land area less than the land limit (Land
law 1999).
The land law issued in 2003 provided comprehensive legal rules on land relations and
improved land use management, such as land use planning, allocation of land, land
lease, change in land use purposes, land resumption and land recalls, land use rights
certificates, land markets, settlements of claims and disputes in terms of land.
Furthermore, the law also increased the limits for the amount of land an agricultural
household or individual can hold to three hectares for annual crops, and to five
hectares in the case of the household or individual using a variety of lands. The limits
applied for every area in the country. Farm households do not have to pay land fees if
they directly use their lands to perform agricultural, forestry and fishery activities
(Land law 2003).
3.3.2 Current land institutions
Land institutions related to the security of land tenure, access to land and the
conversion of land use purpose, play an important role in enhancing investments and
efficiency in agricultural production and the development of land markets (Deininger
and Songqing 2003). They find that the success of economic development depends
greatly on clear identification of asset ownership and invested capital. This section
shows key points regarding land institutions in Vietnam under Land Law 2003.
First, land belongs to all people and the state plays a role as the owner’s representative.
The state of Vietnam implements its rights to decide legal land status relating to land
use purposes, land reallocation, land lease, land price and land resumption. In addition,
the state regulates benefits from land use by imposing land use fees, rental, and
transfer and land use taxes. The state also has the right to grant the land-use rights to
land users through allocating land, land lease and recognizing the legal status of the
land-use rights. In the Land Law 2003, land-use rights include exchange, transfers,
lease, inheritance and mortgage. The state grants a certificate of land use rights for
each land user, which consists of different plots. If a farm household wants to
exchange some of their plots, a new certificate of land use rights is reissued after land

46
transactions. Notably, land use rights are considered commodities in the land market.
The state intervenes in that market through setting land prices, and controlling the
registration of transactions of land use rights
Second, the Land Law 2003 states the terms of allocation and lease of agricultural
land. The land leases for annual and perennial crops are 20 years and 50 years,
respectively. In addition, the state also limits landholdings. For annual crops, the limit
is set at three hectares for Southern provinces and two hectares for Northern provinces.
When the terms of the land lease end, the state reallocates the agricultural land to
households, and grants new certificates of land use rights. Finally, the government
imposes restrictions on change of purpose, particularly paddy land. If farm
households’ wish to changing land use purpose from paddy to other crops, they must
receive approval from local authorities at both the communal and district levels.
3.3.3 Land fragmentation
The first land policy reforms in the late 1980s have contributed to the success of the
Vietnamese agriculture and lifted millions households out of poverty over the past decades
(Dang et al. 2006). They have, however, resulted in a number of land issues, including
small landholdings and land fragmentation. The most important principle of the land
reallocation from cooperatives to households in the first wave of land reform was that land
reallocation was to be based on egalitarian principle (Ravallion and van de Walle 2008;
Hung et al. 2007). Scott (2009) shows that the egalitarian distribution of land was
considered a necessity to avoid disputes and to curb the influx of rural migrants to the
cities. Consequently, each household was reallocated some plots in different areas, based
on the different qualities of the field plots, as well as access to water sources or other
infrastructure. According to Resolution 10 in 1988, plots that were homogenous in quality
were grouped into one land class within a village. If there was no consensus between
farmers, a land class could be further divided into more subclasses. Based on this
principle, land area under each class and subclass was allocated to each household. The
land reallocation process has been remarkably equitable (Ravallion and van de Walle
2004). But this equality – along with the use of family size to determine the number of
plots allocated – has resulted in serious land problems. Also, the process of demographical
changes also led to increasing land fragmentation (Marsh et al. 2006).

47
Table 3.2 Land fragmentation in Vietnam, 2010
Regions Number of operated
plots (mean)
Number of operated
plots (median)
Sum of home to
plot distances
(meters)
Northern lowlands 5.5 5 4,034
Northern highlands 5.5 5 9,602
Central highlands 5.4 3 6,066
Southern lowlands 3.7 3 2,828
Total 4.7 4 4,766
Source: Markussen et al. (2013)
In the whole country, there are estimated to be between 75 and 100 million parcels, an
average of seven to eight plots per farm household (Vy 2002). Average rural farm
households have 6.5 plots of land in the north and 3.4 plots in the south (World Bank
2006). There has been no official survey on land fragmentation in Vietnam in the whole
country and there is no data on the number of plots per farm household in the
agricultural censuses in 2006 and 2011. According to Markussen et al. (2013), the
average distance from homes to paddy fields was 4.76 km. The average number of plots
per household was 4.7 in 2010 (Table 3.2).
Concern about scattered land holdings has emerged since the late 1990s (MARD 2002;
Research Institute of Agricultural Planning 2004). Land consolidation programs have
been considered as a strategy to maintain food security and support rural
industrialization. 13 The government issued Directive 10, a policy intended to
encourage the plot exchange programs in 1998. According to this policy, farm
households voluntarily transferred their land-use rights or exchanged their plots. Based
on demand, local authorities required farmers to register for land consolidation and
issued new land-use rights certificates. However, the effectiveness of this policy has
been low due to increasing interest conflicts and transaction costs (Thinh 2009).
Furthermore, in order to carry out the land consolidation programs successfully and
balance all benefits and costs, all farmers were required to be involved in all stages of
the program, which was time consuming and costly (Thinh 2009). Through the whole
country, there were only nearly 700 communes in 20 provinces where plot exchange
13The reduction of land fragmentation is a key strategy in the Communist Party’s Resolution No. 26-
NQ/TW (2008) on agriculture, farmers and rural development in Vietnam. In this resolution, the
government emphasised the role of land consolidation and the slow progress due to rising corruption
and cumbersome procedure.

48
programs were implemented (MARD 2002). OECD (2015) also shows that in rural
Vietnam, the process of land consolidation of crop production is at very early stages.
In addition, Hung et al. (2007) argue that the reduction of land fragmentation through the
promotion of the voluntary exchange of plots between farmers is a narrow policy
approach, compared to policies favouring the development of land markets such as
enhancing land use rights and reducing restrictions on land transfers and transaction costs.
Moreover, the plot exchange programs in rural Vietnam are based on some principles such
as voluntarism, equity, transparency, and proactive participation of local authorities (Tran
2006). This method of land consolidation requires close coordination among a large
number of households and plots. As a result, it takes time and efforts to achieve consent
among all members. This process is likely to cause interest conflicts if land governance is
weak (Palmer et al. 2009). This is one of the challenges facing voluntary land
consolidation programs. It also explains the difficulties in land consolidation in rural
Vietnam (Tran 2006). In addition, Marsh et al. (2006) show that land can be consolidated
through plot transactions in the land markets. Nevertheless, the impact of land markets on
the process of land consolidation is unclear. The market for the exchange of land use rights
in Vietnam is still imperfect, despite the revisions of recent land law. Moreover, the
government still controls agricultural land prices, and high transaction costs have restricted
transactions in land markets (World Bank 2003 and 2006).
It has also been reported that many land transfers occurred illegally both before and
after the 1993 Land Law (Do & Iyer 2003; Humphries 1999; Kerkvliet 2000; World
Bank 2003). One main reason given for these illegal transactions is the costs associated
with registering land use right transfers. Deininger and Songqing (2003) argue that the
lack of a well-functioning credit market and appropriate safety nets in rural areas also
affected the development of land use right markets. Ravallion and van de Walle (2004)
state that a more active land rental market has not emerged since 1988. Similarly,
Dang et al. (2006) conclude that land markets have failed to develop strongly, and high
land rental rates may discourage investments by farmers. Furthermore, despite the
improvement in land tenure security and increasing off-farm employment
opportunities, farmers only rent out or sell their land if they are safe to rely on salaried
jobs (Ravallion and van de Walle 2008). World Bank (2006) concluded that
underdeveloped rural land markets pose obstacles for further productivity gains and
labour mobility toward the higher nonfarm wage employment. Therefore, the problem
of land fragmentation must be solved within the overall context of national policy. A

49
further land reform that encourages the development of land market is one possible a
relevant strategy for reducing land fragmentation in Vietnam in the future.
3.3.4 Small landholdings
This thesis mainly focuses on land for annual crops. In 2011, the number of farm
households using land for annual crops was nearly 10.3 million, accounting for 86.6
per cent of total households using agricultural production land in rural Vietnam. The
number of households using under 1 hectare of land makes up 88.23 per cent of total
households using land for annual crops. The average land area for annual crops per
household was 0.62 hectare (GSO 2012). Farm sizes change throughout the country,
but they are small and fragmented.
As regards paddy land, there are nearly 9.3 million households using paddy land,
representing 90.29 per cent of total households producing annual crops and 77.6 per cent
of total households using agricultural production land in 2011. On average, each farm
household uses 0.44 hectares of paddy land. This area hardly changed in the period 2006-
2011 (GSO 2012). As can be seen in Table 3.3, the majority of farm households have very
small farms. Moreover, 85 per cent of total households using paddy land have a farm size
of less than 1 hectare. Hazell and Rahman (2014) define smallholders as farms operating
less than 2 hectares of land area, and using this definition, Vietnam is maintaining
smallholder agriculture, particularly rice production with labour-intensive farming.
Table 3.3 The structure of households by scale of use of land for paddy farming,
2006 and 2011
2006 2011
< 0.2 ha
From 0.2
to under
0.5 ha
From 0.5
to under 2
ha
2 ha
and
over
< 0.2
ha
From 0.2
to under
0.5 ha
From
0.5 to under2
ha
2 ha
and
over
Whole country 47.2 36.8 13.6 2.4
50.04 34.79 12.9 2.27
Red River Delta 63.2 34.8 2
64.84 33.19 1.94 0.03
North and Mountainous
areas 49.75 36.45 13 0.8
58.12 33.48 7.94 0.46
North and Central Coast 54.25 39.7 6.05
53.43 39 7.36 0.21
Central Highlands 36.3 40.6 22 1.1
37.83 40.68 20.39 1.1
South East 16.1 42.6 37.8 3.5
12.37 40.06 42.01 5.56
Mekong River Delta 7.7 30.7 47.9 13.7
8.49 29.87 48.2 13.44
Source: GSO (2007 and 2012)

50
3.4 Food security and the ‘rice first’ policy in smallholder agriculture
Food security has been one of the most important targets that concerned policy makers
in Vietnam. Since the famines during 1970s and early 1980s, Vietnam has
implemented many reforms to sustain rice self-sufficiency, achieved by explicitly
controlling rice land and adopting the ‘rice first’ policy. Food security is directly
related to land policy. In Vietnam, food security always means rice self-sufficiency,14
and the Government of Vietnam issued policies to maintain rice-growing land aimed at
firmly ensuring national food security.15 Thus, Vietnam’s food security policy is also
directly linked to the ‘rice first’ policy.
Rice is the most important crop in Vietnam’s agricultural production. Most of the
production comes from family-operated small-scale farms. The rice growing area in
2011 was 4.1 million hectares, accounting for 43.77 per cent of total agricultural land
and 65 per cent of annual cropping land (GSO 2012); and the number of rice-growing
households was nearly 9.3 million, which represents 77.6 per cent of total households
using agricultural production land and 86.7 per cent of total annual crop farm
households. The paddy land area was only 0.44 ha per household on average in 2011
(GSO 2012). Rice output of farm households accounts for 75 per cent of total
household annual crops in terms of quantity and over 78 per cent in value (Kompas et
al. 2012).
14 This view can be seen in Resolution 09/NQ-CQ on “Some policies and measures to promote
distribution of agricultural products”, issued by the Government of Vietnam on June the 15th, 2000. 15 The issue of keeping paddy land, and restrictions on converting paddy land, has received great
attention among Vietnam’s policy makers and evidenced in a large variety of policies. The most
important policy related to paddy land is Resolution 26/NQ/TW on agriculture, farmers and rural
development, issued on August 5th, 2007. Resolution 26 states that proper land for rice cultivation must
be maintained. In addition, Under Article 74 of 2003 Land Law, rice producers are prohibited from converting land use purposes without the permission of relevant government officials. The conversion
of paddy land must be approved by land use planning regulations from communal level to provincial
level. Other policies include Resolution 63 in 2009 on ensuring national food security, and Decree 42
(2012) on management and use of rice land.
51
Figure 3.5 The growth rate of rice output in Vietnam, 1986-2014 (per cent)
Source: Calculated from GSO (2002, 2006, 2008, 2014)
Since the economic reforms of 1986, food security policies have mainly focused on
how to increase the supply of rice, particularly keeping paddy land stable and
restricting their conversion to other crops and nonfarm activities. There is little doubt
that the increase in rice output has been remarkable since the first wave of land
reforms in the late 1980s and early 1990s (Kompas 2004). The growth rate of rice
output shows an average annual increase of 3.64 per cent (Figure 3.5). After the main
land reforms in 1988 and 1993, the average growth of rice output was 5.23 per cent in
the period 1986-1999. However, since then the effect of the first wave of land reforms
has been diminishing with an average growth rate in 2000-2014 of 2.25 per cent. It
should be noted that for the country as a whole, there was a decline in the growth of
rice output for 1986-2014.
The significant achievements in rice production have ensured national food security -
Vietnam has sustained rice surpluses for export since 1988, at an average of about 10
per cent of total production per year. In 2011, Vietnam exported over 7 million tons of
rice, with the total revenue of USD 3.7 billion (World Bank 2012). Despite large
annual rice exports, many households still do not have physical, social or economic
access to sufficient, safe and nutritious food to meet their dietary needs. Moreover, 20
per cent of Vietnamese children under five were underweight in 2007. Poor
households are vulnerable to shocks and have become food insecure (FAO 2004).
-10
-5
0
5
10
15
20
1986
1987
1988
1989
1990
1991
1992
1993
1994
1995
1996
19
97
1998
1999
20
00
2001
2002
20
03
2004
2005
2006
2007
2008
2009
2010
2011
2012
2013
2014

52
Figure 3.6 Margin proportion earned by rice farmers in the Mekong River Delta
(per cent)
Source: Tran et al. (2013)
In addition, smallholder rice farmers are struggling to survive and are diversifying
their livelihoods in light of low incomes and the increasing cost of rice production
(Minot et al. 2006). Figure 3.6 shows the average margin proportion earned by rice
farmers in the largest rice-growing region in Vietnam.16 The margin proportion in
rice production reduced from 70 per cent in 2006 to 10 per cent in 2010. One of the
reasons for low margins had been the rapid increase in rice production costs. As can
be seen in Figure 3.7, fertiliser and hired labour costs represent 46.5 and 33.1 per
cent of total production cost for rice in 2010, respectively. World Bank (2012) shows
that the rice policy has failed to produce a main income for rice growers, in spite of
the fact that rice farmers spend most of their time and effort on rice production. The
average share of rice income in total income only accounts for 20 per cent in farms
of less than 0.5 hectare.
16According to Tran et al. (2013), the margin in rice production is calculated by taking farm-gate price
minus production costs.
70
23
10
0
10
20
30
40
50
60
70
80
2006 2008 2010

53
Figure 3.7 Rice production costs in the Mekong River Delta (1000 VND per
hectare)
Source: FAO (2010)
Similarly, Table 3.4 shows that farmers with small landholdings in the Mekong River
Delta earned little money from rice production. Income per capita per month from rice
for households with farm size less than 2 hectares was below the official rural poverty
line (VND 400,000 per capita monthly in 2009). In order to encourage farm
households to produce rice, the government of Vietnam supported the rice sector by
price support, procurement policies and input subsidies (World Bank 2012; Tran et al.
2013). These massive attempts to support the rice sector have put more pressure on
state budgets in light of increasing fiscal stress.
The increasing share of hired labour cost in labour-intensive smallholder agriculture is
one of challenges for rice farmers when rural wages increase, and small rice farms may
respond to increasing fiscal stress by abandoning paddy fields. More recently, there has
been an increasing trend to abandon paddy fields, particularly in small farms.17 This
emerging problem has concerned Vietnamese policy makers because it will threaten
national food security. Taylor and Lybbert (2015) explains that idle remaining land
when leaving farms is due to high costs of registering transfers and low profits in farm
production. Up to now, there is no study on this trend. Otsuka (2013) shows that the
comparative advantage of agriculture in East Asia countries has lost due to rapid
17 In 2013, 42,785 families left over 6,882 hectares of fields untouched. Moreover, 3,407 families returned over 433 hectares of land to the local government. Some farmers state that the income they
receive from growing rice has shrunk. A few hundred square meters of land can only provide them with
an average of $2.37 to $3.79 a month.
(http://thediplomat.com/2013/12/vietnamese-rice-farmers-abandon-their-fields/; www.mard.gov.vn)
0
2000
4000
6000
8000
10000
12000
14000
16000
18000
2006 2008 2010
Hired labor cost
Other cost in cash
Irrigation cost
Pesticide
Fertilizer
Seed
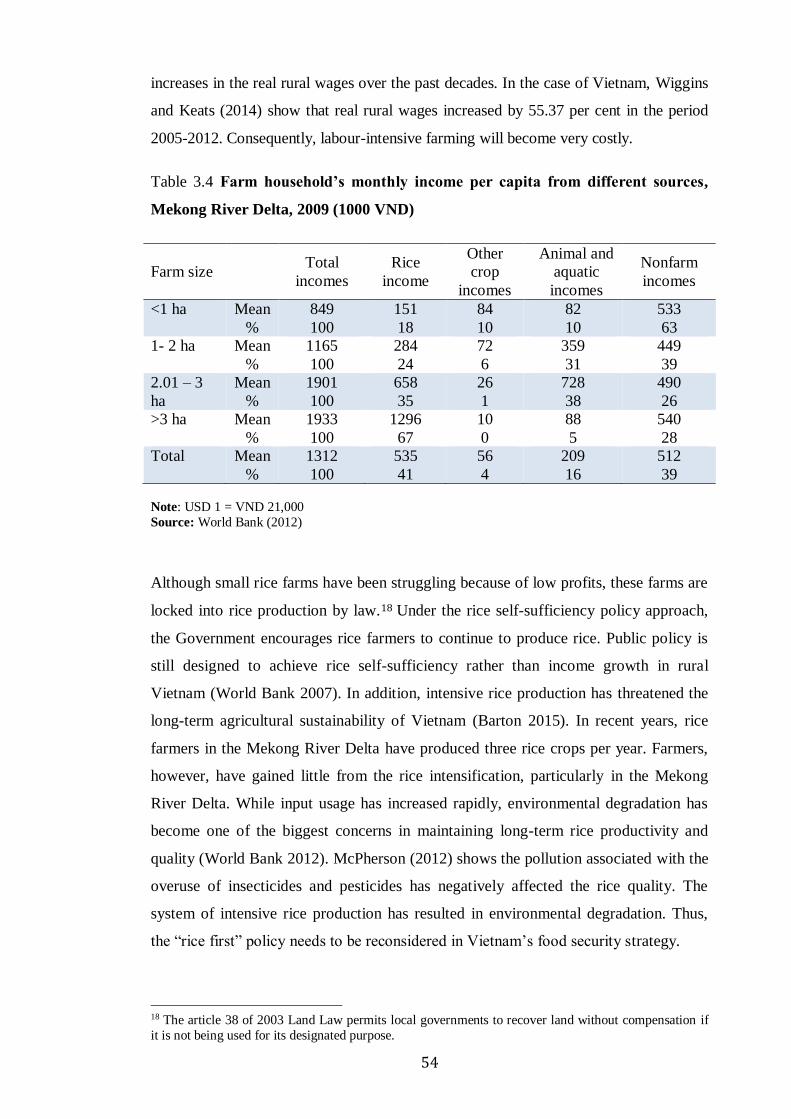
54
increases in the real rural wages over the past decades. In the case of Vietnam, Wiggins
and Keats (2014) show that real rural wages increased by 55.37 per cent in the period
2005-2012. Consequently, labour-intensive farming will become very costly.
Table 3.4 Farm household’s monthly income per capita from different sources,
Mekong River Delta, 2009 (1000 VND)
Farm size Total
incomes
Rice
income
Other
crop
incomes
Animal and
aquatic
incomes
Nonfarm
incomes
<1 ha Mean
%
849
100
151
18
84
10
82
10
533
63
1- 2 ha Mean
%
1165
100
284
24
72
6
359
31
449
39
2.01 – 3
ha
Mean
%
1901
100
658
35
26
1
728
38
490
26
>3 ha Mean
%
1933
100
1296
67
10
0
88
5
540
28
Total Mean
%
1312
100
535
41
56
4
209
16
512
39
Note: USD 1 = VND 21,000
Source: World Bank (2012)
Although small rice farms have been struggling because of low profits, these farms are
locked into rice production by law.18 Under the rice self-sufficiency policy approach,
the Government encourages rice farmers to continue to produce rice. Public policy is
still designed to achieve rice self-sufficiency rather than income growth in rural
Vietnam (World Bank 2007). In addition, intensive rice production has threatened the
long-term agricultural sustainability of Vietnam (Barton 2015). In recent years, rice
farmers in the Mekong River Delta have produced three rice crops per year. Farmers,
however, have gained little from the rice intensification, particularly in the Mekong
River Delta. While input usage has increased rapidly, environmental degradation has
become one of the biggest concerns in maintaining long-term rice productivity and
quality (World Bank 2012). McPherson (2012) shows the pollution associated with the
overuse of insecticides and pesticides has negatively affected the rice quality. The
system of intensive rice production has resulted in environmental degradation. Thus,
the “rice first” policy needs to be reconsidered in Vietnam’s food security strategy.
18 The article 38 of 2003 Land Law permits local governments to recover land without compensation if
it is not being used for its designated purpose.
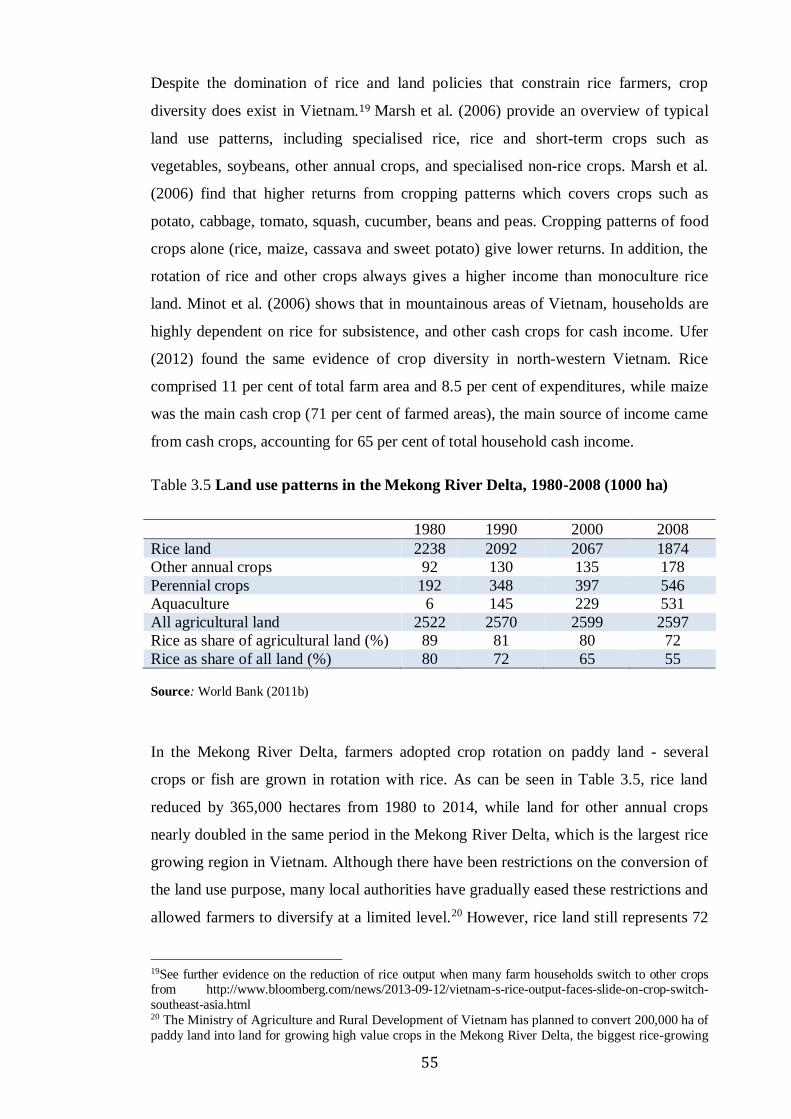
55
Despite the domination of rice and land policies that constrain rice farmers, crop
diversity does exist in Vietnam.19 Marsh et al. (2006) provide an overview of typical
land use patterns, including specialised rice, rice and short-term crops such as
vegetables, soybeans, other annual crops, and specialised non-rice crops. Marsh et al.
(2006) find that higher returns from cropping patterns which covers crops such as
potato, cabbage, tomato, squash, cucumber, beans and peas. Cropping patterns of food
crops alone (rice, maize, cassava and sweet potato) give lower returns. In addition, the
rotation of rice and other crops always gives a higher income than monoculture rice
land. Minot et al. (2006) shows that in mountainous areas of Vietnam, households are
highly dependent on rice for subsistence, and other cash crops for cash income. Ufer
(2012) found the same evidence of crop diversity in north-western Vietnam. Rice
comprised 11 per cent of total farm area and 8.5 per cent of expenditures, while maize
was the main cash crop (71 per cent of farmed areas), the main source of income came
from cash crops, accounting for 65 per cent of total household cash income.
Table 3.5 Land use patterns in the Mekong River Delta, 1980-2008 (1000 ha)
1980 1990 2000 2008
Rice land 2238 2092 2067 1874
Other annual crops 92 130 135 178
Perennial crops 192 348 397 546
Aquaculture 6 145 229 531
All agricultural land 2522 2570 2599 2597
Rice as share of agricultural land (%) 89 81 80 72
Rice as share of all land (%) 80 72 65 55
Source: World Bank (2011b)
In the Mekong River Delta, farmers adopted crop rotation on paddy land - several
crops or fish are grown in rotation with rice. As can be seen in Table 3.5, rice land
reduced by 365,000 hectares from 1980 to 2014, while land for other annual crops
nearly doubled in the same period in the Mekong River Delta, which is the largest rice
growing region in Vietnam. Although there have been restrictions on the conversion of
the land use purpose, many local authorities have gradually eased these restrictions and
allowed farmers to diversify at a limited level.20 However, rice land still represents 72
19See further evidence on the reduction of rice output when many farm households switch to other crops from http://www.bloomberg.com/news/2013-09-12/vietnam-s-rice-output-faces-slide-on-crop-switch-
southeast-asia.html 20 The Ministry of Agriculture and Rural Development of Vietnam has planned to convert 200,000 ha of
paddy land into land for growing high value crops in the Mekong River Delta, the biggest rice-growing

56
per cent of agricultural land in the region in 2008 (World Bank 2011b). Similarly, the
FAO (2010) estimates that the paddy/fish rotation in the biggest rice-growing region in
Vietnam has earned VND 40-45 million per hectare per year and a profit of VND 20-
25 million per hectare compared with profit of VND 8-10 million per hectare from
only rice production. At the same time, in the rice/vegetables rotation, households that
grow crops after harvesting winter-spring paddy crop and before planting the summer-
autumn paddy crop can earn an annual income of VND 30-70 million per hectare and
profits of VND 15-40 million. As a result, there has been increasing debate on
redesigning Vietnam’s food security policies, such as easing restrictions on the
conversion of crops, and permitting the reduction of paddy land.
3.5 The development of the rural nonfarm economy
There has been growing concern about the livelihood of rice farmers and the poor in rural
Vietnam. One prominent and widely discussed policy is livelihood diversification into the
nonfarm economy. The development of the rural nonfarm economy has become one of the
most important factors in light of the declining trend in agricultural production in Vietnam.
Van de Walle and Cratty (2004) find that the incidence of farm-only household decreased
from 75 per cent to 52 per cent between 1993 and 1998. This means that the incidence of
households that are involved in at least one nonfarm activity increased to make up nearly
half of all rural households within this five-year period. World Bank (2006) highlights an
increasing share of nonfarm activities in rural employment and household incomes, though
the incidence of nonfarm employment greatly varies across the country.
region in Vietnam. In addition, other rice growing regions have also begun crop conversion
(www.mard.gov.vn).

57
Figure 3.8 Vietnam’s employment shift from agriculture to non-agriculture
Source: World Bank (2014, p. 12)
As can be seen in Figure 3.8, the strong growth during the 1990s was associated with a
substantial reduction in agricultural employment, driven by the dramatic decline in
collective farming, and a jump in the share of workers in salaried jobs. Over half of
Vietnam’s workforce is now working outside of agriculture, and is increasingly
focused on wage employment. The reallocation of labour from agriculture to wage
employment appears to have slowed down in recent years as economic growth has
decelerated. The initial rapid fall (1998 – 2006) was followed by a slowdown between
2006 and 2008. As will be shown below, many less well-educated workers, especially
in rural areas, appear to have retained a foot in the agricultural sector during the recent
economically difficult years.
Figure 3.9 depicts the employment structure of rural population who were 15 years old
and over in the main job during 2002-2010. The share of agricultural employment
reduced by 3.5 per cent per year. On average, there were 64.5 per cent of rural people
working in the farm sector during the period 2002-2010. In addition, the high share of
rural employment in the farm sector implies the typical characteristics of smallholder
agriculture as labour-intensive farming (Hazel and Rahman 2014). The rural
employment in non-agricultural sectors increased from 29.3 per cent in 2002 to 43.4
per cent in 2010. Generally, the rural employment structure in Vietnam changed
significantly, indicating the development of the labour market in rural areas and the
rural nonfarm economy (Dang et al. 2006).
0%
10%
20%
30%
40%
50%
60%
70%
80%
1993 1998 2004 2006 2008
Agricultural employment Non-agricultural wage employment
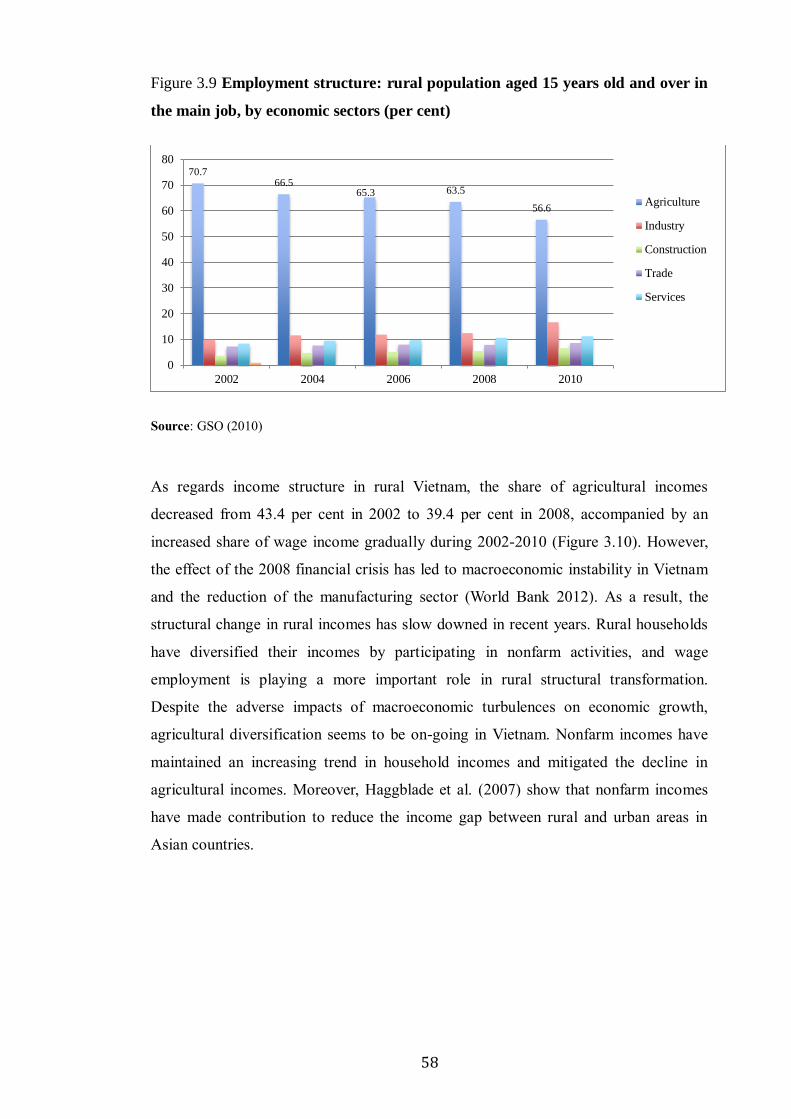
58
Figure 3.9 Employment structure: rural population aged 15 years old and over in
the main job, by economic sectors (per cent)
Source: GSO (2010)
As regards income structure in rural Vietnam, the share of agricultural incomes
decreased from 43.4 per cent in 2002 to 39.4 per cent in 2008, accompanied by an
increased share of wage income gradually during 2002-2010 (Figure 3.10). However,
the effect of the 2008 financial crisis has led to macroeconomic instability in Vietnam
and the reduction of the manufacturing sector (World Bank 2012). As a result, the
structural change in rural incomes has slow downed in recent years. Rural households
have diversified their incomes by participating in nonfarm activities, and wage
employment is playing a more important role in rural structural transformation.
Despite the adverse impacts of macroeconomic turbulences on economic growth,
agricultural diversification seems to be on-going in Vietnam. Nonfarm incomes have
maintained an increasing trend in household incomes and mitigated the decline in
agricultural incomes. Moreover, Haggblade et al. (2007) show that nonfarm incomes
have made contribution to reduce the income gap between rural and urban areas in
Asian countries.
70.766.5
65.3 63.5
56.6
0
10
20
30
40
50
60
70
80
2002 2004 2006 2008 2010
Agriculture
Industry
Construction
Trade
Services

59
Figure 3.10 Structure of monthly income per capita in rural Vietnam (per cent)
Source: GSO (2010)
Table 3.6 below further illustrates the development of the rural nonfarm economy by
examining the growth of rural wages in Vietnam in the period 2005-2012. Wiggins and
Keats (2014) surveyed selected Asian countries (including Vietnam) for this period.
They found that there has been an increasing trend of rural wages in Asia. In the case
of Vietnam, the average wages grew in real terms by 113 per cent. The average income
of wage-workers in rural areas also increased by 34 per cent in the same period. The
authors show that manufacturing growth and declining rural work force are main
reasons for rising rural wages. Moreover, Table 3.6 shows that the wage rates in the
agricultural sector increased along with the one in the industrial sector. As a result,
according to the dualism economy model developed by Lewis (1954) and extended by
Fei and Ranis (1964) in Chapter 2, the agricultural surplus to the industrial sector
reduces further, because of the effect of the decline in the agricultural labour force on
production, and the increase in food consumption from higher wages received by
agricultural workers.
Table 3.6. The growth of rural wages in Vietnam, 2005-2012
US$ real daily wages
(constant 2010)
Changes in wages (%)
2005 2009 2012 2005-2009,
2009-2012 2005-2012
National, agriculture, forestry and
fishing work, state sectors 4.05 6.29 8.63
55.37 113
Average income of wage worker in
rural areas 3.92 4.69 5.26
20.12 34 Source: Wiggins and Keats (2014), Rural wages in Asia, Overseas Development Institute, London.
24.8 2627.7 28.4
36.4
43.442
39.4 39.4
44.2
17.8 17.7 17.6 17.8 17.8
14 14.4 15.3 14.5
10.5
0
5
10
15
20
25
30
35
40
45
50
2002 2004 2006 2008 2010
Wage
Agriculture
Nonfarm self-employment
Others
60
3.6 Current issues in Vietnam’s agricultural development
When economic objectives are set for the agricultural development in a land-poor and
labour-abundant country, they normally face three distinctly different problems: First is
food security, then rising income gaps between sectors and regions, and finally the
potential reduction agriculture’s comparative advantage (Otsuka 2013). Otsuka (2013
and 2015) shows that affluent Asian economies and emerging Asian economies are
about to face a loss in the comparative advantage of agriculture. The reason for this
loss is the existence of labour-intensive smallholder agriculture in the midst of high
and rising wages.
Like other East Asian countries, Vietnam is a land-poor and labour-abundant country.
The success of the ‘equity-oriented” first land reforms in the late 1980s and early 1990s
has brought about significant changes in agricultural development (Marsh et al. 2006).
However, the “equity-oriented” land reforms also resulted in the small-scale and
fragmented farms, which is perceived to be the cause of present agricultural inefficiency
(Hung et al. 2007; Kompas et al. 2012). The balance between equity and efficiency,
between the ‘rice first’ policy and household welfare has resulted in three main issues in
Vietnam’s agricultural development in recent years.
Firstly, Vietnam maintains its “rice first” policy to ensure food self-sufficiency
strategy. However, rice farmers with small landholdings have had to diversify their
livelihoods because of low income from rice production. The government discourages
rice growers to convert paddy land, and this enables Vietnam to maintain its capacity
of food security and rice exports. This rice policy is in conflict with the desire of small
farm households to diversify their output found in the relevant literature. Robison and
Barry (1987) find that when farms are small and fragmented, households tend to be
more diversified to stabilize their returns and reduce uncertainties. Similarly, Chavas
and Di Falco (2012) show that small-scale farms tend to diversify to stabilize their
returns for different crops. McPherson (2012) concludes that rice policy in Vietnam is
inefficient and ineffective. The current policy of food self-sufficiency based on the
control over land use is inefficient because land and other resources are locked into
low-value uses. It is also ineffective because food insecurity, particularly as
malnutrition approach, still exists for rice farmers.
Secondly, there is a conflict of objectives between food security policy and policy that
promotes rural structural transformation, which requires the development of nonfarm

61
employment. The government maintains food security by encouraging agricultural
production. However, increasing investments in local industries and manufacturing
growth also encourages the development of the rural nonfarm economy and migration
to urban areas and other sectors (Wiggins 2014; Haggblade et al. 2007). In Vietnam,
rural structural transformation has been taking place since 1988. As a result, the labour
movement into nonfarm sectors may reduce agricultural production. Although the
relationship between the movement of labour into nonfarm activities and agricultural
production is complex, the expansion of rural nonfarm economies and the increase in
migration may concern policy makers in ensuring long-term food security in Vietnam
in light of labour-intensive cultivation.
Finally, while agriculture’s contribution to the economy reduced from 46.3 per cent in
1988 to less than 19 per cent in 2007, the share of labour employed in Vietnam’s
agricultural sector in 2007, declined from 73 per cent in 1990, and still stands at more
than 50 per cent. Small-scale and highly fragmented landholdings depend on labour-
intensive cultivation. Vietnam seems to follow the pattern of East Asian countries in its
agricultural transformation, which has potentially resulted in a growing backlog of
workers who will eventually need to exit the agricultural sector (Headey et al. 2010).
The government’s administrative land allocation was the main reason for the presence
of land fragmentation in Vietnam’s agriculture (Ravallion and van de Walle 2008).
However, as noted earlier, increasing trends of hired labour and rural wages as a result
of demographical changes and wage growth in the manufacturing sector may reduce
the comparative advantage of agriculture. As a result, Vietnam may transform its
economic development policy from squeezing agriculture to supporting it. Farm
households in rural Vietnam are likely to depend on highly protected and subsidized
agriculture in the future. Therefore, the question of strategies of the development of
smallholder agriculture in the presence of new conditions remains unanswered.
Whether or not, and to which extent, the reduction of land fragmentation impacts on
agricultural production and the shift of smallholder agriculture toward less labour-
intensive farming remains questionable.
In order to solve the above-mentioned issues, the government of Vietnam can draw
lessons from other countries in designing future agricultural development strategies.
Scott (2009) argues that the primary benefits of land allocation in the late 1980s have
been exploited. The country needs new sources of land reforms that boost agricultural

62
productivity and encourage less labour-intensive farming. Farm mechanization through
land consolidation and concentration should be strengthened to increase food
production at a reduced cost. In addition, Vietnam should change its approach of food
security e.g. from rice self-sufficiency to farmer’s incomes. Crop diversification is one
solution increasing household income and ensuring food security. As the same time,
Vietnam needs to strengthen agricultural mechanisation to facilitate labour transfer to
off-farm employment, where it can better cope with rising real wages during the
industrialisation process. It can apply labour saving innovations in agriculture. This
can be achieved by substituting machines for labour inputs, or agricultural technical
change (Hayami and Rutan 1985). Moreover, it helps to save more labour time for
other activities. Finally, small farms are coping with increasing cost stress. Thus, input
- supporting policies should be maintained to keep incentives for agricultural
production and encourage farmers to stay in agriculture.
3.7 Concluding remarks
Over the past three decades, economic development of Vietnam has been characterised
by a successful structural transformation from a predominantly agricultural and low-
income economy to a middle-income and more structurally diversified one. Within this
changing development process, agriculture has played a vital role to accommodate
changes to the economy. During the first stage of agricultural reform (1986-1999),
agriculture was liberalised from a central planning mechanism to a market economy.
Three sets of policy blocks - decollectivization, price reforms and integration into the
world market - were identified as factors contributing to Vietnam’s economic
development. The equity-oriented land reforms played a central role in this period.
However, after 1999, agricultural growth declined. The growth rates of agricultural
land and labour inputs decreased, especially in the 2000s. During this period, those
institutional reforms related to land use rights were consolidated. In addition, rural
structural changes took place rapidly with the development of the rural nonfarm
economy and increasing migration to urban areas and other sectors. Although there has
been a declining trend in agricultural growth in recent years, the Vietnamese economy
is still squeezing its agricultural sector to support the development of other sectors by
obtaining foreign exchange from exports, labour, land and other resources.
This chapter covers three sets of building blocks including food security or the “rice
first” policy, the rural nonfarm economy, and land reforms. By developing arguments

63
from Otsuka (2013), it evaluates whether Vietnamese agriculture is likely to replicate
problems that the East Asian countries experienced in agricultural development.
Vietnam has retained a small-scale household based agriculture, in spite of the miracle
in economic development.
The descriptive findings in this chapter show that despite significant reforms during the
three past decades, restructuring Vietnam’s smallholder agriculture is still one of major
challenges facing policy makers. Vietnam’s agricultural transformation appears to
follow the path of East Asian economies. The analytical framework presented in Chapter
2 shows that Vietnam should implement land reforms by promoting the pattern of
mechanization in agriculture. This is an innovation in light of rising rural wages and
largely part-time farming. By saving farm labour inputs for other economic activities,
household incomes can improve. In addition, the diversification in agricultural
production and livelihoods also raises the income of small-scale farmers. Rice land
designation policy should be changed in favour of crop diversification. These strategies
ensure more efficient development paths for Vietnam and avoid failures in maintaining
the comparative advantage of agriculture.
However, there has been no study discussing these issues systematically in Vietnam.21
This thesis is the first attempt to contribute to the discussion on the effect of
participation in the rural nonfarm economy and part-time farming on household
production choices, the role of land reforms on labour allocation and economic
diversity, crop diversification, and responses of family labour to increasing cost stress.
It examines appropriate agricultural development strategies and policy reforms for
smallholder agriculture in Vietnam. Further reforms and policy efforts are required to
ensure the agricultural restructuring in current rural structural transformation period.
These issues are discussed in the next chapters.
21The details of the literature review are presented in each key essay in the thesis (Chapters 4, 5 and 6).

64
Chapter 4
Crop diversification and economic performance of
diversified farms*
“Economic growth and increasing incomes results in changes in food systems. With the
growth of consumption and production of high value commodities, diversion of resources
from the staple cereal sector to the production of commodities with higher income
elasticities becomes important for maintaining incentives for the use of resources in the
agricultural production and improving resilience for environmental changes. Thus, new
patterns of product combination and resource use have to be developed, instead of intensive
mono-crop systems. In addition, small farms respond to increasing cost stress by reducing
farm labour or crop production. Therefore, further subsidies may often be necessary to make
input purchases for improved technologies both profitable and affordable. This may be
contrary to arguments dominating development policies on subsidies” (Policy proposition
stated in Chapter 1)
4.1 Introduction
Since the beginning of economic reforms in 1986, food security policy has mainly focused
on how to increase the supply of rice, particularly by keeping paddy land stable and
through restrictions on converting to other crops and nonfarm activities. 22 Although
agriculture is dominated by rice production, accounting for 65 per cent of annual cropping
land (GSO 2007), a large number of rice farmers now grow other annual crops in
conjunction with rice. Farmers have made adjustments to improve their livelihoods, even
though the land designation policy, favouring rice, has remained in place (World Bank
2007; MARD 2009; Dao & Lewis 2013). Farm households in poor areas are converting
some paddy land to other annual crops so that they can earn higher incomes (Minot et al.
2006). FAO (2012) suggests that diversifying production to include horticulture and
higher value crops allows smallholders to broaden sources of food in local diets and to
enter domestic markets for higher-value products. This is said to strengthen resilience to
* An earlier version of this chapter was presented at the 89th Annual Conference of Agricultural Economics Society at University of Warwick, United Kingdom.
http://ageconsearch.umn.edu/handle/204224 22Changes in land use purpose are only allowed, “within the existing physical planning framework
adopted by central and local governments” (Vasavakul 2006, chapter 11, p.226).

65
economic and climate shocks. Because of the impact that climate change is likely to have
on agricultural production, the need to consider diversified agricultural systems is ever
more pressing (Lin 2011).
The Strategy of Agriculture and Rural Development (2011-2020), issued by the
Vietnamese government in 2009, set specific objectives for self-sufficiency in food grain
production along with the increased production of other nutritious crops, as well as
encouragement of exports of vegetables and other annual crops, keeping in view
domestic consumption demand changes, nutritional requirements, and the resilience of
agricultural systems (MARD 2009). The reallocation of land away from paddy
production and towards other crops conflicts with the current land designation policy. In
Chapter 3, the evidence for crop diversification is presented in spite of the restrictions on
the conversion of land use purpose in rural Vietnam. Although rice dominates and land
policies constrain rice farmers, crop diversity does exist in Vietnam. This emphasis at
the policy level shows the importance of determining the merits of crop diversification
and economic performance of diversified farms at the household level. Chaplin (2000)
defines crop diversification as a shift away from monoculture. Farms produce many
crops that they could potentially use and sell at different times of the year. This chapter
uses the definition of crop diversification given by Chaplin (2000).
Internationally, it has long been recognised that the economic performance of diversified
farms is being increasingly influenced by output complementarity (Paul and Nehring
2005; Rahman 2009 and 2010). As a result, crop diversification may lead to cost reduction
associated with multi-output production processes (Paul and Nehring, 2005). Several
empirical studies find evidence of economies of scale and output complementarity in
diversified farms (Chavas and Aliber 1993; Fernandez-Cornejo et al. 1992; Paul and
Nehring 2005; Rahman 2010). While management expertise and technological advances
tend to favour specialization, in contrast income uncertainty due to input and output price
variability may favour diversification (Mafoua-Koukebene et al. 1996; Marsh et al. 2006;
Chavas and Di Falco 2012).
The objective of this chapter is to examine the economic performance of diversified farms
in rural Vietnam.23 It seeks the evidence of scale economies, output complementarity and
technical efficiency of small-scale production in a farming system characterised by a
23In this chapter, risks and uncertainties are ignored despite the fact that these are likely to influence
jointness and crop diversification. The issues of risks and uncertainties are not the main focus in this
chapter and will be explored in further research.

66
combination of cash-cropping and food crop production, particularly of rice. The study
tests whether the dynamic process of change in integrated farming sub-systems can affect
the potential for productivity gains and technical efficiency. It also analyses the economic
performance of diversified farms by examining the response of households in adjusting
output and input combinations in an environment of increasing cost stress. The
substitutability between inputs can have an impact on the cost and efficiency of farm
production (Paul et al. 2000). The analysis in this chapter mainly concentrates on rice-
based farms. A framework of multi-output/multi-input production is used to estimate
the elasticity of substitution and complementarity, as it cannot be estimated from direct
cost functions. This also overcomes the common limitation of household surveys due
to the lack of information on input prices. Notably, the following research questions
are of interest:
a) Does crop diversification result in scale economies and output complementarity
in agricultural production?
b) How does farm labour respond to increasing cost stress in multi-crop production?
c) How can technical efficiency be improved in a multi-output environment?
There has been little economic research on these questions. Most existing studies focus
only on rice, instead of multi-output pattern.24 This chapter contributes to the literature
in several ways. Firstly, to the best of the author’s knowledge, this research provides
the first investigation of the economic performance of diversified farms in rural
Vietnam. There have been no papers studying the evidence of diversification
economies in agricultural production in Vietnam. To bridge this knowledge gap, this
chapter uses the Vietnam Household Living Standard Survey 2006 (VHLSS) to answer
the research questions. The investigation of the economic performance of diversified
farm households provides a better understanding of household behaviour, which is
important in designing and adjusting food security policy.
Secondly, the study also provides the first evidence of the elasticity of substitution and
complementarity between inputs, with the implication for the response of farm labour
to changes in other variables such as an increase in the costs of fertilizer, pesticide and
capital. The input distance function improves the estimation of the elasticity of
24 Papers that study the efficiency in rice production in Vietnam include Kompas et al. (2004, 2012); Vu
(2012)
67
substitution in the context of multi-output and multi-input production technology
(Grosskopf et al. 1995; Kumar, 2006). The Morishima elasticity of substitution is
computed by applying the parameter estimates from the distance function. Blackorby
and Russell (1989) convincingly argue that the Morishima elasticity is the more
appropriate measure of substitutability when the production process has more than two
inputs. The substitutability of farm inputs helps us to understand the resource
allocation of farms facing increasing cost stress.
Finally, understanding technical efficiency enables us to uncover the factors that
hinder the productivity growth of annual crop farming in Vietnam in light of declining
trends of agricultural growth and rising abandonment of rice fields in many provinces
in recent years.25 The chapter also investigates whether or not further land reforms
directed toward land consolidation may reduce technical inefficiency. The role of
further land reforms in improving technical efficiency in Vietnamese rice production
has been examined by Kompas (2004) and Kompas et al. (2012). The determinants of
technical efficiency in a multi-crop environment are, however, open to question.
The chapter is organized as follows. Section 4.2 presents the literature review, which
emphasises the measures of economic performance of diversified farms. In Section
4.3, the research methodology is introduced. The empirical model is presented in
Section 4.4. This section highlights the methods in estimating the performance
measures of diversified farms. It also describes the dataset and construction of
variables. Section 4.5 reports and discusses the empirical results. The final section
concludes and presents policy implications.
4.2 Literature review
Crop diversification is important for the growth and sustainability of agricultural
production in developing countries (Ellis 1998). In a study of crop diversification in China,
Van den Berge et al. (2007) found that given fragmented and small farm sizes, farm
households who diversified into high-value vegetables and away from rice could improve
their incomes. Similarly, the same evidence was found in the case of Sudan when crop
diversification reduced income uncertainties (Guvele 2001). Many developing countries
put a priority on shifting the cropping pattern from rice production to crop diversification,
which aims at improving food security and nutrition, securing sources of income and
25See Chapter 3 for details about the evidence of abandoning paddy fields in rural Vietnam.
68
employment, the resilience of farming systems and environmental services (FAO 2012).
Lin (2011) claims that crop diversification can improve resilience by buffering crop
production from the increasing effect of climate change. Therefore, crop diversification
can promote sustainable intensification in agricultural production.
4.2.1 Economies of diversification in agricultural production
Diversification can be found in agricultural production systems. Farm households can
produce more than one output because they have the benefits from economies of scope,
which result in positive externalities across the production processes. For example, crop
rotation can enable farmers to control pest damages and improve farm incomes; waste
from livestock can be used to improve land quality (Chavas and Aliber 1993; Paul and
Nehring 2005).
Previous studies analysed the economies of diversification by using an input distance
function (Rahman 2009 and 2010; Coelli and Fleming 2004; Irz and Thirtle 2004; Paul
and Nehring 2005; Ramussen 2010; Ogundari 2013). These studies focused on
examining the economies of scale, diversification and technical efficiency in diversified
farms.26 Coelli and Fleming (2004) introduced a measure of economies of diversification
for Papua New Guinea farm households, who switched their crops from sweet potato
production. The authors found weak evidence on diversification economies between
subsistence food and both coffee and cash food production. In their study, they diverged
from the standard approach in identifying the evidence of economies of scope by using
an input distance function, instead of a cost function. The use of a cost function was
irrelevant due to the lack of cost data and the unpriced nature of many inputs, and the
imperfect land and labour markets. This is a common problem for survey data in many
developing countries, and therefore, an input distance function is selected to study the
economies of diversification.
Similarly, Rahman (2009 and 2010) found evidence of economies of scale and scope in
Bangladesh’s farm production using the input distance function. In Rahman (2010), the
total output of crops increased by one per cent when the total inputs increased by only
0.89 percent. Similarly, Paul and Nehring (2005) provide an overview of the methods
used to measure economic performance of US farms. In their study, they also find
26Scope economies are considered to exist if a particular firm can produce two or more output at a lower
cost than two separate firms specializing in the production of the two individual output (Baumol et al.
1982).
69
evidence of significant economies of scale and output complementarity of the US’s
diversified farms. Rasmussen (2010) estimated the input distance function for Danish
agricultural production. He found that the elasticity of input with respect to output was
0.62, which implies that one per cent increase in total outputs results in 0.62 per cent
increase in the total inputs. These studies also found the existence of economies of scope
in multiple output production, which implies that crop diversification results in cost
savings in agricultural production.
In the study of Asia’s agriculture, Barker et al. (1985) show that Asian farms have
maintained different patterns to farms in developed countries, which remained
specialized and small in scale. The authors argue that rice specialization in small farms
in Asia is a puzzle, to the extent that small farms in other regions are often highly
diversified. Kim et al. (2012) examined the economies of diversification with an
application to South Korean farms. They concluded that diversification benefits were
positive but not statistically significant in South Korean rice farms. Moreover, their
study found positive and statistically significant complementarity effects, implying
more incentives to diversify in non-rice activities, but fewer for rice farmers. These
complementarity effects work against non-convexity effects, providing incentives for
rice farmers to specialize in rice production. However, Kim et al. (2012) only find
benefits of diversification for production patterns that exclude rice. The analysis fail to
explain why farmers produce other crops including rice, and depends on the case by
case evaluation.
In addition, South Korea’s agriculture was highly protected, and in particular, supported
income for rice farmers against rice imports (Honma and Hayami 2009). This reason
explains the specialization in rice production of small farms in South Korea. Similarly,
rice farmers in Vietnam receive huge support from policies (Tran et al. 2013).
Procurement policies and the floor price policy, along with direct cash transfers to rice
farmers, are popular policies to stimulate rice production.27 As a result, rice farmers sell
paddy to the government’s enterprises based on procurement policy and rice floor price.
In contrast, diversified households have to make their own decision on markets for cash
crops, which are subject to the fluctuation of market prices.
27 Resolution No. 63/NQ-CP (2009) on food security and floor price; Government Decisions on rice
procurement policies such as Decision 993 (2010); fertiliser and seed subsidies, direct cash transfers of
USD 50 per hectare to rice farmers in Resolution No. 42/ND-CP (2012).

70
Regarding the studies of farm performance in Vietnam, most quantitative analyses use
input and output from rice farms (Kompas 2004; Kompas et al. 2012; Vu 2012),
focusing exclusively on the rice-growing households, although most farm households
in Vietnam also participate in other agricultural activities such as off-farm employment
and annual crop production. Kim et al. (2012) argue that omitting other outputs creates
a critical bias in the economic analysis of rice productivity if there are
complementarities across multiple activities. This chapter, thus, provides new evidence
of the efficiency response in multiple output environments and contributes to the
debate on whether Vietnam should keep or reduce paddy land until 2020.28 Moreover,
it contributes to strengthening policies to enhance food security and nutritional status
in Vietnam. The analysis also reveals a different pattern by only concentrating on small
rice farms in Vietnam that diversified their annual crops in spite of the control of paddy
land designation as shown in Chapter 3. In the case of Vietnam, it is important to
determine the merit of crop diversification, particularly when the Vietnam government is
keen on switching to other crops as a strategy for agricultural growth.
4.2.2 Input distance function and its applications in the literature
In order to capture the interactions between outputs and inputs, some studies use an
input distance function that allows a multi-output and multi-input specialization of the
technology. According to Paul and Nehring (2005), these relationships can be used to
develop estimable distance functions, again with either an output or input orientation.
Use of the distance function has an obvious advantage over the approach of production
functions in that it allows for the possibility of multiple outputs and joint production
(Kumbhakar et al. 2007). In fact, no specific behavioural goal is embedded in the
distance function. Moreover, Kumbhakar et al. (2007) find that the stochastic
production frontier can be estimated without the assumption of the separability of
outputs and inputs when using the distance function approach.
The choice of the distance function is not new in the literature. The derivation of the
input distance function and its properties can be found in many sources (Coelli et al.
1998; Fare and Primont 1995; Irz and Thirtle 2004; Kumbhakar and Lovell 2003;
Lovell et al. 1994; Paul and Nehring 2005; Rahman 2009 and 2010; Brummer et al.
28The Government sets a target that by 2020 paddy land is kept at 3.8 million of hectare, and cutting
paddy land which has resulted in increasing debate on this plan
(http://english.vietnamnet.vn/fms/business/82250/vietnam-considers-cutting-rice-farming-area-
down.html).

71
2006). The essential tool is the stochastic frontier approach proposed by Aigner et al.
(1977) and the distance function, originally introduced by Shephard (1970). Over the
years, this approach has been used by a number of authors to study agricultural
productivity. Paul et al. (2000) were the first to use this approach to formally analyze
the consequences of regulatory changes in the components of productivity change in
agricultural production in New Zealand. They estimated a four-output, seven-input
stochastic output distance function to analyze the impact of regulatory reforms on
efficiency and adjustment of production processes on farms in the 1980s. Similarly,
Newman and Matthews (2007) used an output distance function to measure and
decompose the productivity growth of Irish agriculture between 1984 and 2000 for four
principal farming systems. Irz and Thirtle (2004) analyzed the productivity performance
for agriculture in Botswana in the period 1979–1996, using a two-output, six-input
stochastic translog input distance function.
Moreover, several papers use input distance function to identify the determinants of
technical efficiency in agricultural production. However, there is mixed evidence
related to the effect of crop diversification on production efficiency in agriculture.
Coelli and Fleming (2004) found that technical efficiency can significantly improve if
households diversify their crops in Papua New Guinea. Similarly, Rahman (2009;
2010) and Ogundari (2013) also provided the same evidence in the case of Bangladesh
and Nigeria, respectively. On the other hand, Llewelyn and Williams (1996) reached
an opposite conclusion when crop diversification reduced technical efficiency in
Indonesian crop production. In the case of Vietnam, there have been no papers
studying the technical efficiency of diversified farms.
One of the advantages of the input distance function is that it can be used to calculate
the elasticity of substitution. Grosskopf et al. (1995) firstly estimated the Morishima
elasticity of substitution from the parameters of the input distance function in public
economics. They argued that the advantage of the distance function over the cost
function is that no information on input prices is required, nor is the maintained
hypothesis of cost minimization required (Grosskopf et al. 1995). By using the
evidence convincingly shown by Blackkorby and Russell (1989), the Morishima
elasticity of substitution is the more appropriate measure of substitutability when the
production process has more than two inputs. Furthermore, using this approach of the
parametric distance function only requires data on outputs and inputs, while the dual
methods based on the estimation of a cost function requires information on input

72
prices, which are often insufficiently developed in developing countries, particularly
for land and labour (Irz and Thirtle 2004).
Similarly, Rahman (2010) adopts the approach of Paul and Nehring (2005), and uses
the parameters of the estimated input distance function to measure the economic
performance of farms in Bangladesh using cross-sectional data. Interestingly, in this
paper, the Morishima elasticity of substitution is estimated. In addition, Rahman
concludes that crop diversification improves technical efficiency in agricultural
production in Bangladesh. The mean of technical efficiency in Rahman’s paper is quite
high, at 0.9. However, Rahman does not provide the constant output cross and own
elasticity of shadow prices with respect to inputs when the author applied the methods
of Grosskopf et al. (1995) and Kumar (2006). If Rahman uses the empirical approach
developed by Kumar (2006) to calculate the Allen-Uzawa elasticity of substitution,
this leads to theoretically inconsistent results due to the symmetric requirement of the
Allen-Uzawa elasticity of substitution. This chapter further develops Rahman’s (2010)
estimation of the Morishima elasticity of substitution, as discussed in Grosskopf et al.
(1995) and Kuma (2006).
4.3 Research methodology
4.3.1 Theoretical framework
The chapter focuses mainly on measuring economic performance of diversified farms.
The scope of measures of economic performance in this study includes economies of
scale, output complementarity, and elasticity of substitution between inputs in light of
increasing cost stress in farm production in Vietnam. Bravo-Ureta et al. (2007) define
technical efficiency as a measure of management ability at a given level of technology
and a source of productivity growth including technical change. They show that the
enhancement of the decision-making process can derive the gain in technical
efficiency, which is influenced by social and economic conditions such as education
and farm characteristics. In contrast, technical change involves investments in research
and technology.
In order to answer the research questions of this chapter, a multiple output and input
production technology is required. In the study conducted by Paul and Nehring (2005),
the authors used both input and output distance functions to evaluate the economic
performance of US farms. Both output and input distance functions are capable of

73
dealing with multi-output technologies. The output-based measure estimates technical
efficiency in terms of proportional expansion of outputs, given input being held
constant. Whereas, the input-based measure estimates technical efficiency in terms of
the proportional savings in inputs, given outputs being held constant. These measures
can be interpreted in terms of output enhancement and cost savings, respectively. In
this chapter, an input-oriented stochastic distance function is analyzed, instead of an
output oriented distance function, for two major reasons: (i) the input distance function
is unambiguously interpreted in terms of cost saving - one of key interests in this
chapter in light of the rising costs in agricultural production due to the high inflation of
the past decade in Vietnam (World Bank, 2011); (ii) the input-based measure allows
this study to answer the research question about how family labour behaves in
response to increasing cost stress.
This study applies the input distance function developed by Paul and Nehring (2005) to
measure the economic performance of diversified farms. Because there is no access to
cost data due to the unpriced nature of many inputs in this study, which is unable to
calculate economies of scope relative to a cost function. Thus, output complementarity
is, instead, calculated by an input distance function. This problem of unpriced inputs
may explain why studies on diversification economies in developing countries use the
approach of input distance function, instead of cost function (Coelli and Fleming 2004
for Papua New Guinea; Rahman 2009 and 2010 for Bangladesh). At the same time, the
choice of a stochastic distance function approach can allow the separation of the random
noise from technical inefficiency effects that is ignored in the data envelopment analysis
by Dao and Lewis (2013).29 Several studies used the parameters of the estimated input
distance function to estimate scale economies, technical efficiency and elasticity of
substitution in diversified farms (Grosskopf et. al. 1995; Rahman 2010).
29Dao and Lewis (2013) also estimate the technical efficiency in rice-based crop diversification farms in
Vietnam. However, they only apply non-parametric regression as a data envelopment analysis.
Kumbhakar and Lovell (2003) show that non-parametric methods cannot provide the determinants of
technical inefficiency in stochastic production function.

74
Figure 4.1 Input distance function, over-utilization of X1, reproduced from
Grosskopf et al. (1995, p. 280)
In the study of stochastic frontier analysis, Kumbhakar and Lovell (2003) introduce the
overview of the input distance function, which was firstly introduced by Shephard
(1970).30 This function describes how much an input vector may be proportionally
contracted with the output vector that is held fixed. This chapter uses the theoretical
framework introduced by Kumbhakar and Lovell (2003), and Paul and Nehring (2005,
p. 529). The input distance function D(x,y) is formally defined as:
𝐷(𝑥, 𝑦) = 𝑚𝑎𝑥 {𝜆; 𝜆 > 0,𝑥
𝜆∈ 𝐿(𝑦)} (4.1)
𝐿(𝑦) = {𝑥 ∈ 𝑅+𝑁: 𝑥}, x can produce y (4.2)
where x is a scalar, L(y) is the set of input requirement x, which is used to produce the
output vector y. Figure 5.1 below describes the input distance function. As can be seen
in Figure 5.1, the input vector x is feasible for output y, but y can be produced with the
radically contracted input vector (x/λ*), and so D(x, y) =λ*>1. D(x, y)=1 if and only if
the input bundle is an element of the isoquant of L(y). In addition, D(x, y) is non-
decreasing, positively linear homogenous and concave in x, and increasing in y. Paul
and Nehring (2005) show that the input distance function can provide the measure of
technical efficiency because it allows for deviation (distance) from the frontier.
Finally, there is a dual relationship between input distance function and cost function,
which allow us to relate the derivatives of the input distance function to the cost
function (Färe and Primon 1995).
30See further details of properties of input distance function in Kumbhakar and Lovell (2003).
X2
X1
x/λ* x
L(y)

75
According to Lovell et al. (1994), the imposition of a function form for D(x, y) cannot
be directly estimated due to the unobserved value of the distance function. Lovell et al.
(1994) thus suggest a way of solving this problem by exploiting the property of linear
homogeneity of the input distance function as follows:
𝐷(𝜌𝑥, 𝑦) = 𝜌𝐷(𝑥, 𝑦), 𝜌 > 0 (4.3)
Assuming that x is a vector of dimension K and ρ=1/x1, where x1 denotes the (arbitrary
chosen) first element of the input vector x, the Equation (4.3) is transformed in
logarithmic form as:
𝑙𝑛𝐷𝑖(𝑥, 𝑦) = 𝑙𝑛𝑥1 + 𝑙𝑛𝐷(𝑥/𝑥1 , 𝑦) (4.4)
Lovell et al. (1994) also show that the logarithm of the distance function in the
Equation (4.4) measures the deviation of an observation (x, y) from the deterministic
border of the input requirement set L(y), which is consist of two components according
to the stochastic frontier literature. The first one describes random shocks and
measurement errors. The second one corresponds to technical inefficiencies that are
assumed to be stochastic and a non-negative random variable u. Conceptually the
presence of inefficiencies can be evaluated by the distribution of management skills
across the population of farm households using the same technology. These
assumptions, thus, can be mathematically expressed as follows:
𝑙𝑛𝐷(𝑥, 𝑦) = 𝑢 − 𝑣 (4.5)
Substituting Equation (4.5) into Equation (4.4) gives:
−𝑙𝑛𝑥1 = 𝑙𝑛𝐷(𝑥/𝑥1, 𝑦) − 𝑢 + 𝑣 (4.6)
4.3.2 Functional form
To empirically estimate the distance function, a functional form must be specified. I
select the translog functional form used by previous studies (Lovell et al. 1994;
Grosskopf et al. 1995; Coelli et al. 1998; Paul et al. 2000; Irz and Thirtle 2004; Paul
and Nehring 2005; Rasmussen 2010; Rahman 2010). The translog is a flexible
function and it has some advantages in that it allows the elasticity of scale to change
for various farm sizes. In addition, a flexible technology also allows for substitution
effects in the function, which supports the answer to the research questions related to
substitutability between inputs (Paul et al. 2000).

76
The translog input distance function with M outputs, N inputs of the farm household i
is given by:
𝑙𝑛𝐷𝑖 = 𝛽0 + ∑ 𝛽𝑛𝑙𝑛𝑥𝑛
𝑁
𝑛=1
+1
2∑ ∑ 𝛽𝑛𝑘𝑙𝑛𝑥𝑛
𝑁
𝑘=1
𝑁
𝑛=1
𝑙𝑛𝑥𝑘 + ∑ 𝛼𝑚𝑙𝑛𝑦𝑚
𝑀
𝑚=1
+1
2∑ ∑ 𝛼𝑚𝑙𝑙𝑛𝑦𝑚
𝑀
𝑙=1
𝑀
𝑚=1
𝑙𝑛𝑦𝑙 + ∑ ∑ 𝛾𝑚𝑛𝑙𝑛𝑦𝑚
𝑁
𝑛=1
𝑀
𝑚=1
𝑙𝑛𝑥𝑛 (4.7)
where Di measures the distance from (x,y) to the production function and denotes the
unobservable value of the distance function. As the input distance function is linear
homogenous in inputs, the parameters in Equation (4.7) must satisfy the following
regulatory restrictions:
∑ 𝛽𝑛𝑛
= 1, ∑ 𝛽𝑛𝑘𝑘
= 0, ∑ 𝛾𝑚𝑛 = 0 (𝑚 = 1, … , 𝑀)𝑛
𝛽𝑛𝑘 = 𝛽𝑘𝑛 (𝑁, 𝐾 = 1, … , 𝑁); 𝛼𝑚𝑙 = 𝛼𝑙𝑚 (𝑚, 𝑙 = 1, … , 𝑀)
This chapter uses the approach of Lovell et al. (1994) and Coelli and Perelman (1999)
in imposing these restrictions required for the homogeneity of degree of one in inputs
(∑ 𝛽𝑛 = 1) 7𝑛=1 by normalizing the function by one of the input, similar to Equations
(4.3) and (4.4). As a result, Equation (4.7) is expressed as follows:
𝑙𝑛(𝐷𝑖/𝑥1𝑖) = 𝛽0 + ∑ 𝛽𝑛𝑙𝑛𝑥𝑛
7
𝑛=2
+1
2∑ ∑ 𝛽𝑛𝑘𝑙𝑛𝑥𝑛
7
𝑘=2
7
𝑛=2
𝑙𝑛𝑥𝑘 + ∑ 𝛼𝑚𝑙𝑛𝑦𝑚
4
𝑚=1
+1
2∑ ∑ 𝛼𝑚𝑙𝑙𝑛𝑦𝑚
4
𝑙=1
4
𝑚=1
𝑙𝑛𝑦𝑙 + ∑ ∑ 𝛾𝑚𝑛𝑙𝑛𝑦𝑚
7
𝑛=2
4
𝑚=1
𝑙𝑛𝑥𝑛 = lnD(𝑥∗, 𝑦)
(4.8)
where 𝑥𝑛𝑖∗ = 𝑥𝑛𝑖/𝑥1𝑖(∀𝑛, 𝑖), only n-1 inputs are not used for normalization. Substituting
lnD with u and adding error term v to account for random noise, we end up with an
estimating Equation (4.9). Substituting Equations (4.8) into (4.6), we have:
−𝑙𝑛𝑥1 = 𝑙𝑛𝐷(𝑥𝑛𝑖∗ , 𝑦) − 𝑢 + 𝑣 (4.9)
Paul and Nehring (2005) find that coefficient estimates from Equation (4.9) have
opposite signs from those for a standard production or input requirement function. The
authors introduce a method by reversing the signs of the equation in order to interpret
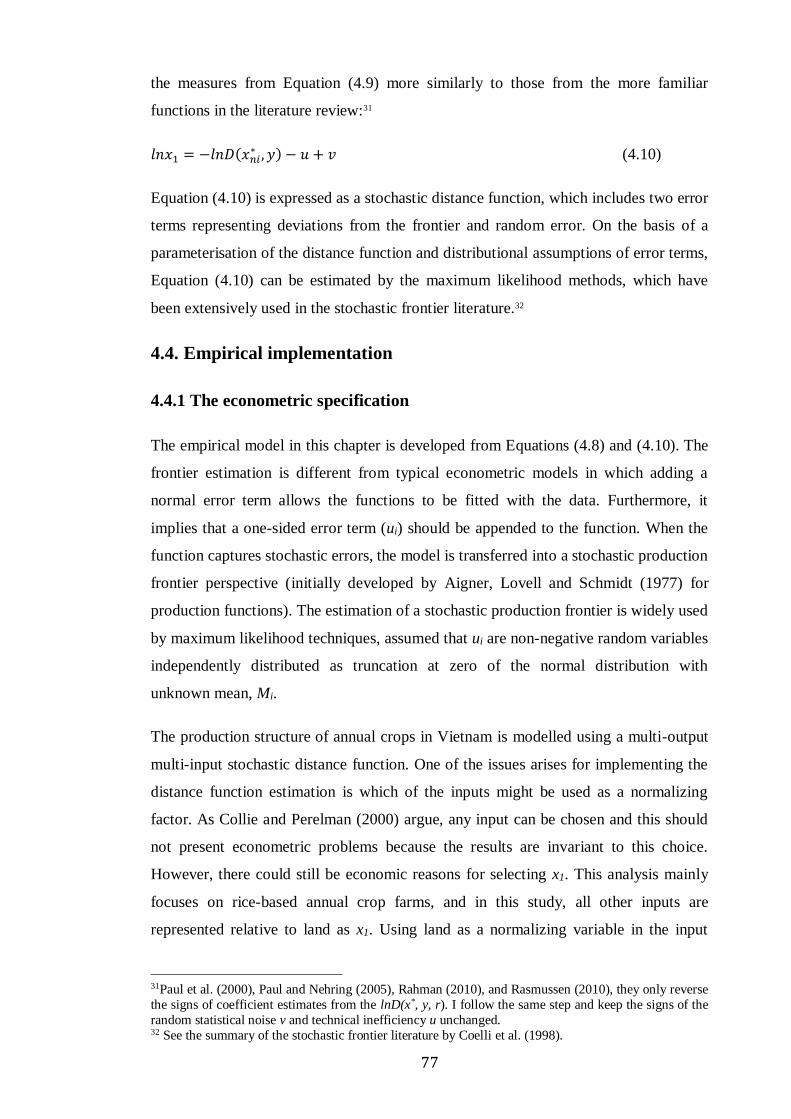
77
the measures from Equation (4.9) more similarly to those from the more familiar
functions in the literature review:31
𝑙𝑛𝑥1 = −𝑙𝑛𝐷(𝑥𝑛𝑖∗ , 𝑦) − 𝑢 + 𝑣 (4.10)
Equation (4.10) is expressed as a stochastic distance function, which includes two error
terms representing deviations from the frontier and random error. On the basis of a
parameterisation of the distance function and distributional assumptions of error terms,
Equation (4.10) can be estimated by the maximum likelihood methods, which have
been extensively used in the stochastic frontier literature.32
4.4. Empirical implementation
4.4.1 The econometric specification
The empirical model in this chapter is developed from Equations (4.8) and (4.10). The
frontier estimation is different from typical econometric models in which adding a
normal error term allows the functions to be fitted with the data. Furthermore, it
implies that a one-sided error term (ui) should be appended to the function. When the
function captures stochastic errors, the model is transferred into a stochastic production
frontier perspective (initially developed by Aigner, Lovell and Schmidt (1977) for
production functions). The estimation of a stochastic production frontier is widely used
by maximum likelihood techniques, assumed that ui are non-negative random variables
independently distributed as truncation at zero of the normal distribution with
unknown mean, Mi.
The production structure of annual crops in Vietnam is modelled using a multi-output
multi-input stochastic distance function. One of the issues arises for implementing the
distance function estimation is which of the inputs might be used as a normalizing
factor. As Collie and Perelman (2000) argue, any input can be chosen and this should
not present econometric problems because the results are invariant to this choice.
However, there could still be economic reasons for selecting x1. This analysis mainly
focuses on rice-based annual crop farms, and in this study, all other inputs are
represented relative to land as x1. Using land as a normalizing variable in the input
31Paul et al. (2000), Paul and Nehring (2005), Rahman (2010), and Rasmussen (2010), they only reverse
the signs of coefficient estimates from the lnD(x*, y, r). I follow the same step and keep the signs of the
random statistical noise v and technical inefficiency u unchanged. 32 See the summary of the stochastic frontier literature by Coelli et al. (1998).

78
distance function has been widely applied in studies in agricultural economics (Irz and
Thirle 2004; Paul and Nehring 2005; Rahman 2010; Rasmussen 2010). This choice is
consistent with the typical agricultural economics approach to production modelling in
terms of yields, and inputs per acre. Different choices for the normalizing input
variable (x1), such as fertiliser, were tried with only a slight difference in results.
The empirical model is stated as follows:
−𝑙𝑛𝑥1𝑖 = 𝛽0 + ∑ 𝛽𝑛𝑙𝑛𝑥𝑛∗
7
𝑛=2
+1
2∑ ∑ 𝛽𝑛𝑘𝑙𝑛𝑥𝑛
∗
7
𝑘=2
7
𝑛=2
𝑙𝑛𝑥𝑘∗ + ∑ 𝛼𝑚𝑙𝑛𝑦𝑚
4
𝑚=1
+1
2∑ ∑ 𝛼𝑚𝑙𝑙𝑛𝑦𝑚
4
𝑙=1
4
𝑚=1
𝑙𝑛𝑦𝑙 + ∑ ∑ 𝛾𝑚𝑛𝑙𝑛𝑦𝑚
7
𝑛=2
4
𝑚=1
𝑙𝑛𝑥𝑛∗ + ∑ 𝜌𝑘
8
𝑘=1
𝑅𝐸𝐺𝑘 + 𝑣𝑖
− 𝑢𝑖
(4.11)
And according to Battese and Coelli (1995), the parameter in the inefficiency
distribution is expressed as 𝑢𝑖 = 𝜇0 + ∑ 𝜇𝑠9𝑠=1 𝑀𝑖𝑠 + 𝜔𝑖
∗, (4.11a)
where x1 is land cultivated per farm as the normalizing input, vi is the two-sided
random error and ui is the one-sided error in model (11), M in Equation (4.11a)
introduces variables that represent farm household characteristics affecting technical
inefficiencies. The model has added dummy variables that control for regional
differences, REGk. Model (4.11) includes seven production inputs (X), four outputs (Y)
and nine variables of Mis in the technical inefficiencies model. There is no
environmental condition in the model due to a lack of data that captures this variable.
Thus, environmental conditions such as land quality and land characteristics are
ignored in this chapter. Moreover, in Vietnam, the classification of irrigated land and
non-irrigated land is only collected in surveys at the communal level. Regional
differences are controlled by using regional dummies.
Equation (4.11a) estimates the determinants of technical inefficiency in annual crop
farms. Efficiency is an important economic concept for the measurement of economic
performance of a farm. From the one-sided error term ui in Equation (4.11), the levels of
technical efficiency can be estimated.33 According to Kumbhakar and Lovel (2003),
33 Technical efficiency (TE) refers to the ability to minimize input use in the production of a given
output vector, or the ability to obtain maximum output from a given input vector (Kumbhakar and
Lovell, 2003). In general, 0<TE<1, where TE=1 reflects that farms are producing on the frontier of

79
variance term is defined as δ2 = δ2v + δ2
u and γ = δ2u/ (δ
2v + δ2
u). Using the approach of
Coelli and Perelman (1999), the input distances are predicted as D=E[exp(u)/e], where
e=v-u. The technical scores of each farm are derived from the inverse of these input
distances. The deviation of the technical efficiency measures from 1 indicates the
percentage by which inputs of farm production would, in principle, have to decrease to
reach the production frontier.
The impacts of determinants on the extent of a particular farm’s efficiency, such as
education and land fragmentation, are also be explored by including them as component
of the Mis vector: the age of household head (M1), the mean education of working-age
men (M2), the mean education of working age women (M3), households that access to
formal credit programs (M4), the number of household members from 15 to 60 years old
(M5), dependency ratio (M6), days of illness in a year (M7), the number of plots that
capture the impact of land fragmentation on technical inefficiency (M8), and hours of
non-farm wage participation (M9).
4.4.2 Identification
As regards the endogeneity problem, there is criticism that the parameter estimates of
the distance function may be affected by simultaneous equations bias (Atkinson et al.
1999). Atkinson et al. (1999) use instrumental variables to reduce the bias, even
though they did not clearly specify the source of suspected simultaneous equations bias
(Coelli, 2000). Atkinson et al. (1999) also argue that due to the ratios of inputs on the
right-hand side of the estimating equation (in the case of an input distance function),
there must be a simultaneous feedback problem because these input variables are
assumed to be ‘endogenous’ variables.
However, Coelli (2000) clearly demonstrates that ordinary least squares provide the
consistent estimates of the parameters of the input distance function under the assumption
of cost minimizing behaviour. In fact (as Coelli (2000) shows), distance functions are no
more subject to possible endogeneity criticisms than production functions. He further adds
that when cost-minimising behaviour is a reasonable assumption, the input distance
function has a clear advantage over the production function, due to an endogenous
dependent variable and exogenous independent variables, while the production function
has the converse. As a result, the use of distance functions is further strengthened (Coelli,
production. Alternatively, TE<1 implies that farms are technically inefficient, which means that (1-TE)
captures the proportional reduction in inputs, x that can be gained to produce output, y.

80
2000, p. 20–21). Therefore, this chapter inherits the analysis of consistent estimates in
Coelli (2000) to develop the empirical model. Moreover, it also investigates the
possibility of simultaneous equation bias in the estimation of the distance function (see
Appendix A2). The OLS estimation results in consistent estimates of parameters under
the cost minimizing assumption.
The estimates of parameters in the Equations (4.11) and (4.11a) are applied by using
maximum likelihood estimation in a single state as shown in Coelli and Perelman
(2000). STATA 13 is used to estimate the model, and the problem of zero values in the
translog input distance function is solved by applying the approach of Paul et al. (2000).
4.4.3 The performance measures
There have been various measures of the production process that can be calculated as
derivatives or elasticities from the estimated input distance function. The analysis
applies the performance measures used by Paul and Nehring (2005) in the case of
Vietnamese farm households. Rahman (2010) and Rasmussen (2010) also apply the
same procedure in estimating the performance measures for farms in Bangladesh and
Denmark, respectively. According to Paul and Nehring (2005), performance measures
are desired from the overall output-input relationship. There are four measures including
scale economies, output complementarity, elasticity of substitution between inputs and
technical efficiency.
4.4.3.1 Scale economies
Baumol et al. (1982) developed the measurement of scale economies in multi-product
firms. If the returns to scale are increasing, then the ray average cost is a decreasing
function (where a proportional increase in outputs leads to a less than proportional
increase in costs). Similarly, when returns to scale are decreasing, then the ray average
cost is an increasing function (where a proportional increase in outputs leads to a more
than proportional increase in cost).
Based on the above ideas, scale economies can be derived in farming production. The
elasticity of the input distance function with respect to outputs and inputs has useful
interpretations. Färe and Primont (1995) and Paul and Nehring (2005) find that the
combination of the first-order input elasticities representing scale economies shows a
positive correlation between productivity and input growth. Moreover, these studies
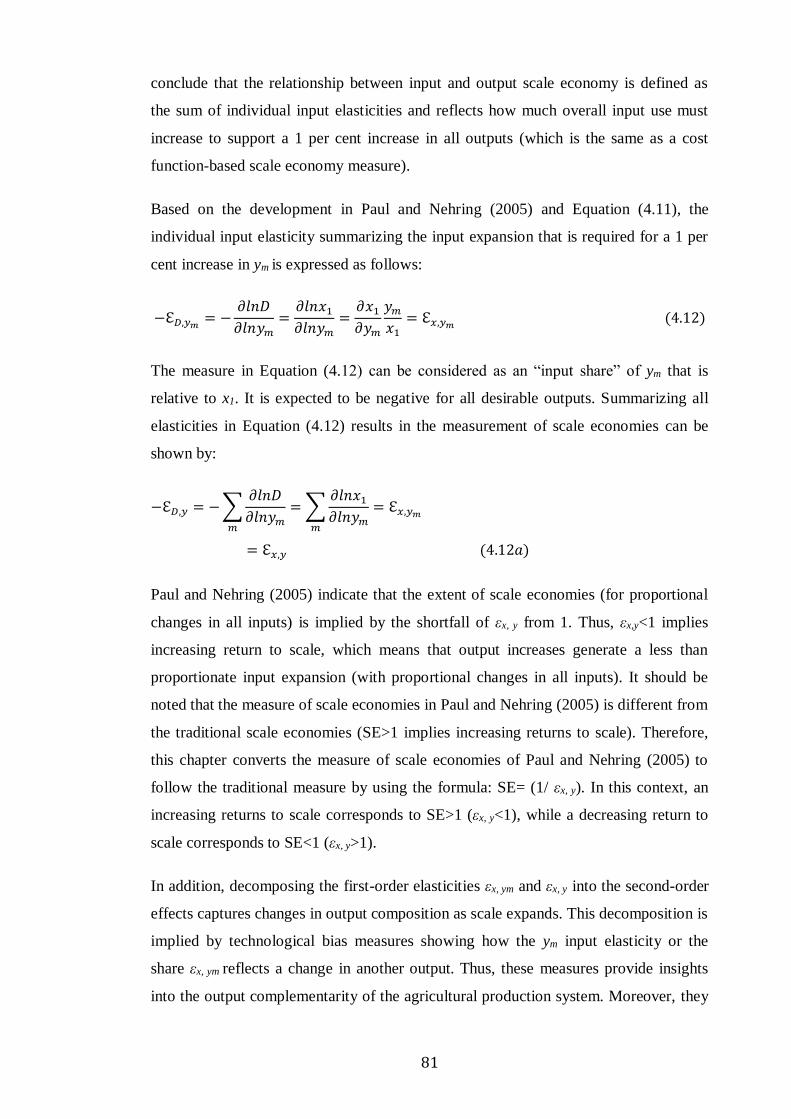
81
conclude that the relationship between input and output scale economy is defined as
the sum of individual input elasticities and reflects how much overall input use must
increase to support a 1 per cent increase in all outputs (which is the same as a cost
function-based scale economy measure).
Based on the development in Paul and Nehring (2005) and Equation (4.11), the
individual input elasticity summarizing the input expansion that is required for a 1 per
cent increase in ym is expressed as follows:
−ℇ𝐷,𝑦𝑚= −
𝜕𝑙𝑛𝐷
𝜕𝑙𝑛𝑦𝑚
=𝜕𝑙𝑛𝑥1
𝜕𝑙𝑛𝑦𝑚
=𝜕𝑥1
𝜕𝑦𝑚
𝑦𝑚
𝑥1
= ℇ𝑥,𝑦𝑚 (4.12)
The measure in Equation (4.12) can be considered as an “input share” of ym that is
relative to x1. It is expected to be negative for all desirable outputs. Summarizing all
elasticities in Equation (4.12) results in the measurement of scale economies can be
shown by:
−ℇ𝐷,𝑦 = − ∑𝜕𝑙𝑛𝐷
𝜕𝑙𝑛𝑦𝑚𝑚
= ∑𝜕𝑙𝑛𝑥1
𝜕𝑙𝑛𝑦𝑚𝑚
= ℇ𝑥,𝑦𝑚
= ℇ𝑥,𝑦 (4.12𝑎)
Paul and Nehring (2005) indicate that the extent of scale economies (for proportional
changes in all inputs) is implied by the shortfall of εx, y from 1. Thus, εx,y<1 implies
increasing return to scale, which means that output increases generate a less than
proportionate input expansion (with proportional changes in all inputs). It should be
noted that the measure of scale economies in Paul and Nehring (2005) is different from
the traditional scale economies (SE>1 implies increasing returns to scale). Therefore,
this chapter converts the measure of scale economies of Paul and Nehring (2005) to
follow the traditional measure by using the formula: SE= (1/ εx, y). In this context, an
increasing returns to scale corresponds to SE>1 (εx, y<1), while a decreasing return to
scale corresponds to SE<1 (εx, y>1).
In addition, decomposing the first-order elasticities εx, ym and εx, y into the second-order
effects captures changes in output composition as scale expands. This decomposition is
implied by technological bias measures showing how the ym input elasticity or the
share εx, ym reflects a change in another output. Thus, these measures provide insights
into the output complementarity of the agricultural production system. Moreover, they
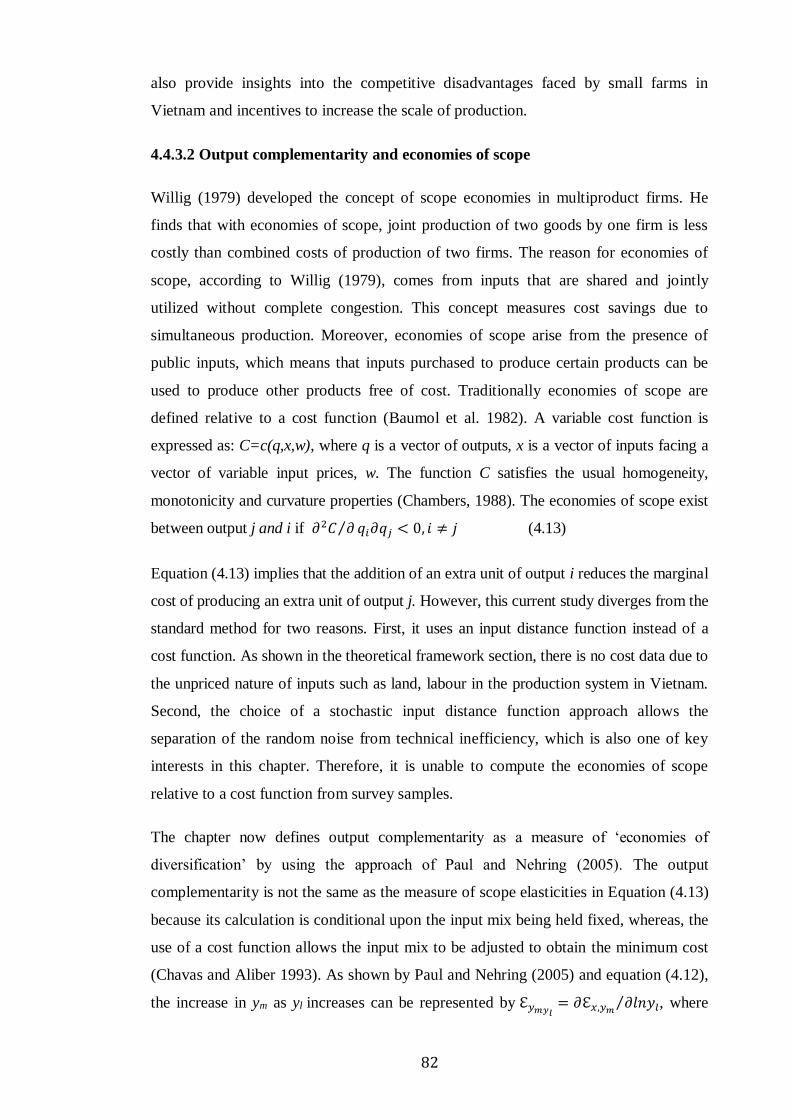
82
also provide insights into the competitive disadvantages faced by small farms in
Vietnam and incentives to increase the scale of production.
4.4.3.2 Output complementarity and economies of scope
Willig (1979) developed the concept of scope economies in multiproduct firms. He
finds that with economies of scope, joint production of two goods by one firm is less
costly than combined costs of production of two firms. The reason for economies of
scope, according to Willig (1979), comes from inputs that are shared and jointly
utilized without complete congestion. This concept measures cost savings due to
simultaneous production. Moreover, economies of scope arise from the presence of
public inputs, which means that inputs purchased to produce certain products can be
used to produce other products free of cost. Traditionally economies of scope are
defined relative to a cost function (Baumol et al. 1982). A variable cost function is
expressed as: C=c(q,x,w), where q is a vector of outputs, x is a vector of inputs facing a
vector of variable input prices, w. The function C satisfies the usual homogeneity,
monotonicity and curvature properties (Chambers, 1988). The economies of scope exist
between output j and i if 𝜕2𝐶 𝜕⁄ 𝑞𝑖𝜕𝑞𝑗 < 0, 𝑖 ≠ 𝑗 (4.13)
Equation (4.13) implies that the addition of an extra unit of output i reduces the marginal
cost of producing an extra unit of output j. However, this current study diverges from the
standard method for two reasons. First, it uses an input distance function instead of a
cost function. As shown in the theoretical framework section, there is no cost data due to
the unpriced nature of inputs such as land, labour in the production system in Vietnam.
Second, the choice of a stochastic input distance function approach allows the
separation of the random noise from technical inefficiency, which is also one of key
interests in this chapter. Therefore, it is unable to compute the economies of scope
relative to a cost function from survey samples.
The chapter now defines output complementarity as a measure of ‘economies of
diversification’ by using the approach of Paul and Nehring (2005). The output
complementarity is not the same as the measure of scope elasticities in Equation (4.13)
because its calculation is conditional upon the input mix being held fixed, whereas, the
use of a cost function allows the input mix to be adjusted to obtain the minimum cost
(Chavas and Aliber 1993). As shown by Paul and Nehring (2005) and equation (4.12),
the increase in ym as yl increases can be represented by ℇ𝑦𝑚𝑦𝑙= 𝜕ℇ𝑥,𝑦𝑚
𝜕𝑙𝑛𝑦𝑙⁄ , where

83
ℇ𝑥,𝑦𝑚 is a sum of all elasticities in Equation (4.12). If ℇ𝑦𝑚,𝑦𝑙
< 0, output jointness or
complementarity is implied. As a result, economies of scope exist in farm production
(Paul and Nehring 2005). In this case, input uses do not have to increase as much to
expand ym if the yl level is greater. With output complementarity, the cost of adding the
production of yl to the production of ym is smaller than the production of yl alone. As a
result, this elasticity is represented by the cross-output coefficient estimate αml,
ℇ𝑦𝑚,𝑦𝑙= 𝛼𝑚𝑙 = ℇ𝑦𝑙,𝑦𝑚
.
If the complementarity between outputs is satisfied, an increase in one output expands
the contribution of other outputs and thus performance improvement and cost savings.
As regards cost-minimizing levels of inputs, the elasticity of D with respect to any
input, xn equals its cost share, sn, that is: ℇ𝑥,𝑥𝑛= 𝜕𝑙𝑛𝐷 𝜕𝑙𝑛𝑥𝑛⁄ = 𝑠𝑛 . This elasticity,
thus, represents the relative importance of input xn in the production process.
4.4.3.3 Elasticity of substitution
This section provides insights into the input contribution obtained from the input
distance function using the duality property between the cost function and input
distance function (Färe and Primont 1995). It also answers the second question: how
households adjust inputs in small farms to respond to the increasing cost stress in
multi-crop production. The elasticity of substitution can be estimated from cost
functions. However, using the approach of cost functions requires input prices, which
are missing in the household surveys in Vietnam (particularly land prices) due to
incomplete markets (World Bank 2006; Le 2009).
In this chapter, the estimated parameters of the input distance function are used to
calculate the Morishima elasticity of substitution (MES). 34 Blackorby and Russell
(1989) convincingly argue that the Morishima elasticity of substitution is the more
appropriate measure when there are more than two inputs in the production process.
This chapter mainly focuses on the computation. The approach has been applied in
several studies (Grosskopf et al. 1995 in public administration; Kumar 2006 in water
management; Rahman 2009, 2010 in Bangladesh’s agricultural production).
34The elasticity of substitution was originated from Hicks (1963). It is defined as the elasticity of the
ratio of two inputs with respect to the ratio of their marginal products. Morishima (1967) introduced the measure of substitutability in the multi-input case written in Japanese. Later, Blackorby and Russel
discovered and named the Morishima elasticity of substitution (MES). MES preserves the salient
characteristics of the original Hicksian concept. See further details in Blackorby and Russel (1989) for
an overview of MES.
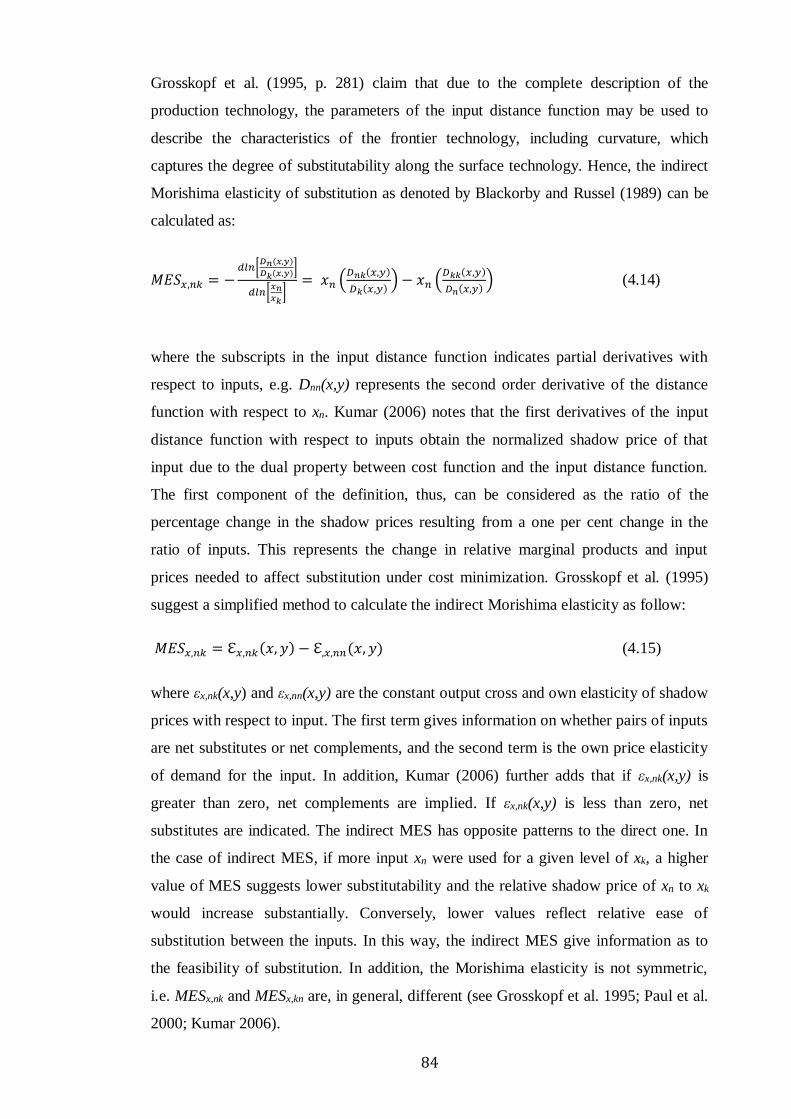
84
Grosskopf et al. (1995, p. 281) claim that due to the complete description of the
production technology, the parameters of the input distance function may be used to
describe the characteristics of the frontier technology, including curvature, which
captures the degree of substitutability along the surface technology. Hence, the indirect
Morishima elasticity of substitution as denoted by Blackorby and Russel (1989) can be
calculated as:
𝑀𝐸𝑆𝑥,𝑛𝑘 = −𝑑𝑙𝑛[
𝐷𝑛(𝑥,𝑦)
𝐷𝑘(𝑥,𝑦)]
𝑑𝑙𝑛[𝑥𝑛𝑥𝑘
]= 𝑥𝑛 (
𝐷𝑛𝑘(𝑥,𝑦)
𝐷𝑘(𝑥,𝑦)) − 𝑥𝑛 (
𝐷𝑘𝑘(𝑥,𝑦)
𝐷𝑛(𝑥,𝑦)) (4.14)
where the subscripts in the input distance function indicates partial derivatives with
respect to inputs, e.g. Dnn(x,y) represents the second order derivative of the distance
function with respect to xn. Kumar (2006) notes that the first derivatives of the input
distance function with respect to inputs obtain the normalized shadow price of that
input due to the dual property between cost function and the input distance function.
The first component of the definition, thus, can be considered as the ratio of the
percentage change in the shadow prices resulting from a one per cent change in the
ratio of inputs. This represents the change in relative marginal products and input
prices needed to affect substitution under cost minimization. Grosskopf et al. (1995)
suggest a simplified method to calculate the indirect Morishima elasticity as follow:
𝑀𝐸𝑆𝑥,𝑛𝑘 = ℇ𝑥,𝑛𝑘(𝑥, 𝑦) − ℇ,𝑥,𝑛𝑛(𝑥, 𝑦) (4.15)
where εx,nk(x,y) and εx,nn(x,y) are the constant output cross and own elasticity of shadow
prices with respect to input. The first term gives information on whether pairs of inputs
are net substitutes or net complements, and the second term is the own price elasticity
of demand for the input. In addition, Kumar (2006) further adds that if εx,nk(x,y) is
greater than zero, net complements are implied. If εx,nk(x,y) is less than zero, net
substitutes are indicated. The indirect MES has opposite patterns to the direct one. In
the case of indirect MES, if more input xn were used for a given level of xk, a higher
value of MES suggests lower substitutability and the relative shadow price of xn to xk
would increase substantially. Conversely, lower values reflect relative ease of
substitution between the inputs. In this way, the indirect MES give information as to
the feasibility of substitution. In addition, the Morishima elasticity is not symmetric,
i.e. MESx,nk and MESx,kn are, in general, different (see Grosskopf et al. 1995; Paul et al.
2000; Kumar 2006).

85
Intuitively, the Morishima elasticity of substitution measures how an increase in the ratio
of two inputs has an impact on the relative change in shadow prices of these inputs
(Blackorby and Russell 1989). It implies that input k is a substitute for input n if an
increase in the quantity of input k is associated with increases in the shadow price of
input n relative to the shadow price of input k. Conversely, if input k is a complement for
input n, the increase in quantity will result in the reduction of the shadow price of input
n, which means that there is an increase in the quantity of input n. Thus, MESx,nk<0
implies substitutability.
Using the parameters from the translog estimating Equation (4.11), εx,nk(x,y) and
εx,nn(x,y) are obtained as follows:
ℇ𝑥,𝑛𝑘(𝑥, 𝑦) = [𝛽𝑛𝑘 + 𝑆𝑛𝑆𝑘]/𝑆𝑘 if n ≠ k and ℇ𝑥,𝑛𝑛(𝑥, 𝑦) = [𝛽𝑛𝑛 + 𝑆𝑛(𝑆𝑛 − 1)]/𝑆𝑛 if n=n
(4.16)
where Sn is the first order derivative of the translog input distance function with respect
to xn as: 𝑆𝑛 = 𝜕𝑙𝑛𝐷/𝜕𝑙𝑛𝑥𝑛 = −𝜕𝑙𝑛𝑥1/𝜕𝑙𝑛𝑥𝑛 (4.17)
It should be noted that the elasticity of substitution (MES) is evaluated at the mean of
the data using the parameter estimates of Equation (4.11). In this chapter, the
substitution possibilities between family labour and other inputs are explored. In the
past few years, there has been an increasing trend for farm households to abandon
farms in rural Vietnam in light of rising cost stress (World Bank 2007 and 2011),35 and
thus this study investigates as to whether substitution possibilities could be explored.
4.4.4 Data
The data for the empirical analysis used are from VHLSS in 2006. This survey is
nationally representative, and consists of questionnaires at both household and
communal levels. There were 9,189 households in 2,216 communes surveyed in
VHLSS 2006. This empirical analysis focuses on rice-based farms that mainly grow
rice, starchy crops, vegetables and industrial annual crops. It should be noted that there
are 4,824 farm households representing 52.49 per cent of total households in VHLSS
2006. For this study, rural rice-based annual cropping farms are selected - 3,059 rice
farms accounting for an average 63.94 per cent of farms in the sample.
35 Also, in 2013, 42,785 families left over 6,882 hectares of fields untouched in Vietnam. Moreover,
3,407 families returned over 433 hectares of land. Some farmers state that the income they receive from
growing rice has shrunk (MARD 2014)

86
The main focus of this chapter is diversified farms and their economic performance.
Thus, among 3059 rice farms, households producing at least one another annual crop
are selected (this implies diversified farms). The sample used in this paper includes
pure tenant households, and land rental households. This selection criterion results in a
sample of 1,970 farm households, which may raise the issues of sample selectivity in
the analysis. However, the scope of this study only concentrates on diversified farms to
evaluate scale economies, output complementarity, and technical efficiency as
measures of economic performance. Therefore, the issues of sample selection do not
lead to any serious problems for the objective of this study.
In this chapter, there are four outputs including rice (y1), vegetables (y2), starchy
outputs (y3) and annual industrial outputs (y4). Rice is measured in kilograms produced
in the 12 months prior to the survey date. Other annual outputs are measured in value.
There are 21 different crops classified as vegetables, starchy crops and industrial
annual products in VHLSS.36 Without aggregating crops, not possible is to estimate the
model with the inclusion of these 21 annual crops and rice. Therefore, the valid way to
aggregate these crops is through the value. In the literature, there are other researchers
who face the same problem in the case of cash crops (Brümmer et al. 2006; Rahman
2009 and 2010; Rasmussen 2010). These studies use the aggregated value of all cash
crops plus the quantity of food crop to estimate the input distance function.
There are seven inputs used in the Model (4.11) including x1, a normalizing variable
measured by the amount of area in hectares that farm households use for annual crops;
x2, family labour in hours; x3, fertilizer in kilograms; x4, pesticide; x5, hired labour; x6,
hired capital;37 x7, seeds. There were a large number of observations that have zero
value for the input variables x5 (hired labour) and x6 (hired capital). Morrison-Paul et
al. (2000) show that some zeroes in the input variables make use of the translog form
questionable - a typical fix for this is to substitute some minute amount of the variable
to permit logs to be taken.
Table 4.1 describes the summary of statistics on the variables used in the analysis. In
the inefficiency model, there are a number of variables representing farms’
36 In the VHLSS 2006, vegetables include potatoes, water spinach, kohlrabi, cabbage, cauliflower,
mustard greens of all kinds, fresh beans of all kinds, tomatoes, spiced herbs, and other vegetables, tubers
and fruits. Starchy crops cover maize, sweet potatoes, cassava, manioc, and other starchy plants. Annual industrial crops include soybeans, peanuts, and sesame seeds. All crops are aggregated using the value
of harvested output. 37Hired capital includes land rental or contracting, rental of assets, machinery, equipment and means of
transport, and rental of cattle for ploughing per year.

87
characteristics that may affect technical efficiency. The age of the farm household
head is included to control for demographic differences between farms. The level of
education as a common technical efficiency shifter is also used in the model. All
studies related to farm technical efficiency use education as a key variable. Kompas et
al. (2004 and 2012) use years of schooling of the household head to capture the
education effect in the model. This chapter evaluates the impact of education by
decomposing between male and female education. Given the gender differences in
educational levels, as well as the diversification of farm tasks by gender, this study
uses the average education of adult females and males. Education is widely used as
one of key determinants of technical efficiency in agricultural production.
As regards land policy, there are two key variables - land fragmentation and land
certificate title. The number of plots measures land fragmentation. The chapter tests
whether land consolidation results in improved technical efficiency. As discussed in
the previous chapter, there are two sources to reduce land fragmentation: plot
exchange programs and the development of land markets. The latter is the ratio of land
under title to total land areas of farms. Marsh et al. (2006) show that allocating land
titles has been a key land reform in Vietnam. It not only creates more incentives to
invest in land, but also secures more credit in farm production, as without a land
certificate, it is not easy to secure a loan from official banks. The final variable in the
inefficiency model is the hours of participation in nonfarm activities. Farms with
higher nonfarm hours may operate at lower level of technical efficiency.
It should be noted that the average farm size of multiple crop-growing households is
small (0.41 hectare per farm) - 95% of farmers have land area less than one hectare. In
light of the high land fragmentation in rural Vietnam (average 6.32 plots per farm in
VHLSS 2006), diversification can be a method of reducing risk for small farms when
their income from rice production is low. Chavas and Di Falco (2012) found that
small-scale farms tend to diversify in order to stabilize the returns of different crops
and reduce risk. In contrast, large farms focus on specialization.
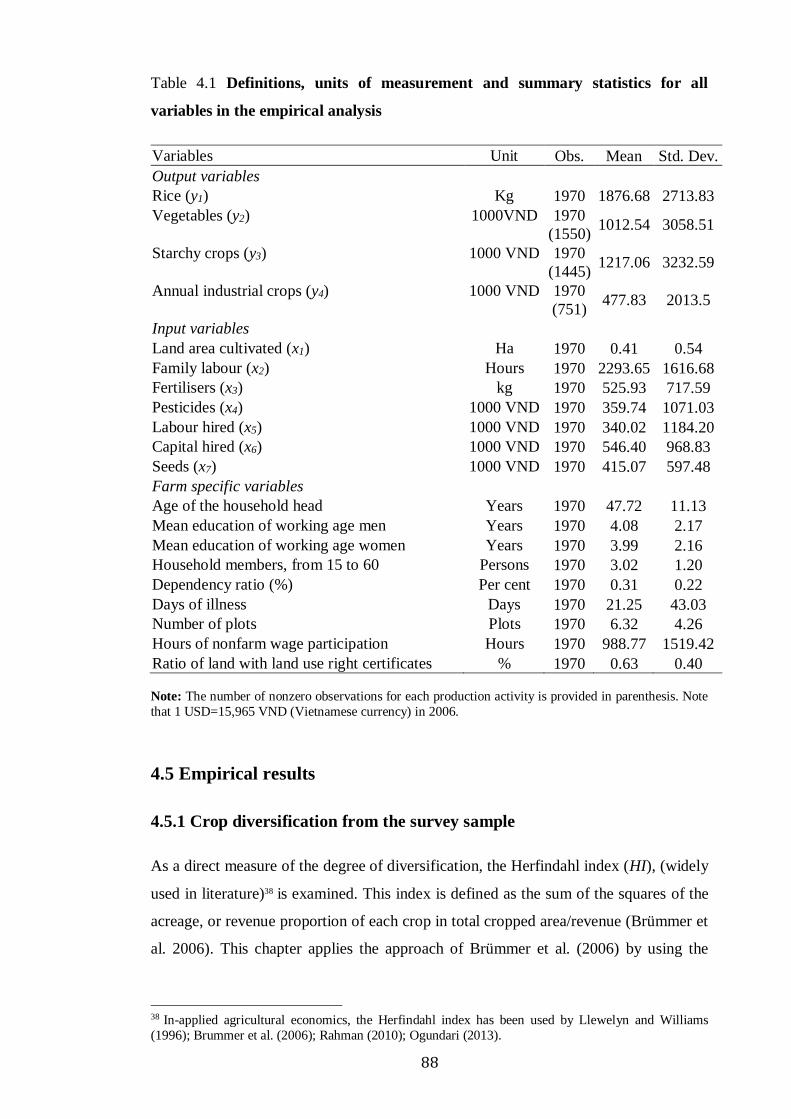
88
Table 4.1 Definitions, units of measurement and summary statistics for all
variables in the empirical analysis
Variables Unit Obs. Mean Std. Dev.
Output variables
Rice (y1) Kg 1970 1876.68 2713.83
Vegetables (y2) 1000VND 1970
(1550) 1012.54 3058.51
Starchy crops (y3) 1000 VND 1970
(1445) 1217.06 3232.59
Annual industrial crops (y4) 1000 VND 1970
(751) 477.83 2013.5
Input variables
Land area cultivated (x1) Ha 1970 0.41 0.54
Family labour (x2) Hours 1970 2293.65 1616.68
Fertilisers (x3) kg 1970 525.93 717.59
Pesticides (x4) 1000 VND 1970 359.74 1071.03
Labour hired (x5) 1000 VND 1970 340.02 1184.20
Capital hired (x6) 1000 VND 1970 546.40 968.83
Seeds (x7) 1000 VND 1970 415.07 597.48
Farm specific variables
Age of the household head Years 1970 47.72 11.13
Mean education of working age men Years 1970 4.08 2.17
Mean education of working age women Years 1970 3.99 2.16
Household members, from 15 to 60 Persons 1970 3.02 1.20
Dependency ratio (%) Per cent 1970 0.31 0.22
Days of illness Days 1970 21.25 43.03
Number of plots Plots 1970 6.32 4.26
Hours of nonfarm wage participation Hours 1970 988.77 1519.42
Ratio of land with land use right certificates % 1970 0.63 0.40
Note: The number of nonzero observations for each production activity is provided in parenthesis. Note
that 1 USD=15,965 VND (Vietnamese currency) in 2006.
4.5 Empirical results
4.5.1 Crop diversification from the survey sample
As a direct measure of the degree of diversification, the Herfindahl index (HI), (widely
used in literature)38 is examined. This index is defined as the sum of the squares of the
acreage, or revenue proportion of each crop in total cropped area/revenue (Brümmer et
al. 2006). This chapter applies the approach of Brümmer et al. (2006) by using the
38 In-applied agricultural economics, the Herfindahl index has been used by Llewelyn and Williams
(1996); Brummer et al. (2006); Rahman (2010); Ogundari (2013).
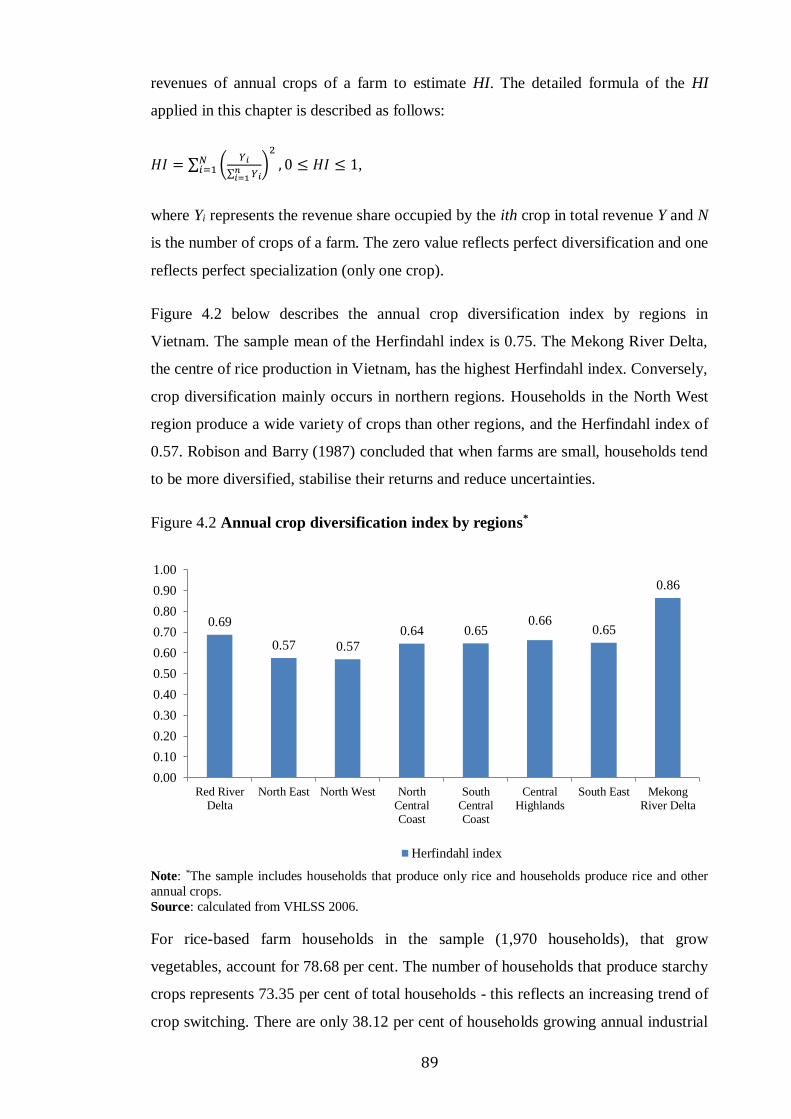
89
revenues of annual crops of a farm to estimate HI. The detailed formula of the HI
applied in this chapter is described as follows:
𝐻𝐼 = ∑ (𝑌𝑖
∑ 𝑌𝑖𝑛𝑖=1
)2
, 0 ≤ 𝐻𝐼 ≤ 1𝑁𝑖=1 ,
where Yi represents the revenue share occupied by the ith crop in total revenue Y and N
is the number of crops of a farm. The zero value reflects perfect diversification and one
reflects perfect specialization (only one crop).
Figure 4.2 below describes the annual crop diversification index by regions in
Vietnam. The sample mean of the Herfindahl index is 0.75. The Mekong River Delta,
the centre of rice production in Vietnam, has the highest Herfindahl index. Conversely,
crop diversification mainly occurs in northern regions. Households in the North West
region produce a wide variety of crops than other regions, and the Herfindahl index of
0.57. Robison and Barry (1987) concluded that when farms are small, households tend
to be more diversified, stabilise their returns and reduce uncertainties.
Figure 4.2 Annual crop diversification index by regions*
Note: *The sample includes households that produce only rice and households produce rice and other
annual crops.
Source: calculated from VHLSS 2006.
For rice-based farm households in the sample (1,970 households), that grow
vegetables, account for 78.68 per cent. The number of households that produce starchy
crops represents 73.35 per cent of total households - this reflects an increasing trend of
crop switching. There are only 38.12 per cent of households growing annual industrial
0.69
0.57 0.57
0.64 0.650.66
0.65
0.86
0.00
0.10
0.20
0.30
0.40
0.50
0.60
0.70
0.80
0.90
1.00
Red RiverDelta
North East North West NorthCentralCoast
SouthCentralCoast
CentralHighlands
South East MekongRiver Delta
Herfindahl index

90
crops. According to VHLSS 2006, among rice farmers, there are 70.2 per cent of
households that diversify their crops. There are 29.8 per cent of households that only
produce rice.
Figure 4.3 Land use patterns of rice growing households from surveyed sample
Notes: (a) = rice; (b) = vegetables; (c) = starchy crops; (d) = Annual industrial crops
Source: calculated from VHLSS 2006.
According to the GSO (2012), the whole country has 6.44 million of hectares for
annual crops, of which paddy land accounts for 63.97 per cent (4.12 million of
hectares). Marsh et al. (2006) provide an overview of land use patterns in Vietnam.
Under the 1993 Land Law, farm households have both rights and responsibilities in
using land, as stated in the policies associated with land use rights. However, land
related changes such as changes in land use purposes stated in the land use right
certificates, or reshaping plots, are officially registered with local authorities, which
may arise transaction costs during the registration. There are different land use patterns
in the VHLSS 2006. This chapter compiles the land use patterns for different crops
produced by farm households as follows: (a) rice, (b) vegetables, (c) starchy crops, and
(d) annual industrial crops. Based on these crops, land use patterns are divided into
seven categories. As can be seen in Figure 4.3, the number of households producing
rice, vegetables and starchy crops represents 29.6 per cent, while 25.6 per cent of
farms grow all crops. The number of farms growing both rice-vegetables and rice-
starchy crops accounts for 19.9 per cent and 12.3 per cent, respectively. It should be
noted that all crops were produced over the 12 months prior the survey date.
19.9
12.3
3.2
29.6
3.5
5.8
25.6(a) and (b)
(a) and (c)
(a) and (d)
(a), (b), and (c)
(a), (b), and (d)
(a), (c) and (d)
(a), (b), (c), and (d)

91
4.5.2 Tests of hypotheses for model selection
Table 4.2 provides the results of hypothesis tests. It provides the results of the likelihood
ratio tests, which compare the likelihood function under the null and alternative
hypothesis.39 There are five hypothesis tests, summarized in Table 4.2 below. Firstly,
testing the selection of a right functional form, the log likelihood specification test
rejects the Cobb-Douglas specification in favour of a translog production function.
Secondly, it tests whether the inefficiency term u is non-stochastic and equal to zero. In
this context, the deviation from the frontier of the input requirement set is solely
explained by random shocks and the input distance function can be estimated by the
ordinary least squares method. The log likelihood ratio test at 5% significant level rejects
the null hypothesis. As a result, this indicates that significant technical inefficiencies
exist in Vietnam’s agriculture.
Table 4.2 Tests of hypotheses
Name of tests Null hypothesis
Likelihood
ratio (χ2-
calculated)
χ2-
critical
(0.95)
Decision
1. Functional form
(Translog vs Cobb-
Douglass)
H0: βnk=αml=γmn=0 for all n,
k, m and l 1092.71 73.31
Reject
H0
(selected
TL)
2. No inefficiency
effect
H0:
γ=η0=η1=η2=η3=η4=η5=η6
=η7=η8=η9=0
41.39 3.84 Reject
H0
3. Farm specific
effects do not affect
technical
inefficiencies
H0:
η0=η1=η2=η3=η4=η5=η6=η7
=0
76.48 15.51 Reject
H0
4. Input-output
separability
H0: all γmn=0 for all m and
n 97.36 36.42
Reject
H0
5. Returns to scale
(scale economy if
εx,y<1)
H0: (Σαm)=1 for all m 11.39 3.84
Reject
H0 (scale
economy
exists)
Source: calculated from VHLSS 2006.
39 The analysis calculates the statistic LR=-2(lnLH(H0) - lnLH(H1) where LH(.) is defined as the
likelihood function, H0 the null hypothesis and H1 the alternative hypothesis. Thus, under the null
hypothesis, the statistic LR follows a chi-squared distribution with a number of degrees of freedom
equal to the number of restrictions. Steps introduced in Wooldridge (2012) are applied.

92
Next, I test whether the variables in the technical inefficiency model are statistically
significant. The null hypothesis is rejected at the 5 per cent level, implying that the
distribution of inefficiencies is not the same across individual households and is
subject to the variable of vector Mi in Equation (11a). This result is consistent with the
efficiency model introduced by Battese and Coelli (1995). Next, the hypothesis of
input-output separability is tested. This test is done by following the steps of Irz and
Thirtle (2004). This hypothesis test is defined mathematically by equating all cross-
terms between outputs and inputs (γmn) to zero. The null hypothesis is strongly
rejected, which indicates that it is impossible to aggregate consistently the two outputs
into a single index. As the same time, this result shows why the input distance function
is more appropriate than a stochastic frontier production function, which requires the
aggregation of all outputs before estimation. The final test introduced in Table 4.2 is
the presence of returns to scale in annual crop production in the context of multi-output
technology. This study also tests the summary of all regulatory restrictions of all αm
that are equal to one. The null hypothesis is also rejected in favour of the existence of
the scale economy.
Table 4.3 Monotonicity condition check
Inputs {𝜕𝑙𝑛𝐷 𝜕𝑥𝑛 ≥ 0⁄ }
for every input
Value Outcome
Outputs {𝜕𝑙𝑛𝐷 𝜕𝑦𝑚⁄ ≤ 0}
for every output
Value Outcome
Family labour
Fertiliser
Pesticide
Labour hired
Capital hired
Seeds
0.019
0.029
0.011
0.009
0.005
0.021
Fulfilled
Fulfilled
Fulfilled
Fulfilled
Fulfilled
Fulfilled
Rice
Vegetables
Starchy crops
Annual industrial
crops
-0.078
-0.007
-0.037
-0.062
Fulfilled
Fulfilled
Fulfilled
Fulfilled
Source: calculated from VHLSS 2006.
In this chapter, the monotonicity condition is tested, which shows that the input distance
function is non-decreasing in inputs (i.e. {𝜕𝑙𝑛𝐷 𝜕𝑥𝑛 ≥ 0⁄ } ) and non-increasing in
outputs (i.e. {𝜕𝑙𝑛𝐷 𝜕𝑦𝑚⁄ ≤ 0} ) (Hailu and Veeman, 2000). The fulfilling curvature
property (i.e. concave in xn and quasi-concave in ym), in accordance with production
theory, can be checked by examining the Hessian matrix of the second-order partial
differentials of the distance function with respect to outputs and inputs. Monotonicity
conditions are not violated if the elasticities of inputs are positive and elasticities of
93
outputs are negative. At all data points, the estimated input distance function is concave
for inputs and quasi-concave for outputs. As can be seen in the Table 4.3, monotonicity
condition is satisfied for all inputs and outputs. The signs of the coefficients of the first
order terms of inputs and output are consistent with theory.
4.5.3 Measures of economic performance
This section begins by examining the elasticities of inputs and outputs at the sample
mean. The elasticities are derived from the estimation of Equation (4.11).40 All the
variables are mean differenced prior to estimation so that elasticities of the input
distance function estimated at the sample mean are considered as first order
coefficients. Table 4.4 introduces the elasticities of input distance function at the
average values of the variables. As can be seen in the Table 4.4, the signs on the first
order coefficients of outputs and inputs are consistent with prior expectations. The
values in Table 4.4 as expected, are negative and statistically significant (휀𝐷,𝑦𝑚=
−휀𝑥1,𝑦𝑚). The elasticity with respect to rice (휀𝐷,𝑦𝑚
) is -0.606, the largest compared
with other outputs. These results also indicate that the cost elasticity of rice output is
larger than the corresponding elasticity of other annual crops. Furthermore, all output
elasticities are significantly different from zero, which implies that an increase in the
production of any of these outputs will increase costs substantially. The cost elasticity
of rice is 0.606, implying that one per cent increase in rice output results in an increase
in cost by 0.606 per cent. This estimated parameter, thus, reflects the dominance of
rice production in the Vietnamese agriculture.
The evidence of scale economies is also presented in Table 4.4. The presented measures
show significant scale economies (SE=1.075) for input-oriented specification (SE>1 or
(εx,y<1) indicates scale economies).41 This implies that when total inputs increase by 1
per cent, total outputs of production increase by 1.075 per cent, suggesting increasing
returns to scale. Similarly, εx,y=0.93 implies that when total outputs increase by 1 per
cent, total costs of production only rise by 0.93 per cent. This evidence is interesting
because other studies using the input distance function share the same findings for crop
40The full estimated results of the input distance function are presented in the Appendix. 55% of the
coefficients in the distance function are statistically significant. In this chapter, I only report the
elasticities computed from the coefficients and the average values of the variables in the data. See
further details about the estimated method in Grosskopf et al. (1995, pp. 293). 41Paul and Nehring (2005) find that the estimated scale economies are lower when off-farm income as
another output is included, which reflects the increasing prevalence of off-farm incomes for small
landholding farm households combats their scale disadvantages from only farming activities. I also find
a similar result but the estimate is insignificant so I do not report in this chapter.

94
farms (Paul and Nehring 2005, εx,y=0.653 for the US; Rahman 2010, εx,y=0.45 for
Bangladesh; Rasmussen 2010, εx,y=0.723 for Denmark). Ogundari and Brümmer (2010)
also found evidence of increasing returns to scale in cassava production in Nigeria using
the output distance function. Using the US farm data, Chavas and Aliber (1993) had the
same evidence of economies of scale in small farms.
Table 4.4 Elasticities of input distance function at sample means (first order
components)
Variables Symbol Valuea t-ratio
Output elasticities
Scale economy (1/εx, y)
Summaries of all output elasticities
Rice
Vegetables
Starchy crops
Annual industrial crops
Input elasticities
Family labour
Fertilizer
Pesticides
Seeds
Capital hired
Labour hired
Land
Output complementarity
Rice and vegetables
Rice and starchy crops
Rice and annual industrial crops
Vegetables and starchy crops
Vegetables and annual industrial crops
Starchy crops and annual industrial crops
SE
εx, y
εx, y1
εx, y2
εx, y3
εx, y4
εx, x2
εx, x3
εx, x4
εx, x5
εx, x6
εx, x7
εx, x1
εx,y12
εx,y13
εx,y14
εx,y23
εx,y23
εx,y34
1.075
0.93
0.606***
0.024 ***
0.217***
0.083*
-0.165***
-0.204***
-0.068***
-0.089***
-0.028***
-0.126***
-0.320
-0.011***
-0.019***
-0.023***
-0.003**
-0.0003
-0.0004
23.08
3.35
5.65
1.88
-7.74
-7.09
-2.88
-5.00
-3.90
-6.11
-3.65
-6.93
-5.10
-2.44
-0.48
-0.53
Notes: a evaluated at the means of the data using the parameter estimates of Equation (4.11); The
elasticity of land is computed by taking the difference between 1 and the sum of the coefficients of all
other inputs.
However, studies that use other methods provide mixed results. When Vu (2012)
applies the approach of data envelopment analysis, he concludes that the majority of
rice farms are operating with increasing returns to scale in Vietnam. This finding
suggests that a large number of rice farms in Vietnam should increase their scale of
operations to gain scale efficiency. There has been no study on returns to scale in the
context of multi-output farms in Vietnam. Conversely, Wadud and White (2000) with
Rahman (2010) found the opposite, when they supported the decreasing returns to
95
scale in Bangladesh agriculture. However, Wadud and White (2000) focused on rice or
a single crop, rather than multi-output and multi-input technology. Therefore, the
results shown in the literature are largely subject to selected methods to measure the
scale economies and the context of multi-or single output.
Similarly, the first order conditions of the input distance function with respect to inputs
are equal to cost shares and imply the importance of inputs in annual crop production.
As can be seen in Table 4.4, all elasticities are statistically significant at one per cent
level. Land has the largest elasticity with the value of 0.32, which means that the cost
of land represents 32 per cent of total cost at the sample mean.42 The family labour cost
accounts for 16.3% of total production costs, reflecting the importance of family
labour in the production process. It should be noted that the markets for land and
labour in developing countries are not sufficiently developed.43 As a result, there is a
lack of information on land prices or family labour input in the household data
surveys, which cannot provide the information on the cost shares of land and family
labour (Kumar 2006).
To further investigate the implications of the estimated parameters of output
complementarity, 휀𝑥,𝑦𝑚,𝑦𝑙 is estimated. As can be seen in Table 4.4, there is a
complementarity between rice and other crops. For instance, estimated coefficient
between rice and starchy crop is 0.019, which implies that a 1 per cent increase in rice
output will reduce the marginal utilization of inputs for producing starchy outputs by
0.019 per cent. In addition, these coefficients are statistically significant, and therefore
does not support the rejection of the null hypothesis of no output complementarity at
any normal level of significance. There is no evidence of output complementarity
across the combinations of vegetables and annual industrial crops, or starchy crops and
annual industrial crops. However, there may be potential clashes with resource
allocation requirements, such as land and labour.
As a result, this finding indicates that significant output complementarity exists in
farming systems comprising rice production and other crops which implies the
potential presence of economies of scope in crop diversification. Paul and Nehring
42Due to regulatory restrictions, ∑ 𝛽𝑛𝑛 = 1 in Equation (11), the elasticity of land is computed by
taking the difference between 1 and the sum of the coefficients of all other inputs. Thus, the significant
level cannot be reported in Table 4.4. 43Many studies find that perfect labour and land markets are rarely found in developing countries
(Benjamin 1992; Urdy 1996; Jolliffe 2004). Le (2010) also rejected the perfect market assumptions in
the sample of Vietnamese farmers. World Bank (2006) has the same conclusion for land market in
Vietnam when the government controls land prices and ownership.
96
(2005) show that if the evidence of economies of scope is found, average costs for a
farm household in producing more than two outputs are lower and cost savings from
the by-products in the production process. Increasing the production of other annual
products reduces the input share of rice. Inputs of rice production are also used for
other cash cropping such as family labour and land. Farm households appears to adapt
strategies by combining cash cropping with rice production.
Furthermore, farm households still retain significant subsistence rice production while
increasing cash cropping activities which rely on households’ farm labour, farming
methods and land. Small farms in the sample may adjust their production by making
productive use of family labour surplus in slack seasons, and avoiding the bottlenecks
in the labour utilization. The evidence of output complementarity is also explained by
labour combination in different and between seasons. When small farms diversify their
livelihoods into vegetables, starchy crops or annual industrial crops, they have many
opportunities to make decisions on different activities that complement each other,
given the seasonal nature of their labour demand throughout the year. There have been
no studies on crop diversification in Vietnam, thus, this result cannot be verified and
compared. Similar results are found in Rahman (2010) for Bangladesh’s agricultural
production and Ogundari and Brümmer (2011) for cassava and other crops in Nigeria.
4.5.4 Elasticity of substitution and complementarity
The estimated coefficients from the distance function can be also used to derive the
cross and own price elasticities, which aim to answer the second question in this
chapter. In this section, εx,nk(x,y) and εx,nn(x,y) are computed using the method in
Equation (4.15). Grosskopf et al. (1995) also introduced the formula that is the same as
Equation (4.15), but the author ignores the output cross and own elasticity of shadow
prices with respect to inputs. Similarly, Rahman (2010) used the approach of
Grosskopf et al. (1995) and Kumar (2006) to calculate εx,nk(x,y) and εx,nn(x,y). In this
chapter, the approach of Grosskopf et al. (1995) is extended by introducing further
information on the output cross and own elasticity of shadow prices with respect to
inputs. It shout be noted that these are indirect elasticities. A higher value means less
responsiveness.
Moreover, if εx,nk(x,y) is less than zero, net substitutes are implied. Conversely, when
εx,nk(x,y) is greater than zero, net complements are indicated (Grosskopf et al. 1995).
The substitutability between inputs implies that as the shadow price (or cost share) of

97
an input increases, farm households employ more of another input. In contrast, the
complementarity between two inputs means that as the shadow price of an input
increases, farmers employ less of another input (Kumar 2006; Rahman 2010).
As can be seen in Table 4.5, among the cross elasticity between inputs, family labour
appears to be complementary to all other inputs, except hired labour, (hired labour can
be a substitute for family labour). The complementarity between family labour and
fertiliser, pesticides, capital and seeds implies that if the shadow prices of fertilisers,
pesticides, seeds and capital increase, there is a reduction of family labour supply.44 If
fertiliser prices increase, there will be a reduction in fertiliser demand. Therefore, the
increasing burden of high costs results in increasing inefficiency in crop production.
Consequently household members seek off-farm opportunities to smooth income and
consumption in light of the uncertainties of farm incomes (Reardon et al. 2001).
Table 4.5 Mean of output cross, and own indirect elasticity of shadow prices with
respect to inputs (εij), Vietnam
Labour Fertilizer Pesticide Hired labour Capital Seeds
Labour -1.112
(-16.17)
0.288
(4.02)
0.120
(0.95)
-0.312
(-3.05)
0.471
(4.03)
0.230
(2.68)
Fertiliser 0.352
(3.97)
-0.901
(-8.02)
0.337
(1.74)
0.362
(2.52)
0.014
(0.09)
-0.009
(-0.07)
Pesticide 0.051
(0.95)
0.116
(1.74)
-0.589
(-3.55)
-0.348
(-3.60)
0.004
(0.05)
0.221
(2.68)
Hired labour -0.057
(-3.05)
0.053
(2.52)
-0.149
(-3.60)
-0.217
(-1.67)
0.066
(1.89)
-0.073
(-2.74)
Capital 0.079
(4.03)
0.002
(0.09)
0.002
(0.05)
0.061
(1.89)
-1.438
(-12.07)
0.048
(1.61)
Seeds 0.204
(2.68)
-0.004
(-0.05)
0.462
(2.68)
-0.355
(-2.74)
0.250
(1.61)
-0.848
(-6.53)
Notes: t-values are in parentheses; evaluated at the mean of the data using parameter estimates from
Equation (4.11).
Source: calculated from VHLSS 2006.
Interestingly, using elasticity of substitution provides one answer to the question as to
why farmers have left their fields in rural Vietnam. For this reason, the Vietnam
government should change its approach to designing food security policies. Instead of
44Kumar (2006) shows that the absolute shadow price reflects the actual proportion of inputs used by an inefficient producer. Hence, the shadow price means the cost share of an input. He also assumed that the
observed price of one input is equal to its shadow price. Similarly, Rahman (2010, p.335) applies the
same method used in Kumar (2006) to compute elasticities in Bangladesh agricultural production. In
this current paper, we use the same approach to analyse the elasticities between inputs.

98
only focusing on rice price policy and subsidies to state owned enterprises in food
industries and rice exports (Kompas et al. 2012), the government should note that the
reduction of costs of production such as fertiliser, pesticides, seeds and hired capital
also plays a vital role in creating more incentives for farmers to stay and invest in
agricultural production. In addition, increasing cost stress contributes to the
reallocation of household resources by reducing the investment in agriculture.
The elasticity of substitution between family labour and hired labour is also of interest.
In light of rising landlessness in Vietnam, the substitutability between family labour and
hired labour also has policy implications. In 2004, the landlessness rate in Vietnam was
13.55 per cent, which led to increasing social stratification in rural areas; more farm
households hired labour for farming activities and participated in off-farm jobs (Akram-
Lodhi 2005; Ravallion and van de Walle 2006). In this chapter, increasing cost stress
and social stratification in rural areas also contribute to labour allocation in farm
households in rural Vietnam.
Table 4.5 also provides evidence of net substitutes between family labour and hired
labour, which implies that the increase in farm labour supply depends on the shadow
price of hired labour, as well as other inputs. As the shadow price of hired labour rises,
households increase the family labour supply. Conversely, households reduce family
labour required for farming activities. The reduction of demand for hired labour as a
result of increasing rural wages results in the reduction of the shadow price of family
labour. Conversely, if more family labour participates in off-farm jobs, the shadow
price of hired labour will go down. As the degree of substitutability between family
and hired labour increases, farm operators can more easily hire replacement workers
on the farm. The family labour can then allocate more hours to off-farm activities or
migrate to urban areas (D’Antoni et al. 2014). This can result in increasing inequality
and social stratification within rural areas as shown by Akram-Lodhi (2005).
Furthermore, the complementarity between hired labour and capital implies the labour-
intensive dominance in small farms in Vietnam.
As regards the relationship between fertiliser and family labour, an increase in the
shadow price of fertiliser reduces family farm labour supply. In other words, an increase
in fertiliser price results in the reduction of the demand for fertiliser consumption. Then
the reduction of fertiliser quantities leads to a rise in the shadow price of family labour
due to the complementarity between these inputs. As a result, there is a reduction of
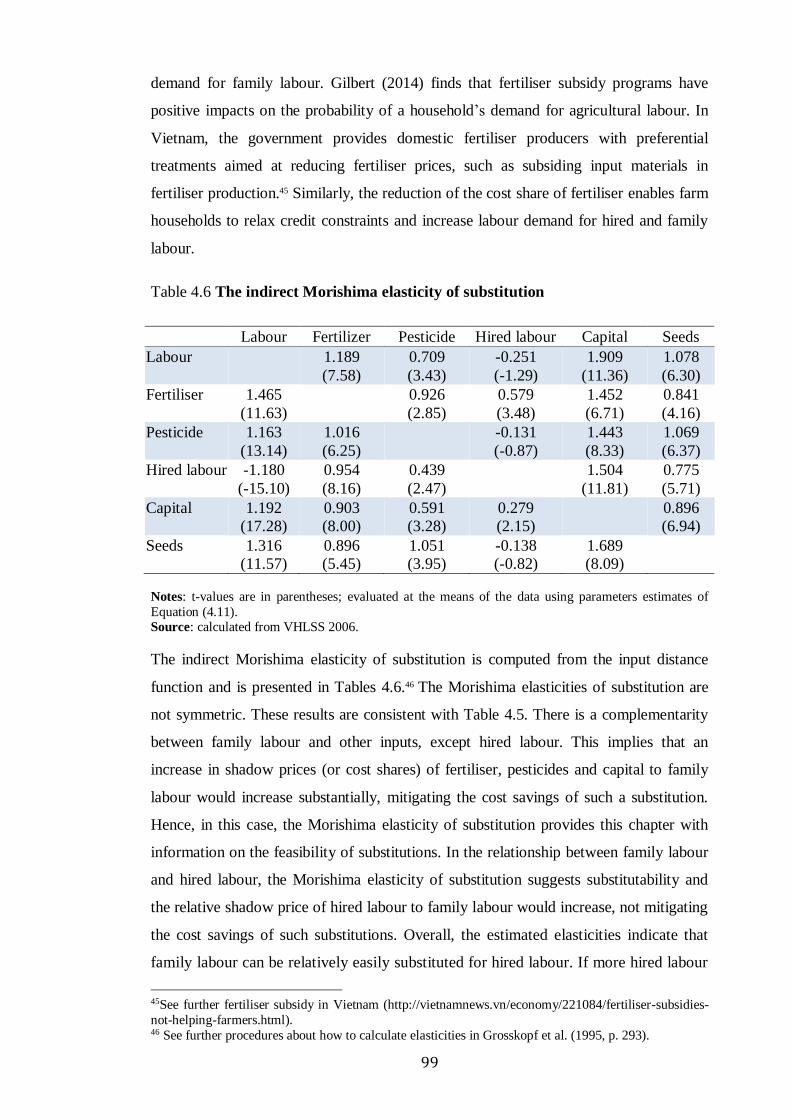
99
demand for family labour. Gilbert (2014) finds that fertiliser subsidy programs have
positive impacts on the probability of a household’s demand for agricultural labour. In
Vietnam, the government provides domestic fertiliser producers with preferential
treatments aimed at reducing fertiliser prices, such as subsiding input materials in
fertiliser production.45 Similarly, the reduction of the cost share of fertiliser enables farm
households to relax credit constraints and increase labour demand for hired and family
labour.
Table 4.6 The indirect Morishima elasticity of substitution
Labour Fertilizer Pesticide Hired labour Capital Seeds
Labour
1.189
(7.58)
0.709
(3.43)
-0.251
(-1.29)
1.909
(11.36)
1.078
(6.30)
Fertiliser 1.465
(11.63)
0.926
(2.85)
0.579
(3.48)
1.452
(6.71)
0.841
(4.16)
Pesticide 1.163
(13.14)
1.016
(6.25)
-0.131
(-0.87)
1.443
(8.33)
1.069
(6.37)
Hired labour -1.180
(-15.10)
0.954
(8.16)
0.439
(2.47)
1.504
(11.81)
0.775
(5.71)
Capital 1.192
(17.28)
0.903
(8.00)
0.591
(3.28)
0.279
(2.15)
0.896
(6.94)
Seeds 1.316
(11.57)
0.896
(5.45)
1.051
(3.95)
-0.138
(-0.82)
1.689
(8.09)
Notes: t-values are in parentheses; evaluated at the means of the data using parameters estimates of
Equation (4.11). Source: calculated from VHLSS 2006.
The indirect Morishima elasticity of substitution is computed from the input distance
function and is presented in Tables 4.6.46 The Morishima elasticities of substitution are
not symmetric. These results are consistent with Table 4.5. There is a complementarity
between family labour and other inputs, except hired labour. This implies that an
increase in shadow prices (or cost shares) of fertiliser, pesticides and capital to family
labour would increase substantially, mitigating the cost savings of such a substitution.
Hence, in this case, the Morishima elasticity of substitution provides this chapter with
information on the feasibility of substitutions. In the relationship between family labour
and hired labour, the Morishima elasticity of substitution suggests substitutability and
the relative shadow price of hired labour to family labour would increase, not mitigating
the cost savings of such substitutions. Overall, the estimated elasticities indicate that
family labour can be relatively easily substituted for hired labour. If more hired labour
45See further fertiliser subsidy in Vietnam (http://vietnamnews.vn/economy/221084/fertiliser-subsidies-
not-helping-farmers.html). 46 See further procedures about how to calculate elasticities in Grosskopf et al. (1995, p. 293).

100
were employed for a given level of family labour, a negative and small MES between
hired and family labour suggests substitutability and the relative shadow price of hired
labour to family labour would reduce substantially, resulting in the cost savings of
such a substitution.
4.5.5 Technical efficiency
Prior studies mainly focused on technical efficiency in rice production in Vietnam.
Dao and Lewis (2013) found that the mean of technical efficiency for rice-based
multiple crop farms in four provinces in northern Vietnam was 0.83. In this chapter,
the mean technical efficiency is 0.813, which implies that the average farm households
could, in principle, reduce further 18.7 per cent of inputs to produce given crops or
increase outputs by 18.7 per cent at given inputs (Table 4.7). This also indicates that an
opportunity may exist to expand crop outputs without using more inputs, or with the
application of improved production technology. As can be seen in Figure 4.4, there is a
wide range of production inefficiency of farm households ranging from 21 per cent to
96 per cent in multiple-crop farming. The mean technical efficiency of multiple crop
farming is higher than other estimates of studies focusing only on rice. Kompas et al.
(2012) and Vu (2012) estimate the mean technical efficiency to be 0.77 and 0.78
respectively. This finding indicates that technical efficiency is higher in crop diversity
than single rice production.
Figure 4.4 Distribution of technical efficiency indices
Source: Calculated from VHLSS 2006.
0.00
10.00
20.00
30.00
40.00
50.00
60.00
Up to 0.6 0.60<0.71 0.71<0.81 0.81<0.91 0.91<1.0
%
Technical efficiency range
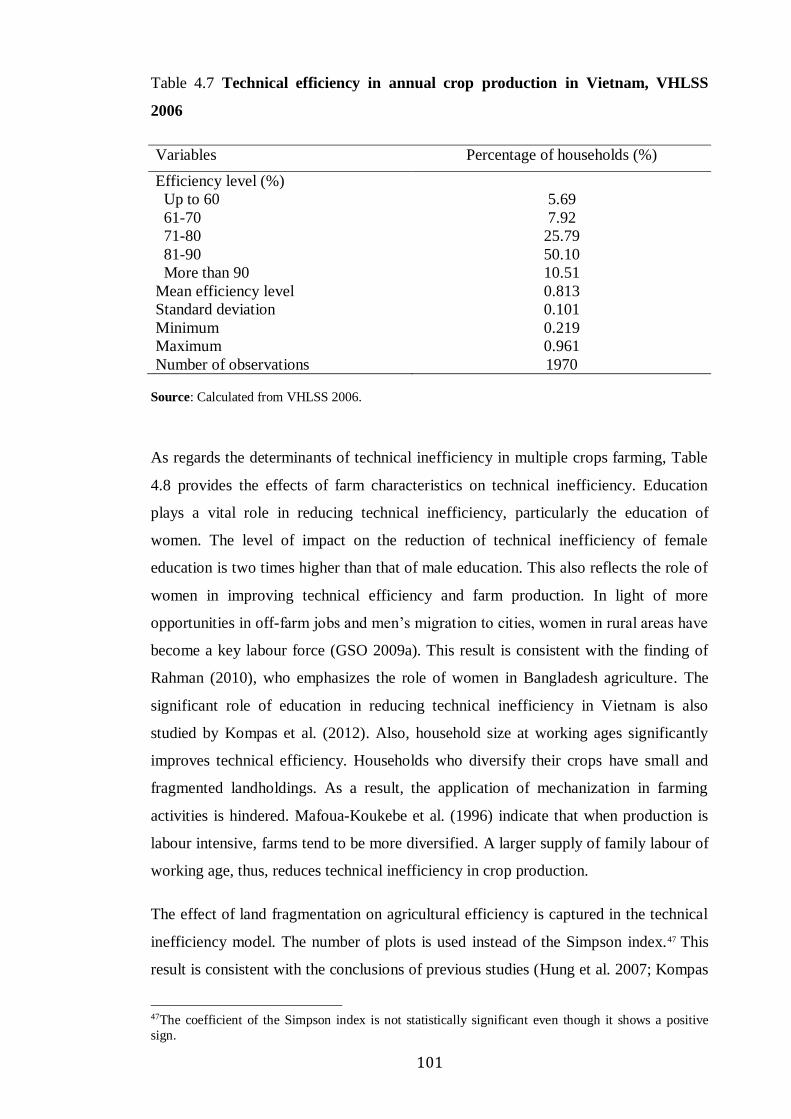
101
Table 4.7 Technical efficiency in annual crop production in Vietnam, VHLSS
2006
Variables Percentage of households (%)
Efficiency level (%)
Up to 60
61-70
71-80
81-90
More than 90
Mean efficiency level
Standard deviation
Minimum
Maximum
Number of observations
5.69
7.92
25.79
50.10
10.51
0.813
0.101
0.219
0.961
1970
Source: Calculated from VHLSS 2006.
As regards the determinants of technical inefficiency in multiple crops farming, Table
4.8 provides the effects of farm characteristics on technical inefficiency. Education
plays a vital role in reducing technical inefficiency, particularly the education of
women. The level of impact on the reduction of technical inefficiency of female
education is two times higher than that of male education. This also reflects the role of
women in improving technical efficiency and farm production. In light of more
opportunities in off-farm jobs and men’s migration to cities, women in rural areas have
become a key labour force (GSO 2009a). This result is consistent with the finding of
Rahman (2010), who emphasizes the role of women in Bangladesh agriculture. The
significant role of education in reducing technical inefficiency in Vietnam is also
studied by Kompas et al. (2012). Also, household size at working ages significantly
improves technical efficiency. Households who diversify their crops have small and
fragmented landholdings. As a result, the application of mechanization in farming
activities is hindered. Mafoua-Koukebe et al. (1996) indicate that when production is
labour intensive, farms tend to be more diversified. A larger supply of family labour of
working age, thus, reduces technical inefficiency in crop production.
The effect of land fragmentation on agricultural efficiency is captured in the technical
inefficiency model. The number of plots is used instead of the Simpson index.47 This
result is consistent with the conclusions of previous studies (Hung et al. 2007; Kompas
47The coefficient of the Simpson index is not statistically significant even though it shows a positive
sign.

102
et al. 2012). It means that the reduction of land fragmentation improve technical
efficiency. One of the interesting findings here is the effect of land use right
certificates on technical efficiency. If farms have titled land, there are more incentives
to invest and provide a source of collateral for loans. The empirical result shows that
farm households with a higher (and proper) ratio of land and holding land use right
certificates, are more efficient. This result is the same as the recent findings of Kompas
et al. (2012) and Vu (2012).
Table 4.8 Technical inefficiency model
Parameters Coefficients t value
Age of the household head η1 0.001
(0.005)
0.20
Mean education of working age men η2 -0.07***
(0.026)
-2.67
Mean education of working age women η3 -0.141***
(0.025)
-5.42
Household members, from 15 to 60 years old η4 0.398***
(0.06)
6.63
Dependency ratio (per cent) η5 0.643**
(0.289)
2.22
Days of illness η6 0.001
(0.001)
0.51
Number of plots η7 0.021*
(0.011)
1.96
Hours of nonfarm wages η8 -0.0002***
(0.0004)
-4.19
Ratio of land with land use right certificates η9 -0.203*
(0.122)
-1.66
Constant η0 -3.107***
(0.432)
-7.20
Number of observations 1970
Notes: ∗, ∗∗, ∗∗∗ indicates that the corresponding coefficients are significant at the 10%, 5%, and 1% levels, respectively; Standard errors are in parentheses.
Source: calculated from VHLSS 2006.
4.6 Concluding remarks
This chapter has reported on the analysis of economies of scale, output complementarity
and technical efficiency in the farming system comprising cropping activities of food
and other annual cash crops in rural Vietnam. It further provides information on the
responses of small-scale farm households to increasing cost stress in multi-crop
production. Scale economies and output complementarity were found in multiple crop
103
production. The elasticity of output with respect to total inputs is 1.075, which implies
that when total inputs increase by 1 per cent, total outputs of production increase by
1.075 per cent. Similarly, when total output increases by 1 per cent, total costs of
production rise by only 0.93 per cent. This finding reveals that slightly increasing returns
to scale are evident in Vietnamese multiple crop production. An increase in rice
production reduces the marginal utilization of inputs for producing other crops.
Moreover, crop combination results in cost savings in the production process. Thus,
output complementarity is found between rice as subsistence production, and other
crops. This finding implies the potential presence of economies of scope, which has
important implications on economic performance.
Results also show that households with smallholder production substantially respond to
cost stress in multiple crop environment. Family labour use and other inputs such as
fertilisers, pesticides and capital are complementary, which means that farm labour use
falls when the prices of these inputs increase. This finding contributes to the literature on
the push factors of labour allocation in smallholder farms. Since fertilizers, pesticides
and seeds account for the largest share of total production costs, policies that lead to
more incentives to invest in crop faming activities should focus on the reduction of input
costs. The government should spend more resources on reducing prices of fertilisers,
pesticides and hiring capital for farmers. The evidence of elasticity of substitution
between farm labour and fertilisers and pesticides indicates that subsidy programs on
fertilisers and pesticides can have a positive effect on the probability that a household
demands family labour, which can reduce the increasing trend of abandoning of
agricultural production in rural Vietnam.
However, any adjustment of the cost structure also impacts on rural labour market
when more farmers have worked for farm wages (Akram-Lodhi 2005). The result
shows that there is substitution between family labour and hired labour. With the
increasing participation in nonfarm activities by smallholders, the reliance on hired
labour is more important for producers. The farm household can allocate more hours to
off-farm work by hiring replacement workers on the farm. Therefore, it would be
expected that a large increase in government input subsidy would have a significant
impact on the flow of labour into farming activities, mainly on the reduction of
demand for hired labour. Warr and Yusuf (2014) find that in Indonesia, input subsidies
such as for fertiliser have a large and positive impact on unskilled wages.
104
Another finding is the existence of substantial technical inefficiency in multiple-crop
farming, this implying that there may be opportunities to expand crop output by 18.7
per cent without resort to greater uses of inputs or improved technologies in farm
production. There were seven variables which significantly affect technical
inefficiency. The improvement of education, particularly for women, and the reduction
of the dependency ratio both contribute to improving technical efficiency.
Furthermore, land reforms directed toward the reduction of land fragmentation and
improvement of proper land rights should be strengthened to improve efficiency.
The policy implication of this research is that priority should be given the design of
policies to promote crop diversification for small farms, which is found to improve
productivity through scale economies, output complementarity and technical efficiency
improvement. Although the Vietnamese government appears to give priority to rice self-
sufficiency policies rather than the income of farmers, Kompas et al. (2012) conclude
that the mandate to grow rice in all provinces, at least in terms of defined efficiency
criteria, is not appropriate. The recent thrust of the Vietnamese government to promote
diversification in the Strategy of Agriculture and Rural Development (2011-2020) is a
step in a right direction. Therefore, crop diversity should be expanded to improve the
income of farm households. As part of an FAO nutrition-sensitive food systems
approach, crop diversification improves the nutritional health status of low-income
households through the increased production of nutrient-rich foods for direct
consumption and generation of the income needed to procure the amount and variety of
food that families need (FAO 2012). There are some issues that need to be further
developed in future research. This chapter focuses only on annual cropping activities.
It would be useful to investigate the patterns of diversification involving off-farm
activities. In addition, sources of economies of diversification are also ignored in this
study. This issue should be further studied in the future.
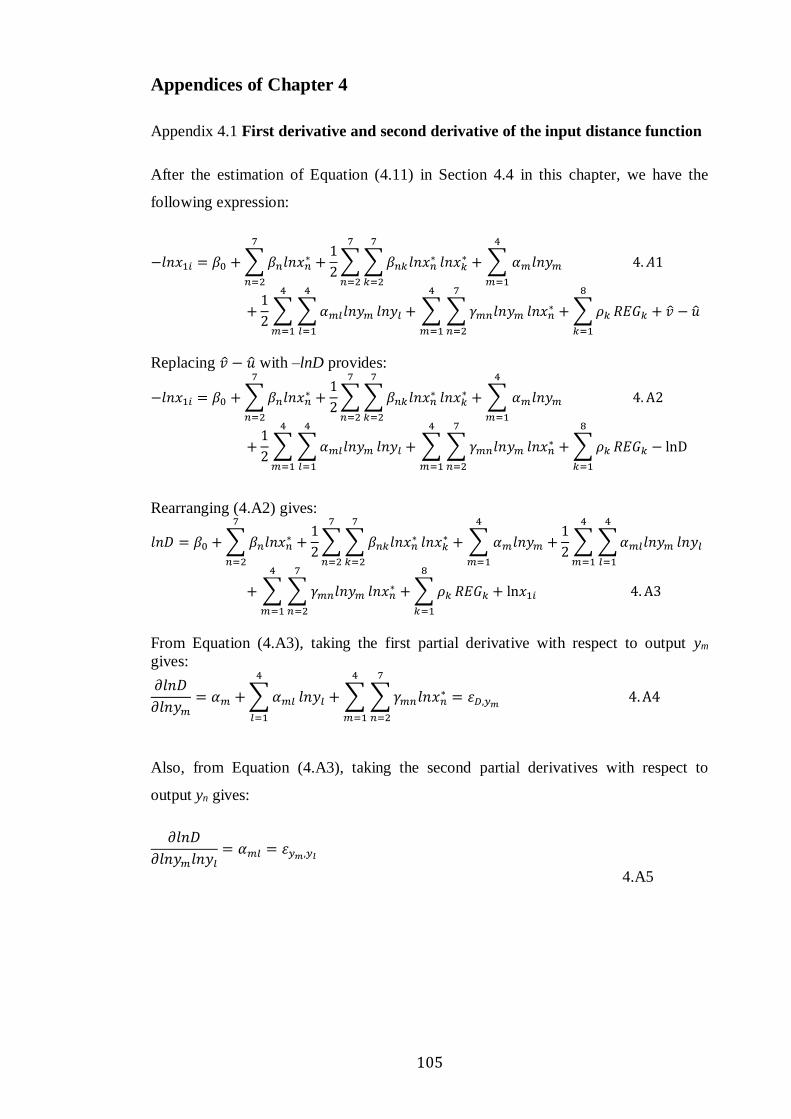
105
Appendices of Chapter 4
Appendix 4.1 First derivative and second derivative of the input distance function
After the estimation of Equation (4.11) in Section 4.4 in this chapter, we have the
following expression:
−𝑙𝑛𝑥1𝑖 = 𝛽0 + ∑ 𝛽𝑛𝑙𝑛𝑥𝑛∗
7
𝑛=2
+1
2∑ ∑ 𝛽𝑛𝑘𝑙𝑛𝑥𝑛
∗
7
𝑘=2
7
𝑛=2
𝑙𝑛𝑥𝑘∗ + ∑ 𝛼𝑚𝑙𝑛𝑦𝑚
4
𝑚=1
4. 𝐴1
+1
2∑ ∑ 𝛼𝑚𝑙𝑙𝑛𝑦𝑚
4
𝑙=1
4
𝑚=1
𝑙𝑛𝑦𝑙 + ∑ ∑ 𝛾𝑚𝑛𝑙𝑛𝑦𝑚
7
𝑛=2
4
𝑚=1
𝑙𝑛𝑥𝑛∗ + ∑ 𝜌𝑘
8
𝑘=1
𝑅𝐸𝐺𝑘 + �� − ��
Replacing 𝑣 − �� with –lnD provides:
−𝑙𝑛𝑥1𝑖 = 𝛽0 + ∑ 𝛽𝑛𝑙𝑛𝑥𝑛∗
7
𝑛=2
+1
2∑ ∑ 𝛽𝑛𝑘𝑙𝑛𝑥𝑛
∗
7
𝑘=2
7
𝑛=2
𝑙𝑛𝑥𝑘∗ + ∑ 𝛼𝑚𝑙𝑛𝑦𝑚
4
𝑚=1
4. A2
+1
2∑ ∑ 𝛼𝑚𝑙𝑙𝑛𝑦𝑚
4
𝑙=1
4
𝑚=1
𝑙𝑛𝑦𝑙 + ∑ ∑ 𝛾𝑚𝑛𝑙𝑛𝑦𝑚
7
𝑛=2
4
𝑚=1
𝑙𝑛𝑥𝑛∗ + ∑ 𝜌𝑘
8
𝑘=1
𝑅𝐸𝐺𝑘 − lnD
Rearranging (4.A2) gives:
𝑙𝑛𝐷 = 𝛽0 + ∑ 𝛽𝑛𝑙𝑛𝑥𝑛∗
7
𝑛=2
+1
2∑ ∑ 𝛽𝑛𝑘𝑙𝑛𝑥𝑛
∗
7
𝑘=2
7
𝑛=2
𝑙𝑛𝑥𝑘∗ + ∑ 𝛼𝑚𝑙𝑛𝑦𝑚
4
𝑚=1
+1
2∑ ∑ 𝛼𝑚𝑙𝑙𝑛𝑦𝑚
4
𝑙=1
4
𝑚=1
𝑙𝑛𝑦𝑙
+ ∑ ∑ 𝛾𝑚𝑛𝑙𝑛𝑦𝑚
7
𝑛=2
4
𝑚=1
𝑙𝑛𝑥𝑛∗ + ∑ 𝜌𝑘
8
𝑘=1
𝑅𝐸𝐺𝑘 + ln𝑥1𝑖 4. A3
From Equation (4.A3), taking the first partial derivative with respect to output ym
gives:
𝜕𝑙𝑛𝐷
𝜕𝑙𝑛𝑦𝑚
= 𝛼𝑚 + ∑ 𝛼𝑚𝑙
4
𝑙=1
𝑙𝑛𝑦𝑙 + ∑ ∑ 𝛾𝑚𝑛𝑙𝑛𝑥𝑛∗ = 휀𝐷,𝑦𝑚
4. A4
7
𝑛=2
4
𝑚=1
Also, from Equation (4.A3), taking the second partial derivatives with respect to
output yn gives:
𝜕𝑙𝑛𝐷
𝜕𝑙𝑛𝑦𝑚𝑙𝑛𝑦𝑙
= 𝛼𝑚𝑙 = 휀𝑦𝑚,𝑦𝑙
4.A5
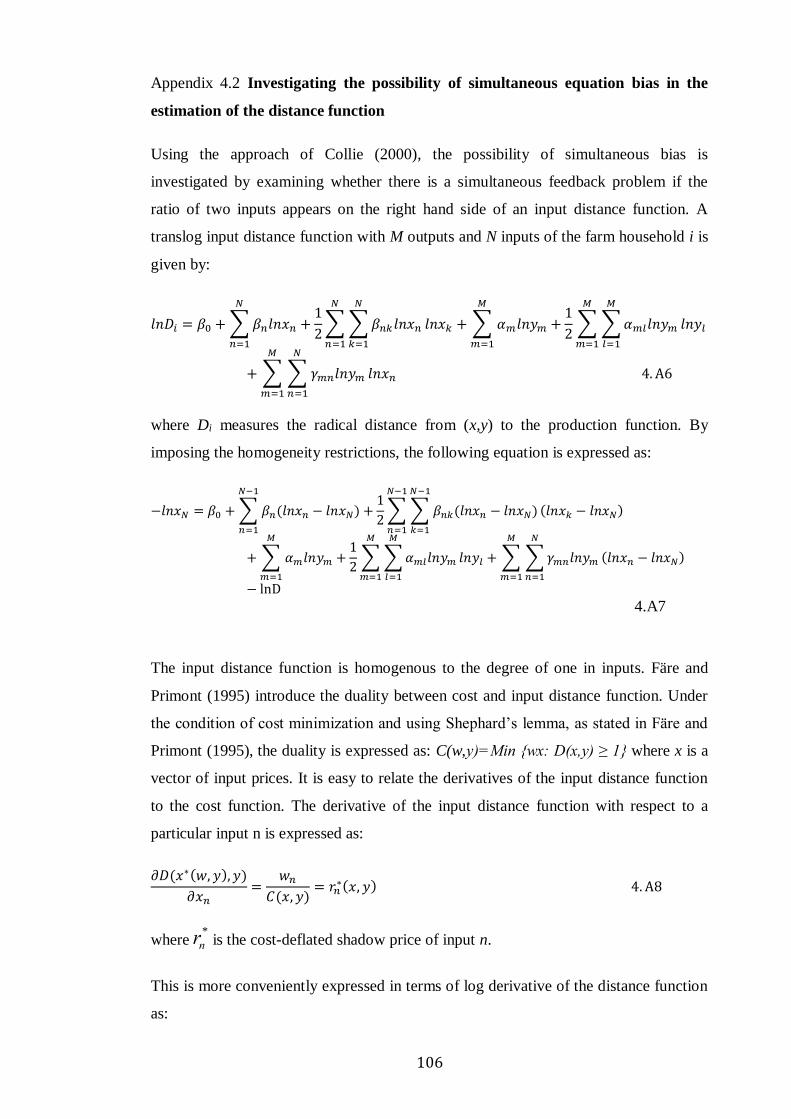
106
Appendix 4.2 Investigating the possibility of simultaneous equation bias in the
estimation of the distance function
Using the approach of Collie (2000), the possibility of simultaneous bias is
investigated by examining whether there is a simultaneous feedback problem if the
ratio of two inputs appears on the right hand side of an input distance function. A
translog input distance function with M outputs and N inputs of the farm household i is
given by:
𝑙𝑛𝐷𝑖 = 𝛽0 + ∑ 𝛽𝑛𝑙𝑛𝑥𝑛
𝑁
𝑛=1
+1
2∑ ∑ 𝛽𝑛𝑘𝑙𝑛𝑥𝑛
𝑁
𝑘=1
𝑁
𝑛=1
𝑙𝑛𝑥𝑘 + ∑ 𝛼𝑚𝑙𝑛𝑦𝑚
𝑀
𝑚=1
+1
2∑ ∑ 𝛼𝑚𝑙𝑙𝑛𝑦𝑚
𝑀
𝑙=1
𝑀
𝑚=1
𝑙𝑛𝑦𝑙
+ ∑ ∑ 𝛾𝑚𝑛𝑙𝑛𝑦𝑚
𝑁
𝑛=1
𝑀
𝑚=1
𝑙𝑛𝑥𝑛 4. A6
where Di measures the radical distance from (x,y) to the production function. By
imposing the homogeneity restrictions, the following equation is expressed as:
−𝑙𝑛𝑥𝑁 = 𝛽0 + ∑ 𝛽𝑛(𝑙𝑛𝑥𝑛 − 𝑙𝑛𝑥𝑁)
𝑁−1
𝑛=1
+1
2∑ ∑ 𝛽𝑛𝑘(𝑙𝑛𝑥𝑛 − 𝑙𝑛𝑥𝑁)
𝑁−1
𝑘=1
𝑁−1
𝑛=1
(𝑙𝑛𝑥𝑘 − 𝑙𝑛𝑥𝑁)
+ ∑ 𝛼𝑚𝑙𝑛𝑦𝑚
𝑀
𝑚=1
+1
2∑ ∑ 𝛼𝑚𝑙𝑙𝑛𝑦𝑚
𝑀
𝑙=1
𝑀
𝑚=1
𝑙𝑛𝑦𝑙 + ∑ ∑ 𝛾𝑚𝑛𝑙𝑛𝑦𝑚
𝑁
𝑛=1
𝑀
𝑚=1
(𝑙𝑛𝑥𝑛 − 𝑙𝑛𝑥𝑁)
− lnD
4.A7
The input distance function is homogenous to the degree of one in inputs. Färe and
Primont (1995) introduce the duality between cost and input distance function. Under
the condition of cost minimization and using Shephard’s lemma, as stated in Färe and
Primont (1995), the duality is expressed as: C(w,y)=Min {wx: D(x,y) ≥ 1} where x is a
vector of input prices. It is easy to relate the derivatives of the input distance function
to the cost function. The derivative of the input distance function with respect to a
particular input n is expressed as:
𝜕𝐷(𝑥∗(𝑤, 𝑦), 𝑦)
𝜕𝑥𝑛=
𝑤𝑛
𝐶(𝑥, 𝑦)= 𝑟𝑛
∗(𝑥, 𝑦) 4. A8
where is the cost-deflated shadow price of input n.
This is more conveniently expressed in terms of log derivative of the distance function
as:
rn*

107
ℇ𝐷,𝑥𝑛=
𝜕𝑙𝑛𝐷
𝜕𝑙𝑛𝑥𝑛=
𝑤𝑛𝑥𝑛∗ (𝑤, 𝑦)
𝐶(𝑥, 𝑦)= 𝑆𝑛 4. A9
The expression (4.A9) denotes that the log derivative of the input distance function
with respect to input n is equal to its cost share , which shows the relative
importance of that input in the production (Färe and Primont 1995).
Based on the result of Equation (4.A9), from Equation (4.A7), we obtain:
𝜕𝑙𝑛𝐷
𝜕𝑙𝑛𝑥𝑛=
𝑤𝑛𝑥𝑛∗ (𝑤, 𝑦)
𝐶(𝑥, 𝑦) 𝑎𝑛𝑑
𝜕𝑙𝑛𝐷
𝜕𝑙𝑛𝑥𝑛=
𝑤𝑁𝑥𝑁∗ (𝑤, 𝑦)
𝐶(𝑥, 𝑦) 4. A10
From Equation (4.A7), the first partial derivatives are equal to:
𝜕𝑙𝑛𝐷
𝜕𝑙𝑛𝑥𝑛= 𝛽𝑛 + ∑ 𝛽𝑛𝑘
𝑁
𝑙=1
(𝑙𝑛𝑥𝑘 − 𝑙𝑛𝑥𝑁) + ∑ 𝛾𝑚𝑛
𝑀
𝑚=1
𝑙𝑛𝑦𝑚 , 𝑛 = 1,2, … , 𝑁 − 1 4. A11
and
𝜕𝑙𝑛𝐷
𝜕𝑙𝑛𝑥𝑛= 𝛽𝑛 + ∑ 𝛽𝑛𝑘
𝑁
𝑙=1
(𝑙𝑛𝑥𝑘 − 𝑙𝑛𝑥𝑁) − ∑ ∑ 𝛾𝑚𝑛
𝑀
𝑚=1
𝑙𝑛𝑦𝑚
𝑁−1
𝑛=1
4. A12
Substituting Equations (4.A11) and (4.A12) into (4.A10), we obtain:
𝜕𝑙𝑛𝐷
𝜕𝑙𝑛𝑥𝑛=
𝑤𝑛𝑥𝑛∗ (𝑤, 𝑦)
𝐶(𝑥, 𝑦)= 𝛽𝑛 + ∑ 𝛽𝑛𝑘
𝑁
𝑙=1
(𝑙𝑛𝑥𝑘 − 𝑙𝑛𝑥𝑁) − ∑ ∑ 𝛾𝑚𝑛
𝑀
𝑚=1
𝑙𝑛𝑦𝑚
𝑁−1
𝑛=1
and
𝜕𝑙𝑛𝐷
𝜕𝑙𝑛𝑥𝑁=
𝑤𝑁𝑥𝑁∗ (𝑤, 𝑦)
𝐶(𝑥, 𝑦)= 1 − ∑ 𝛽𝑛
𝑁−1
𝑛
− ∑ ∑ 𝛽𝑛𝑘
𝑁−1
𝑘=1
(𝑙𝑛𝑥𝑘 − 𝑙𝑛𝑥𝑁)
𝑁−1
𝑛−1
− ∑ ∑ 𝛾𝑚𝑛
𝑀
𝑚=1
𝑙𝑛𝑦𝑚
𝑁−1
𝑛=1
The ratio of these above two partial derivatives provides:
𝑤𝑛𝑥𝑛∗ (𝑤, 𝑦)
𝑤𝑁𝑥𝑁∗ (𝑤, 𝑦)
=𝛽𝑛 + ∑ 𝛽𝑛𝑘
𝑁𝑘=1 (𝑙𝑛𝑥𝑘 − 𝑙𝑛𝑥𝑁) + ∑ 𝛾𝑚𝑛
𝑀𝑚=1 𝑙𝑛𝑦𝑚
1 − ∑ 𝛽𝑛𝑁−1𝑛 − ∑ ∑ 𝛽𝑛𝑘
𝑁−1𝑘=1 (𝑙𝑛𝑥𝑘 − 𝑙𝑛𝑥𝑁)𝑁−1
𝑛−1 − ∑ ∑ 𝛾𝑚𝑛𝑀𝑚=1 𝑙𝑛𝑦𝑚
𝑁−1𝑛=1
4.A13
By using the approach of Coelli (2000), this study adds two terms, R and E, to capture
allocative mistakes. The term R is constant across farms and allows for possible
systematic allocative mistakes in the agriculture such as regulatory constraints that
Sn

108
influence all firms. The term E denotes an error term that changes from farms to farms
and captures the difference in allocative mistakes between farms. Equation (4.A13) is
now expressed as:
𝑤𝑛𝑥𝑛∗ (𝑤, 𝑦)
𝑤𝑁𝑥𝑁∗ (𝑤, 𝑦)
=𝛽𝑛 + ∑ 𝛽𝑛𝑘
𝑁𝑘=1 (𝑙𝑛𝑥𝑘 − 𝑙𝑛𝑥𝑁) + ∑ 𝛾𝑚𝑛
𝑀𝑚=1 𝑙𝑛𝑦𝑚
1 − ∑ 𝛽𝑛𝑁−1𝑛 − ∑ ∑ 𝛽𝑛𝑘
𝑁−1𝑘=1 (𝑙𝑛𝑥𝑘 − 𝑙𝑛𝑥𝑁)𝑁−1
𝑛−1 − ∑ ∑ 𝛾𝑚𝑛𝑀𝑚=1 𝑙𝑛𝑦𝑚
𝑁−1𝑛=1
𝑅𝐸
4. A14
Taking logs of Equation (4.A14), we have:
𝑙𝑛𝑤𝑛 + 𝑙𝑛𝑥𝑛 − 𝑙𝑛𝑤𝑁 − 𝑙𝑛𝑥𝑁 = 𝑎 + 𝑒 4. A15
where:
𝑎 = log (𝛽𝑛 + ∑ 𝛽𝑛𝑘
𝑁𝑘=1 (𝑙𝑛𝑥𝑘 − 𝑙𝑛𝑥𝑁) + ∑ 𝛾𝑚𝑛
𝑀𝑚=1 𝑙𝑛𝑦𝑚
1 − ∑ 𝛽𝑛𝑁−1𝑛 − ∑ ∑ 𝛽𝑛𝑘
𝑁−1𝑘=1 (𝑙𝑛𝑥𝑘 − 𝑙𝑛𝑥𝑁)𝑁−1
𝑛−1 − ∑ ∑ 𝛾𝑚𝑛𝑀𝑚=1 𝑙𝑛𝑦𝑚
𝑁−1𝑛=1
) ,
𝑒 = log (𝐸)
From (4.A7) and (4.A15), we have a system of structural equations as follows:
−𝑙𝑛𝑥𝑁 = 𝛽0 + ∑ 𝛽𝑛(𝑙𝑛𝑥𝑛 − 𝑙𝑛𝑥𝑁)
𝑁−1
𝑛=1
+1
2∑ ∑ 𝛽𝑛𝑘(𝑙𝑛𝑥𝑛 − 𝑙𝑛𝑥𝑁)
𝑁−1
𝑘=1
𝑁−1
𝑛=1
(𝑙𝑛𝑥𝑘 − 𝑙𝑛𝑥𝑁)
+ ∑ 𝛼𝑚𝑙𝑛𝑦𝑚
𝑀
𝑚=1
+1
2∑ ∑ 𝛼𝑚𝑙𝑙𝑛𝑦𝑚
𝑀
𝑙=1
𝑀
𝑚=1
𝑙𝑛𝑦𝑙 + ∑ ∑ 𝛾𝑚𝑛𝑙𝑛𝑦𝑚
𝑁
𝑛=1
𝑀
𝑚=1
(𝑙𝑛𝑥𝑛
− 𝑙𝑛𝑥𝑁) − ln𝐷𝑖 4. A16 (𝑙𝑛𝑥𝑛 − 𝑙𝑛𝑥𝑁) = 𝑎 + (𝑙𝑛𝑤𝑁 − 𝑙𝑛𝑤𝑛) + 𝑒 4. A17
In order to investigate the possibility of simultaneous bias in the estimation of (4.A16),
the reduced form equations for two endogenous variable, xn and xN, are desired. By
substituting Equation (4.A17) into (4.A16), we obtain:
𝑙𝑛𝑥𝑁 = −𝛽0 − ∑ 𝛽𝑛(𝑎 + 𝑙𝑛𝑤𝑁 − 𝑙𝑛𝑤𝑛 + 𝑒)
𝑁−1
𝑛=1
+1
2∑ ∑ 𝛽𝑛𝑘
𝑁−1
𝑘=1
(𝑎 + 𝑙𝑛𝑤𝑁 − 𝑙𝑛𝑤𝑛 + 𝑒)2
𝑁−1
𝑛=1
− ∑ 𝛼𝑚𝑙𝑛𝑦𝑚
𝑀
𝑚=1
−1
2∑ ∑ 𝛼𝑚𝑙𝑙𝑛𝑦𝑚
𝑀
𝑙=1
𝑀
𝑚=1
𝑙𝑛𝑦𝑙
− ∑ ∑ 𝛾𝑚𝑛𝑙𝑛𝑦𝑚
𝑁
𝑛=1
𝑀
𝑚=1
(𝑎 + 𝑙𝑛𝑤𝑁 − 𝑙𝑛𝑤𝑛 + 𝑒) + ln𝐷𝑖
Then, this above equation is substituted into (4.A17). As a result, the reduced form
equation as follows:
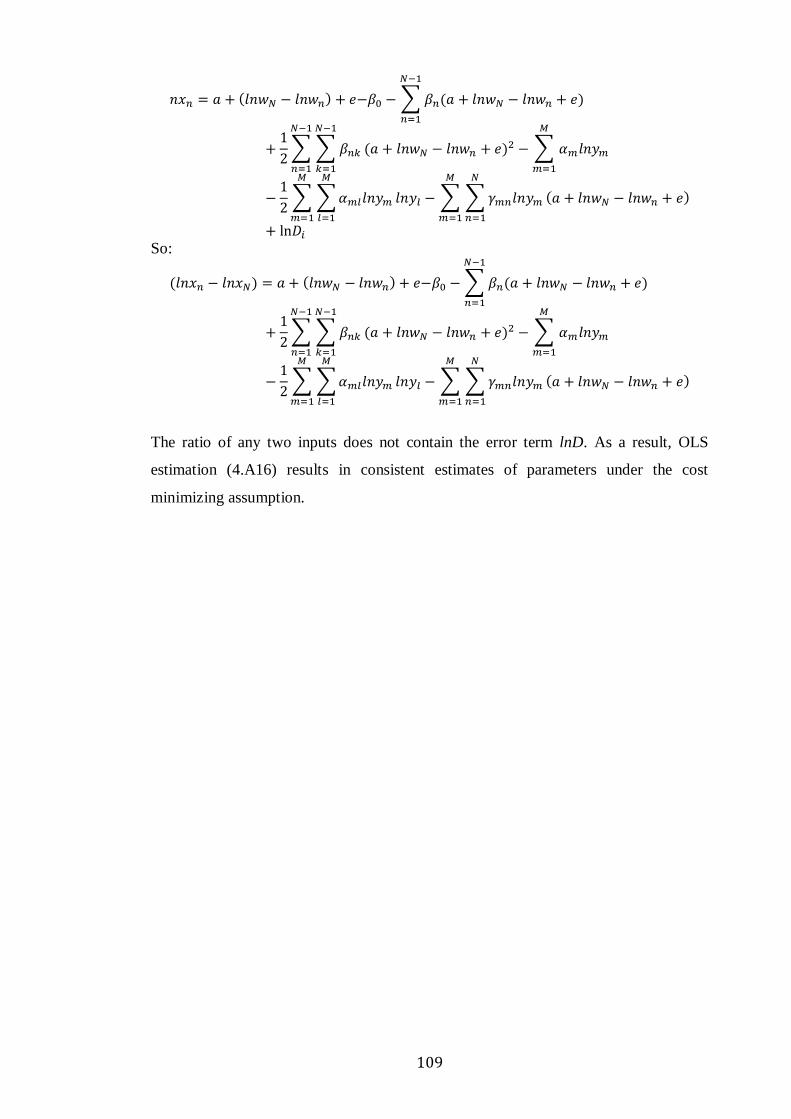
109
𝑛𝑥𝑛 = 𝑎 + (𝑙𝑛𝑤𝑁 − 𝑙𝑛𝑤𝑛) + 𝑒−𝛽0 − ∑ 𝛽𝑛(𝑎 + 𝑙𝑛𝑤𝑁 − 𝑙𝑛𝑤𝑛 + 𝑒)
𝑁−1
𝑛=1
+1
2∑ ∑ 𝛽𝑛𝑘
𝑁−1
𝑘=1
(𝑎 + 𝑙𝑛𝑤𝑁 − 𝑙𝑛𝑤𝑛 + 𝑒)2
𝑁−1
𝑛=1
− ∑ 𝛼𝑚𝑙𝑛𝑦𝑚
𝑀
𝑚=1
−1
2∑ ∑ 𝛼𝑚𝑙𝑙𝑛𝑦𝑚
𝑀
𝑙=1
𝑀
𝑚=1
𝑙𝑛𝑦𝑙 − ∑ ∑ 𝛾𝑚𝑛𝑙𝑛𝑦𝑚
𝑁
𝑛=1
𝑀
𝑚=1
(𝑎 + 𝑙𝑛𝑤𝑁 − 𝑙𝑛𝑤𝑛 + 𝑒)
+ ln𝐷𝑖
So:
(𝑙𝑛𝑥𝑛 − 𝑙𝑛𝑥𝑁) = 𝑎 + (𝑙𝑛𝑤𝑁 − 𝑙𝑛𝑤𝑛) + 𝑒−𝛽0 − ∑ 𝛽𝑛(𝑎 + 𝑙𝑛𝑤𝑁 − 𝑙𝑛𝑤𝑛 + 𝑒)
𝑁−1
𝑛=1
+1
2∑ ∑ 𝛽𝑛𝑘
𝑁−1
𝑘=1
(𝑎 + 𝑙𝑛𝑤𝑁 − 𝑙𝑛𝑤𝑛 + 𝑒)2
𝑁−1
𝑛=1
− ∑ 𝛼𝑚𝑙𝑛𝑦𝑚
𝑀
𝑚=1
−1
2∑ ∑ 𝛼𝑚𝑙𝑙𝑛𝑦𝑚
𝑀
𝑙=1
𝑀
𝑚=1
𝑙𝑛𝑦𝑙 − ∑ ∑ 𝛾𝑚𝑛𝑙𝑛𝑦𝑚
𝑁
𝑛=1
𝑀
𝑚=1
(𝑎 + 𝑙𝑛𝑤𝑁 − 𝑙𝑛𝑤𝑛 + 𝑒)
The ratio of any two inputs does not contain the error term lnD. As a result, OLS
estimation (4.A16) results in consistent estimates of parameters under the cost
minimizing assumption.
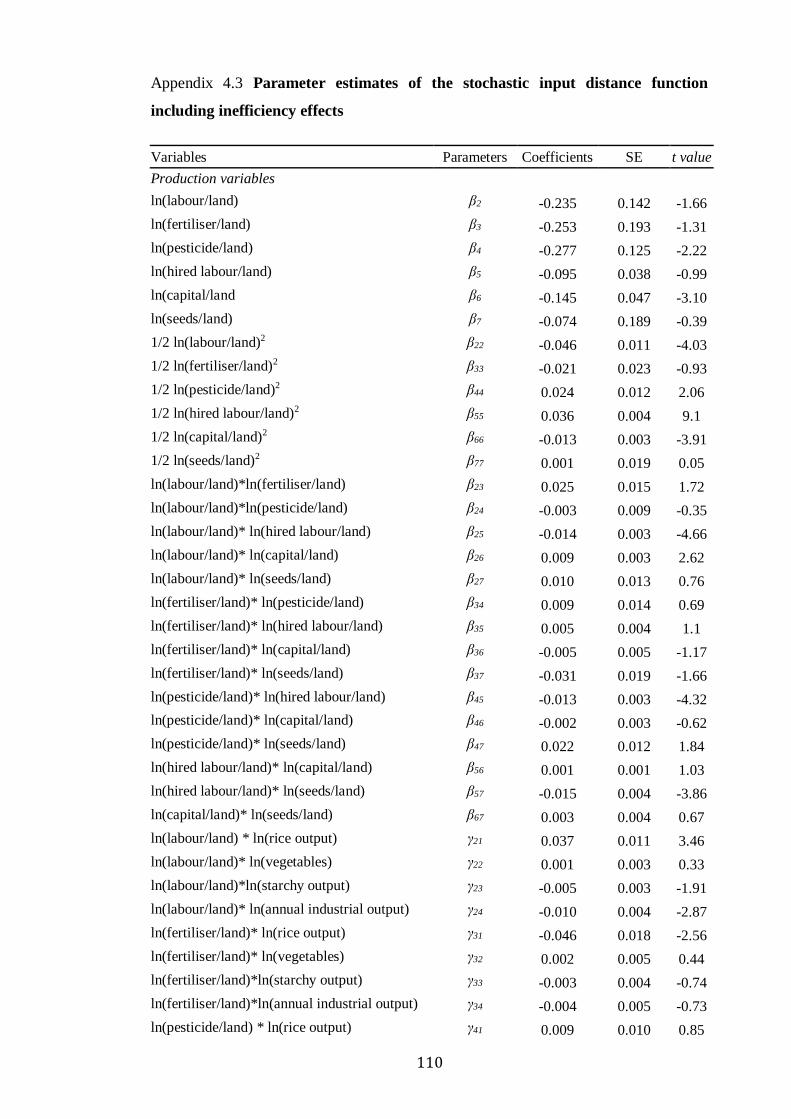
110
Appendix 4.3 Parameter estimates of the stochastic input distance function
including inefficiency effects
Variables Parameters Coefficients SE t value
Production variables
ln(labour/land) β2 -0.235 0.142 -1.66
ln(fertiliser/land) β3 -0.253 0.193 -1.31
ln(pesticide/land) β4 -0.277 0.125 -2.22
ln(hired labour/land) β5 -0.095 0.038 -0.99
ln(capital/land β6 -0.145 0.047 -3.10
ln(seeds/land) β7 -0.074 0.189 -0.39
1/2 ln(labour/land)2 β22 -0.046 0.011 -4.03
1/2 ln(fertiliser/land)2 β33 -0.021 0.023 -0.93
1/2 ln(pesticide/land)2 β44 0.024 0.012 2.06
1/2 ln(hired labour/land)2 β55 0.036 0.004 9.1
1/2 ln(capital/land)2 β66 -0.013 0.003 -3.91
1/2 ln(seeds/land)2 β77 0.001 0.019 0.05
ln(labour/land)*ln(fertiliser/land) β23 0.025 0.015 1.72
ln(labour/land)*ln(pesticide/land) β24 -0.003 0.009 -0.35
ln(labour/land)* ln(hired labour/land) β25 -0.014 0.003 -4.66
ln(labour/land)* ln(capital/land) β26 0.009 0.003 2.62
ln(labour/land)* ln(seeds/land) β27 0.010 0.013 0.76
ln(fertiliser/land)* ln(pesticide/land) β34 0.009 0.014 0.69
ln(fertiliser/land)* ln(hired labour/land) β35 0.005 0.004 1.1
ln(fertiliser/land)* ln(capital/land) β36 -0.005 0.005 -1.17
ln(fertiliser/land)* ln(seeds/land) β37 -0.031 0.019 -1.66
ln(pesticide/land)* ln(hired labour/land) β45 -0.013 0.003 -4.32
ln(pesticide/land)* ln(capital/land) β46 -0.002 0.003 -0.62
ln(pesticide/land)* ln(seeds/land) β47 0.022 0.012 1.84
ln(hired labour/land)* ln(capital/land) β56 0.001 0.001 1.03
ln(hired labour/land)* ln(seeds/land) β57 -0.015 0.004 -3.86
ln(capital/land)* ln(seeds/land) β67 0.003 0.004 0.67
ln(labour/land) * ln(rice output) γ21 0.037 0.011 3.46
ln(labour/land)* ln(vegetables) γ22 0.001 0.003 0.33
ln(labour/land)*ln(starchy output) γ23 -0.005 0.003 -1.91
ln(labour/land)* ln(annual industrial output) γ24 -0.010 0.004 -2.87
ln(fertiliser/land)* ln(rice output) γ31 -0.046 0.018 -2.56
ln(fertiliser/land)* ln(vegetables) γ32 0.002 0.005 0.44
ln(fertiliser/land)*ln(starchy output) γ33 -0.003 0.004 -0.74
ln(fertiliser/land)*ln(annual industrial output) γ34 -0.004 0.005 -0.73
ln(pesticide/land) * ln(rice output) γ41 0.009 0.010 0.85

111
ln(pesticide/land) * ln(vegetables) γ42 0.005 0.003 1.57
ln(pesticide/land)*ln(starchy output) γ43 -0.003 0.003 -1.09
ln(pesticide/land)*ln(annual industrial output) γ44 0.000 0.003 0.1
ln(hired labour/land)* ln(rice output) γ51 0.008 0.004 2.15
ln(hired labour/land)* ln(vegetables) γ52 0.001 0.001 0.68
ln(hired labour/land)*ln(starchy output) γ53 0.002 0.001 3.14
ln(hired labour/land)*ln(annual industrial
output) γ54
-0.002 0.001 -1.71
ln(capital/land)* ln(rice output) γ61 0.016 0.004 3.94
ln(capital/land)* ln(vegetables) γ62 -0.001 0.001 -0.56
ln(capital/land)*ln(starchy output) γ63 0.001 0.001 1.13
ln(capital/land)*ln(annual industrial output) γ64 -0.001 0.001 -0.79
ln(seeds/land) * ln(rice output) γ71 -0.002 0.015 -0.14
ln(seeds/land) * ln(vegetables) γ72 -0.005 0.004 -1.16
ln(seeds/land)*ln(starchy output) γ73 -0.004 0.004 -1.15
ln(seeds/land)*ln(annual industrial output) γ74 0.007 0.005 1.37
ln(rice output) α1 0.191 0.189 1.91
ln(vegetables) α2 0.025 0.049 0.5
ln(starchy output) α3 0.218 0.041 5.35
ln(annual industrial output) α4 0.196 0.056 3.47
1/2 ln(rice output)2 α11 0.105 0.017 6.1
1/2 ln(vegetables)2 α22 0.019 0.002 7.65
1/2 ln(starchy output)2 α33 0.019 0.002 9.23
1/2 ln(annual industrial output)2 α44 0.040 0.005 8.79
ln(rice output)* ln(vegetables) α12 -0.011 0.0037 -2.84
ln(rice output)*ln(starchy output) α13 -0.019 0.003 -6.05
ln(rice output)*ln(annual industrial output) α14 -0.023 0.004 -5.34
ln(vegetables)*ln(starchy output) α23 -0.003 0.009 -2.49
ln(vegetables)*ln(annual industrial output) α24 -0.0003 0.0008 -0.48
ln(starchy output)*ln(annual industrial output) α34 -0.0004 0.0007 -0.53
Region
North East ρ1 0.058 0.018 3.18
North West ρ2 0.021 0.031 0.66
North Central Coast ρ3 0.113 0.019 5.96
South Central Coast ρ4 -0.016 0.026 -0.61
Central Highlands ρ5 0.345 0.042 8.15
South East ρ6 0.445 0.053 8.45
Mekong River Delta ρ7 0.138 0.040 3.48
Constant β0 0.306 1.344 0.23
Inefficiency effects function
Age of the household head η1 0.001 0.005 0.2

112
Mean education of working age men η2 -0.070 0.026 -2.67
Mean education of working age women η3 -0.141 0.026 -5.42
Household members, from 15 to 60 years old η4 0.398 0.06 6.63
Dependency ratio (%) η5 0.643 0.289 2.22
Days of illness η6 0.001 0.001 0.51
Number of plots η7 0.021 0.011 1.96
Hours of nonfarm wages η8 -0.0002 0.000 -4.19
Ratio of land with land use right certificates η9 -0.203 0.122 -1.66
Constant η0 -3.107 0.432 -7.20
N 1970
Source: calculated from VHLSS 2006.

113
Chapter 5
Impacts of nonfarm participation on household
production choices in smallholder agriculture
“In land-poor countries at the middle-income stage, as the economy develops and wages
are rising rapidly, low income from grain production causes the consequent move by
farmers into nonfarm sectors as a mean of improving household income, thereby
increasing part-time farming and resulting in a decline in food production. Policies that
keep food production stable seem to place food self-sufficiency in conflict with goals of
improved household welfare and rural structural transformation.”(Policy proposition
stated in Chapter 1)
5.1 Introduction
Agriculture has traditionally been perceived as the engine of rural growth in Asia.
Nonfarm activities, however, have assumed an increasingly important role (Mishra and
Goodwin 1997; Lanjouw and Lanjouw 2001; Haggblade et al. 2007; Hazell and Rahman
2014). The widely quoted empirical evidence for developing countries shows that the rural
nonfarm economy in Asia accounts for 30 per cent of full-time rural employment and 50
per cent of incomes (Hazell and Rahman 2014, p. 485). In contrast, in China, 62 per cent
of the rural labour force was working off the farm in 2008, i.e. equivalent to 310 million
members of the rural labour force were fully or partially in off-farm activities (Huang et al.
2012). Similarly, in Vietnam, the percentage of households that were involved in at least
one nonfarm activity increased from 25% to nearly 50% of rural households between 1993
and 1998 (Van de Walle and Cratty 2004). In Vietnam, rice farms with less than 0.5
hectares account for 85 per cent of total rice farms (GSO 2012).
As economic growth proceeds in developing countries, along with an outflow of
resources from farm sectors, questions about the role that nonfarm sectors plays in
developing countries will grow more controversial and draw the attention of policy
makers. One of these questions is whether or not food production and crop incomes
will decline, potentially threatening food security as labour and resources move away
from farms. Policy makers face the dual task of facilitating food security and the
promotion of economic structural transformation. Policies that keep agricultural

114
production stable seem to place food self-sufficiency into conflict with the goals of
improvement of household welfare and rural structural transformation. There are
underlying needs to be identified if we are to understand farmers’ decision-making and
the drivers of choice between remaining on the farm or participation in nonfarm
activities, and between investing in farm production and hiring labour.
Although the participation of household labour into nonfarm activities is a primary
feature of the economic structural transformation process (Thirlwall 2006; Haggblade et
al. 2007), the potential impacts of this process on agriculture can be quite complex.
Economic theories show ambiguous predictions in terms of the magnitude or signs of the
effects (Taylor and Lybbert 2015). Moreover, econometric models are not simple
because covariates are likely to affect both nonfarm participation and agricultural
production (Taylor and Feldman 2010). If farm households cannot substitute for
nonfarm labour due to liquidity constraints or an incomplete labour market in rural areas,
labour movement into nonfarm activities could result in the reduction of agricultural
production. Alternatively, farm households can apply less labour-intensive farming or
reorganize agricultural production by increasing family labour in order to keep output
stable. In addition, households can spend nonfarm income on relaxing the constraints on
agricultural production, such as investing in capital or hiring more labour. Thus, the
possible impacts of nonfarm participation on agricultural production are theoretically
indeterminate (Haggblade et al. 2007). Taylor and Lybbert (2015) show that whether or
not the movement of workers out of agriculture without losing crop production is an
empirical question that researchers and policy makers are still trying to answer.
This chapter aims to answer the following question: What choices of agricultural
production do small farms make when household members participate in nonfarm
activities and part-time farming increases? Moreover, the chapter investigates whether or
not nonfarm activities of farm households are complementary to agricultural production.
The impact of nonfarm participation on agricultural outcomes is complex and cannot be
signed a priori, this chapter, thus, uses different techniques such as first difference,
instrumental variables and matching technique to check the consistency of the empirical
results. To implement this objective, this analysis employs a national dataset - the
Vietnamese Household Living Standard Surveys 2004 and 2006. Complementarity
implies that nonfarm participation provides non-labour inputs, credit and capital to farm
households, which can be used to improve agricultural productivity. Rivalry or
competition implies that nonfarm participation withdraws resources from farms, and thus
115
reduces agricultural production.
Little economic research has been conducted on the research question. There have been
a few papers that examine the impact of nonfarm participation on agricultural production
in rural Vietnam (Stampini and David 2009; De Brauw 2010). Stampini and David
(2009) find evidence for relaxing credit constraints to farming. Their study, however,
only focuses on crop expenses and ignores rice production, farm revenue and regional
differences. Using the same data source in the 1990s as Stampini and David (2009), De
Brauw (2010) shows an increase in seasonal migrants resulted in a move out of rice
production and reduced the demand for agricultural inputs in the early stage of
agricultural reform. Nevertheless, seasonal migration only accounted for a small number
of their households in the sample.48 Moreover, this study does not capture the whole
picture of the rural nonfarm economy, which plays in increasing role in structural change
and household welfare in rural Vietnam. As a result, no study has systematically
addressed the impact of nonfarm participation on household production choices at the
household level. This chapter closes this knowledge gap by using a panel dataset from
the VHLSS 2004 and 2006. It takes the literature one step further by examining the
evidence of relaxing credit constraints on small farms, the effects of different measures
of nonfarm participation on rice production and farm revenue in the whole country, and
in different regions.
This study is important for a number of reasons. First, to the best of the author’s
knowledge, it offers the first systematically economic assessment of the impacts of labour
movement into rural nonfarm sectors on household production choices in light of the
increasing importance of the nonfarm economy in Vietnam. Second, it focuses on not only
seasonal migration, but also the rural nonfarm economy more broadly. In the literature,
there is no study on the effect of part-time farming on agricultural production. Although
farm households sometimes participate in temporary migration from rural areas to cities,
most of their activities are in the rural nonfarm economy (Haggblade et al. 2007; Van de
Walle and Cratty 2004). Third, one challenge facing policy makers in Vietnam is the
trade-off between the rise in the welfare of farm households, and food security,
particularly rice self-sufficiency. Policy makers are concerned about the conflict between
these two objectives of the rural structural transformation. This study investigates whether
or not does, in fact, the conflict exist. Evidence of a move away from farming, or a
48 De Brauw (2010) used the Vietnam Living Standard Survey in 1992-1993 and 1997-1998. The
number of households that had seasonal migration increased from 65 households in 1993 to 369
households in 1998.

116
complement to farming, can support policy makers in designing policies related to labour
mobility, credit, insurance, and food security.
The remainder of this chapter is organized as follows. The literature review is
analysed in Section 5.2, which shows the gap in the current literature on the effects of
nonfarm participation on household production choices in smallholder agriculture.
Section 5.3 describes methodologies used to answer the research question. The dataset
and the variables are presented in Section 5.4. Estimation results are introduced in
Section 5.5. Section 5.6 concludes, and outlines policy implications and suggestions
for further research.
5.2 Literature review
5.2.1 Definitions
Following convention, this chapter uses the definition of nonfarm employment
initiated by Haggblade et al. (2007 and 2010) and Hazell and Rahman (2014). It
defines nonfarm employment to include all economic activities other than the
production of primary agricultural commodities. Nonfarm activities, thus, include
mining, manufacturing, utilities, construction, commerce, transport, and the full gamut
of financial, personal, and government services. Workers in agro processing such as
the transformation of raw agricultural products by milling, packaging, bulking, or
transporting form a key component of the rural nonfarm employment. Nonfarm
employment covers both the rural nonfarm economy and seasonal migration. Hoang et
al. (2014) show that nonfarm employment in rural Vietnam takes place predominantly
in local communities. As a result, the scope of nonfarm employment in this chapter is
broader than that of seasonal migration. Seasonal migration is defined by the number
of seasonal migrants, who left their household for work during the past 12 months (De
Brauw 2010).
5.2.2 Literature on the effect of nonfarm participation on agricultural
production
The existing empirical literature on the linkages at the household level between
nonfarm participation and agricultural production is limited and inconclusive. Most
studies focus on the impact of the agricultural sector on rural nonfarm activities and
economic growth. In development economics, agricultural linkage growth is classified

117
into four categories: production, consumption, factor market and productivity linkages
(Thirlwall 2006; Johnson 2000; Haggblade et al. 2007, Hazell and Rahman 2014). For
example, Trung (2000) finds that growth in Vietnam’s rice production during the
1990s generated the development of the rural nonfarm economy in favourable
agricultural regions.
However, reverse linkages from nonfarm to farm have received growing interest in the
literature, despite mixed evidence. The positive impact of nonfarm incomes on
agricultural production has been noted in several studies (Collier and Lai 1986; Evans
and Ngau 1991; Savadogo et al. 1994; Oseni and Winters 2009). Collier and Lai (1986)
find that in Kenya, crop output is positively associated with non-crop incomes and liquid
assets for smallholder agriculture. Evans and Ngau (1991) also conclude that farmers
with nonfarm incomes are more likely to grow coffee (more profitable), rather than
maize for subsistence in Kenya. At the same time, Savadogo et al. (1994) demonstrate
that incomes from nonfarm activities enables farmers in Burkina Faso to invest in animal
traction packages. In a qualitative analysis, Reardon et al. (1994) argue that with a buffer
of cash from nonfarm activities, farmers are willing to move from “safety first” food
cropping to risky cash crops.
In addition to positive impacts, empirical evidence on negative effects can be found in
the literature. Taylor and Lybbert (2015) show that small farmers face many different
kinds of production constraints that restrict their capacity and willingness to increase
agricultural production, and shift into higher value crop activities. For example, high
production risks and lack of crop insurance make farmers unwilling to invest in
agriculture. Similarly, Holden et al. (2004) find that in Ethiopia, participation in rural
nonfarm activities result in a drop in agricultural productivity due to increased soil
erosion and land degradation. A more recent study using Albanian household survey
data 2005 (Kilic et al. 2009) shows that rural households utilised their nonfarm
incomes not to invest in time-saving farming and farm capital, but to move out of crop
production. In the case of Hungary, Rizov and Swinnen (2004) found evidence of a
move away from farming when rural households participate in nonfarm activities.
They found that nonfarm incomes reduce the probability of engagement in agriculture.
Similarly, De Brauw (2010) studies the impact of seasonal migration on agricultural
production in Vietnam. The author concludes that seasonal migration results in the
reduction of rice outputs and less use of farm inputs. He also finds evidence of a shift
from labour to land-intensive farming.

118
As regards the role of nonfarm participation in relaxing the liquid constraints facing farm
households, studies in developing countries show the same picture of the impact. Oseni and
Winters (2009) find that farmers in rural Nigeria utilise their nonfarm incomes to relax credit
constraints by spending on crop expenses and payments for hired labour and inorganic
fertilizers. Ellis and Freeman (2004) investigate the impact in four countries: Uganda,
Kenya, Tanzania and Malawi. The authors conclude that nonfarm incomes result in
improving land productivity in these countries by relaxing cash constraints so farmers can
purchase inputs.
The picture is often the same when nonfarm labour and incomes are disaggregated in
migration and remittances, which have a conceptually similar role. Although
theoretically migration could affect agricultural production, there have been few studies
examining the direct relationship between migration and agricultural production (Rozelle
et al. 1999; Taylor et al. 2003; Li et al. 2013; Tuladha et al. 2014). These studies find that
migration distorts on-farm operations in the short-run when labour leaves. However,
remittances can reduce negative impacts by investing in capital intensive and profitable
cash crop production. For example, Rozelle et al. (1999) find that in northeast China,
migration is negatively associated with maize yields, but migrant remittances more
than make up for the presumed lost-labour effect. As a result, maize yields are higher
for migrant households than for non-migrant households. Tuladha et al. (2014) study
the effect of migration and remittances on Nepal’s agricultural yields using the new
economics of labour migration theory framework. They show that migration negatively
affects agricultural yields, and remittances are not used to invest in agricultural capital
goods and inputs. These contrasting estimates between countries indicate that the impact
of migration and remittances should, thus, be studied in context.
To sum up, three overarching points arise from the above studies. Firstly, while most
studies on Vietnam concentrate on the impact of migration or nonfarm participation on
poverty and household expenditure (Nguyen 2008; Hoang et al. 2014; Nguyen et al.
2011; Nguyen and Mont 2012), few papers measure the effect of nonfarm participation
on agricultural production. Most papers study the drivers or determinants of migration
and remittances in Vietnam (Niimi et al. 2009; Phan 2012; Nguyen et al. 2015;
Coxhead et al. 2015). De Brauw (2010) investigates the impact of seasonal migration
on agricultural production using the VHLSS 1993 and 1998. He shows that seasonal
migration can result in a move out of rice production in rural Vietnam. Rice outputs in
Vietnam increased steadily in the 1990s despite the increasing trends of labour
119
movement out of agriculture and rural areas (Dang et al. 2006). Brennan et al. (2012)
using the general equilibrium model also find a slight decrease in feed output in
Vietnamese agriculture, as a result of rural-urban migration.
Second, although migration has become the dominant form of nonfarm activities in
developing countries, the rural nonfarm economy has absorbed a large number of farm
workers (Haggblade et al. 2007; Hazell and Rahman 2014). Rozell et al. (1999) use the
number of migrants and remittances to test the new economics of labour migration
theory (NELM). However, return migration, unregistered migration, and migration
history are rarely surveyed in household living standard datasets in Vietnam, with the
exception of seasonal migration. La and Leung (2012) show that over the period 2002-
2006, the number of households receiving remittances accounted for over 80 per cent on
average in rural areas of Vietnam (from VHLSS 2002, 2004 and 2006 surveys).49
Nevertheless, these VHLSS surveys cannot provide the migration history needed to
capture information on those non-household members who send remittances to local
communities. There is also no information on the number of households receiving
remittances from households’ migrants. Nguyen et al. (2015) show that it is unlikely to
link the migrants with their original households so that the effect of remittances on
household welfare cannot be evaluated. Therefore, in the case of Vietnam, it is not
possible to examine the impact of migration and remittances simultaneously in the
framework of NELM model, which requires instrumental variables for both migration
and remittances.
Third, the impact of nonfarm participation on agricultural production is complicated by
the fact that the participation of farm labour and capital in the nonfarm economy
constrains resource allocation in agricultural production, particularly in crop and
livestock sectors as presented by Haggblade et al. (2007). Moreover, there are barriers
that affect the participation in nonfarm activities. For example, for poorer households
that decide to participate in nonfarm activities, diversion of labour to other activities
can result in the stagnation of or reduction in their own farm productivity (Ellis and
Freeman 2004). Similarly, shifts of labour from farm to nonfarm employment can
sometimes lead to farm production inefficiency (Chavas et al. 2005). In addition, this
mixed evidence indicates that the impact of nonfarm participation depends a good deal
49 According to the questionnaire from VHLSS 2004 and 2006 surveys, remittances are income from
people who are not household members. Therefore, they are not considered as nonfarm income0 of rural
households. This chapter uses the definition of nonfarm incomes in Hazell and Rahman (2014).
120
on the context of each country.
This study contributes to the literature by concentrating on the nexus between nonfarm
participation and household production choices. It traces the complex linkages that exist
among nonfarm participation and agricultural production by using different methods to
validate the consistency of the empirical results. It further explores whether or not
participation in nonfarm activities relaxes credit or cash constraints in rural Vietnam.
Furthermore, it decomposes the effect of nonfarm participation on production choices
into regional differences (i.e. north and south). The differences in constraints on land
may affect household’s decisions on production choices, such as: the reduction of rice
production; a switch to other crops; substitution between hired labour and family labour;
investing in mechanization; and less labour-farming cultivation (Otsuka et al. 2013b).
5.2.3 Literature on the determinants of rural nonfarm employment and
incomes
In developing countries, rural livelihood strategy is a driver of poverty reduction and
food security (Ellis 2000; Barrett et al. 2001; Winter et al. 2001; Thirlwall 2006). The
role of the rural nonfarm economy is increasing and has become an important source of
income for rural households in their livelihood diversification. Lanjouw and Lanjouw
(2001) claim that nonfarm employment provides economic security for those members
of society who may have restricted access to farm employment. Similarly, Reardon et
al. (1994) find that in rural economies, participation in rural nonfarm employment
facilitates liquidity constraints facing households in light of financial market
imperfections. The function of the rural nonfarm economy is as a safety net for
households facing income shocks and protecting their assets.
As regards the identification of the determinants of rural income diversification, Ellis
(1998 and 2000) shows that the determinants of rural income diversification are
necessity and choice, which are the same as the push and pull factors of migration. The
author finds that asset categories and their structure determine the choice of
livelihoods. These categories include natural capital such as land, physical capital,
human capital, financial capital and social capital. Barrett et al. (2001) argue that the
diverse mix of assets available to households typically produces a wide range of
different asset allocation choices. These papers argue that asset structure plays an
important role in the choice of livelihood diversification in rural areas.

121
Similarly, Haggblade et al. (2007) show that the motives of rural households for
diversification differ significantly across settings and income groups. This suggests an
important distinction between diversification driven mainly by “pull” factors for
accumulation objectives and “push” factors for cope with shock and escape from low
growth in agriculture. The coping literature examines how rural households in low-
potential and risky environments adapt by deploying household resources to a range of
farm and nonfarm activities (Rosenzweig and Stark 1989). The discussion of ‘pull’ and
‘push’ factors is found in many research papers investigating patterns of household
income diversification in developing countries (Evans and Ngau 1991; Readon et al.
1994; Ellis 2000; Barrett et al. 2001; Ellis and Freeman 2004; Lanjouw, Quizon and
Sparrow 2001). Many rural households turn to a more diversified portfolio of activities
due to increasing risks to their livelihood in farm activities (Ellis 1999 and 2000).
In addition to these studies, there is an additional area of investigation that traces the
development of the rural nonfarm economy. Several studies emphasise the role of
infrastructure in rural areas (Haggblade et al. 2007; Renkow 2007; Lokshin and
Yemtsov 2005). These studies find that the improvement in infrastructure facilitates
nonfarm opportunities. Moreover, as seen in Indonesia, the expansion of electricity
results in employment in exported-oriented sectors and in a wide range of nonfarm
employment opportunities (Gibson and Olivia 2010).
5.3 Research methodology
5.3.1 Theoretical model
The agricultural household model (AHM) developed by Singh, Squire and Strauss
(1986) is selected. Unlike neoclassical economic theory, which focuses either
consumer or producer theory, AHM integrates consumption, production, exchange and
labour supply decisions simultaneously. In the case of complete markets, AHM
predicts that production decisions can be separable from consumption, which means
that the participation in off-farm employment is independent of farm production
choices. Conversely, incomplete markets result in non-separable model, which predicts
that production decision is interrelated with consumption and depends on preferences
and endowments. As a result, agricultural production may be affected if farm labour
moves to the nonfarm sector in the case of non-separable model. Many studies show
that perfect labour and land markets are rarely found in developing countries

122
(Benjamin 1992; Urdy 1996; Jollife 2004). In the case of Vietnam, Le (2009 and 2010)
also rejected the hypothesis of complete markets when he estimated the labour supply
function in rural Vietnam using household survey data. World Bank (2006) reaches the
same conclusion on land market in Vietnam. Hence, a non-separable model is relevant
in the context of Vietnam, which implies that structural change is likely to affect
agricultural production.
Another theory related to the household model, which is also widely used, is the new
economics of labour migration by Stark and Bloom (1985). Family members who
move to nonfarm sectors can provide the family with capital needed to raise
agricultural productivity (Taylor and Lybbert 2015). If it is not possible to compensate
the loss of family labour due to migration or nonfarm activities in an imperfect market,
a decrease in production, or a move away from labour intensive farming or the use of
labour savings technology can occur. If the negative labour impact is bigger than the
beneficial impact of relaxing credit constraints, then there will be a negative effect of
migration on agricultural production (Rozelle et al. 1999). Therefore, when a
household operating in imperfect markets decides to send out a migrant, the decision
can either exacerbate or alleviate constraints on agricultural production. In the NELM
theory, remittances play a key role in identifying the impact of migration (Rozelle et
al. 1999). The NELM also postulates that increased remittances may relax rural
households’ financial constraints and increase investment in new farming technologies
(Stark and Bloom 1985). In Section 5.2, the chapter argues that the NELM framework
is unlikely to apply in the case of Vietnam due to data constraints on migration and
remittances and instruments for both variables, which requires both migration and
remittances to be simultaneously used in the model.
By using the approach developed by Taylor et al. (2003), the theoretical model starts by
considering a farm household whose goal is to maximize output (Q) under given
resource constraints (RC). They face credit constraints and must cope with imperfect
markets in rural areas. Suppose that a household may invest its fixed resource RC (land
or family labour) to produce in either low productivity (e.g. grain) or high productivity
activity (e.g. cash crops or manufacturing), si for i=0,1, respectively. There are
household characteristics Zx that shape productivity in each activity. It is assumed that at
the relative price (P1/P0), the household will specialize in the high productivity activity,
leading to an output function: Q*=f1(RC, Zx) (5.1)

123
Assume that c(RC1) is defined as the cost of, or barrier to, adopting the high productivity
technology and K denotes the household’s credit available to invest in high productivity
activity. In the case of a risk constraint, c(RC1) denotes as a measure of risk related to
high productivity activity and K is thus be the maximum risk that the household is
willing to accept. The household may face a market constraint on its investment on a
high productivity activity such that c(RC1) K, c’(RC1) >0. In order to relax credit
constraints or risk constraints, the household may participate in nonfarm activities from
family members (Ln). Hence, the theoretical framework assumes that K=f( Ln) (5.2)
In addition, the constrained resource allocation to the high productivity activity is:
RCc = (K), where ’(K)>0. Constrained output under high productivity activity is:
𝑄1𝑐 = 𝑓1(𝑅𝐶𝑐1
, 𝑍𝑥) and under low productivity activity: 𝑄1𝑐 = 𝑓1(𝑅𝐶 − 𝑅𝐶𝑐1
, 𝑍𝑥). As a
result, the constrained output per unit of RC is followed by: 𝑞𝑐 = (𝑄1𝑐 + 𝑄0
𝑐 𝑅𝐶⁄ ) where
𝑞𝑐 < 𝑞 , q defines the unconstrained output. In Equation (5.2), the sign of 𝑓𝐿𝑛 is
indeterminate. Consequently, the effect of nonfarm participation on agricultural
production is ambiguous. However, Taylor et al. (2003) point out that if capital, risk or
human capital constraints are binding, the impact of nonfarm participation is not likely to
be zero. When the findings show positive impacts, this implies that nonfarm
participation complements agricultural production by relaxing credit or risk constraints.
Conversely, negative impacts mean that increased nonfarm activities exacerbate labour
shortages or represent a move away from farming.
The household maximises utility u(c, S, ) that is subject to a budget constraint and a
time allocation constraint. In the utility function, c denotes consumption; S represents
leisure, and captures other factors. The household can obtain income through
agricultural production and nonfarm activities. The household produces farm outputs
using the constrained equation: 𝑄𝑎 = 𝑓𝑎(𝑅𝐶𝑐 , 𝑍𝑥 , 𝜓), where 𝜓 is other factors that affect
output. Because RCc = (K) and K = f(Ln), the output function can be rewritten as:
𝑄𝑎 = 𝑓𝑎(𝐿𝑎 , 𝐿𝑛, 𝐴, 𝑋, 𝑍𝑥 , 𝜓) (5.3)
where 𝐿𝑎 is agricultural labour; A is fixed land area in the short run; and X represents
inputs. Normalising the price of agricultural product to one, the agricultural profit is
expressed as:
𝜋 = 𝑓𝑎(𝐿𝑎, 𝐿𝑛, 𝐴, 𝑋, 𝑍𝑥 , 𝜓) − 𝑝𝑥𝑋 (5.4)
where 𝑝𝑥 is a vector of input prices; 𝜋 and represents farm profits.

124
The household faces a time allocation constraint that is binding:
�� = 𝐿𝑎 + 𝐿𝑛 + 𝑆 (5.5)
The household will thus maximize the full incomes:
𝐼 = 𝑓𝑎(𝐿𝑎 , 𝐿𝑛, 𝐴, 𝑋, 𝑍𝑥 , Ψ) (5.6)
where ws is the shadow wage implicitly identified by the household labour equilibrium.
The above utility maximization problem can be solved maximizing the utility function
u(c,S,) subject to Equations (5.5) and (5.6). Solving the full model provides the
equilibrium output as follows: 𝑌∗ = 𝑌(𝐿𝑛, 𝑝𝑥 , 𝐴, 𝑍𝑥 , Ψ) (5.7)
The main interest in this chapter is the impact of nonfarm participation on agricultural
measures(𝜕𝑌𝑖 𝜕𝐿𝑛)⁄ . De Janvry et al. (1991) and Wang et al. (2014) show that if the
nonfarm constraint does not bind and no constraint on nonfarm participation exists, the
net impact will be zero. Conversely, in the absence of perfect markets as shown by Le
(2009) and World Bank (2006) in Vietnam, assuming that nonfarm employment
constraints are binding, nonfarm participation may affect agricultural production. In
addition, the impact of nonfarm participation on demand for inputs may be different
from zero. Without a credit or insurance market, nonfarm participation enables farm
households to relax constraints by providing nonfarm incomes. As a result, agricultural
production can be improved. This effect, however, may not be positive if farmers cope
with imperfect markets. The participation in nonfarm activities may exacerbate labour
constraints by competing for farm labour. In addition, farm households could use
nonfarm incomes to purchase inputs and invest in capital for long-term development
(Taylor and Feldman 2010).
5.3.2 Empirical model
The objective of the empirical model is to answer the research question how labour
movement from farm to nonfarm activities affects household production choices. The
empirical models are derived from the agricultural household model described in
Section 5.3.1. In order to control for household heterogeneity and better study the
dynamics of labour movement overtime, the analysis takes advantage of the
longitudinal feature of the VHLSS. A general two-way linear panel data model is
expressed as follows:

125
Δ𝑙𝑛𝑌𝑖𝑐𝑟 = ∑ 𝛼𝑥Δ𝑙𝑛𝑋𝑖𝑐𝑟
𝑁
𝑥=1
+ 𝛼𝐿𝑛Δ𝐿𝑛 + ∑ 𝛼𝑧𝑍𝑖𝑐𝑟
𝐾
𝑧=1
+ ∑ 𝛼𝑎
𝑀
𝑎=1
𝐴𝑖𝑐𝑟 + 𝛼𝑟𝑅𝑐𝑟 + Δ휀𝑖𝑐𝑟 (5.8)
where i denotes households; c denotes communes; r indexes regions; Y measures
agricultural outputs, agricultural revenue or non-rice agricultural revenue; X is a vector of
inputs in farm production; Ln represents a measure of nonfarm participation including the
number of household members participating in nonfarm activities, or share of household’s
working hours in nonfarm activities; Z is a variable related to household characteristics
such as demographics, education, assets; A references other factors that affect agricultural
production such as the share of land that is titled; and R controls communal and regional
characteristics. Given the short panel with only two time periods, the model is specified in
differences to remove household and regional fixed effects.
The empirical results from Equation (5.8) help to evaluate the effects of nonfarm
participation on rice production, agricultural and non-rice agricultural revenue, and
household expenditure. The expressions in Equation (5.8), however, do not show the
role of nonfarm participation in relaxing the liquidity constraints facing farm
households, as analyzed in the theoretical section. By using the approach of Oseni and
Winter (2009), the additional model focuses on the effects of nonfarm participation on
crop expenses for farm households in rural Vietnam. The dependent variables include
input costs, hired labour and capital, and other expenses. All independent variables are
the same as the variables in Equations (5.8), but without X, a vector of inputs. The
relationship is mathematically expressed as follows:
Δ𝑙𝑛𝑋𝑖𝑐𝑟 = 𝜇𝐿𝑛Δ𝐿𝑛 + ∑ 𝜇𝑧𝑍𝑖𝑐𝑟
𝐾
𝑧=1
+ ∑ 𝜇𝑎
𝑀
𝑎=1
𝐴𝑖𝑐𝑟 + 𝜇𝑟𝑅𝑐𝑟 + Δ𝑣𝑖𝑐𝑟 (5.9)
where X measures crop expenses; Ln is a measure of nonfarm participation; Z includes
household characteristics; A represents other factors that may affect crop expenses; and
R controls regional effects. The null hypothesis associated with the hypothesis that there
is evidence of relaxing liquidity constraints facing farm households is that: 𝜇𝐿𝑛= 0
5.3.3 Identification
The estimation of all equations is challenging because the participation in nonfarm
activities is not a random process. Furthermore, unobservable heterogeneity that affects
decisions on nonfarm participation may also affect agricultural outcomes. Thus, if all
equations are estimated using the first differenced model, the coefficient estimates of

126
interested variables are likely to be biased, in spite of the elimination of unobserved
fixed effects (such as ability or entrepreneurship of farm households and other regional
fixed effects) when using the first difference method. There are two problems that may
arise from including omitted variables and reverse causality (Wooldridge 2012). In order
to solve the bias problems, this chapter uses different approaches, including first
difference, two stage least squares, and matching technique. Each method has its own
advantages and disadvantages. If the empirical results show the same sign and
significance, then it can be concluded that there is consistency of the effects.
Instrumental variable approach: controlling for unobserved time-varying shocks
and reverse causality
Although unobserved fixed effects are eliminated from the first difference method,
unobservable heterogeneity effects that change over time may drive the omitted variable
problem. For example, adverse price shocks may have a negative impact on agricultural
production. However, the shock might be expected to produce a negative bias on the
coefficient of nonfarm labour. Hertz (2007) finds that risk aversion may divert labour and
capital to nonfarm employment, resulting in a negative bias. When there is a correlation
between seasonal migration and improved transport network access overtime, then
positive bias can be expected (De Brauw 2010). Hence, it is not easy to determine the sign
of the bias. In addition, reverse causality may cause a simultaneous bias. The condition of
agricultural production may influence the probability of nonfarm participation. Low
agricultural income is likely to encourage farm households to leave, and seek better
opportunities and select nonfarm jobs to secure their livelihood (Barrett et al. 2001).
Therefore, in order to reduce the problems of omitted variables and reverse causality, an
instrument variable framework is used to estimate interested coefficients consistently.
This chapter estimates Equations (5.8) and (5.9) using the two-stage least squares
(2SLS). Instrument variables are correlated with nonfarm variables, but are not
correlated with agricultural production (such as outputs or inputs), except through their
effect on nonfarm participation. Nonfarm networks are selected as an instrument
variable for the equations.
The first-stage equation is expressed as follows:
Δ𝐿𝑛𝑖𝑐𝑟 = 𝜌𝑚𝑀𝑐𝑟,𝑡−1 + ∑ 𝜌𝑧𝑍𝑖𝑐𝑟𝐾𝑧=1 + ∑ 𝜌𝑎
𝑀𝑎=1 𝐴𝑖𝑐𝑟 + 𝜌𝑟𝑅𝑐𝑟 + Δ𝜃𝑖𝑐𝑟
𝐿𝑛 (5.10)

127
where i denotes households; c denotes communes; r indexes region; Lnicr represents a
measure of nonfarm participation; Mcr,t-1 is the lagged commune-level nonfarm
networks, which measures the share of people working in nonfarm activities over the
past 12 months at the communal level (taken from the communal surveys in 2004);50 Z
includes household characteristics, other variables are the same as Equations (5.8) and
(5.9). Mcr,t-1 measures nonfarm networks as an instrumental variable in the first-stage
equation. It should be noted that there are two different surveys at the household and
communal levels in 2004 and 2006.
In previous studies, nonfarm networks, or contacts with people in communities who
have previously participated in nonfarm activities, are widely used.51 In both empirical
and theoretical studies, nonfarm networks have been found to be among the most
important factors driving nonfarm participation (Taylor and Martin 2001). Hoang et al.
(2014) exploit this instrument to study the impact of nonfarm participation on poverty
and expenditure in Vietnam. Similarly, Kajisa (2007) also emphasises the role of
nonfarm networks in supporting household members to be employed in nonfarm
activities. Members who have already participated in nonfarm sectors will reduce some
costs related to the search for work in nonfarm employment, due to the sharing of
information on jobs in other regions with their relatives and neighbours.
In the context of Vietnam, having nonfarm networks gives farm households more
connections and access to nonfarm employment, particularly the connections between
fellow villagers or fellow countrymen (Hoang et al. 2014). In addition, Oseni and
Winter (2009) argue that the effect of nonfarm networks on crop expenses only occurs
via its impact on nonfarm participation. Therefore, nonfarm networks can be seen as a
good choice for this analysis. In this study, nonfarm networks are constructed by
exploiting the unique feature of nonfarm activities from the survey of 2,216 communes
in all provinces in Vietnam. The variable (Mcr,t-1) is collected from the commune level
survey in 2004 that accompanies the household surveys. It measures the share of
people working in nonfarm sectors in relation to the total number working in the
commune. Furthermore, this study also accounts for the direct effect of economic
shocks on nonfarm networks and agricultural production simultaneously by including
50 The communal surveys were independently carried out with household surveys. In Vietnam, the
administrative system is structured from highest to lowest level as follows: province (or city), district, commune, and village. 51 See also Rozelle et al, 1999; Taylor et al, 2003; Li et al. 2013; Kajisa 2007; Tuladhar et al. 2014; Kilic
et al. 2009; Oseni and Winter 2009; De Brauw 2010. These papers also use nonfarm networks as
instrumental variables for migration or nonfarm participation.

128
some commune-level infrastructure variables such as transport, markets, irrigated land
and regional dummies.
Matching decomposition method
The purpose of this section is to check the OLS first difference and 2SLS results with
an impact evaluation method called the matching technique. It should be noted that
matching technique only complements estimated methods to examine the consistency
of a multivariate regression. In addition, the matching also solves the selection bias
(Khandker et al. 2010). However, this chapter cannot correct for selection into rice
production by using multivariate regressions. 52 In the case of agricultural revenue,
selectivity bias does not exist because the panel of rural households that reported farm
revenue in both dataset is constructed.
In order to implement the objectives of this section, the chapter applies a matching
decomposition method proposed by Nopo (2008), who developed the standard Blinder-
Oaxaca decomposition to explain gender wage differences. According to Nopo (2008),
this method extends and solves two problems in the Blinder-Oaxaca decomposition.
First, it is a fully nonparametric matching technique, as it does not require estimating
regression models of agricultural production. Second, Nopo’s matching method does
not make the out-of-support assumption because the counterfactual means of
agricultural production are simulated only for the common support. Thus, this method
applies an exact covariate matching procedure, which chooses two sub-samples of
farm and nonfarm households with comparable characteristics to construct the
counterfactual groups. Matching results solely depend on households who are
comparable in terms of observable characteristics of agricultural production, which is
one of disadvantages of this method. Note that the results of the matching technique
are only used to further validate the previous empirical results. In the case of
multivariate regression, unmatched farm and nonfarm households also contribute to the
estimated parameters.
Assume that H represents the indicators of agricultural production (output, revenue,
and inputs), and Z measures household characteristics, which determine agricultural
production. In addition, assume 𝑔𝑛𝑓(𝑧) = 𝐸(𝐻 𝑍⁄ = 𝑧, 𝑛𝑓) denotes the mean of
52 There is no valid instrument that correlates with the decision to produce rice, but does not affect the
amounts produced. This problem is also ignored in previous studies in the literature due to difficulties in
identifying exclusion restrictions.
129
indicators of agricultural production for nonfarm groups of households with
characteristics z. For farm groups, 𝑔𝑓(𝑧) = 𝐸(𝐻 𝑍⁄ = 𝑧, 𝑓) is defined in a similar
manner. Thus, the average nonfarm-farm gaps of indicators of agricultural production
are expressed as:
Δ = 𝐸(𝐻 𝑛𝑓) − 𝐸(𝐻 𝑓⁄⁄ )
By using the approach of Nopo (2008) and the algorithm involving four steps
introduced by Mussa (2014), this chapter performs the matching procedure based on
observed characteristics as below:
* Step 1: Select a household in the sample that participated in nonfarm activities in
2006.
* Step 2: Select all households from the sub-sample of farm households who have the
same characteristics as the households in Step 1. These households did not participate
in nonfarm activities in 2006. Keep these selected observations.
* Step 3: From selected households in Step 2, establish a synthetic household that
matches the household in Step 1. Compute the counterfactual means of agricultural
production including output, revenue and inputs of nonfarm households selected in
Step 1 as the weighted average level of farm households selected in Step 2.
* Step 4: Compute by using the change between actual and the new synthetic
indicators of agricultural production and the “match” dummy variable coded as 1 if
farm and nonfarm households are matched.
This chapter uses the “push” and “pull” factors of decision making on nonfarm
participation of farm households as matching variables. 53 First, it considers farm
characteristics, including land for annual crops in 2004 and 2006 at different quartiles,
and input uses in 2004. Second are dummy variables on educational levels of the
household head such as no education, primary education, and secondary education in
2004. Third, a dummy variable for nonfarm participation of household members in
2004 is also considered. Finally, the value of household assets including farm and
nonfarm assets are classified in four categories, corresponding to different quartiles in
2004. Bezu et al (2012) find that initial household asset holdings and education are
53 See further details in Haggblade et al. (2007) about the determinants of nonfarm participation of farm
households in developing countries.
D

130
important factors for a transition into nonfarm employment and high-return rural
nonfarm employment. It should be noted that this procedure controls for the same
amount of land and assets in 2006. These variables may not necessarily be the same as
in 2004. The only difference between the two matched groups of households is
participation in nonfarm activities in 2006. Note that, this method only focuses on the
change in agricultural production in the period 2004 and 2006.
5.4 Survey sample data and trends of agricultural production and
nonfarm activities
5.4.1 Data and variables
As in the previous chapter, the Vietnam Household Living Standard Surveys of 2004
and 2006 are used for empirical analysis. These surveys are nationally representative,
and consist of questionnaires at both the household and communal levels. The
Vietnamese General Statistics Office has undertaken these surveys with technical
support from the World Bank and UNDP since 1992/1993. VHLSSs provide rich
information on household and commune characteristics such as demography,
education, health, employment, land, assets, income and expenditure. The commune
survey covers information on infrastructure and institution at the communal level. The
cluster-sampling technique is used to represent the entire country. The communal
surveys provide further information on living conditions and communal characteristics
such as infrastructure, businesses, number of people participating in nonfarm activities
in the commune, and other measures.
The VHLSS surveys use a multi-stage, randomized cluster design to survey 2,216
communes of all provinces in each VHLSS 2004 and 2006. These surveys cover 9,188
and 9,189 households, respectively. Fifty per cent of households in VHLSS 2004 were
reinterviewed in the VHLSS 2006. In total, 3,224 rural households were included in both
surveys after accounting for missing data. In order to answer the research question, the
panel of 2,801 rural households that reported farm income in both datasets is
constructed. The total sample size is 5,602 observations.
There are a few limitations of the datasets. First, the surveys do not track migration
history. Nguyen et al. (2011) estimate that the number of households who sent out
working migrants totals 295, accounting for 7 per cent of households in the panel

131
sample.54 There is no information on migration history before 2004. As a result, it is
not possible to identify the percentage of migrant households, who received
remittances. These constraints hinder the analysis of the insights of NELM theory. In
the VHLSS surveys, more than 80 per cent of rural households received remittances
sent from non-household members (Nguyen and Mont 2012). Similarly, using from
VHLSS 2004 and 2006 in rural Vietnam, La and Leung (2012) also find that the
percentage of households receiving remittances were 84.1 and 87.8, respectively.
Second, the information on prices of crops and input is also not tracked. Rice prices are
not available in either the communal or the household surveys. In order to control the
price effect in the model of rice production, a common practice is to calculate unit
values by dividing revenues from the sales of outputs by the corresponding quantities,
and use these as a direct substitute for market prices. In this chapter, unit values of rice
are used to measure rice prices. Nevertheless, Deaton (1997) argues that using unit
values as market prices results in problems such as differences in price and the quality
of outputs, along with measurement errors in both the quantity and sales data.
Therefore, unit values are not perfect measures of rice price. Finally, the VHLSS
surveys only cover registered households. The unregistered households such as rural
migrants are excluded. Given that, these limitations do not impose any serious issue for
the objective of this study.
Dependent variables
The regression analysis in this chapter uses various dependent variables to explore the
impact of nonfarm participation on household production choices. First, the quantity of
rice output is selected to evaluate rice production. Rice output accounts for more than
72 per cent of total annual crops in terms of quantity, and 76 per cent in terms of value.
In the VHLSS surveys, there are more than 20 different annual crops. Second,
agricultural and non-rice agricultural revenues are also selected. VHLSS surveys
provide revenues for each crop, which is useful when calculating total farm revenue
and non-rice farm revenue. As rice represents a large share of total farm revenue, I now
disaggregate farm production into rice and others. In addition to the effects on
agricultural production, the effect of nonfarm activities on household welfare is also
54 Hoang et al. (2014) also find that only 6 per cent of household members were seasonal migrants in
VHLSSs in 2004, 2006, and 2008.

132
explored. Although farm households tend to diversify their livelihoods, crop incomes
represent more than 68 per cent of agricultural incomes.55
Finally, crop expenses consist of input costs, hired labour, and hired capital. Many inputs
like fertiliser, pesticides, seeds, hired labour and capital are measured in terms of value,
and were aggregated at the farm level. This study only examines at expenditure on inputs
because the information on the quantity of inputs is missing, or incomplete and difficult to
compare. As regards hired labour, VHLSS surveys only obtain the value, not the number,
of person days. The equations of dependent variables as different types of crop expenses
can provide the evidence of overcoming liquidity constraints in farm production.
Independent variables
There are 38 per cent of households working only on the farm (full-time farming) and 62
per cent of farm households with at least one member working on nonfarm activities
(part-time farming). Of this 62 per cent, 58.6 per cent reported nonfarm incomes from
their family members who participated in nonfarm activities. Thus, the key variables of
interest are nonfarm participation measured by the number of household members
participating in nonfarm activities and the share of hours working in nonfarm sectors.
In this analysis, nonfarm labour includes rural nonfarm labour and seasonal migrants as
defined by Haggbalde et al. (2007). The number of household members participating in
nonfarm activities measures the variable of rural nonfarm labour. The employment
classification (nonfarm wages and nonfarm self-employment) is carried out by
considering the most time-consuming job. Similarly, a seasonal migrant is broadly
defined as a person who has been absent from home for a minimum of one month and a
maximum of 11 months. Many nonfarm businesses operate according to the rhythms set
by agricultural season. Seasonal migrants are still considered household members
according to the definition in Section 3.1 in this chapter. It should be noted that nonfarm
employment in rural Vietnam takes place predominantly in local communities.
In the VHLSS 2004 and 2006 surveys, the share of households leaving for seasonal
migration accounts for 4.13 and 4.64 per cent of rural households, respectively.
Furthermore, the proportion of seasonal migration households among all nonfarm
households represents 5.15 and 10.25 per cent in the two surveys, respectively. The
55 When taking the log of dependent variables, I add an arbitrary constant of “1” to variables with zero
value to avoid creating missing values.
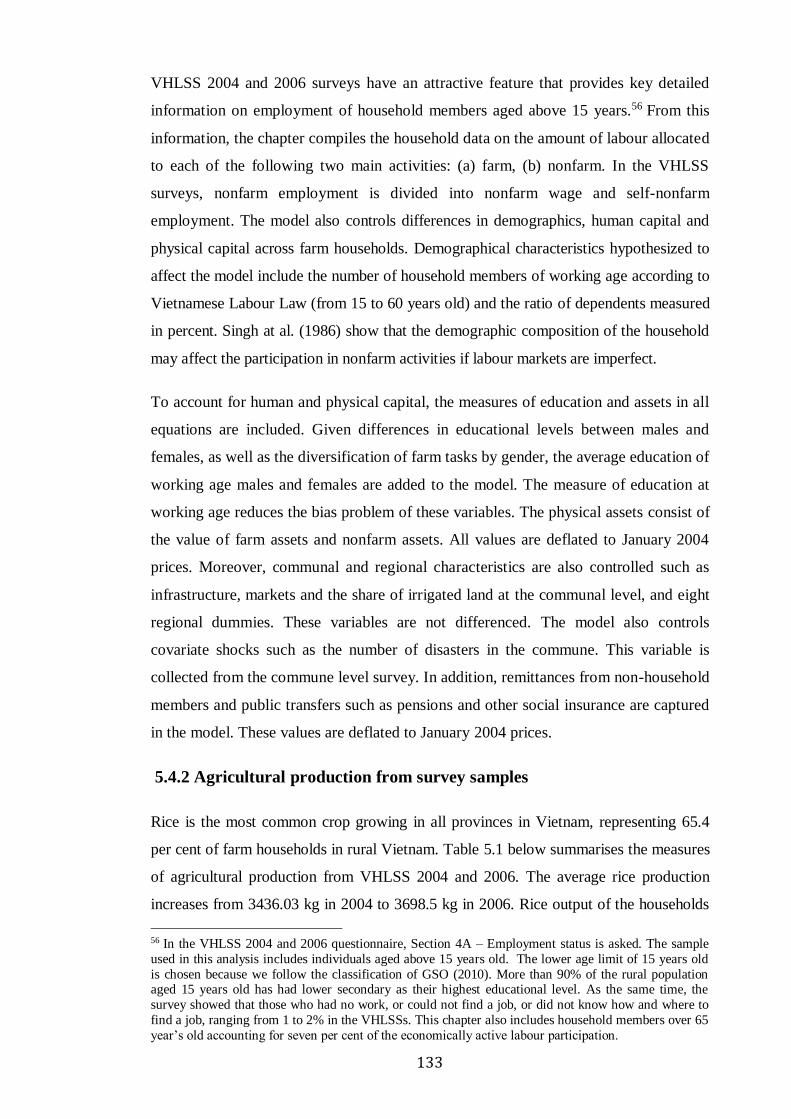
133
VHLSS 2004 and 2006 surveys have an attractive feature that provides key detailed
information on employment of household members aged above 15 years.56 From this
information, the chapter compiles the household data on the amount of labour allocated
to each of the following two main activities: (a) farm, (b) nonfarm. In the VHLSS
surveys, nonfarm employment is divided into nonfarm wage and self-nonfarm
employment. The model also controls differences in demographics, human capital and
physical capital across farm households. Demographical characteristics hypothesized to
affect the model include the number of household members of working age according to
Vietnamese Labour Law (from 15 to 60 years old) and the ratio of dependents measured
in percent. Singh at al. (1986) show that the demographic composition of the household
may affect the participation in nonfarm activities if labour markets are imperfect.
To account for human and physical capital, the measures of education and assets in all
equations are included. Given differences in educational levels between males and
females, as well as the diversification of farm tasks by gender, the average education of
working age males and females are added to the model. The measure of education at
working age reduces the bias problem of these variables. The physical assets consist of
the value of farm assets and nonfarm assets. All values are deflated to January 2004
prices. Moreover, communal and regional characteristics are also controlled such as
infrastructure, markets and the share of irrigated land at the communal level, and eight
regional dummies. These variables are not differenced. The model also controls
covariate shocks such as the number of disasters in the commune. This variable is
collected from the commune level survey. In addition, remittances from non-household
members and public transfers such as pensions and other social insurance are captured
in the model. These values are deflated to January 2004 prices.
5.4.2 Agricultural production from survey samples
Rice is the most common crop growing in all provinces in Vietnam, representing 65.4
per cent of farm households in rural Vietnam. Table 5.1 below summarises the measures
of agricultural production from VHLSS 2004 and 2006. The average rice production
increases from 3436.03 kg in 2004 to 3698.5 kg in 2006. Rice output of the households
56 In the VHLSS 2004 and 2006 questionnaire, Section 4A – Employment status is asked. The sample
used in this analysis includes individuals aged above 15 years old. The lower age limit of 15 years old
is chosen because we follow the classification of GSO (2010). More than 90% of the rural population aged 15 years old has had lower secondary as their highest educational level. As the same time, the
survey showed that those who had no work, or could not find a job, or did not know how and where to
find a job, ranging from 1 to 2% in the VHLSSs. This chapter also includes household members over 65
year’s old accounting for seven per cent of the economically active labour participation.
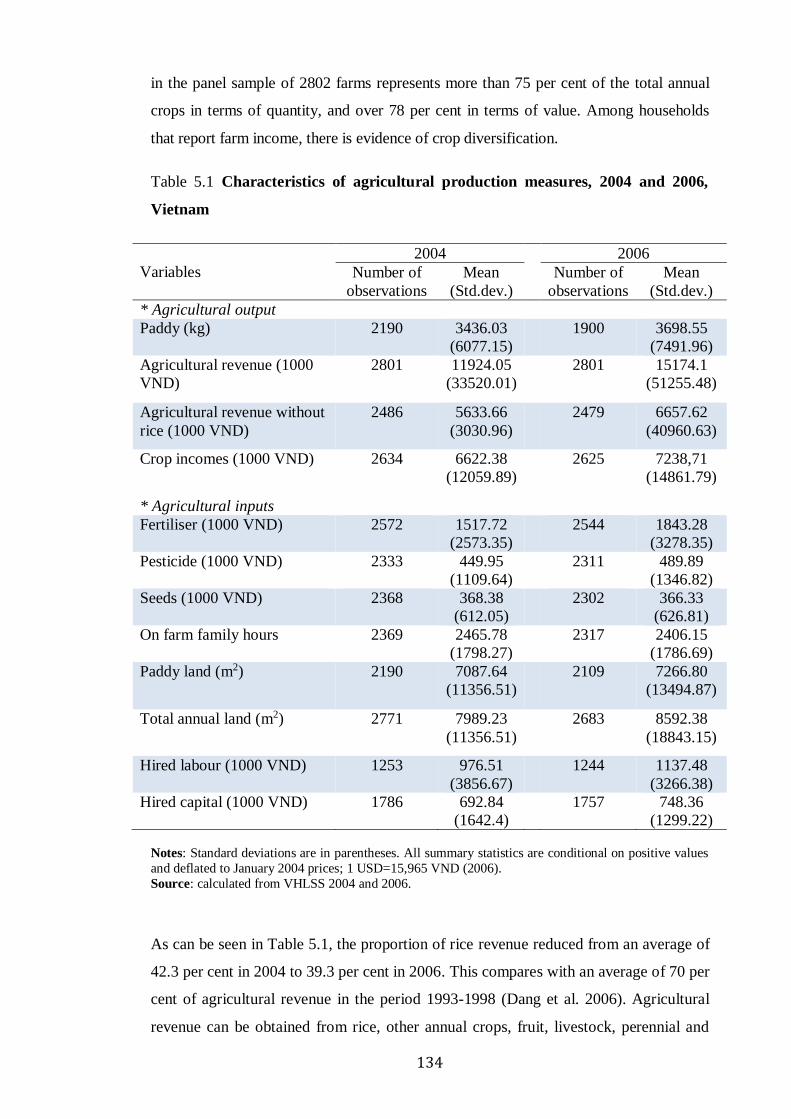
134
in the panel sample of 2802 farms represents more than 75 per cent of the total annual
crops in terms of quantity, and over 78 per cent in terms of value. Among households
that report farm income, there is evidence of crop diversification.
Table 5.1 Characteristics of agricultural production measures, 2004 and 2006,
Vietnam
Variables
2004 2006
Number of
observations
Mean
(Std.dev.)
Number of
observations
Mean
(Std.dev.)
* Agricultural output
Paddy (kg) 2190 3436.03
(6077.15)
1900 3698.55
(7491.96)
Agricultural revenue (1000
VND)
2801 11924.05
(33520.01)
2801 15174.1
(51255.48)
Agricultural revenue without
rice (1000 VND)
2486 5633.66
(3030.96)
2479 6657.62
(40960.63)
Crop incomes (1000 VND) 2634 6622.38
(12059.89)
2625 7238,71
(14861.79)
* Agricultural inputs
Fertiliser (1000 VND) 2572 1517.72
(2573.35)
2544 1843.28
(3278.35)
Pesticide (1000 VND) 2333 449.95
(1109.64)
2311 489.89
(1346.82)
Seeds (1000 VND) 2368 368.38
(612.05)
2302 366.33
(626.81)
On farm family hours 2369 2465.78
(1798.27)
2317 2406.15
(1786.69)
Paddy land (m2) 2190 7087.64
(11356.51)
2109 7266.80
(13494.87)
Total annual land (m2) 2771 7989.23
(11356.51)
2683 8592.38
(18843.15)
Hired labour (1000 VND) 1253 976.51
(3856.67)
1244 1137.48
(3266.38)
Hired capital (1000 VND) 1786 692.84
(1642.4)
1757 748.36
(1299.22)
Notes: Standard deviations are in parentheses. All summary statistics are conditional on positive values
and deflated to January 2004 prices; 1 USD=15,965 VND (2006).
Source: calculated from VHLSS 2004 and 2006.
As can be seen in Table 5.1, the proportion of rice revenue reduced from an average of
42.3 per cent in 2004 to 39.3 per cent in 2006. This compares with an average of 70 per
cent of agricultural revenue in the period 1993-1998 (Dang et al. 2006). Agricultural
revenue can be obtained from rice, other annual crops, fruit, livestock, perennial and

135
industrial crops, and aquaculture products. Thus, farms in rural Vietnam have been
switching from specialized to diversified farming as rice income tends to fall and other
sources of incomes such as cash crops and livestock tend to increase.
Table 5.2 Changes in farm outputs and inputs between 2004 and 2006, rural
Vietnam
Variables
Farm
households
(full-time
farming)
Non-farm
households*
(part-time
farming)
All
households
Change in paddy production (kg) 392.60
(4392.57)
547
95.90
(3538.81)
1298
180.65
(3803.46)
1845
Change in agricultural revenue (1000
VND)
1512.02
(15494.46)
819
940.22
(13295.95)
1983
1099.34
(13941.90)
2802
Change in agricultural revenue without
rice (1000 VND)
1688.00
(21055.45)
748
734.99
(10106.97)
1618
1020.17
(14293.43)
2366
Change in paddy land (m2) 609.61
(7928.56)
626
-29.00
(6210.20)
1423
155.94
(6757.23)
2049
Change in farm hours -44.02
(1998.73)
690
-167.50
(1709.71)
1416
-129.09
(1805.03)
2106
Change in fertiliser (1000 VND) 369.68
(2189.41)
760
289.27
(1873.34)
1716
312.68
(1970.51)
2476
Change in seeds (1000 VND) -19.21
(405.58)
695
-8.83
(479.83)
1539
-11.88
(459.17)
2234
Changes in hired labour (1000 VND) 13.78
(1593.84)
790
88.07
(1361.95)
1768
66.31
(1433.85)
2558
Change in hired capital (1000 VND) -22.16
(1325.84)
790
36.57
(1423.94)
1768
19.37
(1395.93)
2558
Change in livestock expenditure (1000
VND)
368.78
(8108.35)
819
377.36
(9201.35)
1983
374.97
(8909.27)
2802 Notes: All means are conditional on mean being larger than zero; standard deviations are in parentheses;
number of observations is in italics. All values are deflated to January 2004 prices; 1 USD=15,965 VND
(2006); * Nonfarm households are defined as having at least one family member who participates in
nonfarm activities (Haggblade et al. 2007);
Source: calculated from VHLSS 2004 and 2006.

136
Table 5.2 provides information on changes in rice production and inputs between 2004
and 2006. When this chapter compares the change in paddy production between two
years, 2004 and 2006, in households that increased their participation in nonfarm
activities, it can be noted that there are small but noticeable differences in summary
statistics. Agricultural output among nonfarm households grew somewhat more slowly
than that of farm households. When potential negative effects of labour movement into
nonfarm activities are offset by the increased use of capital financed from nonfarm
incomes, differences in paddy production between two groups of households may not
be apparent in the descriptive statistics.
In addition, nonfarm households also appear to have reduced paddy land, which is
opposite to the increasing trend for farm households. As the same time, nonfarm
households decreased the farm labour input more than farm households, and used more
capital and hired labour, while on average farm households appear to have decreased
the amount of hired capital. However, these descriptive statistics do not account for
inherent differences between farm and nonfarm households. The empirical analysis
also control regional differences. All input and output variables are expressed in
logarithms to minimize the impact of outliers.
5.4.3 Trends of nonfarm activities and income diversification in Vietnam
from survey samples
Although agricultural production plays an important role and is undertaken by most
households in rural Vietnam, many farm households augment incomes with a wide
array of other productive activities such as wage labour within, or near local
communities, or by migrating. Table 5.3 shows the percentage of nonfarm employment
of rural individuals by industry and sector for the period 2004-2006. As can be seen in
the table, rural households participated in diverse types of industries: Manufacturing,
construction and trading were the main industries, accounting for over 65 per cent of
employment in the nonfarm sector. Similarly, nonfarm wage employment was made
mainly of nonfarm work, representing more than 67 per cent of nonfarm employment.
In 2006, nonfarm self-employment (including household business) constituted
approximately 32.3 per cent of total nonfarm employment.

137
Table 5.3 Percentage of rural individuals in nonfarm activities
Variable 2004 2006
* By industries
Mining 2.20 2.11
Manufacturing 30.26 31.80
Construction 16.53 15.74
Finance and real estate 0.34 0.31
Government administration 5.61 5.68
Education, culture and science 9.11 8.23
Hotel, administration and services 4.67 4.37
Trading 20.27 22.10
Utility (electricity and water) 0.39 0.46
Transport and communication 5.97 4.62
Others 4.63 4.57
* By sectors
Wage employment 68.46 67.67
Self-employment 31.54 32.33
Source: calculated from VHLSS 2004 and 2006.
In this chapter, the household-level data are compiled using the amount of labour
allocated to each of the following activities: (a) only farm, (b) farm wages, (c) nonfarm
wages, (d) nonfarm self-employment. Based on these activities, Figure 5.1 introduces
the patterns of labour allocation of a rural household, on average. Households relying
only on farm work accounted for 38 per cent of the total, while households that
combined own-farming with nonfarm wage work and nonfarm self-employment
accounted for 22 and 23 per cent, respectively. Yet, nonfarm labour is clearly
important for agricultural households: 62 per cent of households had one or more
family members that were engaged in nonfarm activities (including (b), (c), or (d) in
Figure 5.1).

138
Figure 5.1 Trends of part-time farming in rural areas
Notes: (a): farm; (b) farm wages; (c) nonfarm wages; (d) nonfarm self-employment
Source: calculated from VHLSS 2004 and 2006.
As found in many nonfarm studies, nonfarm labour in Vietnam tends to be younger and
better educated than farm labour (Table 5.4). Family members have to divide their time
between farming and nonfarm activities or spend all their time on nonfarm activities.
Thus, part-time farming is one of the channels through which labour is moving out of
agriculture (Weiss 1996). The younger and better-educated individuals may sustain
success in nonfarm opportunities. It is, however, likely that farm households cannot
leave agriculture entirely. As a result, household labour availability for nonfarm jobs is
restricted. Furthermore, decisions regarding nonfarm participation may be constrained in
regions with thin local job markets, or lack of funds or credit, to start nonfarm self-
employment activities. If local nonfarm markets are not available, farmers have to
migrate seasonally or permanently. In the panel data, there is more than one family
member working in nonfarm activities, which are considered as the most time
consuming jobs. Thus, agricultural production may be affected due to the reduction of
farm labour and cash constraints.
only farm: 38%
farm and farm
wage: 22%
farm and nonfarm
self-
employment:23%
farm, farm wages,
and nonfarm
wages: 6%
1%10%
a
a & c
a & d
a, b, & c
a, b, c, & d
a, c, & d
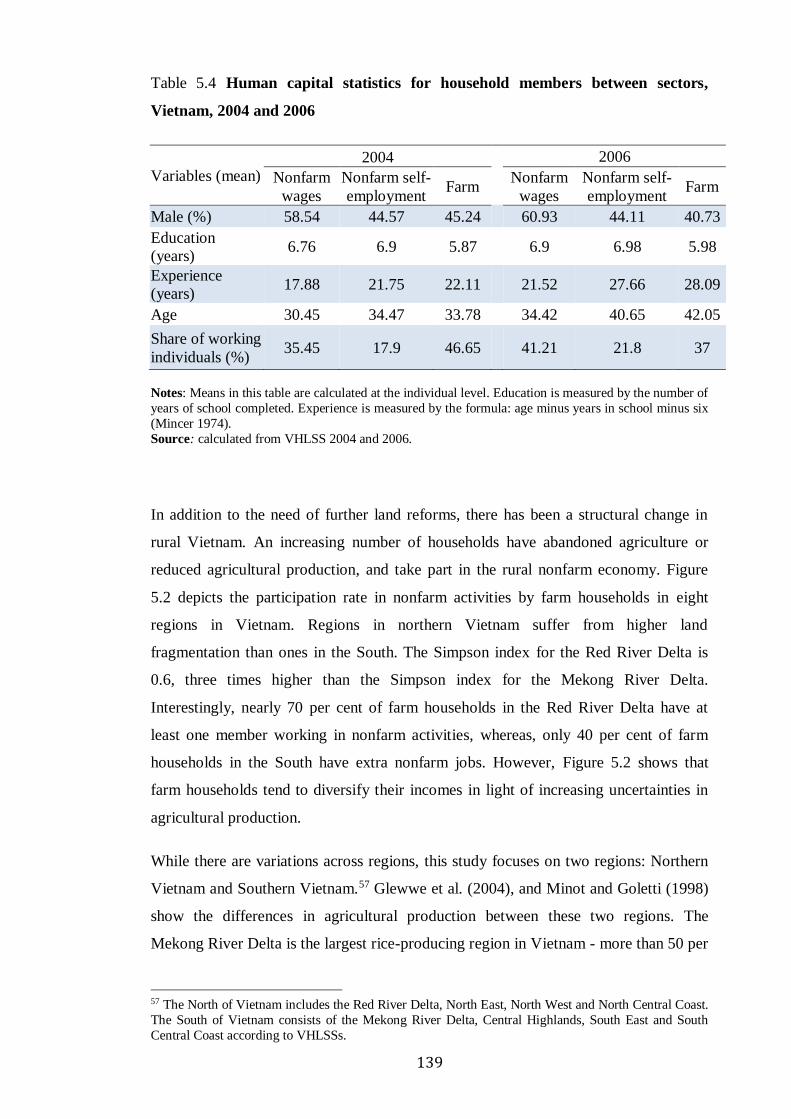
139
Table 5.4 Human capital statistics for household members between sectors,
Vietnam, 2004 and 2006
Variables (mean)
2004
2006
Nonfarm
wages
Nonfarm self-
employment Farm
Nonfarm
wages
Nonfarm self-
employment Farm
Male (%) 58.54 44.57 45.24
60.93 44.11 40.73
Education
(years) 6.76 6.9 5.87
6.9 6.98 5.98
Experience
(years) 17.88 21.75 22.11
21.52 27.66 28.09
Age 30.45 34.47 33.78
34.42 40.65 42.05
Share of working
individuals (%) 35.45 17.9 46.65 41.21 21.8 37
Notes: Means in this table are calculated at the individual level. Education is measured by the number of
years of school completed. Experience is measured by the formula: age minus years in school minus six
(Mincer 1974).
Source: calculated from VHLSS 2004 and 2006.
In addition to the need of further land reforms, there has been a structural change in
rural Vietnam. An increasing number of households have abandoned agriculture or
reduced agricultural production, and take part in the rural nonfarm economy. Figure
5.2 depicts the participation rate in nonfarm activities by farm households in eight
regions in Vietnam. Regions in northern Vietnam suffer from higher land
fragmentation than ones in the South. The Simpson index for the Red River Delta is
0.6, three times higher than the Simpson index for the Mekong River Delta.
Interestingly, nearly 70 per cent of farm households in the Red River Delta have at
least one member working in nonfarm activities, whereas, only 40 per cent of farm
households in the South have extra nonfarm jobs. However, Figure 5.2 shows that
farm households tend to diversify their incomes in light of increasing uncertainties in
agricultural production.
While there are variations across regions, this study focuses on two regions: Northern
Vietnam and Southern Vietnam.57 Glewwe et al. (2004), and Minot and Goletti (1998)
show the differences in agricultural production between these two regions. The
Mekong River Delta is the largest rice-producing region in Vietnam - more than 50 per
57 The North of Vietnam includes the Red River Delta, North East, North West and North Central Coast.
The South of Vietnam consists of the Mekong River Delta, Central Highlands, South East and South
Central Coast according to VHLSSs.

140
cent of rice output and more than 90 per cent of rice exports from this region (Pham et
al. 2015). It should be noted that in 2006 rice land accounted for 82.58 per cent and 68.4
per cent of total agricultural land in the Red River Delta and Mekong River Delta,
respectively (VHLSS 2006).
Figure 5.2 The structure of two groups of households by regions from the VHLSS
2004-2006
Notes: (a) Households working only on the farm; (b) Households with at least one member working in
nonfarm activities; Source: calculated from VHLSS 2004 and 2006.
In contrast, farm households in the North of Vietnam are smallholders and tend to
diversify their livelihoods into nonfarm sectors (Minot 2006). Average rural farm
households have 6.5 plots of land in the north and 3.4 plots in the south (World Bank
2006). As depicted in Figure 5.3 using the sample, the average paddy output per tonne
and land of a farm household in the South are nearly three times higher than the ones
in the North. Therefore, the impact of nonfarm participation on agricultural production
is likely to be different.
0.00
20.00
40.00
60.00
80.00
100.00
120.00
Red River
Delta
North East North West North Central
Coast
South Central
Coast
Central
Highlands
South East Mekong River
Delta
b
a

141
Figure 5.3 Differences in rice production of a farm household, North and South
Vietnam
Source: Author’s calculation using VHLSS 2004 and 2006.
Table 5.5 below provides the information on incomes by farm size in the period 2004 -
2006. Clearly, households with smaller farm sizes are more engaged in nonfarm
activities. In the survey sample, more than 60 per cent of rural households have a farm
size that is less than 0.5 hectare. Nonfarm income represents the largest share of off-
farm income of rural household in Vietnam. The share of total household income
derived from nonfarm activities falls with farm size. In addition, among off-farm-
incomes, nonfarm incomes are far much higher than agricultural wages. All categories
of off-farm activities are relatively more important for households with fewer land
assets. Thus, the ability to participate in nonfarm activities is fundamental for the land-
poor. Many households with small farm sizes are more engaged to off-farm activities.
Small landholding households have diversified their livelihoods in light of increasing
costs of inputs and the declining trend of rice prices.
4.35
1.93
0.47
5.13
1.96
0.46
8.01
4.12
0.89
12.2
5.28
1.1
0
2
4
6
8
10
12
14
Paddy output
(million
VND)
Paddy output
(tonne)
Paddy land
(ha)
Paddy output
(million
VND)
Paddy output
(tonne)
Paddy land
(ha)
2004 2006
North
South
142
Table 5.5 Sources of income in rural Vietnam by farm sizes, 2004-2006
<0.5 ha 0.5-1 ha 1-2ha 2-3ha >3ha
Share in total incomes (%)
Total farm incomes 35.33 62.12 71.39 76.53 78.72
Total off-farm incomes58 64.65 37.87 28.61 23.47 21.28
Nonfarm incomes 47.63 25.52 18.56 15.20 14.63
Nonfarm wages 29.93 16.92 12.91 9.78 9.77
Self-nonfarm incomes 17.67 8.59 5.64 5.42 4.86
Agricultural wages 1.70 0.77 0.81 0.41 0.12
Remittances 9.12 7.19 5.75 4.62 3.32
Public transfers 4.08 2.65 1.99 1.94 1.74
Others 2.15 1.74 1.49 1.30 1.47
Number of households (%) 61.44 17.17 11.84 4.64 4.91
Note: All incomes deflated to January 2004 prices Source: Calculated from VHLSS panel data 2004-2006
Similarly, Table 5.6 provides information on sources of incomes by quintiles of real per
capital expenditure in the period 2004-2006. For the middle and richest groups, off-farm
incomes are more important than farm incomes. The richer the household is, the higher
the share of nonfarm income. These results are consistent with the findings of previous
studies shown in the literature review. For the poor groups in the sample, farming is the
main activity. Agriculture emerges as the driving factor in determining the evolution of
expenditure in poor groups. Nonfarm incomes only represent 28.29 per cent of the total
income of the poorest households. Clearly, there is upward mobility in labour markets in
rural Vietnam. When household incomes improve, households tend to move toward
nonfarm activities. Haggblade et al. (2007) show that there are barriers for poor
households to enter nonfarm activities due to constraints of education and assets.
However, in the context of rural Vietnam, nonfarm employment contributes to
improving the livelihoods of these households. Small farm sizes, land fragmentation and
58 According to the questionnaire from VHLSS of 2004 and 2006, remittances are incomes from people
who are not household members. Therefore, they are not considered as nonfarm incomes for rural
households. Other incomes in this paper are income from education, health, and others from section 4D2
of the questionnaire. Nonfarm incomes are incomes that are collected from section 4A-Employment and
section 4C2 respectively. The sum of all income except farm income is off-farm income. The VHLSS
also collected information on the income obtained from nonfarm activities. Public transfers consist of
income as pension, social insurance and unearned transfers received by households. Nonfarm incomes include wages from household members who migrated to other provinces and cities to work. Farm
incomes include net income (total production value minus expenditures) from crops, livestock, forestry,
and aquaculture.
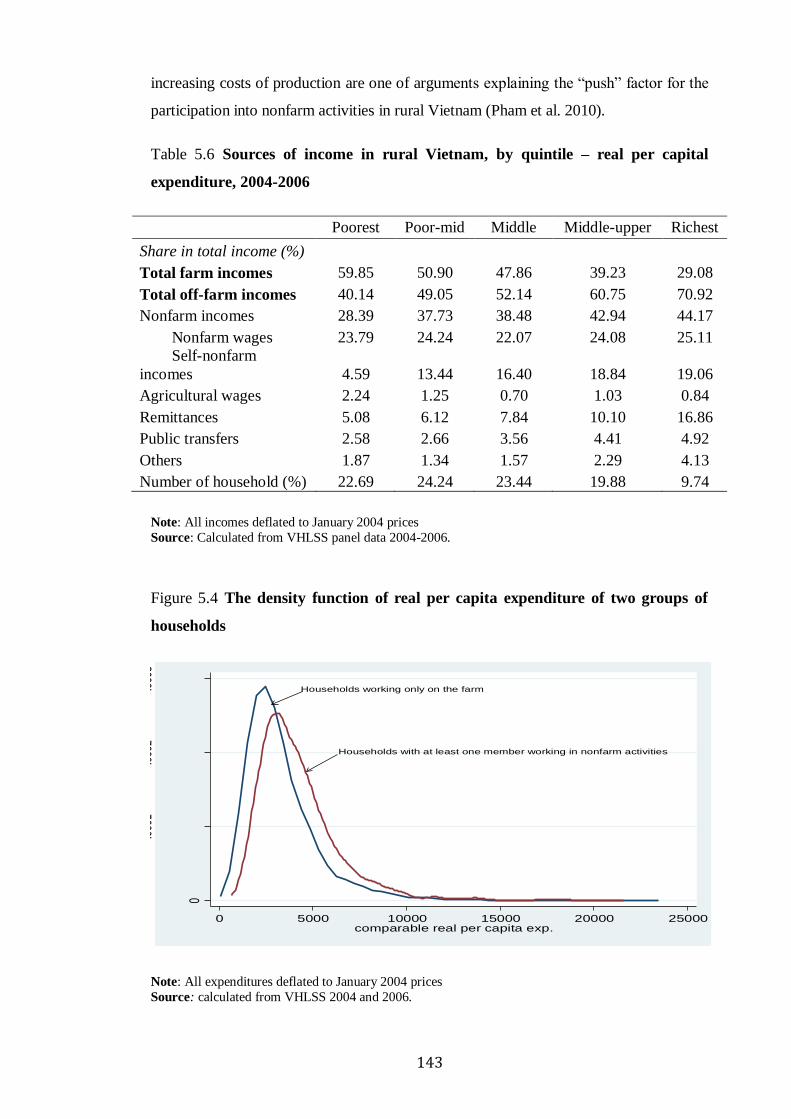
143
increasing costs of production are one of arguments explaining the “push” factor for the
participation into nonfarm activities in rural Vietnam (Pham et al. 2010).
Table 5.6 Sources of income in rural Vietnam, by quintile – real per capital
expenditure, 2004-2006
Poorest Poor-mid Middle Middle-upper Richest
Share in total income (%)
Total farm incomes 59.85 50.90 47.86 39.23 29.08
Total off-farm incomes 40.14 49.05 52.14 60.75 70.92
Nonfarm incomes 28.39 37.73 38.48 42.94 44.17
Nonfarm wages 23.79 24.24 22.07 24.08 25.11
Self-nonfarm
incomes 4.59 13.44 16.40 18.84 19.06
Agricultural wages 2.24 1.25 0.70 1.03 0.84
Remittances 5.08 6.12 7.84 10.10 16.86
Public transfers 2.58 2.66 3.56 4.41 4.92
Others 1.87 1.34 1.57 2.29 4.13
Number of household (%) 22.69 24.24 23.44 19.88 9.74
Note: All incomes deflated to January 2004 prices
Source: Calculated from VHLSS panel data 2004-2006.
Figure 5.4 The density function of real per capita expenditure of two groups of
households
Note: All expenditures deflated to January 2004 prices
Source: calculated from VHLSS 2004 and 2006.
Households working only on the farm
Households with at least one member working in nonfarm activities
0
.000
1.0
002
.000
3
Den
sity
0 5000 10000 15000 20000 25000comparable real per capita exp.

144
Several studies have shown that participation in the rural nonfarm economy is
positively correlated to household welfare (Haggbalde et al. 2007; Lanjouw and
Lanjouw 2001). However, studies of the determinants of nonfarm participation
indicate that rich households have better access to remunerative nonfarm activities (de
Janvry & Sadoulet 2001). In the context of rural Vietnam, households with at least one
member in a nonfarm activity have higher expenditure than ones with only farming
activities (Figure 5.4).
5.5 Empirical results
This section provides the empirical results of the effect of nonfarm labour on household
production choices in rural Vietnam. A series of regressions use first difference, and
2SLS with first difference. This section only reports the results of each method and
evaluates the consistency of the empirical results. As regards the 2SLS method, two
different groups of equations are estimated. All tests related to instrumental variables are
also provided. The following analysis is carried out for the whole sample. Due to
differences in agricultural production between Northern and Southern Vietnam, regional
results are also introduced in this section. For brevity, full regression tables are presented
in the Appendix of this chapter.
5.5.1 Results of first-stage regression
The first-stage results for the instrumented measures of nonfarm participation, reported
in Table 5.7, are estimated using the first difference method. Using the communal
surveys in 2004, the share of people working in nonfarm activities over the past 12
months measures the lagged nonfarm networks. As can be seen in Table 5.7, the
coefficients of the instrumental variable is positive and statistically significant, which
implies that the increase in the share of nonfarm networks at the communal level leads
to an increase in the nonfarm participation of household members. The cluster
corrected F-statistics testing the hypothesis that the coefficients on the instrument are
zero exceed Stock and Yogo critical values for weak instruments. This chapter also
considers a value of F-statistic above 10 from the test of joint significance of the
instruments in the first-stage regression as essential to state that instruments are
sufficiently strong.
Columns (2) and (4) are estimated without agricultural variables such as production
inputs and unit values of rice as proxy of rice price. However, results are still consistent.

145
The results do not depend on whether or not agricultural variables are used in the
sample. The lagged nonfarm network at communal level measured by the number of
people participating in nonfarm activities in the commune (obtained from the commune
level survey in 2004) identifies the nonfarm labour equation.
Table 5.7 Results of first stage regression (2SLS)
Change in number of
individuals in nonfarm
activities
Change in the share of
hours working in nonfarm
activities
Independent variables (1) (2)
(3) (4)
Lagged nonfarm network at
commune level, 2004
0.291***
(0.006)
0.291***
(0.006)
0.062***
(0.002)
0.062***
(0.002)
Agricultural variables (differenced) Included
Included
Household characteristics
(differenced) Included Included
Included Included
Commune characteristics Included Included Included Included
Regional dummies? Yes Yes
Yes Yes
R2 0.454 0.452
0.292 0.288
Number of observations 2801 2801
Notes: Columns (1) and (3) refer to annual crop production; Columns (2) and (4) refer to crop expenses;
Standard errors are robust through cluster option and in parentheses; ∗, ∗∗, ∗∗∗ indicates that the
corresponding coefficients are significant at the 10%, 5%, and 1% levels, respectively; Full details of the estimation are presented in Appendix 5.3 in the Appendices of the chapter.
5.5.2 The effect of participation in nonfarm activities on rice production
Asian countries have undergone a rapid economic structural transformation in light of
rising rural wages, (as described in Chapter 3). As a result, increasing part-time
farming and the rural nonfarm economy may reduce rice production in a country
characterized by small and fragmented landholdings. The existing empirical evidence
in the literature, reviewed in Section 5.3, suggests that nonfarm participation may
distort on-farm operations in the short-run and nonfarm incomes can reduce the negative
impacts by investing in capital intensive and profitable cash crop production in
developing countries. In Asia, agricultural production has been dominated by labour-
intensive cultivation-based small farms, mainly relying on family labour (Hazell and
Rahman 2014). In the case of the absence of efficient labour market and credit
constraints, labour movement is likely to affect agriculture. This section mainly explores
the effect of nonfarm participation on rice production in rural Vietnam.

146
Table 5.8 The effects of nonfarm participation on rice output in rural Vietnam,
2004-2006
Explanatory variables
Dependent variable: Rice output
The whole country North South
FD-OLS FD-2SLS FD-OLS FD-2SLS FD-OLS FD-2SLS
1. Panel A
Change in number of
individuals in nonfarm
activities
-0.001
(0.006)
-0.027**
(0.011)
-0.004
(0.007)
-0.031**
(0.014)
-0.007
(0.014)
-0.020
(0.02)
Tests of instruments
DWH F-test, p-value
0.0041
0.004
0.296
F-statistics, excluded
instruments 500.8
251.04
267.34
R2 0.317 0.313
0.330 0.323
0.321 0.320
2. Panel B
Changes in the share of
hours working in
nonfarm activities
-0.003
(0.015)
-0.128**
(0.053)
-0.021
(0.024)
-0.163**
(0.072)
-0.004
(0.026)
-0.082
(0.081)
Tests of instruments
DWH F test, p-value
0.0035
0.0042
0.221
F statistics, excluded
instruments 361.77
205.76
186.11
R2 0.317 0.307
0.330 0.313
0.321 0.317
Number of observations 2801 2801 1649 1649 1152 1152
Notes: FD means first difference; Standard errors are robust through cluster option and in parentheses;
Dependent variables are expressed in the log; All regional, household and communal variables, and rice
price are included in the models in each panel; All models differenced to remove unobserved fixed
effects and estimated using instrument variables with IV-GMM procedure as discussed in Section 5.3; ∗,
∗∗, ∗∗∗ indicates that the corresponding coefficients are significant at the 10%, 5%, and 1% levels, respectively. Full details of the estimation are presented in Appendices A5.4-5.9 in the Appendices of
the chapter.
Table 5.8 shows the results of OLS and 2SLS estimates of two separated equations on rice
output. OLS estimation shows a statistically insignificant effect. However, the estimated
coefficients with 2SLS for rice output find that an additional family member participating
in nonfarm activities shows a negative and significant effect on rice production. According
to Panel A, an additional household member working in the nonfarm sector reduces the
household rice output by around 3 per cent between the period 2004 and 2006. As mean
rice output in the sample is around 3561.9 kg per farm household per year, this result
implies that a household may lose around 106.9 kg of rice. Although there is clear
evidence of structural change in rural areas, the magnitude of impact on paddy production
is small, illustrating weak evidence of the impact of labour movement into nonfarm

147
activities on paddy output. In Panel B, the measure of changes in the share of hours
working in the nonfarm economy is selected. The 2SLS estimations find that a 10 per cent
increase in the share of hours that family members work in nonfarm sectors reduces rice
output by 1.28 per cent between 2004 and 2006. This finding is also consistent with
Brennan et al. (2012) when authors used the Vietnam Agricultural Sector model to explore
the impact of rural-urban migration on Vietnamese agriculture.
The effects of nonfarm participation are further decomposed into regional differences
(Table 5.8). In the north, an additional family member in the nonfarm sector reduces
paddy output by 3.1 per cent; and a 10 per cent increase in the share of working hours in
nonfarm activities results in a reduction of 1.63 per cent in rice output. In contrast, in the
south, there is no effect of labour movement into the nonfarm economy on rice
production. One possible reason for this is that rice production is more labour-intensive
in the north than in the south. Pingali et al. (1998) find that in 1995, farm households had
on average 246 labour days per hectare per person in the Red River Delta versus 96 days
in the Mekong River Delta. Similarly, there are significant differences in total on-farm
working hours per household per year in the panel sample between regions. Thus, the
reduction of on-farm family members may lead to a decrease in rice production in the
north. The effects on agricultural inputs presented in the next section provide further
explanation of this difference.
More interestingly, the magnitude of reduction in paddy output is smaller when
compared with the previous study by De Brauw (2010) on seasonal migration. The
impact on paddy production is consistent with other studies that found a decline of
paddy output. De Brauw (2010) also finds that in Vietnam, an additional seasonal
migrant is associated with between 29 - 39 per cent less rice production. This is a huge
decline. In this study, if the participation in rural nonfarm activities and part-time
farming are captured, the adverse impact on rice production is less severe. Moreover, the
decline in rice output only occurs in the north, which has more land constraints to cope
with than the south. These findings emphasize the importance of the development of the
rural nonfarm economy in Vietnam’s rural structural transformation.
5.5.3 The effect of nonfarm activities on agricultural revenue
One question is whether or not aggregate production or agricultural revenue in Vietnam
has changed as a result of rapid rural transformation. If agricultural revenue reduces due
to the participation in nonfarm activities by household members, households may move

148
away from agriculture. On the other hand, if there is no impact, or an increase in
agricultural revenue, this implies that farmers may diversify their livelihoods, or crop
mix to cope with the reduction of farm labour. Therefore, this section explores the
impact of nonfarm participation on aggregate agricultural production measured by
agricultural revenue.
As can be seen in Table 5.9, OLS estimations find a statistically insignificant impact on
agricultural revenue in both Panels A and B. However, 2SLS estimations show statistically
significant effects in the whole country, and the north samples. In Panel A of 2SLS, an
additional family member in the nonfarm sector results in a reduction of agricultural
revenue in the whole country by 4.8 per cent, and in the north by 5.3 per cent. As the mean
agricultural revenue in the whole sample is around VND 15.17 million per year, this
estimation implies that for the whole sample households lose around nearly VND 728,400
of their agricultural revenue due to labour movement into nonfarm activities. Similarly, the
2SLS estimations find that a 10 per cent increase in the share of hours that family
members working in the nonfarm economy reduce total agricultural revenue in the whole
country and the north sample by 2.24 per cent and 2.8 per cent between 2004 and 2006,
respectively. Moreover, the different impacts between OLS and 2SLS show that the
effects are statistically significant among farm households who keep nonfarm network
availability. In addition, for the south sample, there is no impact of nonfarm participation
on total farm revenue. One possible reason is that the impact of nonfarm participation on
rice production in the south is economically no different from zero.
As regards non-rice agricultural revenue, the analysis show no evidence of a
statistically significant effect of nonfarm participation on non-rice agricultural revenue
in the whole sample and all regions - this suggests that some households are retaining
their crop mix in response to nonfarm participation. Despite the statistical evidence,
the effect of participation of family members in nonfarm activities on rice output is not
strong - households appear to maintain and change to other crops. This explains why
the effects of nonfarm participation are economically no different to zero. This
empirical result is also consistent with the finding of previous study on seasonal
migration in Vietnam (De Brauw 2010), which provides the evidence of growing more
of crops other than rice in the north of Vietnam.
To sum up, in spite of the small decreasing amount compared to total agricultural
revenue, the estimated coefficients of nonfarm variables are negative in all regions,

149
which implies that using the north sample farm households may shift out of agriculture
as they begin to work in nonfarm activities. However, the empirical evidence shows
that there is no impact on non-rice agricultural revenue. Therefore, it can be concluded
that nonfarm participation in smallholder agriculture appears to be only substituted for
rice production in the north of Vietnam, not in the south. Smallholder agriculture in the
north is losing its comparative advantage. The significant impacts only occur among
households that respond to nonfarm networks. This conclusion seems to contradict the
target of the ‘rice first’ policy that keeps farm households continuing rice production.
Chapter 3 presents a system of supporting policies to encourage rice farmers to stay in
agriculture and produce rice in Vietnam. However, the increasing trend of part-time
farming and the expansion of the rural nonfarm economy is not complementary to rice
production, particularly in the north of Vietnam. Hazell and Rahman (2014) and Wiggin
et al. (2010) conclude that agriculture and the rural nonfarm economy are more
complementary than is competition. This study shows that the complementary or
competitive condition depends on the context in each country and region, in which land
constraints play an important role. There are several possible explanations for the lack of
impact on non-rice agricultural revenue in all regions. Nonfarm participation may enable
farm households to overcome liquidity constraints in producing other more valued crops.
Households can substitute family labour by spending on hired labour and capital.
Furthermore, households may choose to leave labour-intensive producing rice to
produce less labour-intensive crops. The next section examines household behaviour
related to input usage when farm households participate in nonfarm activities.

150
Table 5.9 The effects of nonfarm participation on agricultural, and non-rice agricultural revenue in rural Vietnam, 2004 and 2006
Explanatory variables
Dependent variable: Total agricultural revenue Dependent variable: Total non-rice agricultural revenue
The whole country
North
South The whole country
North
South
FD-OLS FD-2SLS
FD-OLS FD-2SLS FD-OLS
FD-
2SLS FD-OLS
FD-
2SLS FD-OLS
FD-
2SLS FD-OLS
FD-
2SLS
1. Panel A
Change in number of
individuals in nonfarm
activities
-0.013
(0.01)
-0.048***
(0.017)
-0.009
(0.009)
-0.053***
(0.016)
-0.014
(0.02)
-0.04
(0.036)
-0.014
(0.017)
-0.051
(0.032)
-0.019
(0.018)
-0.044
(0.035)
-0.01
(0.043)
-0.097
(0.065)
Tests of instruments
DWH F test, p-value
0.012
0.0009
0.338
0.146
0.403
0.119
F statistics, excluded
instruments 502.21
252.77
267.09
413.06
229.4
202.17
R2 0.512 0.510
0.584 0.578
0.474 0.476
0.232 0.23
0.274 0.273
0.205 0.199
2. Panel B
Changes in the share of
hours working in nonfarm
activities
-0.053
(0.034)
-0.224***
(0.08)
-0.018
(0.034)
-0.280***
(0.083)
-0.074
(0.058)
-0.166
(0.146)
-0.062
(0.059)
-0.236
(0.15)
-0.027
(0.063)
-0.230
(0.182)
-0.105
(0.113)
-0.389
(0.255)
Tests of instruments
DWH F test, p-value
0.021
0.0017
0.473
0.176
0.246
0.236
F statistics, excluded
instruments 361.86
206.32
186.93
319.07
192.99
155.16
R2 0.512 0.507
0.584 0.566
0.475 0.476
0.232 0.229
0.274 0.270
0.206 0.199
Number of observations 2801 2801
1649 1649
1152 1152 2365 2365
1593 1530
835 835
Notes: FD means first difference; Standard errors are robust through cluster option and in parentheses; Dependent variables are expressed in the log; All regional, household and communal variables are included in the models in each panel; All models differenced to remove unobserved fixed effects and estimated using instrument variables with IV-GMM
procedure as discussed in Section 5.3; ∗, ∗∗, ∗∗∗ indicates that the corresponding coefficients are significant at the 10%, 5%, and 1% levels, respectively. Full details of the
estimation are presented in Appendix 5.4-5.9 in the Appendices of the chapter.
151
5.5.4 The effect of nonfarm participation on agricultural inputs
The two previous sections explore the short-run impact when family members of farm
households engage in nonfarm activities. In the case of smallholder agriculture with
labour-intensive farming, labour movement or an increase in the household’s working
hours in nonfarm activities have negative impacts on agricultural production. However,
small farms are likely to adapt to the shortage of farm labour and hours by investing in
agricultural assets, and inputs, changing to less labour-intensive farming, spending cash
on other crops or labour-saving inputs (Hazel and Rahman, 2014). Therefore, in the
medium and long run, farm households can maintain or increase crop production. If
there is no evidence of relaxing liquidity constraints, farm households move away from
farming production (Taylor et al. 2003).
This section introduces two types of method that are similar to the tables in the
previous sections. Table 5.10 presents the empirical results of changes in the number
of individuals participating in nonfarm activities on agricultural expenditure. It only
examines statistically significant coefficients, and finds evidence of the reduction in
crop expenses in the north as a result of nonfarm participation. Moreover, expenditure
on fertilisers, which accounts for nearly 40 per cent of the total cost of production, also
decrease for the north sample in both OLS and 2SLS as a result of labour movement in
nonfarm activities. This finding is consistent with the reduction in rice output and farm
incomes of households in the north. There is no evidence of statistically significant
effects for nonfarm participation on crop inputs for households in the south.
Regarding the effect of nonfarm participation on livestock expenditures, the point
estimates are negative for the whole and the south samples in OLS and 2SLS
estimations. An additional household member engaged in nonfarm activities results in
the reduction of expenditures on livestock by 9.2 per cent for the whole sample, and
25.7 per cent for the south sample. Although the point estimates for the impact of
nonfarm participation on livestock expenses are negative and large in the south, they
are only statistically significant in 2SLS, which implies that the impacts on livestock
spending are large among households likely to respond to the availability of nonfarm
networks. In the case of households in the north, the effects on livestock expenses are
economically no different to zero. Northern households still keep or switch to livestock
sectors, instead of crop production.
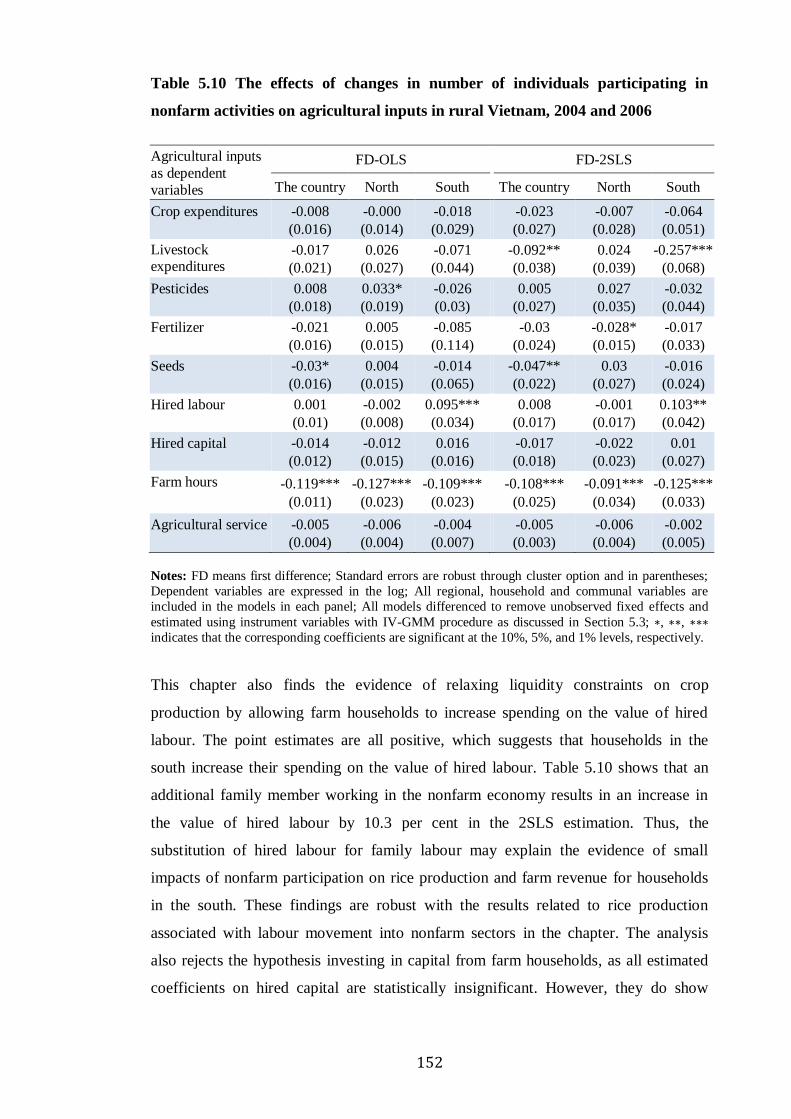
152
Table 5.10 The effects of changes in number of individuals participating in
nonfarm activities on agricultural inputs in rural Vietnam, 2004 and 2006
Agricultural inputs
as dependent
variables
FD-OLS FD-2SLS
The country North South The country North South
Crop expenditures -0.008
(0.016)
-0.000
(0.014)
-0.018
(0.029)
-0.023
(0.027)
-0.007
(0.028)
-0.064
(0.051)
Livestock expenditures
-0.017
(0.021)
0.026
(0.027)
-0.071
(0.044)
-0.092**
(0.038)
0.024
(0.039)
-0.257***
(0.068)
Pesticides 0.008
(0.018)
0.033*
(0.019)
-0.026
(0.03)
0.005
(0.027)
0.027
(0.035)
-0.032
(0.044)
Fertilizer -0.021
(0.016)
0.005
(0.015)
-0.085
(0.114)
-0.03
(0.024)
-0.028*
(0.015)
-0.017
(0.033)
Seeds -0.03*
(0.016)
0.004
(0.015)
-0.014
(0.065)
-0.047**
(0.022)
0.03
(0.027)
-0.016
(0.024)
Hired labour 0.001
(0.01)
-0.002
(0.008)
0.095***
(0.034)
0.008
(0.017)
-0.001
(0.017)
0.103**
(0.042)
Hired capital -0.014
(0.012)
-0.012
(0.015)
0.016
(0.016)
-0.017
(0.018)
-0.022
(0.023)
0.01
(0.027)
Farm hours -0.119***
(0.011)
-0.127***
(0.023)
-0.109***
(0.023)
-0.108***
(0.025)
-0.091***
(0.034)
-0.125***
(0.033)
Agricultural service -0.005
(0.004)
-0.006
(0.004)
-0.004
(0.007)
-0.005
(0.003)
-0.006
(0.004)
-0.002
(0.005)
Notes: FD means first difference; Standard errors are robust through cluster option and in parentheses;
Dependent variables are expressed in the log; All regional, household and communal variables are
included in the models in each panel; All models differenced to remove unobserved fixed effects and
estimated using instrument variables with IV-GMM procedure as discussed in Section 5.3; ∗, ∗∗, ∗∗∗
indicates that the corresponding coefficients are significant at the 10%, 5%, and 1% levels, respectively.
This chapter also finds the evidence of relaxing liquidity constraints on crop
production by allowing farm households to increase spending on the value of hired
labour. The point estimates are all positive, which suggests that households in the
south increase their spending on the value of hired labour. Table 5.10 shows that an
additional family member working in the nonfarm economy results in an increase in
the value of hired labour by 10.3 per cent in the 2SLS estimation. Thus, the
substitution of hired labour for family labour may explain the evidence of small
impacts of nonfarm participation on rice production and farm revenue for households
in the south. These findings are robust with the results related to rice production
associated with labour movement into nonfarm sectors in the chapter. The analysis
also rejects the hypothesis investing in capital from farm households, as all estimated
coefficients on hired capital are statistically insignificant. However, they do show

153
positive signs and an increasing trend, which can affect long-term production toward
less labour intensive farming or labour-saving methods.
In addition, the estimates in Table 5.10 shows that one additional household member
associated with nonfarm activities reduces the total number of farm households by
over 10 per cent for both OLS and 2SLS, on average. Nevertheless, this reduction does
not come at the expense of farm and non-rice farm revenue because the impact of
nonfarm participation on non-rice farm revenue is statistically insignificant. These
outcomes may arise while a labour surplus still exists in rural areas. Table 5.11 shows
a similar pattern of impact when nonfarm participation is measured by the share of
hours working on nonfarm activities.
Table 5.11 Changes in the share of hours working in nonfarm activities on
agricultural inputs, rural Vietnam, 2004 and 2006
Agricultural inputs as
dependent variables FD-OLS FD-2SLS
The country North South The country North South
Crop expenditure -0.069
(0.046)
-0.036
(0.057)
-0.104
(0.072)
-0.101
(0.119)
-0.094
(0.139)
-0.251
(0.197)
Livestock expenditure -0.238***
(0.06)
-0.112
(0.069)
-0.371***
(0.130)
-0.411**
(0.165)
0.117
(0.193)
-1.002***
(0.256)
Pesticides 0.026
(0.054)
0.112**
(0.05)
-0.068
(0.081)
0.024
(0.121)
0.131
(0.174)
-0.119
(0.174)
Fertiliser -0.085*
(0.049)
-0.044*
(0.055)
-0.048
(0.084)
-0.136
(0.11)
-0.114*
(0.058)
-0.049
(0.131)
Seeds -0.075
(0.047)
0.014
(0.055)
-0.039
(0.069)
-0.209**
(0.096)
0.142
(0.135)
-0.021
(0.023)
Hired labour 0.026
(0.029)
-0.005
(0.03)
0.104***
(0.029)
0.032
(0.077)
-0.003
(0.082)
0.409**
(0.167)
Hired capital -0.038
(0.037)
-0.042
(0.043)
0.037
(0.049)
-0.08
(0.079)
-0.109
(0.114)
0.044
(0.107)
Farm hours -0.791***
(0.042)
-0.897***
(0.071)
-0.688***
(0.072)
-0.473***
(0.1)
-0.447***
(0.152)
-0.471***
(0.126)
Agricultural services -0.009
(0.012)
-0.024
(0.017)
0.005
(0.014)
-0.02
(0.014)
-0.031
(0.021)
-0.008
(0.02)
Notes: FD means first difference; Standard errors are robust through cluster option and in parentheses;
Dependent variables are expressed in the log; All regional, household and communal variables are
included in the models in each panel; All models differenced to remove unobserved fixed effects and
estimated using instrument variables with IV-GMM procedure (as discussed in Section 5.3); ∗, ∗∗, ∗∗∗ indicates that the corresponding coefficients are significant at the 10%, 5%, and 1% levels, respectively.

154
5.5.5 The effect of nonfarm activities on rural household welfare
Most studies in Vietnam focus on the effect of nonfarm participation on poverty
reduction and household expenditure (Van de Walle and Cratty 2004; Hoang et al.
2014). They conclude that nonfarm participation contributes to poverty reduction and
an increase in household expenditure. However, no studies examine regional
differences. Although the focus of this section is not new to the literature, its purpose
is to verify previous findings, and contribute to the study of regional differences, and
thus providing further understanding of household behaviour in spending nonfarm
incomes on agricultural production.
Table 5.12 The effects of nonfarm participation on household welfare in rural
Vietnam, 2004 and 2006
Dependent variables:
Change in log of household’s total real expenditure
Explanatory variables The whole country North South
FD-OLS FD-2SLS FD-OLS FD-2SLS
FD-OLS FD-2SLS
1. Panel A
Change in number of
individuals in nonfarm
activities
0.038***
(0.006)
0.054***
(0.014)
0.045**
(0.008)
0.048***
(0.018)
0.03***
(0.008)
0.063***
(0.022)
Tests of instruments
DWH F test, p-value
0.127
0.824
0.055
F statistics, excluded
instruments 502.21
252.77
267.09
R2 0.201 0.199
0.230 0.23
0.180 0.172
2. Panel B
Changes in the share of
hours working in
nonfarm activities
0.089***
(0.02)
0.252***
(0.063)
0.118***
(0.027)
0.249***
(0.092)
0.056***
(0.027)
0.262***
(0.091)
Tests of instruments
DWH F test, p-value
0.004
0.109
0.0092
F statistics, excluded
instruments 361.86
206.32
186.93
R2 0.197 0.181
0.225 0.219
0.176 0.148
Number of observations 2801 2801 1649 1649 1152 1152
Notes: FD means first difference; Standard errors are robust through cluster option and in parentheses;
Dependent variables are expressed in the log; All regional, household and communal variables are
included in the models in each panel; All models differenced to remove unobserved fixed effects and
estimated using instrument variables with IV-GMM procedure as discussed in Section 5.3; ∗, ∗∗, ∗∗∗ indicates that the corresponding coefficients are significant at the 10%, 5%, and 1% levels, respectively.
See the appendix for full estimation.

155
As can be seen in Table 5.12, both OLS and 2SLS estimations find statistically
significant effects of nonfarm participation on household expenditure in all regions.
Using 2SLS method, this study finds that an additional family member participating in
nonfarm activities increases household expenditure in the north and south by 4.8 per cent
and 6.3 per cent, respectively. A similar pattern can be seen by using changes in the
share of working hours in nonfarm activities. Households in the north sample appear to
spend nonfarm incomes on consumption smoothing, whereas, in the south sample,
nonfarm incomes not only smooth consumption, but also play a role in relaxing liquidity
constraints on agricultural inputs, particularly the value of hired labour and capital.
These findings emphasise rural diversification as an important strategy in improving
household welfare and boosting agricultural production by absorbing any labour surplus
and moving to less labour-intensive farming. However, this only occurs in regions that
have fewer constraints on small and highly fragmented landholdings.
One question that has not been answered yet is why farmers in the north behave
differently to those in the south. In this chapter, I argue that the differences in land
constraints between two regions may explain the different effects of nonfarm
participation on agricultural production. Otsuka et al. (2013) find that an increase in
real wages, along with the absorption of labour into the nonfarm economy, has resulted
in the substitution of labour by machines in agriculture. However, this process is less
successful in a country that is constrained by small and fragmented landholdings.
Household farm sizes in the north are, on average, smaller and more fragmented than
in the south. Interestingly, Wiggins and Keats (2014) show that real wages in rural
Vietnam increased by 55.37 per cent in the period 2005-2012. The increase in costs of
hired labour in light of small and fragmented landholdings pushed rice farmers in the
north to abandon or reduce rice production, or switch to other crops that require less
labour-intensive farming (e.g. starchy crops, vegetables and annual industrial crops).
Moreover, increasing costs of rice production consequently squeeze farm profits. In
contrast, households in the south face fewer constraints on land so they are able to
spend nonfarm income on hired labour, and thus apply less labour-intensive farming.
5.5.6 Further test of the consistency of empirical results using the matching
technique
In order to validate the previous empirical results, this chapter also adopts a matching
approach taken from labour market literature. As introduced in Section 5.3, the results

156
of this approach are obtained from statistical twin pairs of matched farm and nonfarm
households. By applying the procedures outlined in Section 5.3, the common support
includes 2,047 households out of a total of 2,801. Note that the focus is restricted to
changes in agricultural production including rice production, farm revenue and crop
expenditures, which is consistent with dependent variables in the previous sections.
Table 5.13 The effects of nonfarm participation on rice production, farm revenue
and household expenditures using the matching method, 2004 and 2006
Dependent variables Matching valued at means
The country North South
Paddy output -0.038*
(0.021)
-0.051*
(0.027)
-0.084
(0.059)
Total agricultural revenue -0.113***
(0.031)
-0.111***
(0.034)
-0.095
(0.038)
Total non-rice agricultural
revenue
-0.044
(0.022)
-0.093*
(0.049)
-0.006
(0.089)
Total real expenditure 0.097***
(0.02)
0.075***
(0.024)
0.126***
(0.035)
Notes: Standard errors are in parentheses; ∗, ∗∗, ∗∗∗ indicate that the corresponding coefficients are
significant at the 10%, 5%, and 1% levels, respectively.
Tables 5.13 and 5.14 show the differences of agricultural outcomes valued at the
means using the matching method. The empirical differences shown in these tables
validate the findings of the OLS and 2SLS estimates. Thus, the results confirm the
consistency about the sign and statistical significance of interested variables. The
matching method finds statistically significant evidence of the effect of nonfarm
participation on rice production. However, the significant impact appears to occur in
the north of Vietnam (this is similar to the previous analysis). A similar pattern is also
seen in the case of farm, non-rice agricultural revenue, and total real household
expenditures. In the case of crop expenditures (presented in Table 5.14), matching
results also find evidence of labour substitution and investments in less-labour
intensive farming for rural households in the South, which would suggest that nonfarm
participation is associated with higher expenditures on hired labour by 20.8 per cent
and on capital by 7.5 per cent.

157
Table 5.14 The effects of nonfarm participation on agricultural inputs using
matching method, 2004 and 2006
Dependent variables:
Agricultural inputs
Matching valued at means
The country North South
Crop expenditure -0.055
(0.037)
-0.116***
(0.04)
0.029
(0.077)
Livestock expenditure 0.064
(0.055)
0.036
(0.054)
0.079
(0.124)
Pesticides 0.073
(0.048)
0.075
(0.054)
0.076
(0.095)
Fertiliser -0.071*
(0.04)
-0.115***
(0.044)
-0.014
(0.081)
Seeds -0.063*
(0.036)
-0.06
(0.044)
-0.09
(0.065)
Value of hired labour 0.053*
(0.028)
-0.045*
(0.023)
0.208***
(0.068)
Value of hired capital -0.011
(0.035)
-0.054
(0.041)
0.075*
(0.065)
Farm hours -0.089**
(0.04)
-0.147*
(0.077)
-0.125*
(0.071)
Agricultural services 0.002
(0.008)
0.012*
(0.007)
-0.02
(0.018)
Notes: Standard errors are in parentheses; ∗, ∗∗, ∗∗∗ indicate that the corresponding coefficients are
significant at the 10%, 5%, and 1% levels, respectively.
5.6 Conclusions
The government currently gives priority to boosting the structural transformation,
where labour and resources are reallocated from the agricultural sector to other sectors,
where they can be used more productively and raise national productivity (Warr 2009).
In addition, the government implement policies to ensure national food security,
particularly rice self-sufficiency. However, these objectives appear to be in conflict.
The movement of resources out of agriculture may reduce agricultural production and
threaten sustained food security. In contrast, maintaining current rice self-sufficiency
policy may slow down the process of structural changes and affect household welfare.
Given that there are few studies focusing on the linkages between farm and nonfarm
sectors, and the complexity of the relationship between nonfarm participation and
agricultural production, this study attempts to investigate the effect of labour
movement into nonfarm activities and part-time farming on household production
choices in rural Vietnam. By using a panel sample of farm households in VHLSS 2004

158
and 2006 surveys, the study offers a systematic approach to studying nonfarm impacts
on household behaviour in agricultural production. It applies different methods,
including OLS, 2SLS, and uses the matching technique to verify the consistency of the
empirical results. The 2SLS estimation method uses nonfarm networks as instruments
to identify the model.
There are three equations used in the estimations. The first equation investigates the
impact of nonfarm participation on rice production (the most important annual crop in
Vietnam). Second, the model of agricultural revenue and non-rice agricultural revenue
provides evidence of a nonfarm impact on aggregate production. Third, the crop expense
model looks for evidence of the relaxation of liquidity constraints on farm production.
Finally, the effect of nonfarm participation on household expenditure is also examined in
order to further understand household behaviour in spending nonfarm income.
The analysis in this chapter indicates that in rural Vietnam, nonfarm participation have
higher returns than farming. It also contributes to improving household welfare. The
analysis finds evidence that labour movement to nonfarm sectors reduces rice
production. Moreover, aggregate agricultural production also declines significantly,
and there are negative effects of labour movement into nonfarm activities on farm
revenue. These findings suggest that, regardless of the level of agricultural market
integration of farm households, nonfarm employment is more of a substitute than a
complement to rice production. However, these conclusions are limited to the north of
Vietnam. The chapter finds no evidence of the effects of nonfarm participation on non-
rice agricultural revenue and livestock expenditure. That is, households that participate
in nonfarm sectors in the north have readjusted their production structure by investing
in livestock sectors and alternate crops that require less labour. The government has
designed policies to encourage farmers to maintain and increase rice production.
However, rice farmers are struggling to survive.
Similarly, labour movement into nonfarm activities has induced rice farmers in the
south to maintain rice production by hiring more labour to substitute for family labour
during the periods of peak labour demand, and by investing in more capital to facilitate
less labour-intensive farming. This study finds that nonfarm incomes partially
compensate for the labour reallocation effect by enabling more spending on hired
labour and capital. This finding provides evidence that nonfarm incomes relax the

159
liquidity constraints on expanding crop production through purchased inputs, at least
in the short run.
While the decline in agricultural revenue in the north suggests some level of substitution
between farm and nonfarm income generation strategies, the stability in rice production
at the national level, despite rapid rural structural change, brings welcome news to policy
makers and their concern for food production in rural Vietnam over the decades.
However, agriculture in the north is losing its comparative advantage as farm households
reduce their investments in agriculture. The increasing trend in the north of abandoning
paddy fields has raised concerns about agricultural production in the region. The
findings of this study indicate that Vietnam should change its approach toward food
security, particularly its rice self-sufficiency policy: food self-sufficiency does not imply
food security (Warr 2014). Rice farmers with small and fragmented landholdings are
struggling to survive and have to diversify. The abandonment of paddy fields in the
north has caused the waste of scare resources because the current rice policy has blocked
paddy land for conversion. As a result, the opportunity cost of rice production has
increased in recent years.
Moreover, the difference in the empirical results between regions show that small and
highly fragmented landholdings have become one of the largest constraints for
agricultural development in Vietnam. World Bank (2006) shows that this problem is
particularly severe in the north, where the average rural farm households has 6.5 plot
of land, compared to the south, with an average close to 3.4 plots per household. If
land constraints cannot be solved, agricultural production in the south may lose its
comparative advantage in the future in light of increasing nonfarm employment and
real rural wages. Warr (2014) shows that the most effective way to deal with food
insecurity is to raise agricultural productivity. In this way, the conflict faced in
carrying out the dual task of facilitating food security, and the promotion of economic
structural transformation can be resolved by improving agricultural productivity through
mechanization or less labour-intensive farming, this only be achieved by larger and less
fragmented landholdings.
In Chapter 2, it was shown that land reforms are necessary for labour savings
technologies and less labour-intensive farming. Constraints on land market, small
landholding and land fragmentation are hindering farm households from investing
more capital in farming. Thus, institutional reforms of land markets are important

160
because they break the vicious circle that traps small farmers when they apply more
capital and mechanisation (Otsuka 2013). Rice production will be significantly
reduced in the long run if progress in land reforms is slow. Therefore, land reform
directed towards land consolidation is further investigated to verify these arguments.
In addition to land reforms, credit reforms and the encouragement of informal credit
institutions could support farm households by relaxing their liquidity constraints and
thus promoting investment in farm production in response to increasing labour
movement out of farming. At the same time, the development of insurance markets in
rural areas is also important in reducing risks in farming and encouraging investment
in agriculture. If these reforms are successful, nonfarm incomes can be invested in
expanding nonfarm activities and facilitating sustainable rural transformation. These
topics will be areas for future research. This chapter offers some further policy
implications. Given the role of the nonfarm economy in improving household welfare
and having little effect on rice production, government should stimulate the
development of the rural nonfarm economy.
While the present estimations indicate that nonfarm participation represents a move
away from agriculture, this argument should be taken with care. A better picture of the
situation requires further research in order to understand the behaviour of the remaining
members in a family related to farm production (e.g. incentives to work less or more).
Also, further research is needed to find the regional specific attributes that affect the
impact. For example, the expansion of remittances from non-household members may
conceivably crowd out existing rural nonfarm incomes from current household
members, and thus reduce incentives to work. Notably, Becker (1974) and Barro (1974)
argue that an increase in public transfers could also crowd out existing private transfers.
All these arguments may contribute to the reduction of farm labour supply and nonfarm
incomes. Although the coefficients of remittances and pubic transfers on farm labour
supply are statistically insignificant in this study, the crowding out effects should be
further investigated in future research. In addition, in the future, the long-term and
permanent migration section, particularly the migration history needed to capture
information on those non-household members who send remittances to local
communities, should be surveyed in household living standard datasets in Vietnam. In
this case, it is possible to evaluate the impact of migration and remittances on
agricultural production simultaneously in the framework of NELM model.
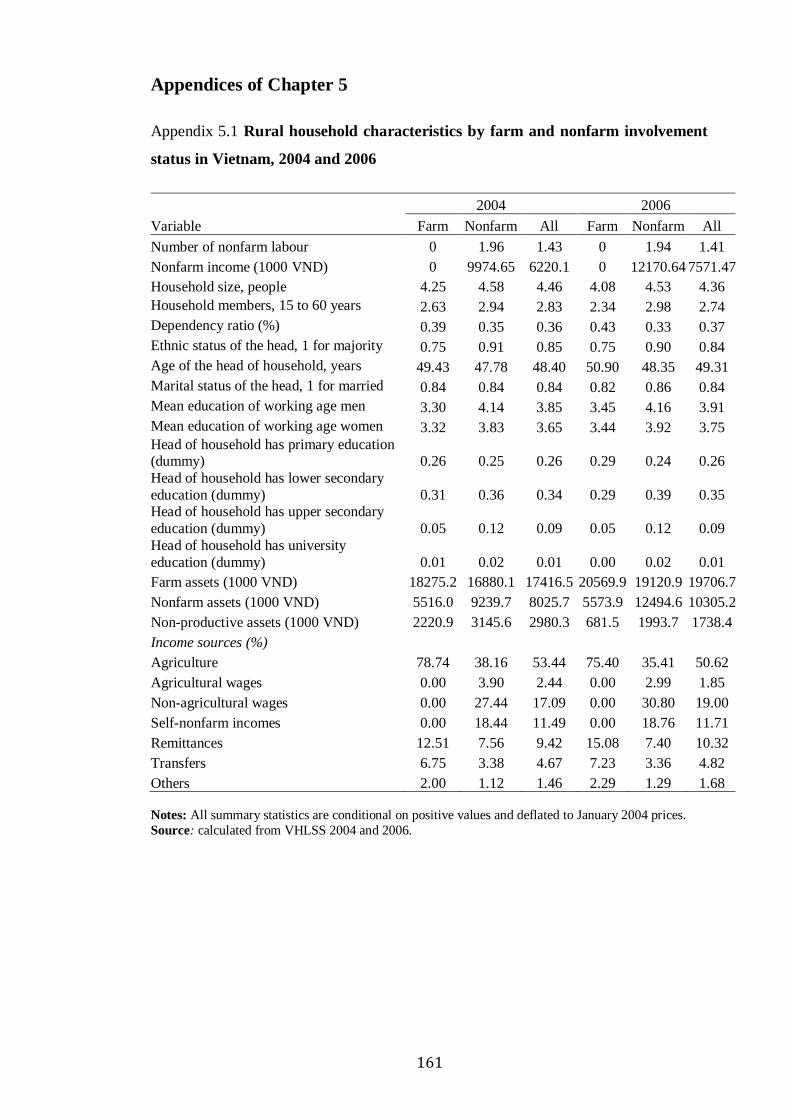
161
Appendices of Chapter 5
Appendix 5.1 Rural household characteristics by farm and nonfarm involvement
status in Vietnam, 2004 and 2006
Variable
2004 2006
Farm Nonfarm All Farm Nonfarm All
Number of nonfarm labour 0 1.96 1.43 0 1.94 1.41
Nonfarm income (1000 VND) 0 9974.65 6220.1 0 12170.64 7571.47
Household size, people 4.25 4.58 4.46 4.08 4.53 4.36
Household members, 15 to 60 years 2.63 2.94 2.83 2.34 2.98 2.74
Dependency ratio (%) 0.39 0.35 0.36 0.43 0.33 0.37
Ethnic status of the head, 1 for majority 0.75 0.91 0.85 0.75 0.90 0.84
Age of the head of household, years 49.43 47.78 48.40 50.90 48.35 49.31
Marital status of the head, 1 for married 0.84 0.84 0.84 0.82 0.86 0.84
Mean education of working age men 3.30 4.14 3.85 3.45 4.16 3.91
Mean education of working age women 3.32 3.83 3.65 3.44 3.92 3.75
Head of household has primary education (dummy) 0.26 0.25 0.26 0.29 0.24 0.26
Head of household has lower secondary
education (dummy) 0.31 0.36 0.34 0.29 0.39 0.35 Head of household has upper secondary
education (dummy) 0.05 0.12 0.09 0.05 0.12 0.09
Head of household has university
education (dummy) 0.01 0.02 0.01 0.00 0.02 0.01
Farm assets (1000 VND) 18275.2 16880.1 17416.5 20569.9 19120.9 19706.7
Nonfarm assets (1000 VND) 5516.0 9239.7 8025.7 5573.9 12494.6 10305.2
Non-productive assets (1000 VND) 2220.9 3145.6 2980.3 681.5 1993.7 1738.4
Income sources (%)
Agriculture 78.74 38.16 53.44 75.40 35.41 50.62
Agricultural wages 0.00 3.90 2.44 0.00 2.99 1.85
Non-agricultural wages 0.00 27.44 17.09 0.00 30.80 19.00
Self-nonfarm incomes 0.00 18.44 11.49 0.00 18.76 11.71
Remittances 12.51 7.56 9.42 15.08 7.40 10.32
Transfers 6.75 3.38 4.67 7.23 3.36 4.82
Others 2.00 1.12 1.46 2.29 1.29 1.68
Notes: All summary statistics are conditional on positive values and deflated to January 2004 prices. Source: calculated from VHLSS 2004 and 2006.

162
Appendix 5.2 Summary statistics from panel sample
Variables Mean Std. Dev. Min Max
Paddy (kg) 3561.94 6793 30 169128
Annual industrial products (kg) 181.43 344.82 1 6767
Starchy products (kg) 2051.16 6479.39 3 125000
Vegetables (kg) 507.94 1313.12 3 25200
Farm revenue (1000 VND) 10272.99 17405.56 16.59 532808.3
Seeds (1000 VND) 367.35 619.48 1.61 12168.2
Fertiliser (1000 VND) 1683.48 2957.61 4.03 58201.1
Pesticides (1000 VND) 469.72 1235.7 1.84 22322.1
Hired labour (1000 VND) 1058.1 3569.9 8.05 119792.6
Hired capital (1000 VND) 720.9 1479.03 9.66 42404.5
Annual land (m2) 5129.83 7862.37 20 145800
Number of land plots titled 2.69 4.6 0 166
Farm hours (hours) 2437.1 1793.83 5 17420
Unit values of rice (1000 VND) 2.48 0.235 1.35 3.5
Household members, from 15 to 60 (years old) 2.78 1.3 0 10
Dependency ratio 0.37 0.24 0 1
Mean education of working age men (years) 3.88 2.32 0 16
Mean education of working age women (years) 3.7 2.37 0 16
Remittances (1000 VND) 2546.21 8354.1 6.45 241984.3
Transfers (1000 VND) 4214.3 5271.03 2.42 74890.3
Disasters in commune 1.34 1.27 0 7
Farm assets (1000 VND) 18186.5 58456.95 8.05 1862755
Nonfarm assets (1000 VND) 8862.2 40099.08 18.44 921744.1
Access to asphalt road 0.62 0.48 0 1
Having markets in commune 0.58 0.49 0 1
Land area irrigated in commune (%) 61.27 31.16 0.5 100
Number of household members who were born
or had lived in urban areas 0.042 0.29 0 7
Number of people in commune participating in nonfarm activities
244.22 552.37 0 8414
Notes: All values and deflated to January 2004 prices. Hired capital includes land rental, rental of
machinery, equipment, means of transport, and cattle for ploughing; 1 USD=15,965 VND (2006)
Source: calculated from VHLSS 2004 and 2006.

163
Appendix 5.3 First stage regression
Change in number of individuals in nonfarm
activities
Change in the share of hours working in nonfarm
activities
(1) (2)
(3) (4)
Lagged nonfarm network at commune level, 2004
0.291*** (0.006)
0.291*** (0.006)
0.062*** (0.002)
0.062*** (0.002)
Agricultural variables (differenced)
Logarithm, annual land 0.02
(0.042)
0.007
(0.037)
-0.001
(0.015)
-0.005
(0.012)
Number of land plots titled 0.001
(0.002)
0.000
(0.002)
0.002
(0.001)
0.002
(0.001)
Logarithm, seed costs -0.026 (0.022)
-0.002 (0.009)
Logarithm, fertiliser costs -0.013
(0.024)
-0.009
(0.01)
Logarithm, pesticide costs 0.026
(0.021) 0.013
(0.009)
Logarithm, value of hired labour -0.004
(0.033)
-0.011
(0.011)
Logarithm, value of hired capital -0.014 0.028)
-0.003 (0.009)
Logarithm, farm hours -0.154***
(0.018)
-0.155***
(0.019)
-0.144***
(0.008)
-0.143***
(0.008)
Household characteristics (differenced)
Household members, from 15 to 60 years
old
0.347***
(0.032)
0.345***
(0.032)
0.036***
(0.008)
0.035***
(0.008)
Dependency ratio 0.669*** (0.139)
0.662*** (0.137)
0.018 (0.035)
0.021*** (0.036)
Mean education of working age men -0.002
(0.017)
-0.002
(0.017)
0.003
(0.006)
0.003
(0.006)
Mean education of working age women -0.009 (0.015)
-0.01 (0.015)
0.000 (0.005)
-0.000 (0.005)
Logarithm, remittances -0.011*
(0.006)
-0.011*
(0.006)
-0.006*
(0.003)
-0.006*
(0.003)
Logarithm, transfers 0.025 (0.05)
0.026 (0.05)
-0.015 (0.017)
-0.012 (0.016)
Disasters in commune 0.004
(0.008)
0.003
(0.008)
0.000
(0.003)
0.002
(0.004)
Logarithm, farm assets 0.013
(0.018) 0.013
(0.018) -0.003 (0.005)
-0.002 (0.006)
Logarithm, nonfarm assets 0.01
(0.03)
0.011
(0.03)
0.004
(0.028)
0.004
(0.01)
Commune characteristics Included Included Included Included
Regional dummies Yes Yes
Yes Yes
Number of observations 2801 2801
2801 2801
R2 0.454 0.452
0.292 0.288
F statistics, instruments 1127.08 1200.05
368.01 328.44
Notes: Columns (1) and (3) refer to rice production, agricultural income and total real household
expenditure; Columns (2) and (4) refer to crop expenses; Standard errors are robust through cluster
option; ∗, ∗∗, ∗∗∗ indicates that the corresponding coefficients are significant at the 10%, 5%, and 1%
levels, respectively.
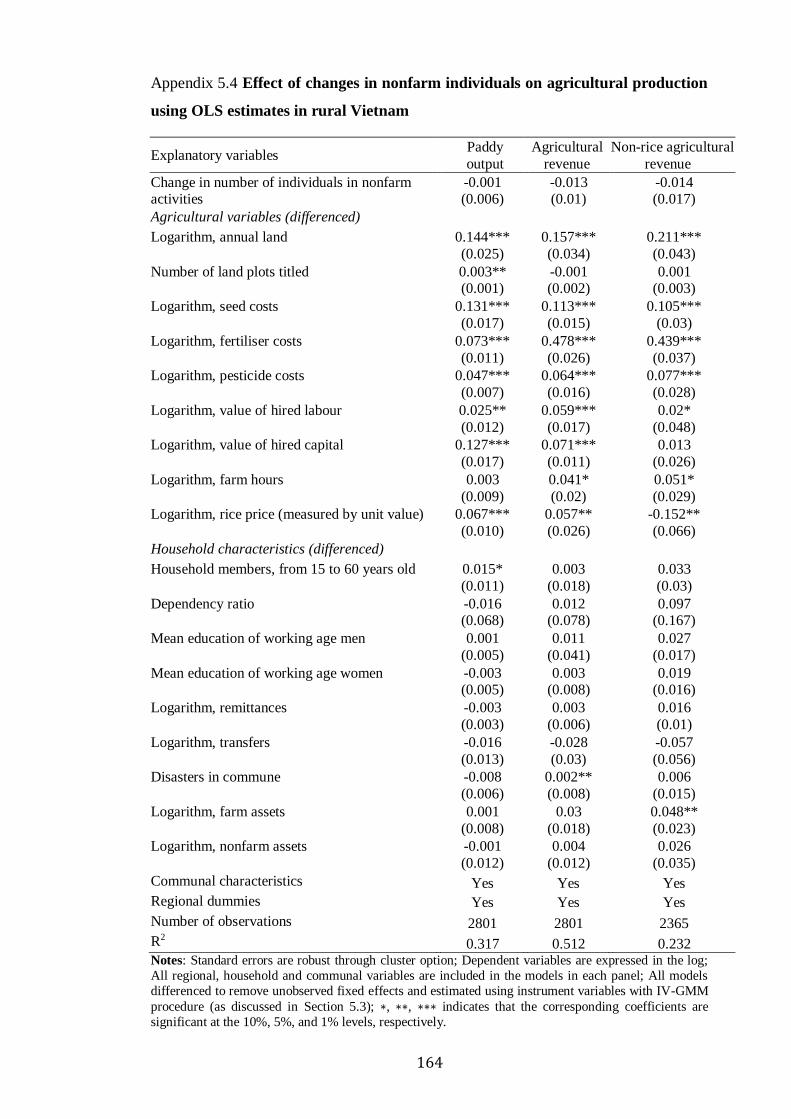
164
Appendix 5.4 Effect of changes in nonfarm individuals on agricultural production
using OLS estimates in rural Vietnam
Explanatory variables Paddy
output
Agricultural
revenue
Non-rice agricultural
revenue
Change in number of individuals in nonfarm activities
-0.001 (0.006)
-0.013 (0.01)
-0.014 (0.017)
Agricultural variables (differenced)
Logarithm, annual land
0.144***
(0.025)
0.157***
(0.034)
0.211***
(0.043)
Number of land plots titled
0.003** (0.001)
-0.001 (0.002)
0.001 (0.003)
Logarithm, seed costs
0.131***
(0.017)
0.113***
(0.015)
0.105***
(0.03)
Logarithm, fertiliser costs
0.073***
(0.011)
0.478***
(0.026)
0.439***
(0.037)
Logarithm, pesticide costs
0.047***
(0.007)
0.064***
(0.016)
0.077***
(0.028)
Logarithm, value of hired labour
0.025**
(0.012)
0.059***
(0.017)
0.02*
(0.048)
Logarithm, value of hired capital
0.127***
(0.017)
0.071***
(0.011)
0.013
(0.026)
Logarithm, farm hours
0.003
(0.009)
0.041*
(0.02)
0.051*
(0.029)
Logarithm, rice price (measured by unit value)
0.067***
(0.010)
0.057**
(0.026)
-0.152**
(0.066)
Household characteristics (differenced)
Household members, from 15 to 60 years old
0.015*
(0.011)
0.003
(0.018)
0.033
(0.03)
Dependency ratio
-0.016 (0.068)
0.012 (0.078)
0.097 (0.167)
Mean education of working age men
0.001
(0.005)
0.011
(0.041)
0.027
(0.017)
Mean education of working age women
-0.003 (0.005)
0.003 (0.008)
0.019 (0.016)
Logarithm, remittances
-0.003
(0.003)
0.003
(0.006)
0.016
(0.01)
Logarithm, transfers
-0.016
(0.013)
-0.028
(0.03)
-0.057
(0.056)
Disasters in commune
-0.008
(0.006)
0.002**
(0.008)
0.006
(0.015)
Logarithm, farm assets
0.001
(0.008)
0.03
(0.018)
0.048**
(0.023)
Logarithm, nonfarm assets
-0.001
(0.012)
0.004
(0.012)
0.026
(0.035)
Communal characteristics Yes Yes Yes
Regional dummies Yes Yes Yes
Number of observations 2801 2801 2365
R2 0.317 0.512 0.232 Notes: Standard errors are robust through cluster option; Dependent variables are expressed in the log;
All regional, household and communal variables are included in the models in each panel; All models
differenced to remove unobserved fixed effects and estimated using instrument variables with IV-GMM
procedure (as discussed in Section 5.3); ∗, ∗∗, ∗∗∗ indicates that the corresponding coefficients are
significant at the 10%, 5%, and 1% levels, respectively.

165
Appendix 5.5 Effect of changes in nonfarm individuals on agricultural production
using OLS estimates: northern Vietnam
Explanatory variables Paddy
output
Agricultural
revenue
Non-rice
agricultural revenue
Change in number of individuals in nonfarm activities
-0.004 (0.007)
-0.009 (0.009)
-0.019 (0.018)
Agricultural variables (differenced)
Logarithm, annual land
0.158*** (0.031)
0.172*** (0.029)
0.202*** (0.04)
Number of land plots titled
0.005**
(0.002)
0.002
(0.002)
0.006***
(0.002)
Logarithm, seed costs
0.111*** (0.015)
0.161*** (0.022)
0.206*** (0.035)
Logarithm, fertilizer costs
0.088***
(0.013)
0.427***
(0.03)
0.413***
(0.043)
Logarithm, pesticide costs
0.047*** (0.013)
0.037*** (0.012)
0.081*** (0.026)
Logarithm, value of hired labour
0.03*
(0.015)
0.054***
(0.02)
0.031
(0.058)
Logarithm, value of hired capital
0.121***
(0.019)
0.069***
(0.009)
0.004
(0.035)
Logarithm, farm hours
-0.002
(0.013)
0.029
(0.018)
0.022
(0.03)
Logarithm, rice price (measured by unit value)
0.064***
(0.013)
0.038
(0.034)
-0.262***
(0.058)
Household characteristics (differenced)
Household members, from 15 to 60 years old
0.034**
(0.016)
0.024**
(0.011)
0.08***
(0.026)
Dependency ratio
0.069 (0.096)
-0.051 (0.082)
0.246 (0.184)
Mean education of working age men
-0.009
(0.008)
-0.01
(0.009)
0.001
(0.02)
Mean education of working age women
-0.015** (0.007)
-0.011 (0.008)
0.001 (0.019)
Logarithm, remittances
-0.003
(0.004)
-0.000
(0.003)
0.005
(0.008)
Logarithm, transfers
-0.024 (0.017)
-0.02 (0.034)
-0.08 (0.067)
Disasters in commune
-0.009
(0.007)
0.011**
(0.007)
0.004*
(0.015)
Logarithm, farm assets
0.007 (0.01)
0.043*** (0.013)
0.091*** (0.026)
Logarithm, nonfarm assets
-0.022
(0.016)
0.009
(0.01)
0.038*
(0.022)
Communal characteristics Yes Yes Yes
Regional dummies Yes Yes Yes
Number of observations 1649 1649 1593
R2 0.330 0.584 0.274 Notes: Standard errors are robust through cluster option; Dependent variables are expressed in the log;
All regional, household and communal variables are included in the models in each panel; All models
differenced to remove unobserved fixed effects and estimated using instrument variables with IV-GMM
procedure (as discussed in Section 5.3); ∗, ∗∗, ∗∗∗ indicates that the corresponding coefficients are significant at the 10%, 5%, and 1% levels, respectively.

166
Appendix 5.6 Effect of changes in nonfarm individuals on agricultural production
using OLS estimates: southern Vietnam
Explanatory variables Paddy
output
Agricultural
revenue
Non-rice
agricultural revenue
Change in number of individuals in nonfarm activities
-0.007 (0.014)
-0.014 (0.02)
-0.01 (0.043)
Agricultural variables (differenced)
Logarithm, annual land
0.129*** (0.034)
0.133* (0.07)
0.210** (0.093)
Number of land plots titled
0.001***
(0.000)
-0.004**
(0.001)
-0.005*
(0.002)
Logarithm, seed costs
0.153*** (0.036)
0.063* (0.033)
-0.058 (0.059)
Logarithm, fertiliser costs
0.08***
(0.022)
0.516***
(0.039)
0.475***
(0.071)
Logarithm, pesticide costs
0.067*** (0.013)
0.084*** (0.027)
0.058 (0.044)
Logarithm, value of hired labour
0.021*
(0.022)
0.054**
(0.025)
0.01
(0.053)
Logarithm, value of hired capital
0.113***
(0.024)
0.086***
(0.019)
0.034
(0.048)
Logarithm, farm hours
0.009
(0.013)
0.057*
(0.031)
0.097*
(0.05)
Logarithm, rice price (measured by unit value)
0.072***
(0.026)
0.077
(0.059)
0.015
(0.192)
Household characteristics (differenced)
Household members, from 15 to 60 years old
-0.009**
(0.012)
-0.024
(0.041)
-0.039
(0.073)
Dependency ratio
-0.081 (0.081)
0.093 (0.22)
-0.157 (0.347)
Mean education of working age men
0.013*
(0.007)
0.04*
(0.022)
0.071**
(0.034)
Mean education of working age women
0.011 (0.008)
0.023** (0.016)
0.051* (0.027)
Logarithm, remittances
-0.008
(0.007)
0.008
(0.012)
0.025
(0.022)
Logarithm, transfers
-0.008 (0.022)
-0.031 (0.088)
-0.04 (0.131)
Disasters in commune
0.000
(0.008)
-0.01
(0.014)
-0.004
(0.022)
Logarithm, farm assets
-0.017 (0.013)
0.015 (0.031)
0.002 (0.039)
Logarithm, nonfarm assets
0.035
(0.021)
-0.006
(0.034)
-0.004
(0.095)
Communal characteristics Yes Yes Yes
Regional dummies Yes Yes Yes
Number of observations 1152 1152 835
R2 0.321 0.474 0.206 Notes: Standard errors are robust through cluster option; Dependent variables are expressed in the log;
All regional, household and communal variables are included in the models in each panel; All models
differenced to remove unobserved fixed effects and estimated using instrument variables with IV-GMM
procedure (as discussed in Section 5.3); ∗, ∗∗, ∗∗∗ indicates that the corresponding coefficients are significant at the 10%, 5%, and 1% levels, respectively.

167
Appendix 5.7 Effect of changes in nonfarm individuals on agricultural production
using 2SLS estimates: rural Vietnam
Explanatory variables Paddy
output
Agricultural
revenue
Non-rice
agricultural revenue
Change in number of individuals in nonfarm activities
-0.027** (0.011)
-0.048*** (0.017)
-0.051 (0.032)
Agricultural variables (differenced)
Logarithm, annual land
0.145***
(0.019)
0.157**
(0.026)
0.21***
(0.039)
Number of land plots titled
0.003* (0.002)
-0.000 (0.002)
0.002 (0.003)
Logarithm, seed costs
0.128***
(0.015)
0.111***
(0.018)
0.103***
(0.032)
Logarithm, fertiliser costs
0.072*** (0.012)
0.479*** (0.028)
0.443*** (0.038)
Logarithm, pesticide costs
0.049***
(0.01)
0.065***
(0.015)
0.077***
(0.026)
Logarithm, value of hired labour
0.026* (0.014)
0.059*** (0.016)
0.02 (0.04)
Logarithm, value of hired capital
0.125***
(0.014)
0.07***
(0.013)
0.014
(0.032)
Logarithm, farm hours
-0.003 (0.01)
0.031* (0.018)
0.041 (0.031)
Logarithm, rice price (measured by unit value)
0.065***
(0.010)
0.062
(0.032)
-0.146
(0.095)
Household characteristics (differenced)
Household members, from 15 to 60 years old
0.029***
(0.011)
0.022
(0.02)
0.052
(0.032)
Dependency ratio
0.038
(0.053)
0.061
(0.079)
0.158
(0.152)
Mean education of working age men
0.001
(0.006)
0.012
(0.009)
0.028
(0.018)
Mean education of working age women
-0.004
(0.005)
0.003
(0.008)
0.018
(0.018)
Logarithm, remittances
-0.004
(0.003)
0.003
(0.005)
0.016
(0.012)
Logarithm, transfers
-0.014
(0.014)
-0.024
(0.039)
-0.053
(0.068)
Disasters in commune
-0.009*
(0.005)
0.001
(0.007)
0.005
(0.013)
Logarithm, farm assets
0.002 (0.009)
0.03 (0.018)
0.046* (0.028)
Logarithm, nonfarm assets
-0.000
(0.012)
0.007
(0.012)
0.027
(0.042)
Communal characteristics Yes Yes Yes
Regional dummies Yes Yes Yes
Number of observations 2801 2801 2365
R2 0.313 0.510 0.23 Notes: Standard errors are robust through cluster option; Dependent variables are expressed in the log;
All regional, household and communal variables are included in the models in each panel; All models
differenced to remove unobserved fixed effects and estimated using instrument variables with IV-GMM
procedure (as discussed in Section 5.3); ∗, ∗∗, ∗∗∗ indicates that the corresponding coefficients are
significant at the 10%, 5%, and 1% levels, respectively.

168
Appendix 5.8 Effect of changes in nonfarm individuals on agricultural production
using 2SLS estimates: northern Vietnam
Explanatory variables Paddy
output
Agricultural
revenue
Non-rice agricultural
revenue
Change in number of individuals in nonfarm activities
-0.031** (0.014)
-0.053*** (0.016)
-0.044 (0.035)
Agricultural variables (differenced)
Logarithm, annual land
0.159*** (0.023)
0.173*** (0.025)
0.202*** (0.041)
Number of land plots titled
0.005**
(0.002)
0.003
(0.002)
0.007**
(0.003)
Logarithm, seed costs
0.111*** (0.016)
0.162*** (0.017)
0.208*** (0.036)
Logarithm, fertiliser costs
0.088***
(0.017)
0.427***
(0.029)
0.413***
(0.043)
Logarithm, pesticide costs
0.049***
(0.013)
0.04***
(0.013)
0.082***
(0.027)
Logarithm, value of hired labour
0.029
(0.022)
0.054**
(0.021)
0.029
(0.056)
Logarithm, value of hired capital
0.119***
(0.016)
0.067***
(0.013)
0.004
(0.033)
Logarithm, farm hours
-0.011
(0.013)
0.019
(0.017)
0.016
(0.033)
Logarithm, rice price (measured by unit value)
0.062***
(0.011)
0.042
(0.034)
-0.261***
(0.090)
Household characteristics (differenced)
Household members, from 15 to 60 years old
0.05***
(0.014)
0.045***
(0.015)
0.09***
(0.031)
Dependency ratio
0.114 (0.074)
0.005 (0.08)
0.276 (0.17)
Mean education of working age men
-0.009
(0.008)
-0.01
(0.009)
0.001
(0.018)
Mean education of working age women
-0.016** (0.007)
-0.012* (0.008)
0.000 (0.017)
Logarithm, remittances
0.002
(0.005)
-0.001
(0.005)
0.005
(0.011)
Logarithm, transfers
-0.019
(0.019)
-0.015
(0.03)
-0.078
(0.06)
Disasters in commune
-0.011
(0.007)
0.009
(0.08)
0.003
(0.016)
Logarithm, farm assets
0.006
(0.013)
0.041***
(0.014)
0.089***
(0.032)
Logarithm, nonfarm assets
-0.023
(0.014)
0.01
(0.011)
0.039
(0.03)
Communal characteristics Yes Yes Yes
Regional dummies Yes Yes Yes
Number of observations 1649 1649 1530
R2 0.323 0.578 0.273 Notes: Standard errors are robust through cluster option; Dependent variables are expressed in the log;
All regional, household and communal variables are included in the models in each panel; All models
differenced to remove unobserved fixed effects and estimated using instrument variables with IV-GMM
procedure (as discussed in Section 5.3); ∗, ∗∗, ∗∗∗ indicates that the corresponding coefficients are
significant at the 10%, 5%, and 1% levels, respectively.

169
Appendix 5.9 Effect of changes in nonfarm individuals on agricultural production
using 2SLS estimates: southern Vietnam
Explanatory variables Paddy output Agricultural
revenue
Non-rice
agricultural
revenue
Change in number of individuals in nonfarm activities
-0.02
(0.02)
-0.04
(0.036)
-0.097
(0.065)
Agricultural variables (differenced)
Logarithm, annual land
0.105***
(0.033)
0.133**
(0.057)
0.212**
(0.084)
Number of land plots titled
0.002
(0.002)
-0.004*
(0.002)
-0.004
(0.003)
Logarithm, seed costs
0.156***
(0.029)
0.059***
(0.036)
-0.073
(0.055)
Logarithm, fertiliser costs
0.061***
(0.016)
0.518
(0.042)
0.478***
(0.06)
Logarithm, pesticide costs
0.049***
(0.015)
0.083
(0.028)
0.056
(0.047)
Logarithm, value of hired labour
0.028
(0.019)
0.055*
(0.022)
0.013*
(0.055)
Logarithm, value of hired capital
0.131***
(0.024)
0.086
(0.024)
0.039
(0.066)
Logarithm, farm hours
0.005
(0.014)
0.048
(0.035)
0.077
(0.058)
Logarithm, rice price (measured by unit value)
0.074***
(0.021)
0.083
(0.059
-0.043
(0.215)
Household characteristics (differenced)
Household members, from 15 to 60 years old
-0.002**
(0.016)
-0.009
(0.042)
0.011
(0.066)
Dependency ratio
-0.073
(0.072)
0.139
(0.153)
-0.009
(0.285)
Mean education of working age men
0.011
(0.009)
0.042
(0.019)
0.073**
(0.037)
Mean education of working age women
0.014*
(0.008)
0.022**
(0.018)
0.046
(0.037)
Logarithm, remittances
-0.009**
(0.005)
0.008
(0.01)
0.024
(0.023)
Logarithm, transfers
-0.004
(0.025)
-0.028
(0.092)
-0.032
(0.137)
Disasters in commune
-0.007
(0.008)
-0.01
(0.014)
-0.004
(0.023)
Logarithm, farm assets
-0.005
(0.012)
0.017
(0.034)
0.002
(0.048)
Logarithm, nonfarm assets
0.028
(0.019)
-0.000
(0.024)
-0.000
(0.092)
Communal characteristics Yes Yes Yes
Regional dummies Yes Yes Yes
Number of observations 1152 1152 835
R2 0.320 0.476 0.199
Notes: Standard errors are robust through cluster option; Dependent variables are expressed in the log;
All regional, household and communal variables are included in the models in each panel; All models
differenced to remove unobserved fixed effects and estimated using instrument variables with IV-GMM
procedure (as discussed in section 5.3); ∗, ∗∗, ∗∗∗ indicates that the corresponding coefficients are
significant at the 10%, 5%, and 1% levels, respectively.
170
Chapter 6
The effect of land fragmentation on labour allocation
and the economic diversity of farm households*
“In the face of industrialization and increasing rural wages, technical changes and
institutional innovations are key strategies to improve agricultural productivity and
prevent the comparative advantage of agriculture from declining. Land reforms directed
toward land consolidation, which results in increasing labour-saving farming and more
mechanization, are important strategies in the long term during the transitional period
form middle-income stage to high-income stage” (Policy proposition stated in Chapter 1)
6.1 Introduction
The development experience shows that the economic success of countries is
accompanied by agricultural growth and economic structural change, where labour and
resources are reallocated from the agricultural sector toward other sectors where they
can be used more productively (Lewis 1954; Perkin et al. 2006; Warr 2009). Johnson
(2000) notes that given the fixity of land, increasing the productivity of agriculture is
necessary for both poverty reduction and the development of the nonfarm sectors.
Many classical models analyse the role of agricultural productivity growth in releasing
labour from agriculture and in generating demand for the output of nonfarm sectors
(Johnson 2000; Haggblade et al. 2007). This raises the question as to whether Vietnam
can release labour from agriculture in a way that improves productivity and brings
about gradual changes in farm sizes, and the adoption of mechanized labour savings
methods, rather than relying on potentially distorting subsidies, which prevent a further
rapid widening of the gap between rural and urban areas.
Land reform through the reduction of land fragmentation (land consolidation) 59 is a
determinant of the ease with which this objective can be achieved. Land consolidation
* An earlier version of this chapter was presented at the Asia Conference on Economics and Business
Research (ACEB), Singapore, 11/2014. 59Land fragmentation is defined as the existence of a number of spatially separate plots of land, which
are farmed as single units (McPherson 1982). Land consolidation is defined as an exchange of the land
ownership and location of spatially scattered plots of farms to establish new landholdings with fewer
plots (Oldenburg 1990, p. 183). In this chapter, land consolidation is considered a public policy, which
is designed to address the problem of land fragmentation.

171
can facilitate the creation of competitive agricultural production arrangements by
enabling farmers to have farms with fewer parcels that are larger and better shaped, and
to expand the size of their holdings (Blarel 1992). The governments of many developing
countries emphasise the role of research, public investments and credit programs in
agriculture, as well as the promotion of mechanisation in order to improve productivity
and poverty reduction. However, these policies may be hindered if the land holdings of
households are too scattered and small (McPherson 1982). The analysis in Chapter 2
shows that small and fragmented landholdings result in a decline in the comparative
advantage of agriculture in the face of rising rural wages. Thus, land reforms involving
land consolidation programs play a vital role in agricultural productivity growth, and in
increasing the application of less labour-intensive farming.
Several studies of agricultural growth show that the reduction of land fragmentation results
in productivity gains in agriculture (Blarel et al. 1992; Wan and Cheng 2001; Hung et al.
2007; Kompas et al. 2012). As a result, land consolidation has policy relevance for
governments in promoting agricultural productivity. Tan et al. (2008) conclude that land
consolidation may release more labour for other sectors of the Chinese economy. Wan and
Cheng (2001) reach the same conclusion for the Chinese farm households. These studies
found evidence that land reforms such as land consolidation can facilitate structural
transformation and agricultural productivity growth. If these findings are accurate, land
consolidation not only improves agricultural productivity, but also reduces agricultural
surplus of labour- one of the challenges facing Vietnam.
Policy makers in Vietnam are aware of these issues and have tried to address them
through increasing land consolidation programs since 1998. The question is, however,
whether or not this policy really works, and whether land consolidation may also foster
labour allocation and economic diversification. This chapter examines whether the
application of land consolidation reduces labour supply and induces labour reallocation
in farm households. An understanding whether land reforms have had the desired
impact, and the magnitude of any effects in shifting labour out of agriculture and
bringing about rural transformation, is important in light of rising rural-urban
inequality, and the need to enhance agricultural productivity in Vietnam.
The overall objective of this paper is, therefore, to test the validity of the above-
mentioned areas in rural Vietnam, with a concentration on the role of land policies in
facilitating the structural transformation. McCaig and Pavcnik (2013) show that no

172
study formally examines the impact of agricultural productivity growth on the “labour
push” explanation for the observed movement of labour out of agriculture in Vietnam.
In this chapter, land consolidation is used as a measure of agricultural technical
change. The concept of technical change is discussed in Chapter 2.60 The study also
tests whether land consolidation is considered a factor-biased technical change, or a
Hicks-neutral technical change. If land consolidation reduces farm labour, then factor-
biased technical change should be considered. Conversely, if land consolidation
increases farm labour, the Hicks neutral technical change should be selected. This
argument is important in supporting the development of empirical models such as
selection of functional forms related to land fragmentation.
To carry out the empirical tests, this chapter first develops a model for studying the
effect of agricultural development through land consolidation. As discussed in Chapter
2, there is no unanimity in the theoretical literature on the effect of land reforms on
labour allocation in a land-poor and labour-abundant country. The chapter expands a
theoretical model developed by Jia and Petrick (2013) by capturing the land
consolidation parameter that measures the efficiency of labour uses on the farm plot,
and the ability to apply it to mechanisation in both rice production and factor-biased
technical change. The theoretical model, thus, predicts that the effect of agricultural
technical change through land consolidation on labour allocation depends on the factor
biased technical change.
The chapter employs a panel data set of the Vietnam Household Living Standard
Survey in 2004 and 2006 to explore the impact of land fragmentation on labour
movements (via migration of nonfarm employment) out of agriculture and
diversification. The empirical strategy includes using different methods to verify the
consistency of the results, such as first difference; the double hurdle model; and the
model of sample selection correction. There are two systems of equations, including
the impact of land consolidation on nonfarm and farm outcomes.
This study contributes to the literature in several ways. First, this is apparently the first
paper examining the joint treatment of two issues that have previously been treated
separately: the effect of land consolidation on farm, nonfarm employment and
incomes. Land consolidation has two separate effects: a direct agricultural productivity
60 Technical change is defined as any change in production coefficients resulting from the purposeful
resource-using activity directed to the development of new knowledge embodied in designs, materials,
or organizations (Hayami and Ruttan 1985, p. 86).

173
effect that is the main focus of much of the empirical literature, and an indirect labour
allocation effect that is the main interest of this study. Second, many studies in the
literature focus on the impacts of land fragmentation on agricultural productivity, crop
inputs and crop diversification, but this study discusses the linkages between land
fragmentation and labour allocation, and economic diversity of farm households. Next,
there is a further contribution to the current literature by taking into account the
potential spillover effect of land consolidation as a “push” factor in the determinants of
nonfarm employment and incomes after controlling human capital assets and locational
factors. Finally, it provides a theoretical framework of linkages between agricultural
technical change and labour allocation ignored in the earlier literature.
The rest of this chapter is organized as follows: Section 6.2 covers the literature review
and summarizes previous studies which support the discussion of variables in the
model. Section 6.3 introduces the theoretical framework and empirical methodologies.
Section 6.4 analyses the data and variables. Section 6.5 describes the empirical results.
Finally, conclusions are presented with a summary of the main findings.
6.2 Literature review
6.2.1 Agricultural growth, household labour allocation and structural
transformation
Considering the determinants of labour allocation, to date, there are three strands of
thoughts that trace this process. The first strand, focuses on the role of infrastructure
and locational factors, and holds the views that labour moves toward the rural nonfarm
economy in those areas where infrastructure is well developed (Haggblade et al. 2007;
Isgut 2004). The second strand emphasises the importance of human capital and
physical assets, which are well asserted in all studies related to the nonfarm sector
(Fafchamps and Quisumbing 1999; Haggblade et al. 2007; Kijima and Lanjouw 2005).
The final strand is the role of agricultural growth linkages, which emphasise that
agricultural development resulting from technological advances, could spur the
development of the nonfarm sector through many forward and backward linkages
(Johnson 2000; Haggblade et al. 2007).
While many studies evaluate the effects of infrastructure and locational factors, human
capital, and physical assets on poverty reduction, the third strand has not been explored
174
deeply. The agricultural growth linkage hypothesis postulates that modern agricultural
technology propels the development of the nonfarm economy through production and
consumption linkages (Haggblade et al. 2007). On the production side, improved
agricultural technologies and land reallocation, which allows more mechanisation, may
spur the birth and development of industries and service-related support to the
agricultural sector. In addition, it releases rural workers to participate in nonfarm
activities. On the consumption side, any increase in farm income brought about by
increased agricultural productivity stimulates the consumption of locally produced
nonfarm goods and services (Haggblade et al. 2007).
There is a long tradition in economics of studying this third strand. Schultz (1953) held
the view that an agricultural surplus is a necessary condition for a country to start the
development process and structural transformation. However, the view that agricultural
productivity can support rural transformation has been challenged by many studies,
which argue that high agricultural productivity can retard industrial growth as labour
reallocates towards the comparative advantage sector (Field, 1978). Matsuyama (1992),
for example, indicates that the growth of agricultural productivity can slow down
structural change in open economies because labour reallocates toward the agricultural
sector, which consequently reduces the size of the non-agricultural sector. In his model,
there is only one type of labour, thus technical change is, by definition, Hicks-neutral.
So, a new prediction emerges: when technical change is strongly labour savings, an
increase in agricultural productivity leads to labour changes, even in open economies.
Similarly, Foster and Rosenzweig (2004 and 2008) find that growth of income from the
nonfarm sector in rural India has been substantial and the primary source of this growth
is not predicated on the expansion of agricultural growth. However, Johnson (2000)
emphasises that increasing the productivity of agriculture is essential for both poverty
reduction and the development of the non-agricultural sector. Although there have been
many theoretical studies, empirical evidence testing these linkages is still rare,
particularly using household survey data.
One that is close to this paper is the research of Foster and Rosenzweig (2004 and 2008)
in rural India. The authors investigate the effect of agricultural growth as a result of the
adoption of high yielding varieties (HYV) on economic diversification and income
growth. They also verify the strong conclusion of Johnson (2000) that an increase in
agricultural productivity leads to the development of non-agricultural sectors. Foster and

175
Rosenzweig (2004 and 2008) find evidence of the opposite: the substantial expansion of
the nonfarm sector in India is not a result of from the growth of agricultural productivity.
In this study, the theoretical model predicts that if the technical change is Hicks-neutral,
an increase in farm productivity leads to greater farm labour intensity. Thus, the
conclusion of Foster and Rosenzweig is consistent with the predictions in the theoretical
studies, if they assume a Hicks-neutral technical change in their model.
6.2.2 The role of the reduction of land fragmentation in fostering income
diversification, agricultural productivity, and nonfarm development
As regards the impact of land fragmentation on labour allocation and income
diversification, there is a missing link in the literature. The main focus of the literature
is the linkage between land fragmentation, farm sizes and farm productivity (or farm
output). Many studies show that small and fragmented farm size hampers technology
application, leading to more farm labour and higher costs for farming production, this
in turn reduces productivity in agricultural production (Hung et al. 2004; Blarel et al.
1992; Bentley 1987). Similarly, McPherson (1982) and Bentley (1987) find that land
fragmentation keeps labour on farms and increases farming labour supply. Wan and
Cheng (2001) find that there is a significant impact of land fragmentation on
agricultural production, which implies that the exogenous addition of one plot results
in a reduction of annual crop output by 2 to 10 percentage points. Similarly, the
analysis using a stochastic production frontier method shows a negative impact of land
fragmentation on agricultural productivity in Bangladesh (Rahman and Rahman 2008).
In addition, the theory of inverse farm size and productivity is less effective if the
effect of land fragmentation is controlled (Niroula and Thapa 2005). The authors claim
that when landholdings are scattered, the increased costs not only undermine
efficiency, but also result in unsuitable land utilization due to the adoption of selective
and extractive strategies. Moreover, land fragmentation contributes to a weakening of
the economic competitiveness of farm households, due to the increased costs of labour
and other inputs (Tan et al. 2008).
There has been no study analysing the impact of land consolidation on economic
diversification of farm households. In addition, studies in the literature do not provide a
theoretical framework for their analysis related to the impact of land consolidation or
agricultural technical change on labour allocation in a farm household. Jia and Petrick

176
(2013) show that the effect of scattered landholdings on the marginal product of labour
and labour allocation is theoretically undetermined, despite the positive relationship
between land consolidation and productivity. They also conclude that land
consolidation makes on-farm work more attractive and thus decreases the off-farm
labour supply in the case of China. However, the impact of land-consolidated policies
on off-farm labour supply is statistically insignificant. Tan et al. (2008) state that
fragmented landholdings cause higher labour costs in Chinese agricultural production.
Wan and Cheng (2001) also find that more liberal land policies in China allowing land
consolidation may reduce surplus labour in agricultural production.
In addition, previous studies have found that the reduction of land fragmentation
improves agricultural technical efficiency (Hung et al. 2007; Rahman 2009). Similarly,
McPherson (1982) finds that land fragmentation hinders any improvement in
agricultural productivity. Given the continued decline in cultivated area, diminishing
productivity, the prevalence of a labour surplus and continued increases in the costs of
production, rural households’ profitability in rice production is decreasing. Moreover,
Wan and Cheng (2001) find that land fragmentation often results in problems of
increased labour time, land losses, need for fencing, increasing transportation costs and
restrictions to human, and machinery and irrigation access. Hence, the limit of
technological application is likely a main disadvantage of land fragmentation.
In the case of Vietnam, previous studies mainly concentrate on the effect of land
fragmentation on agricultural production. Markussen et al. (2013) provide a detailed
analysis of inter and intra farmland fragmentation in Vietnam. They used a different
sample – the Vietnam Access to Resources Household Survey of 12 provinces
(VARHS) in 2008. They find that consolidating land has facilitated some types of
mechanisation in farming activities, and greater agricultural productivity. Thus, land
consolidation has the potential to increase agricultural output. Similarly, Hung et al.
(2007) reach the same conclusion that less fragmented land holdings result in increased
crop productivity. Kompas (2004) and Kompas et al. (2012), using farm survey data
and VHLSS 2004, find that the reduction of land fragmentation improves technical
efficiency in rice production in Vietnam. However, there has been no study on the
impact of land fragmentation on labour allocation and the economic diversification of
farm households in Vietnam. Moreover, previous studies do not investigate the
mechanisms of labour allocation, and in particular the theoretical framework for this

177
allocation. This present study fills the gap by examining the impact of land
fragmentation systematically, and by focusing on both nonfarm and farm outcomes.
6.3 Methodology
6.3.1 Theoretical framework
In order to characterise the process of labour allocation and economic diversification of
farm households by land consolidation, this chapter develops a simple theoretical
framework for investigating the impact of agricultural technical change on the
marginal product of on-farm labour, and on labour allocation. The reduction of land
fragmentation is hypothesised as an agricultural technical change, involves the
rearrangement of plots and farming methods. Hayami and Ruttan (1985) emphasise
that agricultural technical change is also linked to the development of new designs and
organisations in agricultural production.
In Jia and Petrick (2013), the authors also develop a theoretical model and conclude
that the effect of land fragmentation on agricultural productivity is theoretically
determined. However, the effect of land fragmentation on labour allocation is
theoretically undetermined. This chapter argues that the impact of land fragmentation
on labour allocation can be theoretically determined. Instead of measuring the variable
of land fragmentation directly, it begins by exploring the effects of agricultural
development as a measure of agricultural technical change from Hayami and Ruttan
(1985), which captures the process of land consolidation. This is a new approach in
creating a theoretical framework to evaluate the relationship between land reforms and
rural structural transformation. In addition, the model considers rural households who
derive their livelihoods from agricultural production.
6.3.1.1 Theoretical research on the impact of agricultural technical change on
labour allocation of farm households
As shown by both theoretical and empirical evidence, there is mixed evidence of the
effect of agricultural technical change on labour use and allocation in the household.
This is the main focus of this paper. In microeconomic perspectives, the marginal
product of farm labour is a key factor influencing the labour allocation process. The
chapter starts an output function Y(L, A, θ), where L denotes labour, A is a vector of
other factors of production, and θ is a vector of technologies. Acemoglu (2010) shows

178
that technology is strongly labour savings if an increase in θ reduces the marginal
product of labour.
Because the focus is on labour reallocation due to the impacts of agricultural technical
changes, the model considers two kinds of production function: Cobb-Douglas, and
CES, y=f(L,A), (this is the same type of model used by Benjamin (1995) and Urdy
(1996)). The technical parameter in the function is introduced to evaluate its impacts
on the marginal product of farm labour, y=α1f(L,A) (Hicks-neutral technical change),
y=f(α2L,A) (labour augmenting technical change like the approach of Jia and Petrick
(2013)), and y=f(L,α3A) (land augmenting technical change). McMillan et al. (1989)
use the same approach, with α defined as the effort of farmers due to institutional
reforms and αL is measured as efficiency units. This model is Hicks factor-biased
labour augmenting.
This chapter starts the CES production function, which is based on the specification
developed by Acemoglu (2010) and Bustos et al. (2013), the model extends the
production function as follows:61
𝑌 = 𝛼1 [𝛾(𝛼2𝐿)𝜎−1
𝜎 + (1 − 𝛾)(𝛼3𝐴)𝜎−1
𝜎 ]
𝜎
𝜎−1 (6.1)
where Y denotes the production of agricultural product. There are two input factors,
labour (L) and land (A); α1 represents Hicks-neutral technical changes; α2 labour
augmenting technical changes; and α3 is land or capital augmenting technical changes.
The parameter α2 is the same approach used by Jia and Petrick (2013). The share
parameter𝛾 ∈ (0,1) and the parameter σ measure the elasticity of substitution between
labour and land. If 𝜎−1
𝜎 approaches to zero, it results in the Cobb-Douglass production
function.
Marginal product of labour (MPL) is measured by differentiating the agricultural
production function (Equation 6.1) with respect to labour:
𝑀𝑃𝐿 =𝜕𝑌
𝜕𝐿
61 The main development of my model compared with that used by Acemoglu (2010) and Bustos et al.
(2013) is the introduction of an agricultural technical parameter. In addition, I analyse the cases of
technical change using details that have been ignored in previous studies. I also develop further the
condition of labour savings as described in Acemoglu (2010). Technology is strongly labour savings if
technological change reduces the farm marginal product of labour. This condition only holds if there is a
low enough elasticity of substitution, as shown in Equation (6.5).

179
𝑀𝑃𝐿 = 𝛼1 [𝛾(𝛼2𝐿)𝜎−1
𝜎 + (1 − 𝛾)(𝛼3𝐴)𝜎−1
𝜎 ]
𝜎𝜎−1
−1
𝛾𝐿𝜎
𝜎−1−1𝛼2
𝜎−1𝜎
Set 𝜔 = [ 𝛾(𝛼2𝐿)𝜎−1
𝜎 + (1 − 𝛾)(𝛼3𝐴)𝜎−1
𝜎 ]
Then I have: 𝑀𝑃𝐿 = 𝛼1[𝜔]𝜎
𝜎−1−1𝛾𝐿
𝜎
𝜎−1−1𝛼2
𝜎−1
𝜎
The ratio of marginal product of land to marginal product of labour is:
𝑀𝑃𝐴
𝑀𝑃𝐿=
1 − 𝛾
𝛾(
𝛼3
𝛼2)
𝜎−1𝜎
(𝐴
𝐿)
1𝜎
(6.2)
Therefore, if labour and land are complements in agricultural production (σ<1), then
labour augmenting technology which increases in α2, will raise the marginal product of
land relative to labour. Similarly, technical change is labour savings if it decreases the
MPL. The model now evaluates the impact of agricultural technical changes on the
farm marginal product of labour and labour allocation in the household, under two
types of technical change. This chapter mainly focuses on Hicks-neutral technical
change and labour augmenting technical change, both of which are relevant to
Vietnamese context.
Hicks neutral technical change62
This study extends the approach of Jia and Petrick (2013) by introducing the case of
Hicks neutral technical change. This is the same type of functional form developed by
Lau and Yotopolous (1971) in their discussion of technical efficiency. The Cobb-
Douglas production function has been used extensively in the literature and has the
property of Hicks neutral technical change with a unity elasticity of substitution. Thus,
under the Cobb-Douglas production function, productivity is always Hicks neutral, i.e.
improvements in productivity do not affect the relative marginal products of land and
labour and so do not alter the relative allocations of the factors (Acemoglu 2010; Raval
2011). In case of the Cobb-Douglas production function, the increase in agricultural
productivity has a positive impact on the MPL and thus slows down the process of
labour transformation.
62 The technical progress is classified as Hicks neutral if the ratio of marginal products remains
unchanged for a given factor input ratio (Hicks 1963).

180
Using the assumption of Hicks neutral technical change, agricultural technical change
affects production processes rather than a particular input. It adds to the production
process through its effects on productive efficiency (Wan and Cheng, 2001). The
increase in α1 toward unity means greater productivity, and this results in an increase in
the farm marginal product of labour, because: 𝜕𝑀𝑃𝐿
𝜕𝛼1> 0. As a result, less farm labour
is released to other sectors.
If Hicks-neutral technical change is applied in agricultural production, then 𝜕𝑀𝑃𝐿
𝜕𝛼1> 0,
and I have:
𝜕𝑀𝑃𝐿
𝜕𝛼1
= [𝛾(𝛼2𝐿)𝜎−1
𝜎 + (1 − 𝛾)(𝛼3𝐴)𝜎−1
𝜎 ]
𝜎𝜎−1
−1
𝛾(𝛼2𝐿)𝜎−1
𝜎−1𝛼2 > 0
where 𝛾 ∈ (0,1), and α2>0, α3>0; L and A are positive.
Labour augmenting technical change
The impact of agricultural technical change depends on the elasticity of substitution. If
the elasticity of substitution meets the conditions in Equation (6.3), labour augmenting
technical change is strongly labour savings (Acemoglu 2010). Benjamin (1995) shows
that if the elasticity of substitution is low enough, and labour’s share is high enough,
factors that improve productivity (such as better land quality) could decrease labour
uses. This would happen because less labour (L) is required to achieve the optimal
amount of effective labour (α2L).
In the case of labour augmenting technical change, the expression: 𝜕𝑀𝑃𝐿
𝜕𝛼2< 0 if and
only if the condition in Equation (6.3) is satisfied, or the elasticity of substitution is low
enough.63 Thus, we have:
𝜕𝑀𝑃𝐿
𝜕𝛼2= 𝛼1𝜔
𝜎
𝜎−1−1𝛾𝐿
𝜎−1
𝜎−1𝛼2
𝜎−1
𝜎−1 𝜎−1
𝜎 +𝛼1𝜔
𝜎
𝜎−1−2 (
𝜎
𝜎−1− 1) 𝛾𝐿
𝜎−1
𝜎 𝛼2
𝜎−1
𝜎−1 𝜎−1
𝜎𝛾𝐿
𝜎−1
𝜎−1𝛼2
𝜎−1
𝜎
𝜕𝑀𝑃𝐿
𝜕𝛼2
= 𝛼1𝜔1
𝜎−1𝛾𝐿−1𝜎 𝛼2
−1𝜎
𝜎 − 1
𝜎[1 +
1
𝜎 − 1𝜔−1𝛾(𝛼2𝐿)
𝜎−1𝜎 ]
where 𝜔 = [ 𝛾(𝛼2𝐿)𝜎−1
𝜎 + (1 − 𝛾)(𝛼3𝐴)𝜎−1
𝜎 ]
63See Appendix 6.1 for further mathematical proof.

181
If σ<1 and 𝜎−1
𝜎< 0 , then
𝜕𝑀𝑃𝐿
𝜕𝛼2< 0 if and only if [1 +
1
𝜎−1𝜔−1𝛾(𝛼2𝐿)
𝜎−1
𝜎 ] > 0. This
condition only holds when σ satisfies the condition in Equation (6.3) as follows:
𝜎 <(1 − 𝛾)(𝛼3𝐴)
𝜎−1𝜎
𝛾(𝛼2𝐿)𝜎−1
𝜎 + (1 − 𝛾)(𝛼3𝐴)𝜎−1
𝜎
< 1 (6.3)
Empirical predictions
The theoretical framework predicts that a Hick-neutral increase in agricultural
productivity slows the labour allocation toward nonfarm sectors. However, if the
condition in Equation (6.3) is satisfied, then technical change is strongly labour
savings, and there will be a reduction of labour demand in farm production. Hence, the
predictions of the theoretical model show that the impacts of agricultural productivity
on labour allocation are subject to the factor-biased technical change. As a result, the
effect of land fragmentation on labour allocation can be theoretically determined.
In this chapter, the prediction of the theoretical framework is tested by investigating the
impact of the reduction of land fragmentation on nonfarm and farm outcomes, such as
labour supply and profits. To hypothesise the effects of different agricultural technical
changes on household’s labour allocation, a model based on Jia and Petrick (2013) is
developed.64 In Jia and Petrick (2013), an exogenous land consolidation parameter 𝛼 ∈
(0,1) is introduced. This parameter captures the efficiency of labour use on the plot. If α
is closer to unity, the farmer spends more time on farming activities. Conversely, if α is
closer to 0, more time is spent on travelling due to scattered plots and the distance from
home to plots, or on other unproductive activities such as difficulties in water
management and mechanisation of agricultural production (Blarel et al. 1992; Tan et al.
2008; Wan and Cheng, 2001; Hung et al. 2007). The negative effects of land
fragmentation on productivity are analysed deeply in the literature review of this paper.
Because of land fragmentation problems, there is a reduction in the productive labour
used in agricultural production. Jia and Petrick (2013) introduce the production function,
Y = f(αL, X), where αL is the level of effective labour.
64 The main development of the model compared with that used by Jia and Petrick (2013) are the
arguments and discussion related to production functional forms and elasticity of substitution, which can
determine the effects of land fragmentation on the marginal product of farm labour. In addition, it
further develops the labour optimization problem under an imperfect land market.

182
Nevertheless, Jia and Petrick (2013) argue that the impact of land fragmentation on the
marginal product of labour is theoretically undetermined when taking the partial
derivative of the labour augmenting production function with respect to farm labour, L.
This study provides a different view. Based on the framework of the level of effective
on-plot labour in the presence of land fragmentation, the effects of land fragmentation
on the marginal product of farm labour can be determined by showing a clear
production function and with the assumptions of the elasticity of substitution, and of
technical changes.65 I extend the model by capturing the land consolidation parameter
α. All cases, including Hicks neutral, labour augmenting and land augmenting
technical change, have the same property that is, more land consolidation leads to more
agricultural output. What differs between the models is the way in which the relative
marginal products of land and labour are affected, and these in turn affect the labour
allocation in the household.
As shown in many studies, land consolidation enables farmers to mechanise and save
time. Therefore, this technology is characterised as labour-augmenting technical
change. Wan and Cheng (2001) test the non-neutral effects of land fragmentation.
They are unable to reject the hypothesis of non-neutral effects. The impacts on labour
allocation depend on the elasticity of substitution between labour and land. If land and
labour are complementary and meet the condition of equation (5), then land
consolidation is expected to reduce labour intensity in agricultural production, and
more labour allocation toward nonfarm activities.66 However, if the complementarity
between land and labour is weak, the prediction is opposite. Before testing the
predictions, the chapter develops the framework for empirical studies and model
specifications in the next section. When the empirical evidence shows that policies
toward more land consolidation will release farm labour to other sectors and reduce
labour intensity, it can be concluded that Hicks non-neutral technical change plays an
important role in the relationship between the growth of agricultural technical change
and the economic diversification of farm households in rural Vietnam.
65 The idea of the elasticity of substitution originated from Hicks (1963) in “The Theory of Wages”.
Elasticity of substitution is defined as the elasticity of the ratio of two inputs to a production function,
with respect to the ratio of their marginal products. It measures how easy it is to substitute one input for
another. 66 See Acemoglu (2010) for further discussion about labour savings.

183
6.3.1.2 Model framework for the impact of land fragmentation on labour
allocation and economic diversification
This chapter begins by presenting a theoretical framework for a farm household’s
optimal labour allocation to main activities. I extend the approach of Jolliffe (2004)67
and consider the household’s resource allocation problem as:
Max 𝑈[��](𝑋ℎ,𝑡) − ∑ 𝐿𝑎,𝑡𝑎 , ∑ 𝑌𝑎(𝐿𝑎𝑎 , 𝐴𝑘,𝑡 , 𝛼𝑡 , 𝑋𝑡 , 𝐿𝐹, 휀𝑎,𝑡)]
La,t, Ak,t (6.4)
subject to �� ≥ ∑ 𝐿𝑎 , 𝐿𝑎 ≥ 0, 𝐴 = ∑ 𝐴𝑘 = ��𝑘𝑎 , 𝑎 = 𝑓(𝑓𝑎𝑟𝑚), 𝑛𝑓(𝑛𝑜𝑛𝑓𝑎𝑟𝑚)
Here U(.) is the farm utility function in the period t over leisure (��(𝑋ℎ) − ∑ 𝐿𝑎)𝑎 , and
restricted profits (income minus cost of inputs). The restricted profits are a sum of
profits from two activities: farm (f) and nonfarm (nf). Profits from these two activities
are a function of household endowments such as assets, education and access to
infrastructure, X, household labour supply, La, allocated to farm and nonfarm activities.
Ak is the land use of different annual crops, and is constrained by the total endowment
of land, along with locational factors such as infrastructure conditions, LF. Household
labour supply depends on household characteristics, Xh. The number of plots, or the
Simpson index, measures the land consolidation parameter, αt. Random shocks to
production are defined as εa.
If labour and land markets are perfect, then Equation (6.4) leads to a separable decision
between production and preferences (Singh, Squire, and Strauss 1986). The marginal
product of farm and nonfarm activities equates market wages exogenously. However,
many studies show that perfect labour and land markets are rarely found in developing
countries (Benjamin 1992; Urdy 1996; Jolliffe 2004). Le (2009) also rejected the
perfect market assumption in the sample of Vietnamese farmers when he estimated the
labour supply function in rural Vietnam. The land markets also have the same pattern
(World Bank 2006). Therefore, in the case of incomplete labour and land markets, de
Janvry et al. (1991), and Skoufias (1994) show that household labour is allocated such
that the marginal product of labour is equal to endogenous shadow cost of labour, w*.
67Jolliffe (2004) uses the same model to measure the effects of education on labour allocation, and
profits in farm and off-farm activities in Ghana. The main development of my model compared with that
used by Jolliffe (2004) is the introduction of land fragmentation by adding more land consolidation
parameters such as the Simpson index or the log of plots.

184
The household labour supply can be formed by identifying the factors that affect w* in
the case of utility maximization.
We have:
𝜕𝑌𝑎,𝑡(𝐿𝑎,𝑡 , 𝐴𝑘,𝑡 , 𝛼, 𝑋𝑡 , 𝐿𝐹𝑡 , 휀𝑎,𝑡
𝜕𝐿𝑎,𝑡
= 𝑤𝑡∗ (6.5)
The allocation of family labour to farm and nonfarm activities thus depends, through
w*, on household characteristics and other factors that affect profits (de Janvry et al.
1991). The reduced form of household labour supply into farm and nonfarm activities
is as follows:68
𝐿𝑎 = 𝑓(𝑋𝑡 , 𝐴𝑘,𝑡 , 𝛼𝑡 , 𝐿𝐹𝑡 , 휀𝑎,𝑡)𝑎 = 𝑓, 𝑛𝑓 (6.6)
Substituting equation (6.6) into farm and nonfarm profit functions, we have:
𝑌𝑎,𝑡 = 𝑓(𝐿𝑎∗ (𝑋𝑡, 𝐴𝑘,𝑡 , 𝛼𝑡 , 𝐿𝐹𝑡 , 휀𝑎,𝑡), 𝑋𝑡 , 𝐴𝑘,𝑡 , 𝛼𝑡 , 𝐿𝐹𝑡 , 휀𝑎,𝑡) (6.7)
and
𝑌𝑎,𝑡 = 𝑓(𝑋𝑡 , 𝐴𝑘,𝑡 , 𝛼𝑡 , 𝐿𝐹𝑡 , 휀𝑎,𝑡) (6.8)
The addition of the profit function from each activity into a single household profit
function yields:
𝑌𝑡 = 𝑓(𝐿𝑎∗ (𝑋𝑡 , 𝐴𝑘,𝑡 , 𝛼𝑡 , 𝐿𝐹𝑡 , 휀𝑎,𝑡), 𝑋𝑡 , 𝐴𝑘,𝑡 , 𝛼𝑡 , 𝐿𝐹𝑡 , 휀𝑎,𝑡) (6.9)
Therefore, Equation (6.6) measures the extent to which land fragmentation affects
labour allocation between farm and nonfarm activities. Similarly, Equation (6.8)
measures the direct effect of land fragmentation on farm and nonfarm income. These
equations thus guide the framework for econometric specification.
68Xt includes household characteristics, Xh. Benjamin (1992) shows that if Xh can have a significant
impact on sectoral choice, then this finding can provide evidence of an incomplete labour market and
the separable assumption can be rejected.

185
6.3.2 Empirical models
The purpose of empirical models is to address the issue of whether agricultural technical
change, resulting from the reduction of land fragmentation, actually leads to labour
allocation and economic diversity in farm households in rural Vietnam. This study
design allows us to examine whether exogenous shocks to crop productivity lead to
changes in labour allocation and the economic diversification of a farm household. This
step permits us to characterise the factor biased technical change (as shown by Wan and
Cheng (2001)). Previous studies show the role of the reduction of land fragmentation on
farm productivity and the improvement of technical efficiency. This section studies the
effect of land fragmentation on labour allocation and economic diversification, including
the participation in the rural nonfarm economy in Vietnam, and the importance of land
consolidation to the allocation of labour into a higher return activity.
For this purpose, the study first estimates two reduced forms of farm and nonfarm
labour supplies from Equation (6.6), and farm and nonfarm profits from equation (6.8).
Next, it considers the effect of land fragmentation on the agricultural productivity and
labour intensity in farm and nonfarm activities. This paper uses different methods to
measure the extent of the reduction of land fragmentation on labour allocation, and test
the prediction that this change is characterised as labour-augmenting technical change.
Based on Equations (6.6) and (6.8), the dependent variables are estimated by using the
same set of independent variables, which control incentives and constraints affecting
the participation in farm and nonfarm activities (Reardon et al. 1992). It has reduced
form equations as follows:
𝐿𝑖𝑡,𝑎 = 𝛽0 + 𝛽1𝑆𝑖𝑡 + 𝛽2𝑋𝑖𝑡 + 𝛽3𝐴𝑖𝑡 + 𝛽4𝐿𝐹𝑖𝑡 + 𝛽5𝑅𝑘 + 𝛽6𝑇 + 휀𝑖𝑡,𝑎 , 𝑎 = 𝑛𝑓, 𝑓 (6.10)
and
𝑌𝑖𝑡,𝑎 = 𝜆0 + 𝜆1𝑆𝑖𝑡 + 𝜆2𝑋𝑖𝑡 + 𝜆3𝐴𝑖𝑡 + 𝜆4𝐿𝐹𝑖𝑡 + 𝜆5𝑅𝑘 + 𝜆6𝑇 + 휀𝑖𝑡,𝑎 (6.11)
and the effect of land consolidation on agricultural productivity and factor intensity in
farm and nonfarm activities is captured by the following reduced form equation:
𝑃𝑖𝑡,𝑎 = 𝛿0 + 𝛿1𝑆𝑖𝑡 + 𝛿2𝑋𝑖𝑡 + 𝛿3𝐴𝑖𝑡 + 𝛿4𝐿𝐹𝑖𝑡 + 𝛿5𝑅𝑘 + 𝛿6𝑇 + 휀𝑖𝑡,𝑎 (6.12)

186
where La and Ya represent the farm, nonfarm labour supply and profits, respectively,
and Pit is defined as either (i) agricultural output per ha; or (ii) the number of
individuals in the household who derive their main income from farm or nonfarm
activity, a represents farm and nonfarm outcomes; Sit is a vector of variables capturing
land fragmentation which includes the Simpson index or the number of plots. The
direct effect of land fragmentation on farm and nonfarm labour supplies, and farm and
nonfarm profits, is β1. The hypothesis of the coefficient β1 is positive in case of the
estimation of the farm labour supply function, and negative if the reduced form is
nonfarm labour supply function.
A similar pattern is applied for the profit functions. If these hypotheses cannot be
rejected, it can be argued that the impact of agricultural technical change through land
consolidation is subject to the factor biased technical changes. Thus, the variable of
interest in this study is Sit. The model also controls other variables that can affect farm
and nonfarm labour supply and profits, - these include household characteristics, Xit
(education, demographics and social networks of household members); total land area
of annual crops,69Ait; locational factors, LFit (infrastructure, business environments);70
regional dummies, Rk; and year dummies, T. The error term εit includes two
components: the first one is unobserved time-constant heterogeneity ηi, which affects
outcomes such as land quality, farm household’s management ability, and degree of
risk aversion. The second one is unobserved time-varying factors that impact
dependent variables such as health shocks.
The chapter investigates how land consolidation relates to changes in farm production,
and labour allocation between farm and nonfarm activities in Equations (6.10), (6.11),
and (6.12). In the first section on estimation strategies, the chapter shows estimates of
equations related to nonfarm outcomes including nonfarm labour supply, nonfarm
profits and number of individuals in nonfarm activities. In the second section, different
equations related to farm results are introduced, including farm labour supply and
profits, farm output per hectare, and share of farm employment.
69 World Bank (2006) show that land fragmentation mainly focuses on annual crops. 70 Isgut (2004) emphasises the importance of location factors (such as infrastructure and business
environment) on nonfarm income and employment in Honduras. Isgut shows that locational factors play
a very important role in moving toward nonfarm activities. The importance of human capital and
infrastructure is analysed in the section of literature review in this chapter.
187
6.4 Controlling the bias in econometric models
6.4.1 Controlling for unobserved heterogeneity ηi
The estimation of Equations (6.10), (6.11) and (6.12) pose some econometric
challenges. A potential problem may arise from the effect of unobserved heterogeneity
ηi, which can cause a biased estimation of the models (due to omitted variable bias).
Therefore, controlling ηi is necessary in order to get consistent estimates. In addition, a
vector of exogenous household and communal characteristics is used.71 Equations (10),
(11) and (12) can be estimated using a fixed effect model. First difference is applied to
control the unobserved heterogeneity ηi.
Alternatively, the model needs to capture the efficiency gain by using a random effect
model. Due to the low variation of the measure of land fragmentation, an approach
proposed by Mundlak (1978) and expanded by Chamberlain (1984) is applied. This
method allows unobserved heterogeneity to be correlated with independent variables. In
the correlated random effect model, 𝑋ℎ is denoted as the mean of time varying
independent variables in the models. Using the approach of Mundlak (1978), let
unobserved heterogeneity 𝜂𝑖 = 𝑋ℎ 𝛾 + 𝜇ℎ, where γ is a vector of coefficients capturing
possible correlation between ηi and household characteristics and μh is an error term that
is not correlated with 𝑋ℎ . I substitute 휀𝑖𝑡,𝑎 = 𝜂𝑖 + 𝜏𝑖𝑡,𝑎 and 𝜂𝑖 = 𝑋ℎ
𝛾 + 𝜇ℎ into equations
(6.10), (6.11), and (6.12) to yield the Mundlak specifications72 as follows:
𝐿𝑖𝑡,𝑎 = 𝛽0 + 𝛽1𝑆𝑖𝑡 + 𝛽2𝑋𝑖𝑡 + 𝛽3𝐴𝑖𝑡 + 𝛽4𝐿𝐹𝑖𝑡 + 𝛽5𝑅𝑘 + 𝛽6𝑇 + 𝛽7𝑋ℎ +𝜔𝑖𝑡,𝑎 (6.10′)
𝑌𝑖𝑡,𝑎 = 𝜆0 + 𝜆1𝑆𝑖𝑡 + 𝜆2𝑋𝑖𝑡 + 𝜆3𝐴𝑖𝑡 + 𝜆4𝐿𝐹𝑖𝑡 + 𝜆5𝑅𝑘 + 𝜆6𝑇 + 𝜆7𝑋ℎ +𝜔𝑖𝑡,𝑎 (6.11’)
𝑃𝑖𝑡,𝑎 = 𝛿0 + 𝛿1𝑆𝑖𝑡 + 𝛿2𝑋𝑖𝑡 + 𝛿3𝐴𝑖𝑡 + 𝛿4𝐿𝐹𝑖𝑡 + 𝛿5𝑅𝑘 + 𝛿6𝑇 + 𝛿7𝑋ℎ +𝜔𝑖𝑡,𝑎 (6.12’)
where 𝜔𝑖𝑡,𝑎 = 𝜏𝑖𝑡,𝑎 + 𝜇ℎ
6.4.2 Controlling for unobserved shocks
One of problems, which may arise even after controlling the correlation between Sit
(measures of land fragmentation) and ηi, is the correlation between Sit and unobservable
time-varying variables. Land fragmentations measured by the Simpson index and log of
71 Van de Walle and Cratty (2004) also used exogenous variables to reduce the potentials of biased
estimates in their study on the role of nonfarm economy on poverty reduction in Vietnam. 72 For more on the correlated random effects model, see Wooldridge (2012).

188
plots are assumed to be exogenous, and thus serve as their own instruments, due to the
restrictions of the Vietnamese land markets.73 In addition, land markets are imperfect
for both sales and rental markets, as a result of uncertainties related to land institutions
and restrictions. Therefore, land fragmentation is assumed to be exogenous in the
models. All prior studies assume independence between land fragmentation and
unobserved time-varying variables. According to the VHLSS surveys, 67.3 per cent of
plots have land-use right certificates. Only 4.03 per cent of plots were exchanged
through the land rental market. Thus, rural households cannot reduce scattered land
holdings by land markets.
However, the assumption of independence between land fragmentation and unobserved
shocks may be strong. Therefore, land fragmentation is likely to be correlated with
unobserved time-varying factors that affect farm and nonfarm. As discussed earlier, land
consolidation from the data is attributed by plot exchange, not by land markets. The land
consolidation programs are implemented by voluntary plot exchange and reallocation
with comprehensive planning. Tran (2006) finds that voluntary plot exchange is carried
out at the household level and the scope, and the effect, of this program is low. This
method of land consolidation requires close coordination among a large number of
households and plots. As a result, it takes time and effort to achieve consent among all
members. This is one of challenges facing voluntary land consolidation programs, and is
one reason for the difficulties facing land consolidation in rural Vietnam (Tran 2006).
Thus, the reduction of land fragmentation represents a decision made by local authorities
and related households, rather than a household decision.
In addition, the control of the correlation between land fragmentation and unobserved
shocks requires an instrumental variable. This instrumental variable is correlated with a
potentially endogenous variable, but not correlated with unobserved shocks in the
structural models. I experimented with a range of instrumental variables such as number of
land use right certificates transferred in the commune, communal population density, and
area of annual crop land titled by certificates of land-use right in the commune.74 However,
73 Chapter 3 discusses in detail the problems of land markets and history of land fragmentation in
Vietnam in details. Farmland was reallocated to households by the egalitarian principle during the
process of decollectivizing the agricultural system. In this chapter, log of plots is used as another
measure of land fragmentation, which is similar to previous studies (Jia and Petrick 2013; Wan and
Cheng 2001; Hung et al. 2007). 74 In the communal surveys, Section 4 covers agriculture and land types. However, it does not provide
information related to land consolidation programs. In Vietnam, land ownership does not exist. Local
government issues a certificate of land use right for all plots which households use. On this certificate, it
shows the information on the number of plots, area, and location for each plot (Land Law 2003).

189
the results are not useful due to a lack of suitable instruments. Ma et al. (2013) study the
effect of perceived land tenure security on land investments. The authors used instrumental
variables that are correlated with perceived land tenure such as opinions about policy. A
good instrumental variable is linked to land governance or the perception of households of
the benefits of land fragmentation; these are ignored in household surveys designed by the
World Bank. This is the reason why all previous studies of the problem of land
fragmentation have assumed that it is exogenous, (see Jia and Petrick 2013; Rahman and
Rahman 2008; Markussen et al. 2013).
This chapter further tests the exogenous condition of land fragmentation by applying the
control function approach to solve the problem. The control function is implemented by
taking the residuals from a reduced form model of land fragmentation. These residuals
are included in the labour supply and profit functions as a covariate. The significance of
the coefficients on the residuals will test and control for the correlation between land
fragmentation and unobserved shocks (Papke and Wooldridge 2008). In order to apply
the control function, the first step is to model the reduced form for land fragmentation by
using the first difference and Tobit models for the correlated random effect models. The
instrumental variable is the number of land use right certificates transferred in the
commune in the past year. Although the coefficient of this instrumental variable is
significant, the coefficient of residuals on the structural farm and nonfarm equations is
statistically insignificant, which indicates that the land fragmentation is not endogenous
in both the farm and nonfarm outcome equations.75
6.4.3 Controlling the sample selection bias to examine the effect of land
fragmentation on nonfarm outcomes
In order to control the unobserved heterogeneity ηi, correlated random effects (CRE),
as adopted by Mundlak (1978), can be applied. Although the model can control for the
unobserved heterogeneity ηi, it faces a sample selection bias in nonfarm models due to
the incidental truncation of the nonfarm labour participation (Cunguara et al. 2011).
Wooldridge (2012) argues that the problem of sample selection bias needs to be tested.
Because of the change in a household’s selection status overtime, the within-estimator
aimed at eliminating the unobserved time-constant heterogeneity cannot be applied due
to changes in household composition overtime by the group of selected households. In
order to solve both problems - sample selection and ηi, this study uses the estimating
75 See the Appendix A8 for the test using control function.

190
procedure introduced by Wooldridge (1995), who developed the level equation to
obtain consistent estimations using a pooled method by parameterizing the conditional
expectations. The model first obtains the inverse Mills ratio from a reduced form
selection probit equation as follows:
𝑠𝑖𝑡 = 1[𝑥𝑖𝛾𝑡2 + 휀𝑖𝑡 > 0]
where s is a dummy variable, equal to one for households with a positive nonfarm
labour supply or profits and zero otherwise; 𝑥𝑖 = (𝑥𝑖𝑡 , �� ) is consist with the value of an
independent variable for household i in period t and its mean value for household i
across periods of time. I use the approach of Mundlak (1978) to control for household
fixed effects of the selection equation. The independent variables are shown in
Equations (6.10’), (6.11’) and (6.12’). The Wooldridge (1995) estimator requires, at
least, a time-varying variable, and this affects selection, but not the level equation.
Note that the two-step estimation could be unreliable in the absence of exclusion
restriction (Wooldridge 2012).
Next, time periods are pooled together and the data set is treated as a cross section. The
pooling of all panel observations is a shortcoming of this approach, but it is,
unfortunately, the only option in this case. The model includes the inverse Mills ratio,
computed from the participation equation, as an additional variable to control sample
selection bias. However, there are some exclusion restrictions related to the models of
nonfarm outcomes. I include at least one time-varying variable in the selection
equation that does not affect nonfarm labour supply and incomes. In this case,
unearned incomes from Gupta and Smith (2002) is used in the participation equation,
but not in the nonfarm labour supply and income.
6.5 Functional forms
6.5.1 The effect of land fragmentation on nonfarm outcomes: nonfarm
labour supply and nonfarm profits
The chapter now turns to the question of whether the move toward nonfarm activities
increased due to the impact of land fragmentation. There are two equations for three
outcomes, including nonfarm labour supply measured by the number of hours spent by

191
household members on nonfarm work, and nonfarm profits.76 As mentioned earlier,
one of the challenges associated with estimating nonfarm labour supply and nonfarm
profits is that a large proportion of the households in the sample do not participate into
nonfarm activities. It seems plausible that Wooldridge (1995) is appropriate.
However, the exclusion restriction is not easy to accept on priori grounds. Van de
Walle and Cratty (2004) argue that given the imperfect markets in rural Vietnam
(e.g.land markets) such an exclusion restriction seems far-fetched. Therefore, the study
uses another method, which does not require imposing exclusion restrictions. The
method is called the double hurdle model (DHM) for nonfarm labour supply and
profits. It follows recent studies related to nonfarm participation and income (e.g.
Matshe and Young (2004), Atamanov and Van den Berge (2012)) by applying the
same approach. The two-step double hurdle model developed by Cragg (1971) is
chosen in this case to estimate censored dependent variables. This model is more
flexible than the Tobit model because it takes into account of the possibility that the
factors affecting the participation in farm activities and factors affecting the level of
farm labour supply and profits may be different. In hurdle 1, farm households decide
whether or not to participate into farm activities, and if household members agree to
take part, then hurdle 2 takes into consideration the amount of profits earned by
household. The maximum likelihood estimator in the first hurdle can be obtained by
using a Probit regression. The maximum likelihood estimator for hurdle 2 can then be
estimated using a truncated normal regression model. The test to choose between the
Tobit model and double hurdle model is implemented by using a likelihood ratio test.
6.5.2 The effect of land fragmentation on farm outcomes: productivity,
labour supply, profits, and the number of individuals in farming activities
This section consolidates the findings in the literature related to the consequences of
land fragmentation. The effect of land fragmentation on four farm outcomes is further
investigated in order to answer the question of whether more people move off the farm
as a result of policies related to the reduction of land fragmentation. Firstly, farm
productivity change is measured as the farm annual crop output per hectare. The
second is farm labour supply measured by working hours spent by household members
76 Nonfarm profits are the aggregate of nonfarm wages and profits of self-nonfarm employment of farm
households.

192
on farming activities. The third outcome is farm profits.77 The final one is the number
of individuals in farm employment in the household. The impact of land fragmentation
on farm outcomes can be estimated using different methods. Initial characteristics of
households, land and communes are controlled. The use of the initial period (and thus
pre-determined) variables may eliminate the potential endogeneity of the some
household characteristics. Moreover, it may also mitigate the simultaneity problem
caused by some unobservable variables. This method removes unobserved
heterogeneity ηi such as land quality, management skills or ability.
6.6 Data
As in the previous chapters, this study uses the VHLSS 2004 and 2006 surveys for
empirical analysis. To concentrate on labour allocation of rural households in the full
sample, this chapter follows the approach taken by Jolliffe (2004) by selecting farm
households with at least one member who describes the main job as farming, and
which has positive farm profits. In addition, households with no rice crop outputs and
land were excluded from the analysis (the number of excluded households is 2179). It
should be noted that this chapter only focuses on rice farms. World Bank (2006) and
Marsh et al. (2006) show that land fragmentation mainly occurs in rice production in
Vietnam. The sample of panel data used in this study thus includes pure tenant
households, and land rental households. As regards attrition bias resulting from
households leaving the panel in different waves, there are 2,289 households sampled in
the second wave, 2,032 of those households had been sampled in the first wave. Thus,
a balanced panel of 2014 households was established by removing households with
missing data and apparent enumerator errors and available for only one time period;
this results in 4,028 households over the two waves of the survey.
Table 6.1 provides the information on the summary statistics of variables used in the
models. Farm profits are measured by the difference between the total revenue of
annual crops and their costs in a year. The measure of rice output is the quantity
harvested during the previous 12 months. To better compare the profits and value of
assets of households between two years, these values were deflated to January 2000
prices as the base year. The deflators used in this paper are collected from GSO (2010).
77 Farm profits are the difference between total revenue and costs of annual crop production. Farm
profits are equal to zero if total costs are greater than total revenue.
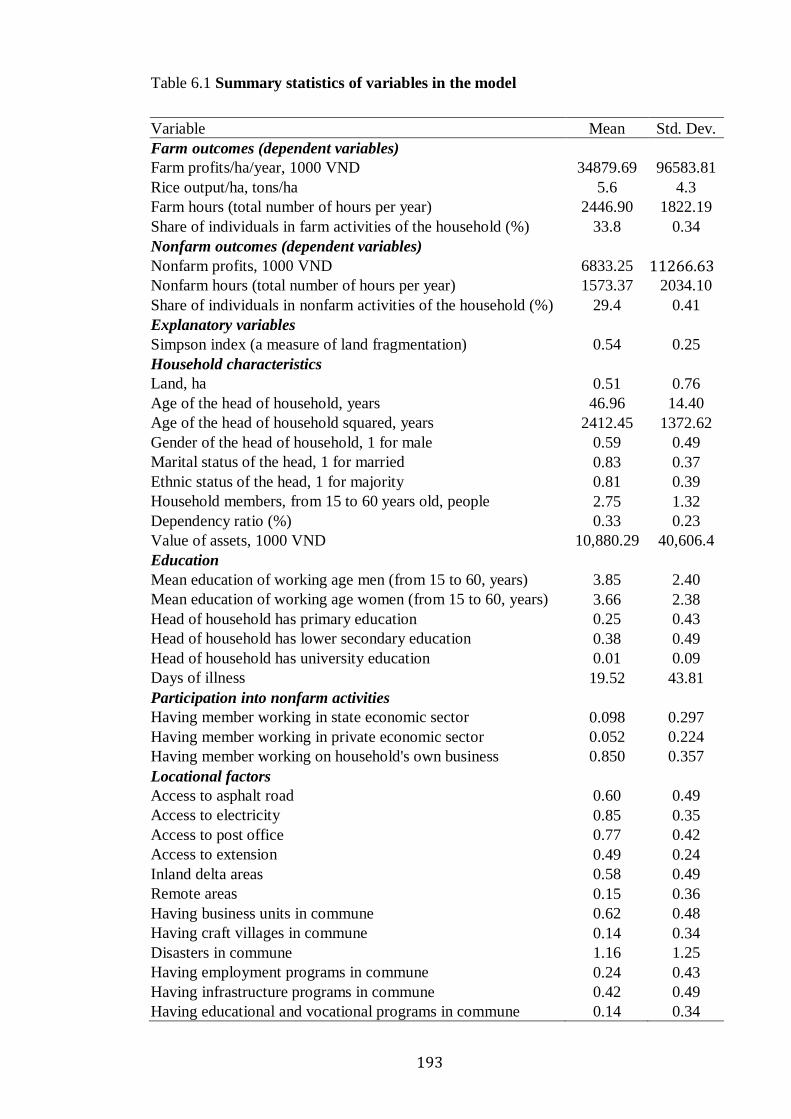
193
Table 6.1 Summary statistics of variables in the model
Variable Mean Std. Dev.
Farm outcomes (dependent variables)
Farm profits/ha/year, 1000 VND 34879.69 96583.81
Rice output/ha, tons/ha 5.6 4.3
Farm hours (total number of hours per year) 2446.90 1822.19
Share of individuals in farm activities of the household (%) 33.8 0.34
Nonfarm outcomes (dependent variables)
Nonfarm profits, 1000 VND 6833.25 11266.63 Nonfarm hours (total number of hours per year) 1573.37 2034.10
Share of individuals in nonfarm activities of the household (%) 29.4 0.41
Explanatory variables
Simpson index (a measure of land fragmentation) 0.54 0.25
Household characteristics
Land, ha 0.51 0.76
Age of the head of household, years 46.96 14.40
Age of the head of household squared, years 2412.45 1372.62
Gender of the head of household, 1 for male 0.59 0.49
Marital status of the head, 1 for married 0.83 0.37
Ethnic status of the head, 1 for majority 0.81 0.39
Household members, from 15 to 60 years old, people 2.75 1.32
Dependency ratio (%) 0.33 0.23
Value of assets, 1000 VND 10,880.29 40,606.4
Education
Mean education of working age men (from 15 to 60, years) 3.85 2.40
Mean education of working age women (from 15 to 60, years) 3.66 2.38
Head of household has primary education 0.25 0.43
Head of household has lower secondary education 0.38 0.49
Head of household has university education 0.01 0.09
Days of illness 19.52 43.81
Participation into nonfarm activities
Having member working in state economic sector 0.098 0.297
Having member working in private economic sector 0.052 0.224
Having member working on household's own business 0.850 0.357
Locational factors
Access to asphalt road 0.60 0.49
Access to electricity 0.85 0.35
Access to post office 0.77 0.42
Access to extension 0.49 0.24
Inland delta areas 0.58 0.49
Remote areas 0.15 0.36
Having business units in commune 0.62 0.48
Having craft villages in commune 0.14 0.34
Disasters in commune 1.16 1.25
Having employment programs in commune 0.24 0.43
Having infrastructure programs in commune 0.42 0.49
Having educational and vocational programs in commune 0.14 0.34

194
6.6.1 Measurement of land fragmentation
The independent variable of land fragmentation is of key interest in this chapter. Thus,
a measurement of land fragmentation is necessary to provide a relatively complete
picture of fragmented land holdings of rural households, and then for use in policy
analysis. The present chapter uses the Simpson index to measure land fragmentation.
This approach has been used by a number of studies. 78 According to Blarel et al.
(1992), the Simpson index is defined as:
𝑆𝐼 = 1 − ∑ 𝑎𝑖2
𝑛
𝑖=1
(∑ 𝑎𝑖
𝑛
𝑖=1
)
2
⁄
where a is the area of each plot, and n is the number of plots. SI lies between zero and
one, with a higher value if the Simpson index (SI) shows a larger degree of land
fragmentation. The average plot area, the distribution of plot area and the number of
plots form the Simpson index. However, this index does not capture the average
distance from home to the plots – i.e. it ignores the spatial distribution of plots. This is
a limitation of the data. Unfortunately, there is no section on spatial distribution in the
VHLSS surveys. The Simpson index has been used in previous studies on land
fragmentation in Vietnam (Kompas et al. 2012; Hung et al. 2007, Makussen et al.
2013), which can be compared with the results in this study. In this chapter, both the
Simpson index and plots are used as measures of land fragmentation.
6.6.2 Evidence of land fragmentation
This section explores whether land consolidation occurred and, if so, whether the process
was driven by the land market in Vietnam. Table 6.2 provides statistics of land
fragmentation in Vietnam using the VHLSS 2004 and 2006. As can be seen in the table,
there is a reduction in the degree of land fragmentation. All indicators show consistently
the tendency to land consolidation. The reduction of the Simpson index means that more
plots are consolidated. Meanwhile, the farm sizes also increase. Thus, land consolidation
and accumulation take place at the same time.79 The analysis in Chapter 3 shows that
land can be consolidated through plot exchange or through transactions in the land
78 Studies applying the Simpson index as the measurement of land fragmentation include Blarel et al,
1992; Tan et al. 2008; Hung et al. 2007. 79 The reduction of plots can eliminate the barriers between plots and irrigation systems. Due to the lack
of data on land barriers and irrigation systems, this chapter cannot provide evidence on this argument.
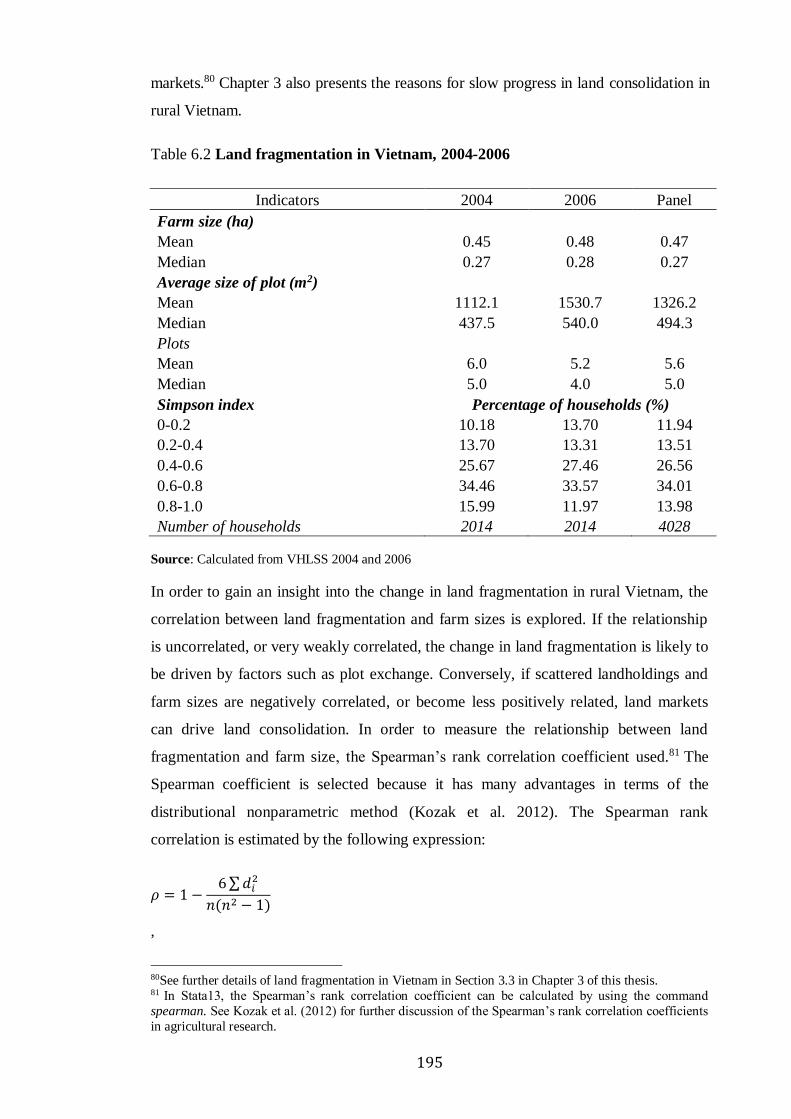
195
markets.80 Chapter 3 also presents the reasons for slow progress in land consolidation in
rural Vietnam.
Table 6.2 Land fragmentation in Vietnam, 2004-2006
Indicators 2004 2006 Panel
Farm size (ha)
Mean 0.45 0.48 0.47
Median 0.27 0.28 0.27
Average size of plot (m2)
Mean 1112.1 1530.7 1326.2
Median 437.5 540.0 494.3
Plots
Mean 6.0 5.2 5.6
Median 5.0 4.0 5.0
Simpson index Percentage of households (%)
0-0.2 10.18 13.70 11.94
0.2-0.4 13.70 13.31 13.51
0.4-0.6 25.67 27.46 26.56
0.6-0.8 34.46 33.57 34.01
0.8-1.0 15.99 11.97 13.98
Number of households 2014 2014 4028
Source: Calculated from VHLSS 2004 and 2006
In order to gain an insight into the change in land fragmentation in rural Vietnam, the
correlation between land fragmentation and farm sizes is explored. If the relationship
is uncorrelated, or very weakly correlated, the change in land fragmentation is likely to
be driven by factors such as plot exchange. Conversely, if scattered landholdings and
farm sizes are negatively correlated, or become less positively related, land markets
can drive land consolidation. In order to measure the relationship between land
fragmentation and farm size, the Spearman’s rank correlation coefficient used.81 The
Spearman coefficient is selected because it has many advantages in terms of the
distributional nonparametric method (Kozak et al. 2012). The Spearman rank
correlation is estimated by the following expression:
𝜌 = 1 −6 ∑ 𝑑𝑖
2
𝑛(𝑛2 − 1)
,
80See further details of land fragmentation in Vietnam in Section 3.3 in Chapter 3 of this thesis. 81 In Stata13, the Spearman’s rank correlation coefficient can be calculated by using the command
spearman. See Kozak et al. (2012) for further discussion of the Spearman’s rank correlation coefficients
in agricultural research.
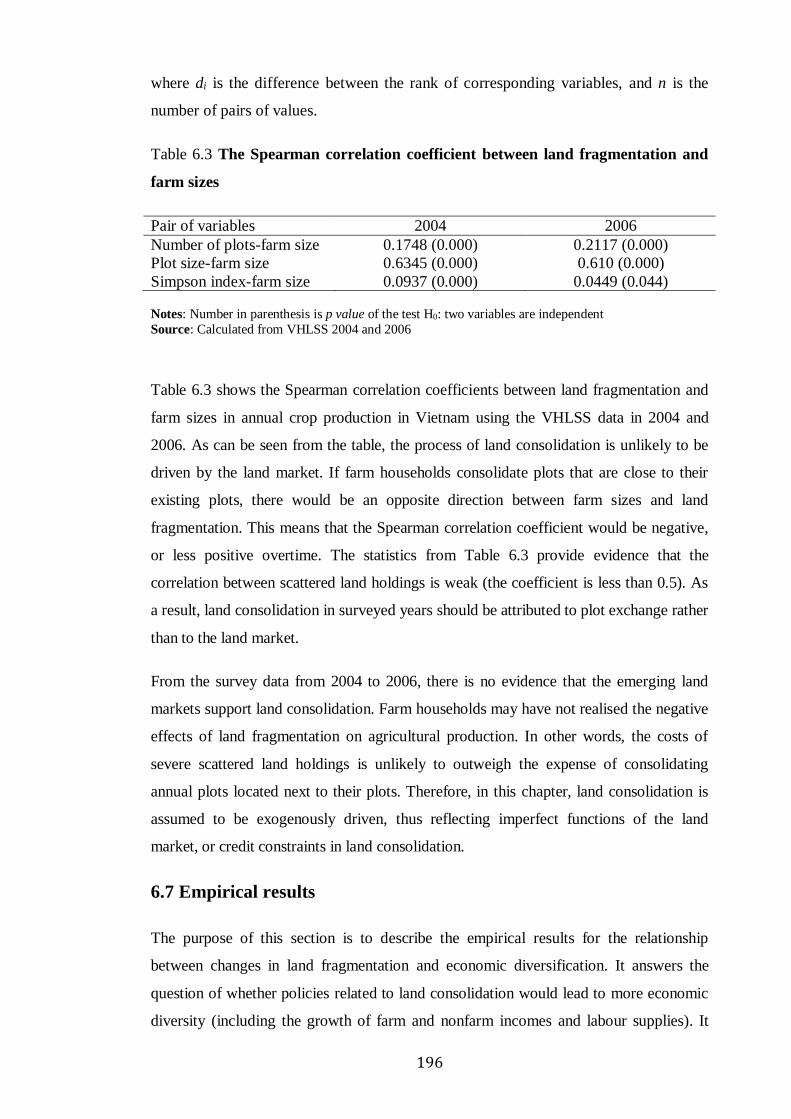
196
where di is the difference between the rank of corresponding variables, and n is the
number of pairs of values.
Table 6.3 The Spearman correlation coefficient between land fragmentation and
farm sizes
Pair of variables 2004 2006
Number of plots-farm size
Plot size-farm size
Simpson index-farm size
0.1748 (0.000)
0.6345 (0.000)
0.0937 (0.000)
0.2117 (0.000)
0.610 (0.000)
0.0449 (0.044)
Notes: Number in parenthesis is p value of the test H0: two variables are independent
Source: Calculated from VHLSS 2004 and 2006
Table 6.3 shows the Spearman correlation coefficients between land fragmentation and
farm sizes in annual crop production in Vietnam using the VHLSS data in 2004 and
2006. As can be seen from the table, the process of land consolidation is unlikely to be
driven by the land market. If farm households consolidate plots that are close to their
existing plots, there would be an opposite direction between farm sizes and land
fragmentation. This means that the Spearman correlation coefficient would be negative,
or less positive overtime. The statistics from Table 6.3 provide evidence that the
correlation between scattered land holdings is weak (the coefficient is less than 0.5). As
a result, land consolidation in surveyed years should be attributed to plot exchange rather
than to the land market.
From the survey data from 2004 to 2006, there is no evidence that the emerging land
markets support land consolidation. Farm households may have not realised the negative
effects of land fragmentation on agricultural production. In other words, the costs of
severe scattered land holdings is unlikely to outweigh the expense of consolidating
annual plots located next to their plots. Therefore, in this chapter, land consolidation is
assumed to be exogenously driven, thus reflecting imperfect functions of the land
market, or credit constraints in land consolidation.
6.7 Empirical results
The purpose of this section is to describe the empirical results for the relationship
between changes in land fragmentation and economic diversification. It answers the
question of whether policies related to land consolidation would lead to more economic
diversity (including the growth of farm and nonfarm incomes and labour supplies). It
197
also provides the result for farm outputs and profits, which confirm further the evidence
of agricultural productivity growth as a result of the reduction of land fragmentation.
Unlike earlier studies, this study does not estimate the production function. Deaton
(1997) points out that the most concern in the estimation of production function is the
endogeneity of inputs, and in order to solve the problem of endogeneity, other
researchers instrumented inputs (Jacoby 1993; Barrett et al. 2008). Hence, the common
factors that determine both the outputs and the farm profits, are used.
6.7.1 Nonfarm outcomes: nonfarm labour supply and nonfarm profits
This section provides the empirical results of the effect of land fragmentation on
nonfarm outcomes, including nonfarm labour supply and nonfarm profits. The purpose
of this section is to answer whether or not an exogenous shocks to agricultural
productivity leads to an economic diversity into nonfarm activities of a farm
household. It follows different specifications in order to check the consistency of the
impact. Table 6.4 indicates the effect of land fragmentation on nonfarm outcomes
without selection corrections. As can be seen in the table, all estimated coefficients
have negative signs in both methods. This finding means that the reduction of land
fragmentation results in an increase in nonfarm labour supply and nonfarm profits.
Column (1) and (3) in Table 6.4 present the results of double hurdle model of the level
equation. The selection equation for hurdle 1 is introduced in the Appendix. For
robustness, the likelihood ratio test (LR) is carried out to determine whether the double
hurdle model fits the model of factors affecting nonfarm labour supply and profits
better than the Tobit estimation. Like Matshe and Young (2004), all the Tobit models
can be rejected in favour of the double hurdle model at 5 per cent significant level.
This chapter provides the estimates in both cases with and without the specification of
Mundlak (1978) approach and tests the Mundlak fixed effects for nonfarm supply and
profits. The double hurdle model is estimated by correlated random effects, which
control for Mundlak fixed effects.

198
Table 6.4 The effect of land fragmentation on nonfarm outcomes without selection
correction using double hurdle model and first difference
Explanatory variables
Dependent variables
Nonfarm labour supply Nonfarm profits
Hurdle 2 (1) FD (2) Hurdle 2 (3) FD (4)
Panel A
Simpson index -0.120* -0.646* -0.307*** -0.233
(0.063) (0.344) (0.096) (0.408)
Mundlak fixed effect test, and p_value 12.58
(0.1697)
65.87
(0.000)
Household characteristics Yes Yes Yes Yes
Human capital Yes Yes Yes Yes
Household assets and credits Yes Yes Yes Yes
Locational characteristics Yes Yes Yes Yes
Participation in economic sectors Yes Yes Yes Yes
Regional dummies Yes Yes Yes Yes
Number of observations 2008 2014 2008 2014
Panel B
Log of plots -0.026 -0.324** -0.154*** -0.225
(0.027) (0.143) (0.038) (0.168)
Mundlak fixed effect test, and p_value 12.51
(0.1863)
64.64
(0.000)
Household characteristics Yes Yes Yes Yes
Human capital Yes Yes Yes Yes
Household assets and credits Yes Yes Yes Yes
Locational characteristics Yes Yes Yes Yes
Participation in economic sectors Yes Yes Yes Yes
Regional dummies Yes Yes Yes Yes
Number of observations 2008 2014 2008 2014 Notes: FD is first difference method; Standard errors (SE) are robust through the cluster option and in
the parentheses. DHM standard errors are bootstrapped with 500 replications. DHM is double hurdle
model (I only report hurdle 2 of the level equation; hurdle 1 is in the Appendix); All dependent variables
are expressed in the log; ∗, ∗∗, ∗∗∗ indicates that the corresponding coefficients are significant at the
10%, 5%, and 1% levels, respectively; The double hurdle model specification follows the Mundlak
(1978) approach; (The full set of parameter estimates are presented in Appendices 6.5, 6.6, and 6.7 of
the chapter).
Source: Calculated from VHLSS 2004 and 2006
Nonfarm self-employment profits and nonfarm wages are aggregated, which results in
the estimation of censored variables becoming less severe when merging two types of
nonfarm activities. The null hypothesis of the fixed effect test for nonfarm profits is
rejected at the 5 per cent significance level. Using the log of plots as a measure of land
fragmentation in Panel B, Columns (2) and (4) in Table 6.4 shows that land
fragmentation tends to have negative effects on nonfarm labour supply and nonfarm
profits. In Panel A, the Simpson index is statistically significant at the 5 per cent
2
2

199
significance level. Although specifications have the same trends of estimated
coefficients and indicate that policies toward more consolidated land holdings may
release more agricultural labour surplus, these equations also may suffer from a
selection bias. Therefore, in the next section, the effect of land consolidation on
nonfarm outcomes with selection corrections is examined.
Table 6.5 The effect of land fragmentation on nonfarm outcomes with selection
correction using the approach of Wooldridge (1995)
Explanatory variables
Dependent variables
Nonfarm labour supply Nonfarm profits
Panel A
Simpson index -0.122* -0.297***
(0.063) (0.080)
Mundlak fixed effect test, F(9,1956), p-value 1.31 (0.2282) 2.96 (0.0017)
Sample selection bias test, F(2,1956), p-value 0.60 (0.548) 4.44 (0.012)
Household characteristics Yes Yes
Human capital Yes Yes
Household assets and credits Yes Yes
Locational characteristics Yes Yes
Participation in economic sectors Yes Yes
Regional dummies Yes Yes
Number of observations 2008 2008
Panel B
Log of plots -0.023 -0.143***
(0.027) (0.037)
Mundlak fixed effect test, F(9,1956), p-value 1.28 (0.2434) 2.79 (0.003)
Sample selection bias test, F(2,1956), p-value 0.57 (0.564) 4.67 (0.0094)
Household characteristics Yes Yes
Human capital Yes Yes
Household assets and credits Yes Yes
Locational characteristics Yes Yes
Participation in economic sectors Yes Yes
Regional dummies Yes Yes
Number of observations 2008 2008
Notes: Standard errors (SE) are robust through the cluster option and in the parentheses; All dependent
variables are expressed in the log; ∗, ∗∗, ∗∗∗ indicates that the corresponding coefficients are significant
at the 10%, 5%, and 1% levels, respectively;
The model specification follows the Mundlak (1978) approach (Mundlak fixed effect test for nonfarm
labour supply and nonfarm profits and sample selection bias test for nonfarm labour supply and profits
at 5% significant level, respectively); (The full set of parameter estimates are presented in Appendices
6.8 of the chapter).
Source: Calculated from VHLSS 2004 and 2006

200
Table 6.5 shows the effect of land consolidation on nonfarm outcomes with the
correction of sample selection bias. To control the sample selection, the chapter
estimates (6.10), (6.11) and (6.12) with pooled data. The tests for sample selection bias
and fixed effects are obtained by employing an F-test. The results reveal that both
nonfarm labour supply and profits suffer from sample selection bias at the 5 per cent
significance level. Thus, the approach of controlling sample selection bias is
demanding. As a result, using the method of Wooldridge (1995) results in the same
conclusion, i.e. more land consolidation may release more labour to nonfarm sectors in
the future. All the coefficients of the Simpson index and log of plots in equations are
significant and have the same sign. The increase in agricultural productivity as a result
of land consolidation leads to an increase in farm households’ income, combined with
non-homothetic preferences, will generate the demand for non-agricultural goods and
services. Consequently, this process will pull farm labour to nonfarm sectors.
6.7.2 Farm outcomes: productivity, labour supply and farm profits
This section examines the impact of land fragmentation on farm labour supply and
profits. In order to investigate the relationship, equations (6.10), (6.11) and (6.12) using
first difference are estimated. The main explanatory variable of interest is the Simpson
index and log of plots. Table 6.6 provides estimated results with four farm outcomes as
dependent variables. Panel A presents the Simpson index, and Panel B captures the log
of plots. All four dependent variables are estimated on the same set of explanatory
variables in Equations (6.10) and (6.11) using the panel data method to control for the
fixed unobserved heterogeneity. The log of plots and Simpson index are used to measure
land fragmentation. Household characteristics are controlled for, e.g. education of adults,
assets, participation into different nonfarm activities and demographic information on
farm households. In addition, location factors such as business environment related to
infrastructure, and regional characteristics are also controlled.
As can be seen in the Table 6.6, the estimated coefficients show that the reduction of
land fragmentation (land consolidation) results in a reduction in farm labour supply and
the number of individuals working in farming activities. Farmers with more fragmented
land holdings switch to more labour-intensive farming. Based on the first difference
method, 1 per cent fall in the number of plots still decreases the farm labour supply by
0.36 per cent. Furthermore, if land fragmentation is reduced by 1 per cent, farm profits
per hectare and farm output per hectare increase by 0.12 per cent and 0.055 per cent,
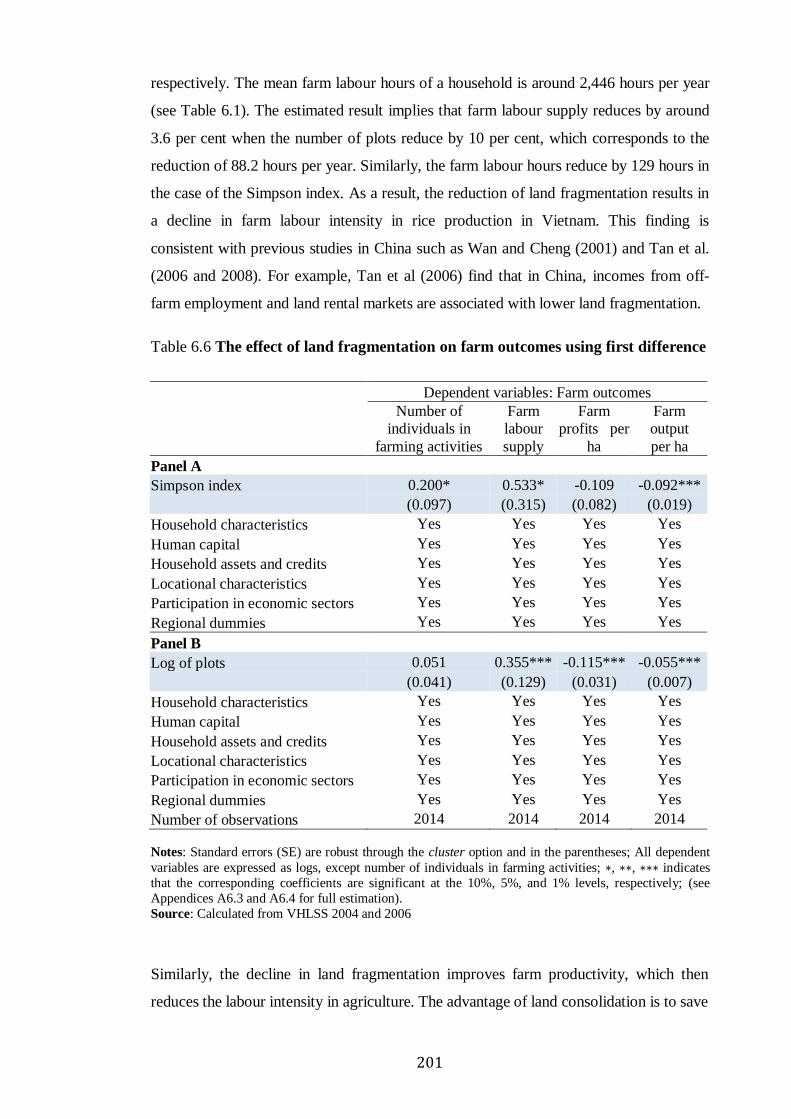
201
respectively. The mean farm labour hours of a household is around 2,446 hours per year
(see Table 6.1). The estimated result implies that farm labour supply reduces by around
3.6 per cent when the number of plots reduce by 10 per cent, which corresponds to the
reduction of 88.2 hours per year. Similarly, the farm labour hours reduce by 129 hours in
the case of the Simpson index. As a result, the reduction of land fragmentation results in
a decline in farm labour intensity in rice production in Vietnam. This finding is
consistent with previous studies in China such as Wan and Cheng (2001) and Tan et al.
(2006 and 2008). For example, Tan et al (2006) find that in China, incomes from off-
farm employment and land rental markets are associated with lower land fragmentation.
Table 6.6 The effect of land fragmentation on farm outcomes using first difference
Dependent variables: Farm outcomes
Number of
individuals in
farming activities
Farm
labour
supply
Farm
profits per
ha
Farm
output
per ha
Panel A
Simpson index 0.200* 0.533* -0.109 -0.092***
(0.097) (0.315) (0.082) (0.019)
Household characteristics Yes Yes Yes Yes
Human capital Yes Yes Yes Yes
Household assets and credits Yes Yes Yes Yes
Locational characteristics Yes Yes Yes Yes
Participation in economic sectors Yes Yes Yes Yes
Regional dummies Yes Yes Yes Yes
Panel B
Log of plots 0.051 0.355*** -0.115*** -0.055***
(0.041) (0.129) (0.031) (0.007)
Household characteristics Yes Yes Yes Yes
Human capital Yes Yes Yes Yes
Household assets and credits Yes Yes Yes Yes
Locational characteristics Yes Yes Yes Yes
Participation in economic sectors Yes Yes Yes Yes
Regional dummies Yes Yes Yes Yes
Number of observations 2014 2014 2014 2014
Notes: Standard errors (SE) are robust through the cluster option and in the parentheses; All dependent
variables are expressed as logs, except number of individuals in farming activities; ∗, ∗∗, ∗∗∗ indicates
that the corresponding coefficients are significant at the 10%, 5%, and 1% levels, respectively; (see
Appendices A6.3 and A6.4 for full estimation).
Source: Calculated from VHLSS 2004 and 2006
Similarly, the decline in land fragmentation improves farm productivity, which then
reduces the labour intensity in agriculture. The advantage of land consolidation is to save

202
labour time, and thus allow saving labour. As a result, this finding supports the
characterisation of the expansion of land consolidation as a non-Hicks neutral technical
change, which is consistent with the hypothesis of non-neutral effects in Wan and Cheng
(2001). Both measures of land fragmentation have the same effect on farm outcomes.
To sum up, the estimates of farm outcomes indicate that moving land consolidation
increases farm incomes. When the fixed effect is controlled, the estimates show that an
increase in land consolidation reduces labour intensity and farm labour supply, and
improves nonfarm profits and nonfarm labour supply. There is a linkage between the
agricultural development and the rural nonfarm economy. Regression results show that
the reduction of land fragmentation improves productivity, which then increases the
probability of increasing nonfarm incomes. Agricultural technical change leads to
increases in nonfarm incomes, which means that investments in agricultural technical
changes have a positive outcome.
6.7.3 Robustness to controlling for market wages
Another potential concern is that results might be driven by the evolution of market
wages in the nonfarm sectors, and not by technical change. For example, an increase in
the wage in nonfarm sectors could induce an expansion of employment in these
sectors. To address this concern, this study adds the variable of hour wages (W) into
the following equation82:
Δ𝐿𝑖𝑡,𝑎 = 𝛽1Δ𝑆𝑖𝑡 + 𝛽2𝑊𝑖𝑡−1 + 𝛽3𝑋𝑖𝑡−1 + 𝛽4𝐴𝑖𝑡−1 + 𝛽5𝐿𝐹𝑖𝑡−1 + 𝛽6𝑅𝑘 + Δ휀𝑖𝑡,𝑎 , 𝑎 = 𝑛𝑓, 𝑓
The equation, including hourly wages, is the same Equation (6.10), except that hourly
wages in the initial period (Wi,t-1) are controlled. As can be seen in Table 6.7, the
reduction of land fragmentation leads to the reduction of farm labour supply, and an
increase in nonfarm labour supply, after controlling hourly wages. Using hourly wages
in the initial period reduces the endogeneity problem of this variable in the regression.
The result obtained using data from VHLSS surveys is consistent. I also test the effect
of hourly wages on nonfarm labour supply and the result is still consistent, as with the
case without hourly wages.
82 Mean hourly real wages (thousand VND) for farm households who have at least one member
participating in nonfarm employment are 2.75. Wages are deflated to January 2000 prices. This mean is
much lower compared with 4.56 for the whole sample.

203
Table 6.7 Determinants of farm and nonfarm labour supply using first difference
method and controlling hour wages
Farm labour supply
Nonfarm labour supply
Variables Coef. Standard
error Coef.
Standard
error
Simpson index 0.531* 0.314
-0.362 0.319
Hour wages -0.313** 0.133
1.716*** 0.091
Annual crop land 0.035 0.049
-0.093* 0.052
Age -0.049*** 0.006
-0.030*** 0.005
Household members, from 15 to 60
years old, people 0.316*** 0.076
0.327*** 0.072
Dependency ratio (%) 4.382*** 0.370
1.098*** 0.346
Mean education of working age men 0.178*** 0.036
0.163*** 0.034
Mean education of working age women 0.062* 0.034
0.085** 0.034
Access to formal credit -0.024 0.155
0.067 0.154
Log of assets -0.030 0.022
0.005 0.022
Access to asphalt road 0.419** 0.167
0.388** 0.167
Access to electricity 0.107 0.199
-0.193 0.197
Access to post office -0.348* 0.205
0.097 0.212
Access to extension -0.283 0.359
-0.262 0.359
Having business units in commune 0.162 0.176
0.316* 0.178
Having craft villages in commune -0.438* 0.249
0.474* 0.251
Disasters in commune 0.082 0.069
-0.037 0.068
Having employment programs in
commune -0.073 0.192
-0.125 0.192
Having infrastructure programs in
commune -0.029 0.158
-0.046 0.157
Having educational and vocational
programs -0.505** 0.210
-0.110 0.202
Having member working in state
economic sector -0.480 0.329
0.592* 0.308
Having member working in private
economic sector -0.146 0.424
0.692* 0.380
Having member working on household's
own business -1.280*** 0.184
-0.609*** 0.207
Regions Yes
Yes
Constant 4.593*** 0.568
3.222*** 0.570
N 2014
2014
R2 0.172
0.246
Notes: Standard errors are robust; the dependent variables are expressed as logs; ∗, ∗∗, ∗∗∗ indicates that
the corresponding coefficients are significant at the 10%, 5%, and 1% levels, respectively.
204
6.8 Concluding remarks
Economic growth in developing countries is accompanied by the movement of farm
labour out of agriculture. It is widely recognized that improving agricultural
productivity leads to rising rural income, and poverty reduction (Warr 2006). Although
Vietnam is one of the leading rice exporters in the world, rice farmers are being kept in
low income (Chapter 3). In addition, rice consumption is falling in nearly all of Asia,
and plus the expansion of rice output and exports in some countries (Timmer 2013).
Therefore, it is no surprise that increased attention has been given in recent years by
development institutions (such as the World Bank, ADB and governments) to the
potential for expansion of the rural nonfarm economy as a source of income growth
and poverty reduction, as well as economic diversification. Better appreciation of how
factors such as land reforms affect the direction and pace of rural transformation and
productivity is critical to the investigation of the underlying dynamics and to support
public policy formations. However, empirical studies in this area are still lacking.
This chapter hypothesises that land reform through the reduction of land fragmentation
is a determinant of the ease with which this question can be answered. In addition, this
chapter also tests the hypothesis that the impacts of agricultural productivity growth on
economic diversification depend on the factor bias of technical change. Theoretically,
using this assumption of technical change results in the conclusion that the increase in
agricultural productivity slows the rural structure transformation. Conversely, if the
technical change is factor-biased, opposite conclusions can be drawn.
By expanding the theoretical framework of Jia and Petrick (2013), Acemoglu (2010)
and arguments in Foster and Rosenzweig (2004 and 2008), this chapter develops the
theoretical analysis using the Cobb-Douglas and CES production functions, with
different assumptions on technical changes. Based on theoretical analysis, if a technical
change is Hicks-neutral, it leads to more on-farm labour supply. Conversely, if
technical change is labour saving and the elasticity of substitution is low enough, then
it can reduce farm labour supply and release more labour to other sectors. The chapter
tests these theoretical predictions by developing an empirical analysis of the impact of
land consolidation on nonfarm and farm outcomes.
The study uses the method of panel data and the correlated random effect model to
control the unobserved heterogeneity and sample selection bias. It finds that the
205
reduction of land fragmentation decreases farm labour supply, labour intensity and
improve farm profits and productivity. If land fragmentation declines by 1 per cent,
farm labour supply decreases by 0.36 per cent. Farm profits and productivity per
hectare increase by 0.12 per cent and 0.055 per cent, respectively. Similarly, land
consolidation may release more farm labour to nonfarm sectors, and increase nonfarm
profits. The empirical evidence also shows that factor biased technical change plays an
important role in explaining the effect of agricultural productivity on economic
diversification and income in Vietnam. Therefore, these results are consistent with the
theoretical prediction that the application of labour savings agricultural technical
changes reduces labour demand and induces labour reallocation in farm households.
The chapter also points to a linkage between the farm and nonfarm sector. The
productivity improvement in the farm sector will promote the development of the
nonfarm economy and economic diversification of rural households. Evidence
provided in the chapter indicates that land consolidation is an appropriate public policy
in light of declining agricultural growth in Vietnam. The issues of land use have
become an important threshold that Vietnam needs to reform despite increasing public
investment in agriculture in recent years. As Warr (2009) concludes, these released
resources are used more productively in other sectors and improve the productivity of
the country. In addition, the expansion of and land intuitions related to develop land
markets, such as land ownership rights and the promotion of land rental markets, are
key factors in the next reforms if Vietnam is to accelerate the land consolidation
process. Consolidation is mainly implemented through plot exchange and much
depends greatly on the quality of land governance.
Otsuka (2013) finds that in the economic development in Asia, in order to reduce labour
costs due to rising rural wages, larger farm size with less fragmentation needs to be
promoted, along with mechanisation. The consolidation of parcels of land is needed to
promote large mechanization and maintain the comparative advantage in agriculture. The
reduction of land fragmentation will create more incentives to apply mechanisation in
farming production and improve productivity. As a result, it may release more labour to
other sectors of the economy. As Vietnam appears to have a labour surplus, the real
benefits to farm households from land consolidation may not be apparent until the real
opportunity cost of farm labour begins to rise. However, this opportunity cost is affected
by factors such as the availability of employment opportunities for the family members,
wage rates, the level of education, and the time of year and seasons. Thus, the creation of

206
off-farm jobs and labour allocation to other sectors will be a key policy framework for
Vietnam’s agricultural and rural development.
In addition, education, and locational factors also play an important role in boosting the
participation into nonfarm activities of farm households. Although they are only control
variables, the coefficients are consistent with the findings in the literature review related
to the determinants of economic diversification. Therefore, the reduction of land
fragmentation is a necessary condition, while the improvement of education and
locational factors are sufficient conditions that households can diversify their livelihoods.
However, this conclusion should be further tested in future research.
While the empirical results indicate that land consolidation encourages labour
allocation and results in the diversification of economic activities of farm households,
that argument should be taken with cautions. It is necessary for future research to
capture the changes of prices of goods and sources of migration. In addition, the effect
of uncertainties such ash shocks and risks on smallholder decision-making is also
neglected. These factors play an important role in households’ behaviour in smoothing
income and consumption. Thus, future research should capture both shocks and risk to
understand more about labour allocation and economic diversification of farm
households. In addition, the analysis examines a sample of continuously existing
farms, operated either full-time or part-time. Farm exits are not considered. Improved
opportunities to consolidate farm land due to better functioning land markets may
convince some of the least productive farmers to give up farming altogether, and earn
their living fully from nonfarm sources. This process may well increase the number of
urban job seekers, and may lead to increasing specialization and differentiation within
the pool of Vietnamese rural households.

207
Appendices of Chapter 6
Appendix 6.1 Mathematical proof of theoretical research in Section 6.3.1
The expression must satisfy the condition [1 +1
𝜎−1𝜔−1𝛾(𝛼2𝐿)
𝜎−1
𝜎 ] > 0 if we expect
𝜕𝑀𝑃𝐿
𝜕𝛼2< 0 in the case of σ<1 (labour and land are complements in agricultural
production). In order to have[1 +1
𝜎−1𝜔−1𝛾(𝛼2𝐿)
𝜎−1
𝜎 ] > 0, we have:
1 > −1
𝜎−1𝜔−1𝛾(𝛼2𝐿)
𝜎−1
𝜎 where: 𝜔 = [ 𝛾(𝛼2𝐿)𝜎−1
𝜎 + (1 − 𝛾)(𝛼3𝐴)𝜎−1
𝜎 ]
−𝜔−1𝛾(𝛼2𝐿)𝜎−1
𝜎 < −(1 − 𝜎) → 𝜎 < 1 − 𝜔−1𝛾(𝛼2𝐿)𝜎−1
𝜎
We have:
𝜎 < 1 −𝛾(𝛼2𝐿)
𝜎−1𝜎
𝜔
𝜎 < 1 −𝛾(𝛼2𝐿)
𝜎−1𝜎
[ 𝛾(𝛼2𝐿)𝜎−1
𝜎 + (1 − 𝛾)(𝛼3𝐴)𝜎−1
𝜎 ]=
(1 − 𝛾)(𝛼3𝐴)𝜎−1
𝜎
[ 𝛾(𝛼2𝐿)𝜎−1
𝜎 + (1 − 𝛾)(𝛼3𝐴)𝜎−1
𝜎 ]
As a result, 𝜕𝑀𝑃𝐿
𝜕𝛼2< 0 if and only if:
𝜎 <(1 − 𝛾)(𝛼3𝐴)
𝜎−1𝜎
𝛾(𝛼2𝐿)𝜎−1
𝜎 + (1 − 𝛾)(𝛼3𝐴)𝜎−1
𝜎
< 1
If the elasticity of substitution fails to satisfy the condition of Equation (6.3) in Chapter
6, and is less than one, labour augmenting technical change is not strong labour
savings. Hence, an increase in α2 will have a positive impact on the farm marginal
product of labour, 𝜕𝑀𝑃𝐿
𝜕𝛼2> 0.
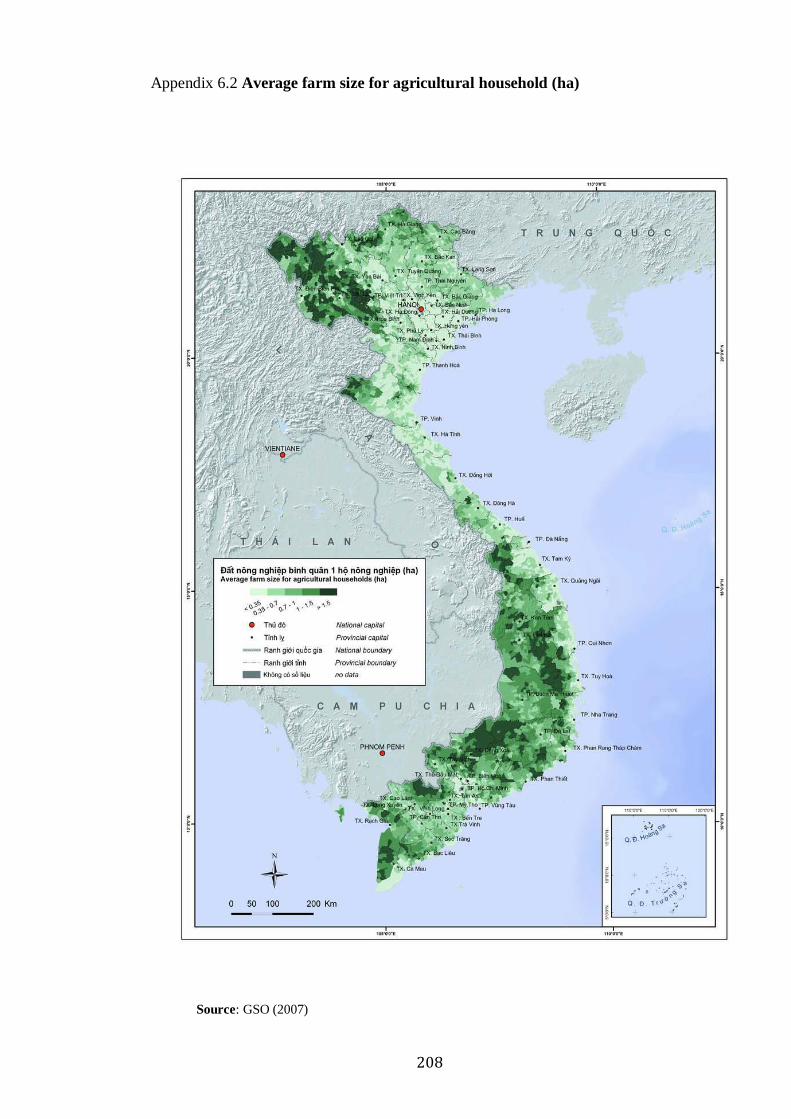
208
Appendix 6.2 Average farm size for agricultural household (ha)
Source: GSO (2007)

209
Appendix 6.3 The effects of land fragmentation on farm outcomes, using the first
difference method-log of plots
Farm labour
supply Farm
profits Farm output
Number of
individuals in farming
activities
Log of plots 0.355*** -0.115*** -0.055*** 0.051
Annual crop land 0.048 0.194*** -0.022*** -0.016
Age -0.047*** -0.003** 0.000 -0.007*** Household members, from 15 to 60
years old, people 0.260*** -0.020 0.003 0.010
Dependency ratio (%) 4.408*** -0.080 -0.016 0.358***
Mean education of working age men 0.180*** 0.005 0.003 0.024**
Mean education of working age women 0.065* 0.015* 0.002 0.008
Access to formal credit -0.012 0.048 0.008 -0.027
Log of assets -0.025 -0.016*** 0.002 0.003
Access to asphalt road 0.407** -0.032 -0.001 -0.039
Access to electricity 0.111 -0.025 -0.002 -0.070
Access to post office -0.341* 0.057 -0.010 0.057
Access to extension -0.233 0.027 0.003 -0.013
Having business units in commune 0.172 -0.016 0.001 -0.123**
Having craft villages in commune -0.452* -0.051 -0.003 0.000
Disasters in commune 0.088 -0.027* 0.005 0.022 Having employment programs in
commune -0.101 -0.037 -0.007 0.084
Having infrastructure programs in commune -0.049 -0.051 0.002 0.017
Having educational and vocational
programs -0.524** 0.033 -0.025* -0.058
Having member working in state economic sector -0.890*** -0.105 0.001 -0.054
Having member working in private
economic sector -0.463 -0.051 -0.021 -0.007 Having member working on
household's own business -1.139*** -0.118*** 0.005 -0.540***
North East -0.293 -0.011 -0.001 -0.058
North West 0.768* -0.482*** -0.004 0.249
North Central Coast 0.066 0.075* 0.001 -0.076
South Central Coast 0.326 0.024 -0.016 -0.176**
Central Highlands 0.356 -0.128 -0.022 0.251
South East 0.537 -0.095 -0.028 0.156
Mekong River Delta 0.467* -0.038 0.001 0.125
Constant 4.346*** -0.231 0.131*** 0.793***
N 2014 1937 2014 2014
R2 0.171 0.095 0.067 0.073 Notes: Standard errors are robust through the cluster option; All dependent variables are expressed as
log change; ∗, ∗∗, ∗∗∗ indicates that the corresponding coefficients are significant at the 10%, 5%, and
1% levels, respectively;
Source: Calculated from VHLSS 2004 and 2006.

210
Appendix 6.4 The effects of land fragmentation on farm outcomes using the first
difference method-the Simpson index
Farm labour
supply Farm
profits Farm output
No of
individuals in farming
activities
Simpson index 0.533* -0.109 -0.092*** 0.200**
Annual crop land 0.049 0.189*** -0.022*** -0.012
Age -0.048*** -0.003** 0.000 -0.007***
Household members, from 15 to 60 years old, people 0.266*** -0.021 0.002 0.010
Dependency ratio (%) 4.423*** -0.086 -0.018 0.356***
Mean education of working age men 0.174*** 0.007 0.004* 0.023** Mean education of working age
women 0.063* 0.016** 0.002 0.008
Access to formal credit -0.020 0.050 0.009 -0.027
Log of assets -0.025 -0.016*** 0.002 0.003
Access to asphalt road 0.422** -0.035 -0.003 -0.034
Access to electricity 0.125 -0.032 -0.003 -0.074
Access to post office -0.353* 0.062 -0.009 0.058
Access to extension -0.247 0.031 0.005 -0.015
Having business units in commune 0.152 -0.009 0.004 -0.126**
Having craft villages in commune -0.468* -0.047 -0.001 -0.002
Disasters in commune 0.088 -0.026* 0.005 0.023 Having employment programs in
commune -0.077 -0.045 -0.010 0.087
Having infrastructure programs in commune -0.033 -0.058* -0.001 0.017
Having educational and vocational
programs -0.518** 0.031 -0.026** -0.057
Having member working in state economic sector -0.877*** -0.107* -0.002 -0.051
Having member working in private
economic sector -0.477 -0.049 -0.019 -0.006 Having member working on
household's own business -1.129*** -0.122*** 0.004 -0.539***
North East -0.222 -0.034 -0.012 -0.049
North West 0.807** -0.492*** -0.009 0.248
North Central Coast 0.075 0.073* -0.001 -0.075
South Central Coast 0.315 0.024 -0.014 -0.183**
Central Highlands 0.294 -0.112 -0.012 0.233
South East 0.550 -0.093 -0.030 0.158
Mekong River Delta 0.463* -0.028 0.002 0.127
Constant 4.280*** -0.175 0.142*** 0.772***
N 2014 1937 2014 2014
R2 0.17 0.087 0.053 0.074
Notes: Standard errors are robust through the cluster option; All dependent variables are expressed as
log change; ∗, ∗∗, ∗∗∗ indicates that the corresponding coefficients are significant at the 10%, 5%, and
1% levels, respectively;
Source: Calculated from VHLSS 2004 and 2006

211
Appendix 6.5 The effects of land fragmentation on nonfarm outcomes without
selection correction using first difference method-the Simson index
Independent variables
Nonfarm labour
supply
Nonfarm
profits
Simpson index -0.646* -0.233
Annual crop land -0.056 0.105
Age -0.030*** -0.023*** Household members, from 15 to 60 years old,
people 0.323*** 0.076
Dependency ratio (%) 1.565*** 1.587***
Mean education of working age men 0.236*** 0.113**
Mean education of working age women 0.141*** 0.120**
Access to formal credit 0.061 0.132
Log of assets -0.009 0.000
Access to asphalt road 0.531*** 0.099
Access to electricity -0.264 0.253
Access to post office -0.012 0.073
Access to extension -0.337 -0.275
Having business units in commune 0.527*** 0.507**
Having craft villages in commune 0.064 -0.683**
Disasters in commune -0.052 -0.118
Having employment programs in commune -0.023 0.232
Having infrastructure programs in commune -0.109 0.065
Having educational and vocational programs -0.216 -0.421
Having member working in state economic sector -0.239 -2.005***
Having member working in private economic
sector -0.506 -2.910*** Having member working on household's own
business -0.275 -0.594**
North East -1.042*** 0.009
North West -0.633 0.811
North Central Coast -0.899*** 0.010
South Central Coast 0.469 1.226***
Central Highlands -0.425 0.325
South East -0.519 0.228
Mekong River Delta -0.684** 0.479
Constant 2.729*** -0.077
N 2014 2014
R2 0.102 0.07
Notes: The first difference method is used; Standard errors are robust through the cluster option; All
dependent variables are expressed as the log change; ∗, ∗∗, ∗∗∗ indicates that the corresponding
coefficients are significant at the 10%, 5%, and 1% levels, respectively;
Source: Calculated from VHLSS 2004 and 2006

212
Appendix 6.6 The effects of land fragmentation on nonfarm outcomes without
selection correction using first difference-log of plots
Independent variables Nonfarm labour supply Nonfarm profits
Log of plots -0.324** -0.225
Annual crop land -0.051 0.103
Age -0.031*** -0.023***
Household members, from 15 to 60 years old, people 0.326*** 0.080
Dependency ratio (%) 1.574*** 1.600***
Mean education of working age men 0.230*** 0.109**
Mean education of working age women 0.139*** 0.118**
Access to formal credit 0.056 0.127
Log of assets -0.009 0.001
Access to asphalt road 0.548*** 0.107
Access to electricity -0.259 0.266
Access to post office -0.020 0.062
Access to extension -0.349 -0.283
Having business units in commune 0.508*** 0.494**
Having craft villages in commune 0.049 -0.693**
Disasters in commune -0.051 -0.120
Having employment programs in commune -0.001 0.248
Having infrastructure programs in commune -0.097 0.077
Having educational and vocational programs -0.210 -0.417
Having member working in state economic sector -0.225 -1.999***
Having member working in private
economic sector -0.514 -2.921*** Having member working on household's
own business -0.267 -0.588**
North East -0.979*** 0.055
North West -0.605 0.841*
North Central Coast -0.893*** 0.017
South Central Coast 0.451 1.224***
Central Highlands -0.493 0.294
South East -0.507 0.236
Mekong River Delta -0.685** 0.474
Constant 2.655*** -0.108
N 2014 2014
R2 0.103 0.07
Notes: The first difference method is used; Standard errors are robust through the cluster option; All
dependent variables are expressed as the log change; ∗, ∗∗, ∗∗∗ indicates that the corresponding
coefficients are significant at the 10%, 5%, and 1% levels, respectively;
Source: Calculated from VHLSS 2004 and 2006
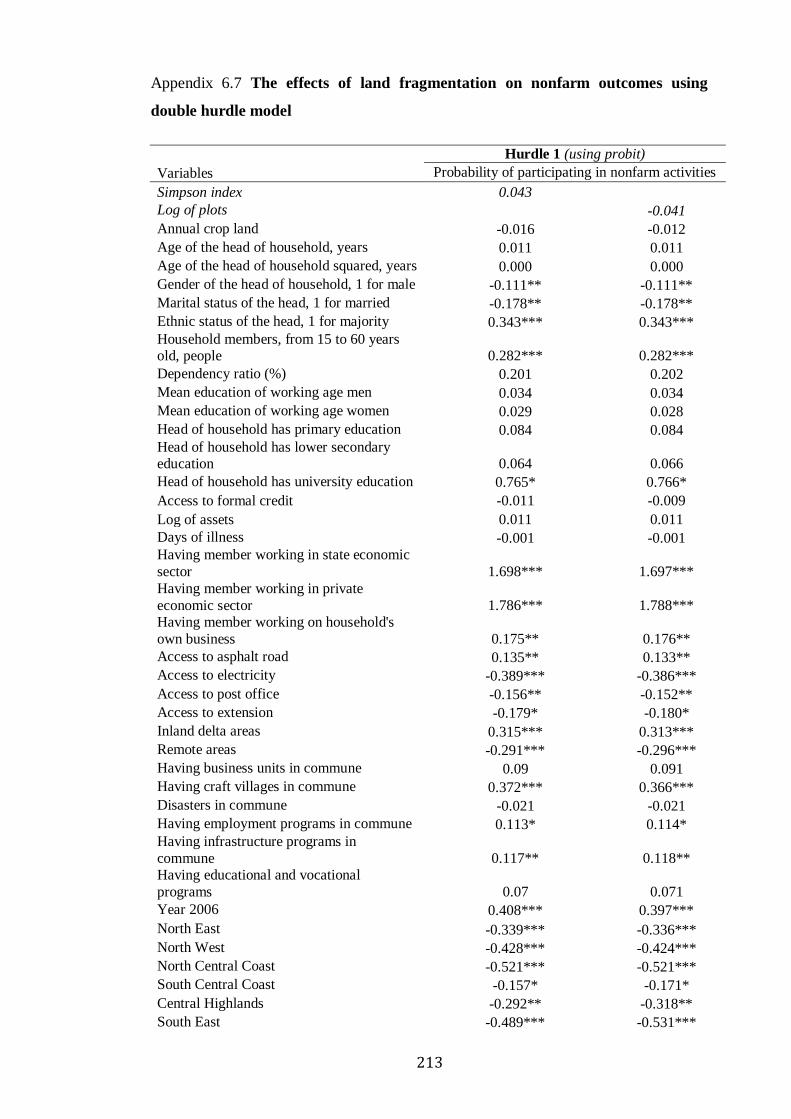
213
Appendix 6.7 The effects of land fragmentation on nonfarm outcomes using
double hurdle model
Variables
Hurdle 1 (using probit)
Probability of participating in nonfarm activities
Simpson index 0.043
Log of plots
-0.041
Annual crop land -0.016 -0.012
Age of the head of household, years 0.011 0.011
Age of the head of household squared, years 0.000 0.000
Gender of the head of household, 1 for male -0.111** -0.111**
Marital status of the head, 1 for married -0.178** -0.178**
Ethnic status of the head, 1 for majority 0.343*** 0.343***
Household members, from 15 to 60 years old, people 0.282*** 0.282***
Dependency ratio (%) 0.201 0.202
Mean education of working age men 0.034 0.034
Mean education of working age women 0.029 0.028
Head of household has primary education 0.084 0.084
Head of household has lower secondary education 0.064 0.066
Head of household has university education 0.765* 0.766*
Access to formal credit -0.011 -0.009
Log of assets 0.011 0.011
Days of illness -0.001 -0.001 Having member working in state economic
sector 1.698*** 1.697***
Having member working in private
economic sector 1.786*** 1.788*** Having member working on household's
own business 0.175** 0.176**
Access to asphalt road 0.135** 0.133**
Access to electricity -0.389*** -0.386***
Access to post office -0.156** -0.152**
Access to extension -0.179* -0.180*
Inland delta areas 0.315*** 0.313***
Remote areas -0.291*** -0.296***
Having business units in commune 0.09 0.091
Having craft villages in commune 0.372*** 0.366***
Disasters in commune -0.021 -0.021
Having employment programs in commune 0.113* 0.114*
Having infrastructure programs in
commune 0.117** 0.118** Having educational and vocational
programs 0.07 0.071
Year 2006 0.408*** 0.397***
North East -0.339*** -0.336***
North West -0.428*** -0.424***
North Central Coast -0.521*** -0.521***
South Central Coast -0.157* -0.171*
Central Highlands -0.292** -0.318**
South East -0.489*** -0.531***

214
Mekong River Delta -0.698*** -0.751***
Constant -1.135*** -1.130*** Pseudo R2 0.2765 0.2766
Mundlak fixed effects Yes Yes
Number of observations 4028 4028
Hurdle 2 (using truncreg)
Variables
Nonfarm
labour
supply
Nonfarm profits
Nonfarm
labour
supply
Nonfarm profits
Simpson index
-0.120* -0.291***
Log of plots -0.026 -0.154***
Annual crop land (ha) -0.001 -0.053*** 0.012 0.000
Age of the head of household, years -0.018 -0.022 -0.018 -0.028
Age of the head of household
squared, years 0.000 0.000 0.000 0.000* Gender of the head of
household, 1 for male 0.002 -0.007 0.002 -0.008
Marital status of the head, 1 for married -0.006 0.151** -0.004 0.148*
Ethnic status of the head, 1 for
majority 0.129** 0.438*** 0.132** 0.441***
Household members, from 15 to 60 years old 0.193*** 0.231*** 0.195*** 0.224***
Dependency ratio (%) 0.371** 0.863*** 0.373** 1.005***
Mean education of working age men (years) -0.009 0.066*** -0.011 0.004
Mean education of working age
women 0.004 0.040*** 0.003 0.037 Head of household has primary
education 0.038 0.138** 0.037 0.145***
Head of household has lower
secondary education 0.017 0.103** 0.016 0.099** Head of household has
university education -0.131 0.011 -0.137 -0.011
Access to formal credit -0.028 0.029 -0.028 0.031 Log of assets -0.005 -0.002 -0.005 -0.009
Days of illness 0.000 0.000 0.000 0.000
Having member working in state
sector 0.237*** 0.488*** 0.235*** 0.480*** Having member working in
private sector 0.238*** 0.290*** 0.240*** 0.301***
Having member working on their own business -0.062 -0.077 -0.063* -0.081**
Access to asphalt road 0.039 0.040 0.040 0.043
Access to electricity -0.043 -0.024 -0.045 -0.043 Access to post office -0.038 -0.134*** -0.035 -0.132**
Access to extension -0.020 -0.057 -0.021 -0.061
Inland delta areas 0.029 0.054 0.031 0.065
Remote areas -0.033 -0.131 -0.035 -0.118 Having business units in
commune 0.063* 0.146*** 0.065* 0.154***
Having craft villages in commune 0.050 0.093* 0.048 0.101*
Disasters in commune -0.003 -0.020 -0.002 -0.015

215
Having employment programs in
commune -0.023 0.015 -0.025 0.004
Having infrastructure programs in commune 0.002 -0.059 0.003 -0.062
Having educational and
vocational programs -0.033 -0.102* -0.036 -0.109* Year 2006 0.200*** 0.034 0.200*** 0.062***
North East -0.055 -0.175** -0.059 -0.191**
North West -0.280*** -0.250* -0.287*** -0.282* North Central Coast -0.196*** -0.396*** -0.195*** -0.393***
South Central Coast -0.055 0.095 -0.059 0.108
Central Highlands -0.015 -0.486** -0.031 -0.471*** South East 0.023 0.276*** 0.004 0.304***
Mekong River Delta -0.195*** 0.015 -0.210*** 0.086
Constant 7.766*** 8.338*** 7.805*** 8.596***
N 2008 2008 2008 2008 Mundlak fixed effects Yes Yes Yes Yes
Notes: Standard errors are robust through the cluster option; All dependent variables are expressed as
the log change; ∗, ∗∗, ∗∗∗ indicates that the corresponding coefficients are significant at the 10%, 5%,
and 1% levels, respectively;
Source: Calculated from VHLSS 2004 and 2006.

216
Appendix 6.8 The effect of land fragmentation on nonfarm outcomes using
Wooldridge (1995)
Independent variables Nonfarm
labour supply Nonfarm profits
Nonfarm labour supply
Nonfarm profits
Simpson index -0.122* -0.297***
Log of plots
-0.023 -0.143***
Annual crop land 0.014 0.006 0.011 0.008
Age of the head of household, years -0.017 -0.025 -0.017 -0.025
Age of the head of household squared,
years 0.000 0.000 0.000 0.000
Gender of the head of household, 1 for
male 0.006 0.007 0.007 0.008
Marital status of the head, 1 for married 0.002 0.170*** 0.001 0.170***
Ethnic status of the head, 1 for majority 0.118** 0.386*** 0.116** 0.379***
Household members, from 15 to 60 years
old, people 0.186*** 0.194*** 0.185*** 0.190***
Dependency ratio (%) 0.372* 0.997*** 0.371* 0.988***
Mean education of working age men -0.014 -0.003 -0.011 0.003
Mean education of working age women 0.001 0.030 0.002 0.031
Head of household has primary education 0.035 0.138*** 0.036 0.142***
Head of household has lower secondary
education 0.013 0.090* 0.015 0.095**
Head of household has university
education -0.144 -0.034 -0.141 -0.034
Access to formal credit -0.026 0.035 -0.026 0.038
Log of assets -0.006 -0.010 -0.006 -0.010
Days of illness 0.000 0.000 0.000 0.001
Having member working in state economic
sector 0.193*** 0.332*** 0.197*** 0.331***
Having member working in private economic sector 0.205*** 0.179*** 0.204*** 0.167**
Having member working on household's
own business -0.062 -0.074 -0.060 -0.069
Access to asphalt road 0.036 0.031 0.036 0.027
Access to electricity -0.034 -0.007 -0.033 0.003
Access to post office -0.030 -0.106* -0.033 -0.103*
Access to extension -0.016 -0.042 -0.015 -0.036
Inland delta areas 0.021 0.026 0.019 0.017
Remote areas -0.023 -0.080 -0.018 -0.072
Having business units in commune 0.062* 0.141*** 0.061* 0.144***
Having craft villages in commune 0.037 0.062 0.039 0.050
Disasters in commune -0.002 -0.013 -0.002 -0.013
Having employment programs in
commune -0.029 -0.010 -0.027 -0.005
Having infrastructure programs in commune 0.001 -0.070* 0.001 -0.069*
Having educational and vocational
programs -0.036 -0.109* -0.034 -0.107*
Inverse Mill ratio (2004) -0.059 -0.164* -0.057 -0.177*
Inverse Mill ratio (2006) -0.090 -0.360*** -0.087 -0.371***
Year 2006 0.204*** 0.124** 0.203*** 0.095

217
North East -0.048 -0.153** -0.044 -0.130*
North West -0.275*** -0.239* -0.265*** -0.188
North Central Coast -0.180*** -0.338*** -0.181*** -0.335***
South Central Coast -0.056 0.114* -0.051 0.100
Central Highlands -0.022 -0.438** 0.001 -0.412**
South East 0.021 0.365*** 0.043 0.350***
Mekong River Delta -0.187*** 0.165** -0.166*** 0.141*
Constant 7.863*** 8.789*** 7.856*** 8.736***
R2 0.249 0.312 0.248 0.314
Mundlak fixed effects Yes Yes Yes Yes
Notes: All dependent variables are expressed as the log change; ∗, ∗∗, ∗∗∗ indicates that the
corresponding coefficients are significant at the 10%, 5%, and 1% levels, respectively;
Source: Calculated from VHLSS 2004 and 2006.

218
Appendix 6.9 Factors influencing the land fragmentation of a farm household,
using first difference
Independent variables Log of plots Simpson index
Coef. P value Coef. P value
Annual crop land -0.036*** 0.000
-0.025*** 0.000
Age 0.000 0.711
0.000 0.683
Household members, from 15 to 60 years old,
people 0.022* 0.077
0.005 0.320
Dependency ratio (%) 0.096 0.118
0.035 0.188
Mean education of working age men -0.014** 0.037
0.002 0.439
Mean education of working age women -0.010* 0.080
-0.002 0.382
Access to formal credit -0.031 0.250
-0.006 0.560
Log of assets 0.007* 0.078
0.004** 0.028
Access to asphalt road 0.020 0.494
-0.016 0.193
Access to electricity 0.084** 0.010
0.037*** 0.008
Access to post office -0.078** 0.025
-0.026* 0.089
Access to extension -0.048 0.452
-0.003 0.905
Having business units in commune -0.059** 0.042
-0.001 0.969
Having craft villages in commune -0.040 0.317
0.002 0.905
Disasters in commune -0.021* 0.055
-0.013*** 0.006
Having employment programs in commune 0.059* 0.071
-0.003 0.809
Having infrastructure programs in commune 0.058** 0.034
0.012 0.289
Having educational and vocational programs 0.019 0.599
0.000 0.975
Having member working in state economic
sector 0.011 0.814
-0.016 0.431
Having member working in private economic sector -0.067 0.329
-0.022 0.372
Having member working on household's own
business 0.031 0.377
0.002 0.896
North East 0.209*** 0.000
0.008 0.649
North West 0.162** 0.019
0.041 0.146
North Central Coast 0.043 0.270
0.011 0.517
South Central Coast 0.046 0.349
0.048*** 0.010
Central Highlands -0.039 0.585
0.083*** 0.009
South East 0.068 0.408
0.012 0.716
Mekong River Delta -0.014 0.757
-0.009 0.666
Transfer of land use right certificates in the commune -0.015*** 0.008
-0.006** 0.011
Constant -0.062 0.562
0.086* 0.058
N 2014
2014
R2 0.077 0.052 Notes: Standard errors are robust through the cluster option; All dependent variables are expressed as
the log change; ∗, ∗∗, ∗∗∗ indicates that the corresponding coefficients are significant at the 10%, 5%,
and 1% levels, respectively.
Source: Calculated from VHLSS 2004 and 2006.

219
Appendix 6.10 Testing the endogeneity of land fragmentation, using the control
function
Independent variables Farm labour supply
Coef. SE Coef. SE
Log of plots -0.393 2.137
Residual of log of plots 0.751 2.138
Simpson index
-0.982 5.349
Residual of Simpson index
1.520 5.358
Annual crop land 0.021 0.092 0.010 0.144
Age -0.048*** 0.006 -0.047*** 0.006
Household members, from 15 to 60 years old,
people 0.277*** 0.087 0.274*** 0.078
Dependency ratio (%) 4.478*** 0.425 4.475*** 0.416
Mean education of working age men 0.169*** 0.046 0.177*** 0.038
Mean education of working age women 0.057 0.041 0.059 0.036
Access to formal credit -0.036 0.169 -0.030 0.159
Log of assets -0.020 0.026 -0.019 0.029
Access to asphalt road 0.421** 0.172 0.397** 0.190
Access to electricity 0.190 0.306 0.193 0.320
Access to post office -0.393 0.256 -0.388 0.242
Access to extension -0.260 0.368 -0.245 0.361
Having business units in commune 0.132 0.206 0.154 0.177
Having craft villages in commune -0.485* 0.268 -0.467* 0.251
Disasters in commune 0.074 0.082 0.069 0.098
Having employment programs in commune -0.049 0.239 -0.075 0.192
Having infrastructure programs in commune 0.004 0.222 -0.006 0.185
Having educational and vocational programs -0.511** 0.212 -0.518** 0.209
Having member working in state economic sector -0.881*** 0.283 -0.902*** 0.297
Having member working in private economic
sector -0.522 0.431 -0.518 0.422
Having member working on household's own
business -1.116*** 0.184 -1.126*** 0.173
North East -0.132 0.528 -0.206 0.258
North West 0.908 0.571 0.885* 0.490
North Central Coast 0.096 0.252 0.089 0.243
South Central Coast 0.351 0.294 0.381 0.365
Central Highlands 0.306 0.472 0.403 0.593
South East 0.564 0.402 0.549 0.399
Mekong River Delta 0.436 0.276 0.433 0.282
Constant 4.313*** 0.570 4.421*** 0.737
N 2014
2014
R2 0.172
0.17
Notes: Standard errors are robust through the cluster option; All dependent variables are expressed as
the log change; ∗, ∗∗, ∗∗∗ indicates that the corresponding coefficients are significant at the 10%, 5%,
and 1% levels, respectively;
Source: Calculated from VHLSS 2004 and 2006.

220
Chapter 7
Conclusions and policy implications
7.1 Main findings
Although there have been major land policy reforms in Vietnam, small farms continue
to dominate. Farms less than one hectare account for more than 85 per cent of the
country’s total 10 million farm households (GSO 2012). In the new setting of
industrialisation process and income growth, the ‘rice first’ policy and the place of
smallholder agriculture have recently been raised by policy makers in the discussion
on reforming agricultural policies. There has so far been no definitive policy resolution
of the optimal structure of Vietnam’s smallholder agriculture. The balance between
efficiency and equity, between lowering production costs and raising prices, is a
challenge for policy makers. As stated in Chapter 1, the objective of the thesis is to
contribute to designing appropriate agricultural development strategies for Vietnam,
based on empirical analysis at the farm household level. The thesis mainly focuses on
the following four policy issues: crop diversification; the development of the rural
nonfarm economy; land reforms directed towards land consolidation; and input
supporting policy for small farms.
The study contains seven chapters. All except Chapters 1 and 7 are written as one
consistent theme essay on the transformation of smallholder agriculture. The research
questions are addressed in three analytical core chapters, 4 to 6. Chapter 2 reviews
relevant theories and experience of the agricultural transformation in some Asian
countries in order to establish the stage for the ensuing analysis. I first review the Fei-
Ranis growth model of a labour-abundant economy for investigating the effect of
structural change on agriculture. Chapter 2 shows that the dual economy model does
not provide any insights into what happens on a micro-level that would enable people
to move up economically by participating in off-farm employment. I then present the
theory of induced technical change and institutional innovations by Hayami and Ruttan
(1985). Next, there is further more discussion on the agricultural problems of land-
poor countries, and the experience of some East Asian countries during agricultural
transformation. These discussions on both theories, and development experience,
imply that the comparative advantage of smallholder agriculture is declining in the
face of rising rural wages and the movement of labour to nonfarm sectors. In addition,
small-farm led agricultural growth based on cereal production is becoming less

221
relevant, and less able to avoid a widening income gap. In the final section, the chapter
discusses the analytical framework of policy reforms aimed at strengthening technical
changes and institutional innovations to improve agricultural productivity and
household incomes.
Chapter 3 provides an overview of Vietnam’s agricultural reforms and structural
transformation since 1986. The descriptive findings in this chapter show that although
agriculture’s share of Vietnam’s GDP has now shrunk to below 20 per cent, farming still
offers a livelihood for two-thirds of the country’s population and employs more than 50
per cent of Vietnam’s total workforce. Despite the successful story of food self-
sufficiency over the past decades, Vietnam’s agricultural transformation has been
following the path same as other East Asian economies. First, a prominent characteristic
of rice production in Vietnam is that it is carried out by a large number of rice farmers,
who have tiny and fragmented farms, and labour-intensive farming in light of rising
rural wages. The average farm sizes per household have shown virtually no increase
during this period of fast structural transformation. Second, Vietnam maintains its “rice
first” policy to ensure food self-sufficiency. Rice farmers have an economic incentive to
diversify their livelihoods because of the low income from rice production. They are
prevented from doing so by legal restrictions on land reallocation away from rice
production. This rice policy is in conflict with the desire of small farm households to
diversify their output. Finally, there is a conflict of objectives between food security
policy, and policy that promotes rural structural transformation, which requires the
development of off-farm employment. The expansion of rural nonfarm economies and
the increase in part-time farming, is a concern for policy makers in ensuring long-term
food security in Vietnam.
Chapter 4, 5, and 6 provide the analytical core of the thesis. Table 7.1 summarises the
research questions and the answers in each core chapter. Chapter 4 explores the merits of
crop diversification. Specifically, it measures the performance of diversified farms and
response of farm households to increasing cost stress using a stochastic input distance
function approach. Chapter 5 examines the effects of labour movement into nonfarm
activities on rural household production choices. The analysis uses panel data for Vietnam
from 2004 to 2006 and different methods (including the OLS first difference, 2SLS first
difference and matching techniques) to verify the consistency of the empirical results.
Chapter 6 investigates the impacts of land fragmentation on the economic diversity of
farm households. To develop the empirical analysis, a model is presented in which the
estimated impact of land fragmentation on economic diversification allows for non-
neutral technical change.

222
Table 7.1 Summary of research questions and main findings in Chapter 4, 5 and 6
Research questions Main findings
Chapter 4
- Does crop diversification
result in scale economies and
output complementarity in
agricultural production?
- Scale economies were found in multiple crop production. The elasticity of output with respect to total inputs is 1.075, implying that
when total inputs increase by 1 per cent, total outputs of production increase by 1.075 per cent. Equivalently, when total outputs
increase by 1 per cent, total costs of production rise by only 0.93 per cent. This finding reveals that slightly increasing returns to scale
are evident in Vietnam’s multiple crop production. In addition, the increase in rice production reduces the marginal utilization of inputs
for producing other crops. As a result, crop combinations result in cost savings in the production process. Thus, significant output
complementarity is found between rice production and other crops. This finding also implies the potential presence of economies of
scope, which has important economic performance implications.
- How can technical
efficiency be improved in a
multi-output environment?
- Another finding is that there is substantial technical inefficiency in multiple-crop farming implying opportunities to expand crop
output by 18.7 per cent without greater use of inputs or improved technologies in farm production. The mean technical efficiency
of multiple crop farming is higher than other estimates of previous studies focusing on only rice The improvement of education,
particularly for women and the reduction of the dependency ratio contribute to improving technical efficiency. The estimated
result shows that the impact of women’s education on technical efficiency is much greater than the impact of men’s education.
Furthermore, land reforms aimed at the reduction of land fragmentation and proper land rights contribute to improving technical
efficiency. Finally, the participation in nonfarm employment of family members also improves technical efficiency in multi-
output production.
- How does farm labour
respond to increasing cost
stress in multi-crop
production?
- Results also show that households with smallholder production respond to rising cost stress in multiple crop environments. Family
labour and other inputs such as fertilisers, pesticides and capital are complementary, which means that farm labour usage falls when
the prices of these inputs increase. This finding contributes to the literature on the ‘push’ factors of labour allocation in smallholder
farms. The result also shows that there is substitution between family labour and hired labour. Farm households can allocate more
hours to nonfarm work by hiring replacement workers on the farm.
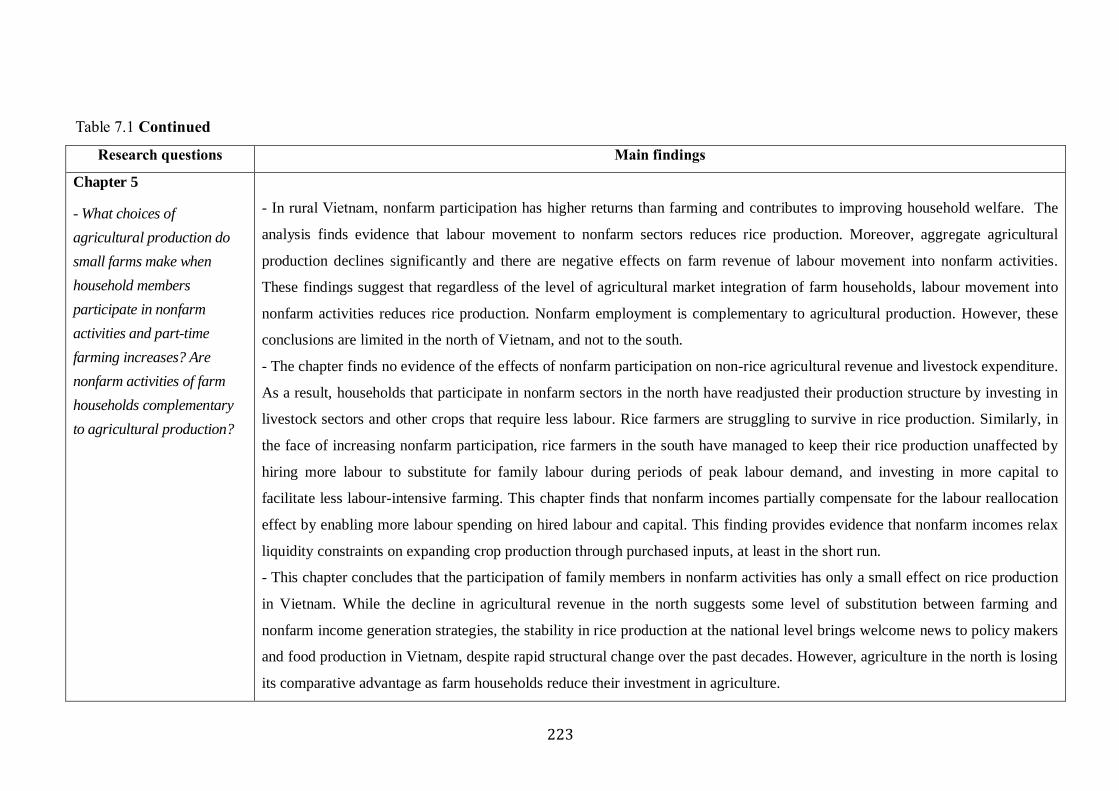
223
Table 7.1 Continued
Research questions Main findings
Chapter 5
- What choices of
agricultural production do
small farms make when
household members
participate in nonfarm
activities and part-time
farming increases? Are
nonfarm activities of farm
households complementary
to agricultural production?
- In rural Vietnam, nonfarm participation has higher returns than farming and contributes to improving household welfare. The
analysis finds evidence that labour movement to nonfarm sectors reduces rice production. Moreover, aggregate agricultural
production declines significantly and there are negative effects on farm revenue of labour movement into nonfarm activities.
These findings suggest that regardless of the level of agricultural market integration of farm households, labour movement into
nonfarm activities reduces rice production. Nonfarm employment is complementary to agricultural production. However, these
conclusions are limited in the north of Vietnam, and not to the south.
- The chapter finds no evidence of the effects of nonfarm participation on non-rice agricultural revenue and livestock expenditure.
As a result, households that participate in nonfarm sectors in the north have readjusted their production structure by investing in
livestock sectors and other crops that require less labour. Rice farmers are struggling to survive in rice production. Similarly, in
the face of increasing nonfarm participation, rice farmers in the south have managed to keep their rice production unaffected by
hiring more labour to substitute for family labour during periods of peak labour demand, and investing in more capital to
facilitate less labour-intensive farming. This chapter finds that nonfarm incomes partially compensate for the labour reallocation
effect by enabling more labour spending on hired labour and capital. This finding provides evidence that nonfarm incomes relax
liquidity constraints on expanding crop production through purchased inputs, at least in the short run.
- This chapter concludes that the participation of family members in nonfarm activities has only a small effect on rice production
in Vietnam. While the decline in agricultural revenue in the north suggests some level of substitution between farming and
nonfarm income generation strategies, the stability in rice production at the national level brings welcome news to policy makers
and food production in Vietnam, despite rapid structural change over the past decades. However, agriculture in the north is losing
its comparative advantage as farm households reduce their investment in agriculture.

224
Table 7.1 Continued
Research questions Main findings
Chapter 6
- Do land reforms directed
towards land consolidation
affect labour allocation and
economic diversity in farm
households? If so, how does
it affect them?
- Based on theoretical analysis, if a technical change is Hicks-neutral, it leads to more on-farm labour supply. Conversely, if
technical change is labour saving and the elasticity of substitution is low enough, then it can reduce farm labour supply and
release more labour to other sectors. The chapter has tested these theoretical predictions by developing an empirical analysis of
the impact of land consolidation on nonfarm and farm outcomes.
- The chapter finds that the reduction of land fragmentation reduces farm labour supply and labour intensity. In addition, it
improves farm profits and agricultural productivity. If land fragmentation declines by 1 per cent, farm labour supply decreases
by 0.36 per cent. Farm profits and productivity per hectare increase by 0.12 per cent and 0.055 per cent, respectively. Similarly,
land consolidation releases more farm labour to nonfarm sectors and increase nonfarm profits. The chapter uses the methods of
panel data and the correlated random effect model to control the unobserved heterogeneity and sample selection bias.
- The empirical evidence also shows that factor biased technical change plays an important role in explaining the effect of
agricultural productivity on economic diversification and income. If technical change is labour saving as in the case of land
consolidation, it results in the release of more farm labour. Therefore, these results are consistent with theoretical predictions
that the application of labour saving agricultural technical changes reduces labour demand and induces labour reallocation in
farm households. The chapter also points to a linkage between the farm and nonfarm sector. The productivity improvement in
the farm sector will promote the development of the nonfarm economy and economic diversification of households. From the
survey data from 2004 to 2006, there is no evidence that the emerging land markets support land consolidation.

225
7.2 Policy implications
Since 1989, after more than half a century of importing rice, along with famines
occurred in the 1970s and 1980s, Vietnam has implemented the ‘rice first’ policy to
sustain rice self-sufficiency. Policy makers are reluctant to change the ‘rice first’
policy because rising rice output and exports are considered important indicators of the
government’s success. As a result, the opportunity cost of rice production has
increased in recent years. While small rice farms are struggling to survive and have to
diversify their livelihoods, the current rice policy has blocked the conversion of paddy
land to other crops or nonfarm activities. More rice cannot solve the problem of food
insecurity when income from rice production is declining.
The thesis has some key policy implications for reforming Vietnam’s smallholder
agriculture. First, as discussed in the theoretical framework, land reform is a crucial factor
for maintaining the comparative advantage of agriculture in light of rising rural wages.
Second, the current ‘rice first’ policy should be relaxed to improve rural household
welfare. Third, crop diversification is a desirable strategy in the agricultural transformation
of Vietnam. Fourth, rice production at the national level is still stable, to a significant
extent, despite rising part-time farming of farm households. Fifth, due to increasing cost
stress, supporting policies related to inputs is important to maintain incentives in
agricultural production of diversified farms. Sixth, land reforms directed toward land
consolidation result in less labour-intensive farming and promote the economic diversity
of farm households. Finally, the creation of off-farm jobs and labour allocation to other
sectors is a key policy framework for Vietnam’s agricultural and rural development.
7.2.1 Crop diversification strategy
The policy implication of this research emphasises the need to design policies to
promote crop diversification for small farms - this has been found to improve
productivity through scale economies, output complementarity and technical efficiency
improvement. The Vietnamese government seems to give priority to rice self-
sufficiency policies rather than the incomes of farmers. Kompas et al. (2012) also
conclude that the mandate to grow rice in all provinces, (at least, in terms of defined
efficiency criteria), is not appropriate. The recent thrust of the Vietnamese government
to promote diversification in the Strategy of Agriculture and Rural Development
(2011-2020) is a positive step. Crop diversity should be expanded to improve the
226
incomes of farm households. Moreover, as part of an FAO nutrition-sensitive food
systems approach, crop diversification improves the nutritional health status of low-
income households through the increased production of nutrient-rich foods for direct
consumption and generation of the income needed to procure the amount and variety
of food that families need (FAO 2012).
In addition, the improvement of education, particularly for women, and the reduction
of the dependency ratio both contribute to improving the technical efficiency and
productivity of diversified farms. Thus, the development of a hired labour market and
training programs for women are desirable in order to encourage more women to
participate in the production process, and contribute to improving productivity and
efficiency.
7.2.2 The development of the nonfarm economy
It is widely recognised that low farm incomes in smallholder agriculture push working
members of land-poor farm households into nonfarm activities. Rural households are
diversifying their livelihoods and thereby improving household welfare. However, polices
that keep agricultural production stable place food self-sufficiency into conflict with the
goals of improvement of household welfare and rural structural transformation. Rozelle et
al. (1999) argue in the context of China that the policy tension facing policy makers is
whether the increase in household welfare is sufficient to offset the reduction in grain
output. Politically, policy makers who are concerned about food security that when more
farm labour moves into nonfarm employment, food security is compromised.
Consequently, food security policy always means the ‘rice first’ policy in Vietnam, despite
the declining trend of income from rice production.
The findings in this thesis show that rice production at the national level is still stable, in
spite of Vietnam’s rapid rural structural transformation. Therefore, such a policy should
aim to develop the nonfarm sector so as to provide ample employment opportunities for
the rural labour force. Vietnam should change its approach toward food security,
particularly the rice self-sufficiency policy. Food self-sufficiency does not imply food
security (Warr 2014). Rice farmers with small and fragmented landholdings are
struggling to survive and have to diversify their livelihoods. The increase in nonfarm
incomes contributes to improving the purchasing power of farm households. In
addition, credit reforms could support farm households by relaxing liquidity
227
constraints and thus promoting investment in farm production in response to increasing
labour movement out of farming. In addition, the development of labour markets in
rural areas is also important in alleviating the negative effect of the reduction in family
labour. If these reforms are successful, nonfarm income may be invested in expanding
nonfarm activities and facilitating sustainable rural transformation.
7.2.3 Land reforms directed toward land consolidation
Otsuka (2013 and 2015) finds that in the economic development of Asia, the
consolidation of land parcels is needed to promote large mechanisation and maintain
the comparative advantage in agriculture. The reduction of land fragmentation will
create more incentives to apply mechanisation in farming production and improve
productivity.
Evidence in this thesis indicates that land consolidation is an appropriate public policy.
The issues of land use have become an important threshold that Vietnam has get to reform
despite the increasing public investment in agriculture. Thus, if land policies encourage
more consolidated land holdings, they will release more farm labour and result in the
economic diversification of farm households. The findings shows that land reforms, such
as land consolidation programs, free up labour to work in other sectors, and to invest in the
creation of human capital. Furthermore, land reforms toward the reduction of land
fragmentation and proper land rights should be strengthened to improve technical
efficiency in multi-crop production. As Warr (2009) concludes, these released resources
are used more productively in other sectors and improve the productivity of the country. In
addition, the expansion of land intuitions to develop land markets, such as land ownership
rights and the promotion of land rental markets, are key factors for the next reforms if
Vietnam is to accelerate the land consolidation process, mainly implemented through plot
exchange and depends greatly on the quality of land governance.
7.2.4 Input supporting policy
The findings of Chapter 4 show that on diversified farms, input use is sensitive to the
cost of inputs. Family labour use falls if the costs of fertiliser, pesticides and seed
increase, implying that these inputs are complements. The discussion in Chapter 3 also
points to the cost stress that squeezes farmers’ profits. Policies that lead to more
incentives to invest in crop farming activities should focus on the reduction of input
costs. The government should spend more resources on reducing prices of

228
fertilizers, pesticides and hiring capital for farmers. The evidence on the elasticity of
substitution between farm labour and fertilisers and pesticides indicates that the decline
in the cost of these can have a positive effect on the probability that a household
demands family labour, which in turn can reduce the increasing trend of the
abandonment of agricultural production in rural Vietnam.
The adjustment of the cost structure also impacts on the rural labour market when
more farmers work for farm wages (Akram-Lodhi, 2005). The result shows that there
is substitution between family labour and hired labour. With the increasing
participation of smallholders in off-farm activities, the reliance on hired labour is more
important for producers. The farm household can allocate more hours to off-farm work
by hiring replacement workers on the farm. Therefore, it would be expected that a
large increase in government input subsidies would have a significant impact on the
flow of labour into farming activities. Warr and Yusuf (2014) find that in Indonesia
input subsidies such as fertiliser have large and positive impacts on unskilled wages.
7.3 Directions for further research
Although the three topics in this research address some questions about policy reforms
for smallholder agriculture in Vietnam, many questions remain unanswered and
therefore more studies are needed at the household level. First, do rising rural wages
result in more mechanization in agricultural production? In the future, it would be useful
if farm surveys captured the trend of mechanisation in crop production. Second, future
research should investigate the risk effects in understanding the economies of
diversification of farm households. Third, future research should examine the impact
that policy reforms such as agricultural diversification and land institutions have on
poverty reduction and household welfare. Fourth, future research needs to understand
better the behaviour of remaining members in a family related to farm production such
as incentives to work less or more. Fifth, the expansion of remittances from non-
household members may conceivably crowd out existing nonfarm incomes from current
household members and reduce incentives to work. The crowding out effects should be
further investigated in future research.
Sixth, return migration section should be surveyed in household living standard datasets
in Vietnam, particularly the migration history needed to capture information on those
non-household members who send remittances to local communities. In this case, it is

229
possible to use migration and remittances simultaneously in the framework of NELM
model. Finally, the analysis examined a sample of continuously existing farms, operated
either full-time or part-time. Farm exits were not considered. Future research should
capture the dynamics of employment to understand more fully household behaviour
during the agricultural transformation.

230
BIBLIOGRAPHY
Acemoglu, D 2001, ‘Factor prices and technical change: from induced innovations to
recent debates’, Paper prepared in honour to Edmund Phelps, Massachusetts Institute
of Technology.
Acemoglu, D 2010, ‘When does labor scarcity encourage innovation?’, Journal of
Political Economy, vol. 118, pp. 1037–78.
Ali, M & Byerlee, D 2002, ‘Productivity growth and resource degradation in
Pakistan’s Punjab: a decomposition analysis’, Economic Development and Cultural
Change, vol. 50, no. 4, pp. 839-63.
Anderson, K & Martin, W 2009, ‘Introduction and summary’, in K Anderson & W
Martin (eds), Distortions to agricultural incentives in Asia, The World Bank,
Washington, DC, pp. 3-82.
Aigner, DJ, Lovell, CAK & Schmidt, P 1977, ‘Formulation and estimation of
stochastic frontier production function models’, Journal of Econometrics, vol. 6, pp.
21–37.
Atkinson, SE & Cornwell, C & Honerkamp, O 1999, ‘Measuring and decomposing
productivity change: stochastic distance function estimation vs DEA’, Working Paper
99-478, Department of Economics, University of Georgia, Athens.
Akram-Lodhi, AH 2005, ‘Vietnam’s agriculture: processes of rich peasant
accumulation and mechanisms’, Journal of Agrarian Change, vol. 5, no. 1, pp. 73–
116.
Amuedo-Dorentes, C & Pozo, S 2006, ‘Migration, remittances, and male and female
employment patterns’, American Economic Review, vol. 96, no. 2, pp. 222–26.
Atamanov, A & Van den Berg, M 2012, ‘Participation and Returns in Rural Nonfarm
Activities: Evidence from the Kyrgyz Republic’, Agricultural Economics, vol. 43, no.
4, pp. 459–71.
Athukorala, P 2009, ‘Vietnam’, in K Anderson & W Martin (eds), Distortions to
agricultural incentives in Asia, World Bank, Washington, DC, pp. 281-302.
Bain, I 1993, Agricultural reform in Taiwan: from here to modernity?, The Chinese
University Press, Hong Kong.
Bardhan, P & Urdy, C 1999, Development Microeconomics, Oxford University Press,
New York.
Barker, R, Herdt, RW & Rose, B 1985, The rice economy of Asia, volume 1, Resources
for the Future, Inc, Washington, DC.
Barrett, B, Reardon, T & Webb, P 2001, ‘Nonfarm income diversification and
household livelihood strategies in rural Africa: concepts, dynamics, and policy
implications’, Food Policy, vol. 26, pp. 315–31.
Barrett, CB, Sherlund, SM & Adesina, AA 2008, ‘Shadow wages, allocative
inefficiency, and labor supply in smallholder agriculture’, Agricultural Economics,

231
vol. 38, pp. 21-34.
Barro, RJ 1974, ‘Are government bonds net wealth?’, Journal of Political Economy,
vol. 82, pp. 1095–1117.
Barton, C 2015, Vietnam rice boom heaping pressure on farmers, environment,
Meridian Institute Report, pp. 1–3.
Battese, GE & Coelli, TJ 1995, ‘A model for technical inefficiency effects in a
stochastic frontier production function for panel data’, Empirical Economics, vol. 20,
pp. 325–32.
Baumol, WJ, Panzar, JC & Willig, RD 1982, Contestable Markets and the Theory of
Industry Structure, Harcourt Brace Jovanovich Inc, New York.
Becker, GS 1974, ‘A theory of social interactions’, Journal of Political Economy, vol.
82, pp. 1063–94.
Benjamin, D 1995, ‘Can Unobserved land quality explain the inverse productivity
relationship?’, Journal of Development Economics, vol. 46, no. 1, pp. 51–84.
Benjamin, D 1992, ‘Household composition, labor markets and labor demand: testing
for separation in agricultural household models’, Econometrica, vol. 60, no. 2, pp.
287–322.
Benjamin, D & Brandt, L 2002, ‘Agriculture and the distribution of income in Vietnam
during the reform period’, William Davidson Working Paper No. 519, The William
Davidson Institute, The University of Michigan University Business School.
Benjamin, D & Brandt, L 2004, ‘Agriculture and income distribution in rural Vietnam
under economic reform: a tale of two regions’, in P Glewwe, N Agrawal, & D Dollar
(eds), Economic growth, poverty, and household welfare in Vietnam, World Bank,
Washington, DC.
Bentley, JW 1987, ‘Economic and ecological approach to land fragmentation: in
defence of a much-maligned phenomenon’, Annual Review of Anthropology, vol. 16,
pp. 31–67.
Besley, T 1995, ‘Property rights and investment incentives: theory and evidence from
Ghana’, Journal of Political Economy, vol. 103, pp. 903-37.
Bezu, S, Barrett, CB & Holden, ST 2012, ‘Does the Nonfarm Economy Offer
Pathways for Upward Mobility? Evidence from a Panel Data Study in Ethiopia’,
World Development, vol. 40, no. 8, pp. 1634–46.
Blackorby, BC & Russell, RR 1989, ‘Will the Real Elasticity of Substitution Please
Stand Up ? a comparison of the Allen/Uzawa and Morishima Elasticities’, The
American Economic Review, vol. 79, no. 4, pp. 882–88.
Blarel, B, Hazell, P, Place, F & Quiggin, J 1992, ‘The economics of farm
fragmentation: evidence from Ghana and Rwanda’, The World Bank Economic
Review, vol. 6, pp. 233–54.
Böhme, MH 2014, ‘Does migration raise agricultural investment? An empirical
232
analysis for rural Mexico’, Agricultural Economics, vol. 45, pp. 1-15.
Brasselle, AS, Gaspart, F & Platteau, JP 2002, ‘Land tenure security and investment
incentives: puzzling evidence from Burkina Faso’, Journal of Development
Economics, vol. 67, pp. 373-418.
Bravo-Ureta, BE, Boris, E, Solid, D, Lopez, VHM, Maripani, JF, Thiam, A & Rivas, T
2007, ‘Technical efficiency in farming: a meta regression analysis’, Journal of
Productivity Analysis, vol. 27, pp. 57–72.
Brennan, D, Petersen, E, Nguyen NQ & Vanzetti, D 2012, ‘Rural-urban migration and
Vietnamese agriculture’ in Contributed paper at the 56th AARES Annual Conference.
Fremantle, Western Australia.
Brümmer, B, Glauben, T & Lu, W 2006, ‘Policy reform and productivity change in
Chinese agriculture: A distance function approach’, Journal of Development
Economics, vol. 81, no. 1, pp. 61–79.
Bustos, P, Caprettini, B & Ponticelli, J 2013, ‘Agricultural productivity and structural
transformation: evidence from Brazil’, Working Paper.
Cameron, AC & Trivedi, PK 2009, Microeconometrics using Stata: Revised, Stata
Press, Texas.
Chamberlain, G 1984, ‘Panel data’, in Z Griliches & M Intriligator (eds), Handbook of
Econometrics, vol 2, North Holland Press, Amsterdam.
Chambers, R.G 1988, Applied production analysis: a dual approach, Cambridge
University Press, New York.
Chaplin, H 2000, ‘Agricultural diversification: a review of methodological approaches
and empirical evidence’, Idara Working Paper 2/2, Wye.
Chavas, J, Petrie, R & Roth, M 2005, ‘Farm household production efficiency: evidence
from the Gambia’, American Journal of Agricultural Economics, vol. 87, no. 1, pp.
160–79.
Chavas, JP & Aliber, M 1993, ‘An analysis of economic efficiency in agriculture: a
nonparametric approach’, Journal of Agricultural and Resource Economics, vol. 18,
pp. 1–16.
Chavas, JP & Di Falco, S 2012, ‘On the role of risk versus economies of scope in farm
diversification with an application to Ethiopian farms’, Journal of Agricultural
Economics, vol. 63, no. 1, pp. 25–55.
Christiaensen, L 2011, ‘Agricultural for development in China 2030: challenges and
prospects’, Mimeo, World Bank.
Coelli, T & Fleming, E 2004, ‘Diversification economies and specialisation
efficiencies in a mixed food and coffee smallholder farming system in Papua New
Guinea’, Agricultural Economics, vol. 31, pp. 229–39.
Coelli, T & Perelman, S 1999, ‘A comparison of parametric and non-parametric
distance functions: with application to European railways’, European Journal of
233
Operational Research, vol. 117, pp. 326–39.
Coelli, T & Perelman, S 2000, ‘Technical efficiency of European railways: a distance
function approach’, Applied Economics, vol. 32, no. 15, pp. 1967–76.
Coelli, TJ 1995, ‘Estimators and hypothesis tests for a stochastic frontier function: A
Monte-Carlo analysis’, Journal of Productivity Analysis, vol. 6, pp. 247–68.
Coelli, TJ 1993, Finite sample properties of stochastic estimators and associated test
statistics, Armidale.
Coelli, TJ 2000, ‘On the econometric estimation of the distance function
representation of the production technology’, CORE Discussion Paper 2000/42.
Coelli, TJ, Prasada, DS. & Battese, GE 1998, An Introduction to Efficiency and
Productivity Analysis, Kluwer Academic Publishers, Boston.
Collier, P & Lai, D 1986, Labour and poverty in Kenya 1900-1980, Clarendon Press,
Oxford.
Coxhead, I & Nguyen, VC & Vu, HL 2015, ‘Migration in Vietnam: new evidence from
recent surveys’, Vietnam Development Economics Discussion Paper 2, World Bank,
Hanoi.
Cragg, JG 1971, ‘Some statistical models for limited dependent variables with
application to the demand for durable goods’, Econometrica, vol. 39, no. 5, pp. 829–
44.
Cuc, NS & Tiem, NV 1996, Nua the ky phat trien nong nghiep nong thon Vietnam:
1945-1995 (Vietnamese), Nha Xuat ban Nong Nghiep, Hanoi, Vietnam.
Cunguara, B, Langintuo, A & Darnhofer, I 2011, ‘The role of nonfarm income in
coping with the effects of drought in southern Mozambique’, Agricultural Economics,
vol. 42, pp. 701–713.
D’Antoni, JM, Khanal, AR & Mishra, AK 2014, ‘Examining labor substitution: does
family matter for US cash grain farmers?’, Journal of Agricultural and Applied
Economics, vol. 2, pp. 273–84.
Dang, KS & Nguyen, NQ & Pham, QD & Truong, TTT & Beresford, M 2006, Policy
reform and the transformation of Vietnamese agriculture, in Rapid growth of selected
Asian economies: lessons and implications for agriculture and food security, Policy
Assistance Series 1/3, FAO, Bangkok.
Dao, G & Lewis, P 2013, Technical efficiency of annual crop farms in northern
Vietnam’, available at: www.murdoch.edu.au.
De Brauw, A 2010, ‘Seasonal migration and agricultural production in Vietnam’,
Journal of Development Studies, vol. 46, no. 1, pp. 114–139.
De Janvry, A, Fafchamps, M & Sadoulet, E 1991, ‘Peasant household behaviour with
missing markets: some paradoxes explained’, Economic Journal, vol. 101, pp. 1400–
17.

234
De Janvry, A. & Sadoulet, E. 2001,‘Income strategies among rural households in
Mexico: the role of off-farm activities in poverty reduction’, World Development, vol.
29, no. 3, pp. 467–480.
Deaton, A 1990, ‘Price elasticities from survey data’, Journal of Econometrics, vol.
44, no. 3, pp. 281–309.
Deaton, A 1997, The analysis of household surveys: a microeconometric approach to
development policy, World Bank, Washington, DC.
Deininger, K & Feder, G 2009, ‘Land registration, governance and development:
evidence and implications for policy’, World Bank Research Observer, vol. 24, pp.
233-66.
Deininger, K & Jin, S 2008, ‘Land sales and rental markets in transition: Evidence
from rural Vietnam’, Oxford Bulletin of Economics and Statistics, vol. 70, no. 1, pp.
67–101.
Deininger, K & Songqing, J 2003, ‘Land sales and rental markets in transition:
evidence from rural Vietnam’, Policy Research Working Paper 3013, World Bank,
Washington, DC.
Dieu, PQ 2006, ‘Agricultural sector of Vietnam policies and performance’, in
International Congress on Human Development, Madrid.
Dixit, A 1970, ‘Growth patterns in a dual economy’, Oxford Economic Papers, vol.
22, pp. 229-34.
Do, QT & Iyer, L 2003, ‘Land rights and economic development: evidence from
Vietnam’, Working Paper 3120, World Bank, Washington, DC.
Dorward, A, Fan, S, Kydd, J, Lofgren, H, Morrison, J, Poulton, C & Rao, N 2004,
‘Institutions and policies for pro-poor agricultural growth’, Development Policy
Review, vol. 22, no 6, pp. 611–22.
Ellis, F 1998, ‘Household strategies and rural livelihood diversification’, Journal of
Development Studies, vol. 35, no. 1, pp. 1–35.
Ellis, F 1999, ‘Rural Livelihood Diversity in Developing Countries : Evidence and
Policy Implications’, ODI Natural Resource Perspectives, vol. 40, no. 40, pp. 1–10.
Ellis, F 2000, Rural livelihoods and diversity in developing countries, Oxford
University Press, Oxford.
Ellis, F & Freeman, HA 2004, ‘Rural livelihoods and poverty reduction strategies in
four African countries’, Journal of Development Studies, vol. 40, no. 4, pp. 1–30.
Evans, H & Ngau, P 1991, ‘Rural-urban relations, household income diversification
and agricultural productivity’, Development Change, vol. 20, pp. 519–45.
Fafchamps, M & Quisumbing, AR 1999, ‘Human capital, productivity and labor
allocation in rural Pakistan’, The Journal of Human Resources, vol. 34, no. 2, pp. 369–
406.

235
FAO 2012, Crop diversification sustainable diets and nutrition, Plant Production and
protection Division, Rome, Italy.
FAO 2004, ‘Food insecurity and vulnerability in Vietnam : profiles of four Vulnerable
groups’, ESA Working Paper No. 04-11, Food Security and Agricultural Projects
Analysis Service (ESAF), FAO.
FAO 2010, The rice crisis: markets, policies and food security, FAO and Earthscan,
London.
Fare, RS & Primont, D 1995, Multi-Output Production and Duality, Theory and
Application, Kluwer Academic Publishers, Boston.
Fei, JCH & Ranis, G 1961, ‘A theory of economic development’, The American
Economic Review, vol. 51, no. 4, pp. 533–65.
Fei, J & Ranis, G 1964, Development of the labor surplus economy: theory and policy,
R.D. Irwin, Homewood, Illinois.
Fei, JC & Ranis, G 1997, Growth and development from an evolutionary perspective,
Blackwell Publishers, Malden, Massachuset.
Fei, JC & Ranis, G 1975, ‘Model of growth and employment in open dualistic
economy: cases of Korea and Taiwan’, Journal of Development Studies, vol. 11, no. 2,
pp. 32–63.
Fenske, J 2011, ‘Land tenure and investment incentives: evidence from West Africa’,
Journal of Development Economics, vol. 95, pp. 137-56.
Fernandez-Cornejo, J, Gempesaw, CM, Elterich, JG & Stefanou, SE 1992, ‘Dynamic
measures of scope and scale economies: an application to German agriculture’,
American Journal of Agricultural Economics, vol. 74, pp. 329–42.
Fforde, A & Seneque, S 1995, ‘The economy and the countryside: the relevance of
rural development policies’, in BJ Kerkvliet & DJ Porter (eds), Vietnam’s Rural
Transformation. Westview Press, Boulder, CO, pp. 97–138.
Field, D 1978, ‘Sectoral shifts in Antebellum Massachusetts’, Exploration in
Economic History, vol. 15, pp. 146–71.
Fields, G.S 2004, ‘Dualism in the labor market: a perspective on the Lewis model after
half a century’, The Manchester School, vol. 72, no. 6, pp. 724–35.
Foster, AD & Rosenzweig, MR 2004, ‘Agricultural productivity growth, rural
economic diversity, and economic reforms: India, 1970-2000’, Economic Development
and Cultural Change, vol. 52, no. 3, pp. 509–42.
Foster, AD & Rosenzweig, MR 2008, ‘Economic development and the decline of
agricultural employment’, Handbook of Development Economics 4, vol. 52, pp. 3051–
83.
Fu, T & Shei, S 1999, ‘Agriculture as the foundation for development: the Taiwanese
story’, in E Thorbecke & H Wan (eds), Taiwan’s development experience: lessons on
roles of Government and market, Kluwer Academic Publishers, Norwell,

236
Massachusetts, USA.
GSO 1987, The statistical yearbooks of Vietnam, The Statistical Publishing House,
Hanoi, Vietnam.
GSO 1991, The statisical yearbooks, The Statistical Publishing House, Hanoi,
Vietnam.
GSO 2002, The statisical yearbooks, The Statistical Publishing House, Hanoi,
Vietnam.
GSO 2003, The statisical yearbooks, The Statistical Publishing House, Hanoi,
Vietnam.
GSO 2006, The statistical yearbooks, The Statistical Publishing House, Hanoi,
Vietnam.
GSO 2007. Results of the 2006 rural agricultural and fishery census, Hanoi, Vietnam:
The Statistical Publishing House.
GSO 2008, The statistical yearbooks, The Statistical Publishing House, Hanoi,
Vietnam.
GSO 2009a, Migration and urbanization in Vietnam: patterns, trends and differentials,
Vietnam Population and Housing Census 2009, The Statistical Publishing House,
Hanoi, Vietnam.
GSO 2009b, The statistical yearbooks, The Statistical Publishing House, Hanoi,
Vietnam.
GSO 2010, Result of the Vietnam household living standards survey 2010, The
Statistical Publishing House, Hanoi, Vietnam.
GSO 2012, Results of the 2011 rural agricultural and fishery census, The Statistical
Publishing House, Hanoi, Vietnam.
GSO 2013, The statistical yearbooks, The Statistical Publishing House, Hanoi,
Vietnam.
GSO 2014, The statistical yearbooks, The Statistical Publishing House, Hanoi,
Vietnam.
Gibson, J & Olivia, S 2010, ‘The effect of infrastructure access and quality on nonfarm
enterprises in rural Indonesia’, World Development, vol. 38, no. 5, pp. 717–26.
Gilbert, JR 2014, ‘Wage and employment effects of Malawi’s fertilizer subsidy
program’, Agricultural Economics, vol. 45, pp. 337–53.
Glewwe, P & Dollar, D &Agrawal, N 2004, Economic growth, poverty, and household
welfare in Vietnam, Regional and Sectoral Studies, World Bank.
Grosskopf, S, Hayes, K & Hirschberg, J 1995, ‘Fiscal stress and the production of
public safety: a distance function approach’, Journal of Public Economics, vol. 57, pp.
277–96.

237
Gupta, ND & Smith, N 2002, ‘Children and Career Interruptions : The Family Gap in
Denmark’, Economica, vol. 69, no. 276, pp. 609–29.
Guvele, CA 2001, ‘Gains from crop diversification in the Sudan: Gezira scheme’,
Agricultural Systems, vol. 70, pp. 319–33.
Haggblade, S, Hazell, P & Reardon, T 2010, ‘The rural non-farm economy: prospects
for growth and poverty reduction’, World Development, vol. 38, no. 10, pp. 1429–41.
Haggblade, S, Hazell, P & Reardon, T 2007, Transforming the rural nonfarm
economy, The Johns Hopkins University Press, Baltimore, Maryland.
Hailu, A & Veeman, TS 2000, ‘Environmentally sensitive productivity analysis of the
Canadian pulp and paper industry, 1959-1994’, Environmental Economics and
Management, vol. 40, pp. 251–74.
Hansen, CB 1953, ‘Agricultural transformation in central Asia’, Slavic Review, pp.
1950–1953.
Hayami, Y 1988, Japanese agriculture under siege, St Martin’s Press, New York.
Hayami, Y 2004, ‘The three agricultural problems in the disequilibrium of world
agriculture’, Asian Journal of Agriculture and Development, vol. 1, no. 1, pp. 3–14.
Hayami, Y 2007, ‘An emerging agricultural problem in high-performing Asian
economies’, Policy Research Working Paper Series 4312, The World Bank.
Hayami, Y & Ruttan, VW 1971, ‘Induced innovation and agricultural development’,
Staff papers 13967, University of Minnesota, Department of Applied Economics.
Hayami, Y & Ruttan, VW 1985, Agricultural development: an international
perspective, The Johns Hopkins University Press, Baltimore, Maryland.
Hazell, P 2009, ‘The Asian Green Revolution’, IFPRI Discussion Paper 00911, IFPRI,
Washington DC.
Hazell, P 2010, ‘Asia’s Green Revolution: past achievements and future challenges’, in
S Pandey, D Byerlee, D Dawe, A Dobermann, S Mohanty, S Rozelle & B Hardy (eds),
Rice in the global economy: strategic research and policy issues for food security.
International Rice Research Institute, LosBanos, pp. 61-92.
Hazell, P, Poulton, C, Wiggins, S & Dorward, A 2010, ‘The future of small farms:
trajectories and policy priorities’, World Development, vol. 38, no. 10, pp. 1349–61.
Hazell, P & Rahman, A 2014, New directions for smallholder agriculture, Oxford
University Press, Oxford.
Headley, D, Bezemer, D & Hazell, P 2010, ‘Agricultural employment trends in Asia
and Africa: too fast or too slow?’, The World Bank Research Observer, vol. 25, pp.
57–89.
Hertz, T 2007, ‘The effect of nonfarm income on investment in Bulgarian family
farming’, Working Paper Series No. 2007-15, American University Department of
Economics.
238
Hicks, JR 1963, The Theory of Wages, 2nd edn, Macmillan, London.
Hoang, TX, Pham, CS & Ulubaşoǧlu, MA 2014, ‘Non-farm activity, household
expenditure, and poverty reduction in rural Vietnam: 2002-2008’, World Development,
vol. 64, pp. 554–68.
Holden, S, Shiferaw, B & Pender, J 2004, ‘Non-farm income, household welfare and
sustainable land management in a less-favoured area in the Ethiopian Highlands’,
Food Policy, vol. 29, no. 4, pp. 369–92.
Honma, M & Hayami, Y 2009, ‘Republic of Korea and Taiwan, China’, in K
Anderson & W Martin (eds), Distortions to agricultural incentives in Asia, World
Bank, Washington, DC, pp. 85–116.
Huang, J, Wang, X & Qiu, HG 2012, ‘Small-scale farmers in China in the face of
modernization and globalization’, International Institute for Environment and
Development/HIVOS, London.
Humphries, B 1999, ‘Implementation of title registration systems for improved land
markets’, in Agricultural Land Tenure System in Asia and the Pacific, Asian
Productivity Commission, Tokyo, pp. 42–70.
Hung, PV, MacAulay, TG & Marsh, S.P 2007, ‘The economics of land fragmentation
in the north of Vietnam’, The Australian Journal of Agricultural and Resource
Economics, vol. 51, no. 2, pp. 195–211.
IFPRI 2007, The future of small farms: proceedings of a research workshop, Wye,
UK, 26-29 June 2005, jointly organized by International Food Policy Research
Institute (IFPRI)/2020 Vision Initiative, Overseas Development Institute, Imperial
College, London.
Irz, X & Thirtle, C 2004, ‘Dual technological development in Botswana agriculture: a
stochastic input distance function approach’, Journal of Agricultural Economics, vol.
55, no. 3, pp. 455–78.
Isgut, AE, 2004, ‘Non-farm income and employment in rural Honduras: assessing the
role of locational factors’, The Journal of Development Studies, vol. 40, no. 3, pp. 59–
86.
Jacoby, H 1993, ‘Shadow wages and peasant family labor supply: an econometric
application to the Peruvian Sierra’, Review of Economic Studies, vol. 60, pp. 903-21.
Jayne, TS & Rashid, S 2013, ‘Input subsidy programs in sub-Saharan Africa: a
synthesis of recent evidence’, Agricultural Economics, vol. 44, no. 6, pp. 547–62.
Jia, L & Petrick, M 2013, ‘How does land fragmentation affect off-farm labor supply:
panel data evidence from China’, Agricultural Economics, vol. 45, no. 3, pp. 369–80.
Johnson, DG 2000, ‘Population, food, and knowledge’, The American Economic
Review, vol. 90, no. 1, pp. 1–14.
Jolliffe, D 2004, ‘The impact of education in rural Ghana: examining household labor
allocation and returns on and off the farm’, Journal of Development Economics, vol.
239
73, no. 1, pp. 287–314.
Kajisa, K 2007, ‘Personal networks and non-agricultural employment: the case of a
farming village in the Philippines’, Economic Development and Cultural Change, vol.
55, no. 4, pp. 668–707.
Kerkvliet, BJT 2004, ‘Agrarian policy renovation in Vietnam from bottom up’,
Taiwan Journal of Southeast Asian Studies, vol. 1, no. 2, pp. 19–36.
Kerkvliet, BJT 2006, ‘Agricultural land in Vietnam: markets tempered by family,
community and socialist practices’, Journal of Agrarian Change, vol. 6, no. 3, pp.
285–05.
Kerkvliet, BJT 2000, ‘Governing agricultural land in Vietnam: an overview’, in
ACIAR Project ANRE 1/97/92, Impacts of Alternative Policy Options on the
Agricultural Sector in Vietnam, Research School of Pacific and Asian Studies, The
Australian National University, Canberra, Australia.
Khandker, SR, Koolwal, GB & Samad, HA 2010, Handbook on impact evaluation:
quantitative methods and practices, World Bank, Washington, DC.
Kijima, T & Lanjouw, P 2005, ‘Economic diversification and poverty in rural India’,
Indian Journal of Labour Economics, vol. 48, no. 2, pp. 349–374.
Kilic, T, Carletto, C, Miluka, J & Savastano, S 2009, ‘Rural nonfarm income and its
impact on agriculture: Evidence from Albania’, Agricultural Economics, vol. 40, no. 2,
pp. 139–60.
Kim, K, Chavas, J, Barham, B & Foltz, J 2012, ‘Specialization, diversification, and
productivity: a panel data analysis of rice farms in Korea’, Agricultural Economics,
vol. 43, no. 6, pp. 687–700.
Kompas, T 2004, ‘Market reform, productivity and efficiency in Vietnamese rice
production’, Working Paper 04-4, Asia Pacific School of Economic and Government,
Canberra, Australia.
Kompas, T, Che, TN, Nguyen, HTM & Nguyen, HQ 2012, ‘Productivity, net returns,
and efficiency: land and market reform in Vietnamese rice production’, Land
Economics, vol. 88, no. 3, pp. 478–95.
Kozak, M, Krzanowski, W & Tartanus, M 2012, ‘Use of the correlation coefficients in
agricultural sciences: problems, pitfalls and how to deal with them’, Annals of the
Brazilian Academy of Sciences, vol. 84, no. 4, pp. 1147–56.
Kumar, S 2006, ‘Analysing industrial water demand in India : an input distance
function approach’, Water Policy, vol. 8, pp. 15–29.
Kumbhakar, SS, Orea, L, Rodriguez-Alvarez, A & Tsonias, EG 2007, ‘Do we estimate
an input or output distance function? An application of the mixed approach to
European Railways’, Journal of Productivity Analysis, vol. 27, pp. 87–100.
Kumbhakar, SS & Lovell, C 2003, Stochastic Frontier Analysis, 2nd edn, Cambridge
University Press, Cambridge, UK.

240
Kung, JK 2002, ‘Off-Farm labor markets and the emergence of land rental markets in
rural China’, Journal of Comparative Economics, vol. 30, no. 2, pp. 395–414.
La, HA & Leung, S 2012, ‘Remittances from migrant: experience of Vietnam’,
Journal of Vietnamese Studies, vol. 7, no. 4, pp. 695–701.
Land Law 1993, National Assembly of Vietnam (NA), Hanoi, Vietnam.
Land Law 1998, 10/1998/QH10, National Assembly of Vietnam (NA), Hanoi,
Vietnam.
Land Law 2003, 13/2003/QH11, National Assembly of Vietnam (NA), Hanoi,
Vietnam.
Lanjouw, J & Lanjouw, P 2001, ‘The rural non-farm sector: issues and evidence from
developing countries’, Agricultural Economics, vol. 26, pp. 1–23.
Lanjouw, P 2001, ‘Nonfarm employment and poverty in rural El Salvador’, World
Development, vol. 29, no. 3, pp. 529–47.
Lanjouw, P, Quizon, J & Sparrow, R 2001, ‘Non-agricultural earnings in peri-urban
areas of Tanzania: Evidence from household survey data’, Food Policy, vol. 26, no. 4,
pp. 385–403.
Lau, LJ & Yotopoulos, PA 1971, ‘A test for relative efficiency and application to
Indian agriculture’, The American Economic Review, vol. 61, pp. 94–109.
Le, BD, Tran, GL & Nguyen, TPT 2011, ‘Social protection for rural-urban migrants
in Vietnam: current situation, challenges and opportunities’, CSP Research Report 08,
Institute for Social Development Studies, Hanoi, Vietnam.
Le Cao Doan 1995, ‘Agricultural reforms in Vietnam in the 1980s’, in I Norlund, CL
Gates & CD Vu (eds), Vietnam in a changing world, Curzon Press, Richmond.
Le, KT 2009, ‘Shadow wages and shadow income in farmers’ labor supply function’,
Journal of Agricultural Economics, vol. 91, no. 3, pp. 685–96.
Le, KT 2010, ‘Separation hypothesis tests in the agricultural household model’,
American Journal of Agricultural Economics, vol. 92, no. 5, pp. 1420–31.
Lewis, WA 1954, ‘Economic development with unlimited supplies of labour’,
Manchester School of Economic and Social Studies, vol. 22, no. 2, pp. 139–91.
Li, L, Wang, C, Segarra, E & Nan, Z 2013, ‘Migration, remittances, and agricultural
productivity in small farming systems in Northwest China’, China Agricultural
Economic Review, vol. 5, no. 1, pp. 5–23.
Lin, JY 1992, ‘Rural reforms and agricultural growth in China’, American Economic
Review, vol. 82, pp. 34-51.
Lin, BB 2011, ‘Resilience in agriculture through crop diversification: adaptive
management for environmental change’, BioScience, vol. 61, no. 3, pp. 183–93.
Lipton, M 2006, ‘Can small farmers survive, prosper, or be the key channel to cut

241
mass poverty?’, Electronic Journal of Agricultural and Development Economics, vol.
3, no. 1, pp. 58-85.
Lleweln, RV & Williams, JR 1996, ‘Nonparametric analysis of technical efficiency,
pure technical, and scale efficiencies for food crop production in East Java, Indonesia’,
Agricultural Economics, vol. 15, pp. 113–26.
Lokshin, M & Yemtsov, R 2005, ‘Has rural infrastructure rehabilitation in Georgia
helped the poor?’, World Bank Economic Review, vol. 19, no. 2, pp. 311–33.
Lovell, CAK, Richardson, S, Travers, P & Wood, LL 1994, ‘Resources and
functionings: a new view of inequality in Australia’, in W Eichhorn (eds), Models and
Measurement of Welfare Inequality, Springer-Verlag Press, Berlin.
Ma, X, Heerink, N, van Ierland, E, van den Berg, M & Shi, X 2013, ‘Land tenure
security and land investment in Northwest China’, China Agricultural Economic
Review, vol. 5, no. 2, pp. 281–307.
Mafoua-Koukebene, E, Hornbaker, RH & Sherrick, BJ 1996, ‘Effects of Government
program payments on farm portfolio diversification’, Review of Agricultural
Economics, vol. 18, pp. 281–91.
MARD 2002, Report to the Central Economic Committee of the Party on review of
land policy and recommendation new points for revised Land law, Ministry of
Agriculture and Rural Development, Hanoi, Vietnam.
MARD 2014, Households abandon paddy fields (in Vietnamese), Ministry of
Agriculture and Rural Development, Hanoi, Vietnam.
MARD 2009, The development strategy of agriculture and rural development (2011-
2020)-3310/BNN-KH (in Vietnamese), Ministry of Agriculture and Rural
Development, Hanoi, Vietnam.
Markussen, T, Tarp, F, Do, HT & Nguyen, DAT 2013, ‘Inter and intra farm land
fragmentation in Vietnam’, Working Paper, Central Institute of Economic
Management, Hanoi, Vietnam.
Marsh, SP, MacAulay, TG & Hung, PV 2006, ‘Agricultural development and land
policy in Vietnam’, ACIAR Monograph No 123, Australian Centre for International
Agricultural Research.
Matshe, I & Young, T 2004, ‘Off-farm labour allocation decisions in small-scale rural
households in Zimbabwe’, Agricultural Economics, vol. 30, no. 3, pp. 175–86.
Matsuyama, K 1992, ‘Agricultural productivity, comparative advantage, and economic
growth’, Journal of Economic Theory, vol. 58, pp. 17–34.
McCaig, B & Pavcnik, N 2013, ‘Moving out of agriculture: structural change in
Vietnam’, NBER Working Paper No. 19616.
McMillan, J, Whalley, J & Zhu, L 1989, ‘The impact of China’s economic reforms on
agricultural productivity growth’, Journal of Political Economy, vol. 97, no. 4, pp.
781–807.

242
McPherson, MF 1982, ‘Land fragmentation: a selected literature review’,
Development Discussion Paper No. 141.
McPherson, MF 2012, ‘Land policy in Vietnam: challenges and prospects for
constructive change’, Journal of Macromarketing, vol. 32, no. 1, pp. 137–46.
Mincer, J 1974, Schooling, experience, and earnings, Columbia University Press, New
York.
Ministry of Labor Invalid and Social Affairs (MOLISA) 2012, The annual report
2011, The Statistical Publishing House, Hanoi, Vietnam.
Minot, N & Epprecht, M & Tran, TTA & Le, QT 2006, ‘Income Diversification and
Poverty in the Northern Uplands of Vietnam’, International Food Policy Research
Institute, Washington, DC.
Minot, N & Goletti, F 1998, ‘Export liberalization and household welfare: the case of
rice in Vietnam’, American Journal of Agricultural Economics, vol. 80, no. 4, pp.
738–49.
Mishra, AK & Goodwin, BK 1997, ‘Farm income variability and the supply of off-
farm labor’, American Journal of Agricultural Economics, vol. 79, no. 3, pp. 880–87.
Morishima, M 1967, ‘A few suggestions on the theory of elasticity’, Keizai Hyoron
(Economic Review), vol. 16, pp. 149-150.
Mundlak, Y 1978, ‘On the pooling of time series and cross-sectional data’,
Econometrica, vol. 46, pp. 69–85.
Mussa, R 2014, ‘A matching decomposition of the rural-urban difference in
malnutrition in Malawi’, Health Economics Review, vol. 4, no. 11, pp. 1-10.
Newman, C & Matthew, A 2007, ‘Evaluating the productivity performance of
agricultural enterprises in Ireland using a multiple output distance function approach’,
Journal of Agricultural Economics, vol. 58, pp. 128–51.
Nguyen, L & Raabe, K & Grote, U 2015, ‘Rural-urban migration, household
vulnerability, and welfare in Vietnam’, World Development, vol. 71, pp. 79-93.
Nguyen, VC, van den Berg, M & Lensink, R 2011, ‘The impact of work and non-work
migration on household welfare, poverty and inequality: new evidence from Vietnam’,
Economics of Transition, vol. 19, no. 4, pp. 771–99.
Nguyen, SC 2003, Vietnam agriculture and rural area in the renovation period,
Statistical Publishing House, Hanoi, Vietnam.
Nguyen, VC 2008, ‘Do foreign remittances matter to poverty and inequality? Evidence
from Vietnam’, Economic Bulletin, vol. 15, no. 1, pp. 1–11.
Nguyen, VC & Mont, D 2012, ‘Economic impacts of international migration and
remittances on household welfare in Vietnam’, International Journal of Development
Issues, vol. 11, no. 2, pp. 144–63.
Niimi, Y & Pham, T & Rilly, B 2009, ‘Determinants of remittances: recent evidence
243
using data on internal migrants in Vietnam’, Asian Economic Journal, vol. 23, no. 1,
pp. 19-39.
Niroula, GS & Thapa, GB 2005, ‘Impacts and causes of land fragmentation, and
lessons learned from land consolidation in South Asia’, Land Use Policy, vol. 22, no.
4, pp. 358–72.
Ñopo, H 2008, ‘Matching as a tool to decompose wage gaps’, Review of Economics
and Statistics, vol. 90, no. 2, pp. 290–99.
OECD, 2015, Agricultural policies in Vietnam, OECD Publishing, Paris.
OECD & FAO, 2013, Agricultural outlook 2013-2022, OECD and FAO.
Ogundari, K 2013, ‘Crop diversification and technical efficiency in food crop
production: a study of peasant farmers in Nigeria’, International Journal of Social
Economics, vol. 40, no. 3, pp. 267–87.
Ogundari, K & Brümmer, B 2011, ‘Estimating technical efficiency, input substitution
and complementary effects using output distance function: a study of cassava
production in Nigeria’, Agricultural Economic Review, vol. 12, no. 2, pp. 62–79.
Ogura, T 1963, Agricultural development in modern Japan, Fuji Publishing, Tokyo,
Japan.
Oldenburg, P 1990, ‘Land consolidation as land reform in India’ World Development,
vol. 18, no. 2, pp. 183–95.
Oseni, G & Winters, P 2009, ‘Rural nonfarm activities and agricultural crop
production in Nigeria’, Agricultural Economics, vol. 40, no. 2, pp. 189–201.
Otsuka, K 2013, ‘Food insecurity, income inequality, and the changing comparative
advantage in world agriculture’, Agricultural Economics, vol. 44, pp. 7–18.
Otsuka, K 2015, ‘Future of small farms in emerging countries in Asia’, National
Graduate Institute for Public Studies, Tokyo, Japan.
Otsuka, K, Liu, Y & Yamauchi, F 2014, ‘The future of small farms in Asia’, National
Graduate Institute for Public Studies, Tokyo, Japan, http://www3.grips.ac.jp/~esp/wp-
content/uploads/2014/11/112014.pdf
Otsuka, K, Liu, Y & Yamauchi, F 2013b, ‘Factor endowments, wage growth, and
changing food self-sufficiency: evidence from country-level panel data’, American
Journal of Agricultural Economics, vol. 95, no. 5, pp. 1252-58
Otsuka, K & Estudillo, J 2010, ‘Economic development, land tenure, and the changing
optimum farm size’, in S Pandey, D Byerlee, D Dawe, A Dobermann, S Mohanty, S
Rozelle & B Hardy (eds), Rice in the global economy: strategic research and policy
issues for food security. International Rice Research Institute, LosBanos, pp. 191–212.
Palmer, D, Fricska, S & Wehrmann, B 2009, ‘Toward improved land governance’,
Land Tenure Working Paper No 11, FAO-UN Habitat.
Papke, LE & Wooldridge, JM 2008, ‘Panel data methods for fractional response

244
variables with an application to test pass rates’, Journal of Econometrics, vol. 145, pp.
121–33.
Paul, CJM, Johnston, WE & Frengley, GAG 2000, ‘Efficiency in New Zealand sheep
and beef farming: the impacts of regulatory reform’, Review of Economics and
Statistics, vol. 82, no. 2, pp. 325–37.
Paul, CJM & Nehring, R 2005, ‘Product diversification, production systems, and
economic performance in US agricultural production’, Journal of Econometrics, vol.
126, no. 2, pp. 525–48.
Perkins, DH 1988, ‘Reforming China’s economic system’, Journal of Economic
Literature, vol. 26, pp. 601-45.
Perkins, DH, Radelet, S & Lindauer, DL 2006, Economics of development, 6th edn, W.
W. Norton & Company, New York.
Pham, T.H. & Bui, A.T. & Dao, L.T. 2010, ‘Is nonfarm diversification a way out of
poverty for rural households? Evidence from Vietnam in 1993-2006’, PMMA Working
Paper 2010-17.
Pham, VH, Nguyen, TMH, Kompas, T, Che, TN & Bui, T 2015, ‘Rice production,
trade and the poor: regional effects of rice export policy on households in Vietnam’,
Journal of Agricultural Economics, vol. 66, no. 2, pp. 280–307.
Phan, D 2012, Migration and credit constraints: theory and evidence from Vietnam’,
Review of Development Economics, vol. 16, no. 1, pp. 31–44.
Pingali, PL, Xuan, VT & Khiem, NT 1998, ‘Prospects for sustaining Vietnam’s re-
acquired rice export status’, Food Policy, vol. 22, no. 4, pp. 345–58.
Rahman, S 2009, ‘Whether crop diversification is a desired strategy for agricultural
growth in Bangladesh?’, Food Policy, vol. 34, pp. 340–49.
Rahman, S 2010, ‘Women’s labour contribution to productivity and efficiency in
agriculture: empirical evidence from Bangladesh’, Journal of Agricultural Economics,
vol. 61, no. 2, pp. 318–42.
Rahman, S & Rahman, M 2008, ‘Impact of land fragmentation and resource ownership
on productivity and efficiency: the case of rice producers in Bangladesh’, Land Use
Policy, vol. 26, pp. 95–103.
Rasmussen, S 2010, ‘Scale efficiency in Danish agriculture: an input distance-function
approach’, European Review of Agricultural Economics, vol. 37, no. 3, pp. 335–67.
Raval, D 2011, ‘Beyond Cobb-Douglass: estimation of a CES production function with
factor augmenting technology’, Discussion Paper No. 11-05, CES, University of
Chicago.
Ravallion, M & van de Walle, D 2004, Creating a market: land reallocation in
Vietnam’s agrarian transition, World Bank, Washington, DC.
Ravallion, M & van de Walle, D 2006, ‘Does rising landlessness signal success or
failure for Vietnam’s agrarian transition?’, Journal of Development Economics, vol.

245
87, no. 2, pp. 191–209.
Ravallion, M & van de Walle, D 2006, ‘Land reallocation in an agrarian transition’,
Economic Journal, vol. 116, no. 514, pp. 924–42.
Ravallion, M & van de Walle, D 2008, Land in transition: reform and poverty in rural
Vietnam, World Bank, Washington, DC.
Reardon, T, Berdegue, J & Escobar, G 2001, ‘Rural nonfarm employment and incomes
in Latin America: overview and policy implications’, World Development, vol. 29, no.
3, pp. 395–409.
Reardon, T, Crawford, E & Kelly, V 1994, ‘Links between nonfarm income and farm
investment in African households: adding the capital market perspective’, American
Journal of Agricultural Economics, vol. 76, pp. 1172–76.
Reardon, T, Delgado, C & Matlon, P 1992, ‘Determinants and effects of income
diversification amongst farm households in Burkina Faso’, Journal of Development
Studies, vol. 28, no. 2, pp. 264–96.
Renkow, M 2007, ‘Cities, towns and rural nonfarm economy’, in S Haggblade, P
Hazell, & T Reardon (eds), Transforming the rural nonfarm economy: opportunities
and threat in developing world. Johns Hopkins University Press, Baltimore, Maryland.
Research Institute of Agricultural Planning 2004, Analysis and recommendation
solutions to solving land fragmentation in the Red River Delta, a report to the Ministry
of Agriculture and Rural Development, Research Institute of Agricultural Planning,
Hanoi, Vietnam.
Ricker-Gilbert, J 2014, ‘Wage and employment effects of Malawi’s fertilizer subsidy
program’, Agricultural Economics, vol. 45, no. 3, pp. 337–53.
Rizov, M & Swinnen, JFM 2004, ‘Human capital, market imperfections, and labor
reallocation in transition’, Journal of Comparative Economics, vol. 32, no. 4, pp. 745–
74.
Robison, LJ & Barry, PJ 1987, The competitive firm’s response to risk, Macmillan
Publishing Company, New York.
Rosenzweig, MR & Stark, O 1989, ‘Consumption smoothing, migration and marriage:
evidence from rural India’, Journal of Political Economy, vol. 97, pp. 905–26.
Rozelle, S, Taylor, JE & De Brauw, A 1999, ‘Migration, remittances, and agricultural
productivity in China’, The American Economic Review, vol. 89, no. 2, pp. 287–91.
Ruttan, VW 1981, Agricultural research policy, University of Minnesota Press,
Minneapolis.
Savadogo, K, Reardon, T & Pietola, K 1994, ‘Farm productivity in Burkina Faso:
effect of animal traction and nonfarm income’, American Journal of Agricultural
Economics, vol. 76, no. 3, pp. 608–12.
Schultz, TW 1978, Distortion of agricultural incentives, Indiana University Press,

246
Bloomington.
Schultz, T.W. 1953. The economic organization of agriculture, New York: McGraw-
Hill.
Schultz, TW 1964, Transforming traditional agriculture, Yale University Press, New
Haven.
Scott, S 2009, ‘Agrarian transformation in Vietnam: land reform, markets and
poverty’, in M. Spoor (eds), The political economy of rural livelihoods in transition
economies, Routledge, Oxon, pp. 175–99.
Shephard, R 1970, Theory of cost and production function, Princeton University Press,
Princeton, New Jersey.
Singh, I, Squire, L & Strauss, J 1986, ‘The basic model: theory, empirical results, and
policy conclusions’, in I Singh, L Squire, & J Strauss (eds), Agricultural household
models, extension, application and policy, Johns Hopkins University Press, Baltimore,
Maryland, pp. 17–47.
Skoufias, E 1994, ‘Using shadow wages to estimate labor supply of agricultural
households’, American Journal of Agricultural Economics, vol. 76, no. 2, pp. 215–27.
Stampini, M & Davis, B 2009, ‘Does nonagricultural labor relax farmers’ credit
constraints? Evidence from longitudinal data for Vietnam’, Agricultural Economics,
vol. 40, no. 2, pp. 177–88.
Stark, O 2005, ‘Comment on migration and incomes in source communities: a new
economics of migration perspective from China’, Economic Development and Cultural
Change, vol. 53, no. 4, pp. 983–86.
Stark, O & Bloom, DE 1985, ‘The new economics of labor migration’, The American
Economic Review, vol. 75, no. 2, pp. 173–78.
Suphannachart, W & Warr, P 2011, ‘Research and productivity in Thai agriculture’,
Australian Journal of Agricultural and Resource Economics, vol. 55, no. 1, pp. 35-52.
Tan, S, Heerink, N & Qu, F 2006, ‘Land fragmentation and its driving forces in
China’, Land Use Policy, vol. 23, pp. 272–85.
Tan, S, Heerink, N, Kruseman, G & Qu, F 2008, ‘Do fragmented landholdings have
higher production costs? Evidence from rice farmers in north eastern Jiangxi province,
P.R. China’, China Economic Review, vol. 19, pp. 347–58.
Taylor, JE 1999, ‘The new economics of labour migration and the role of remittances
in the migration process’, International migration, vol. 37, no. 1, pp. 63–88.
Taylor, JE & Lopez-Feldman, A 2010, ‘Does migration make rural households more
productive? Evidence from Mexico’, Journal of Development Studies, vol. 46, no. 1,
pp. 68–90.
Taylor, JE & Martin, PL 2001, ‘Human capital: migration and rural population
change’, in G Rausser & B Gardner (eds), Handbook of Agricultural Economics, vol

247
1A, Elsevier Science, New York, pp. 457–511.
Taylor, JE, Rozelle, S & De Brauw, A 2003, ‘Migration and incomes in source
communities: a new economic of migration perspective from China’, Economic
Development and Cultural Change, vol. 52, no. 1, pp. 75–101.
Taylor, JE & Lybbert, TJ 2015, Essentials of Development Economics, University of
California Press, Berkeley.
Thapa, G & Gaiha, R 2014, ‘Smallholder farming in Asia and the Pacific: challenges
and opportunities’, in P Hazell & A Rahman (eds), New directions for smallholder
agriculture, Oxford University Press, Oxford.
Thinh, LD 2009, ‘Study on land consolidation in the Red River Delta (in
Vietnamese)’, Ministry of Agriculture and Rural Development, Hanoi, Vietnam.
Thirwall, AP 2006, Growth and development with special reference to developing
economies, 8th edn, Palgrave Macmillan, New York.
Timmer, CP 2013, ‘Agricultural transformation in Asia’, East Asia Forum Quarterly:
Economics, Politics and Public Policy in Asia and The Pacific, vol. 4, no. 4, pp. 3–5.
Timmer, CP 2014, ‘Food security in Asia and the Pacific: the rapidly changing role of
rice’, Asia & The Pacific Policy Studies, vol. 1, no. 1, pp. 73–90.
Tran, AT 2006, ‘Institutional analysis of the contemporary land consolidation in the
Red River Delta: a village-level study of Dong Long commune in Tien Hai district,
Thai Binh province, Vietnam’, Working Pape No. 26, Kansai University, Kansai.
Tran, CT, Do, LH & Le, NM 2013, Who has benefited from high rice prices in
Vietnam?, IPSARD and Oxfarm, Hanoi, Vietnam.
Trung, TQ 2000, Determinants of income from rural non-farm business activities in
Vietnam, M.Sc. thesis, National Economic University, Hanoi.
Tuladhar, R, Sapkota, C & Adhikari, N 2014, ‘Effects of migration and remittance
income on Nepal’s agriculture yield, ADB South Asia Working Paper Series No. 27,
ADB.
Ufer, S 2012, ‘The impact of increasing rice and maize prices on household income in
north-western Vietnam’, Rural 21-The International Journal for Rural Development,
vol. 1, pp. 41–43.
Urdy, C 1996, ‘Gender, agriculture production, and the theory of the household’, The
Journal of Political Economy, vol. 104, no. 5, pp. 1010–46.
Van de Walle, D & Cratty, D 2004, ‘Is the emerging non-farm market economy the
route out of poverty in Vietnam?’, Economics of Transition, vol. 12, no. 2, pp. 237–74.
Van den Berg, M, Hengsjijk, H, Wolf,J, Ittersum,MKV, Guanghuo, W & Roetter, RP
2007, ‘The impact of increasing farm size and mechanization on rural income and rice
production in Zhejiang province, China’, Agricultural Systems, vol. 94, pp. 841–50.
Vasavakul, T 2006, ‘Agricultural land management under doimoi: policy makers’

248
views’, in SP Marsh, TG Macaulay, & PV Hung (eds), Agricultural development and
land policy in Vietnam, Australian Centre for International Agricultural Research,
Sydney, pp. 221–32.
Vu, L 2012, ‘Efficiency of rice farming households in Vietnam’, International Journal
of Development Issues, vol. 11, no. 1, pp. 60–73.
Vy, NP 2002, ‘Agricultural, rural and farmer’s policy in Vietnam’, a paper presented.
in Vietnamese Agriculture: Policy and Issues, University of Sydney, Sydney,
Australia.
Wadud, A & White, B 2000, ‘Farm household efficiency in Bangladesh: a comparison
of stochastic frontier and DEA methods’, Applied Economics, vol. 32, pp. 1665–73.
Wan, GH & Cheng, E 2001, ‘Effects of land fragmentation and returns to scale in the
Chinese farming sector’, Applied Economics, vol. 91, no. 1, pp. 70–86.
Wang, C, Rada, N, Qin, L & Pan S 2014, ‘Impacts of migration on household
production choices: evidence from China’, The Journal of Development Studies, vol.
50, no. 3, pp. 413–25.
Warr, P 2009, ‘Aggregate and sectoral productivity growth in Thailand and
Indonesia’, Working Papers in Trade and Development, 2009/10, Arndt-Corden
Department of Economics, Australian National University,
Warr, P 2014, ‘Food insecurity and its determinants’, Australian Journal of
Agricultural and Resource Economics, vol. 58. No. 4, pp. 519-37
Warr, PG & Yusuf, AA 2014, ‘Fertilizer subsidies and food self-sufficiency in
Indonesia’, Agricultural Economics, vol. 45, no. 5, pp. 571–88.
Warr, PG 2006, ‘Poverty and growth in South East Asia’, ASEAN Economic Bulletin,
vol. 23, pp. 279–302.
Weiss, CR 1996, ‘Exits from a declining sector: econometric evidence from a panel of
upper-Austrian farms 1980-1990’, Working Paper No. 9601, Department of
Economics, University of Linz.
Wharton, CR 1969, Subsistence agriculture and economic development, Aldine
Publishing Company, Chigago.
Wiggins, S 2014, ‘Rural nonfarm economy: current understanding, policy options and
future possibilities’, in P Hazell & A Rahman (eds), New directions for smallholder
agriculture, Oxford University Press, New York.
Wiggins, S & Keats, S 2014, Rural wages in Asia, Report, Overseas Development
Institute, London.
Wiggins, S, Kirsten, J & Llambí, L 2010, ‘The future of small farms’, World
Development, vol. 38, no. 10, pp. 1341–48
Willig, RD 1979, ‘Multiproduct Technology and Market Structure’, The American
Economic Review, vol. 69, no. 2, pp. 346–51.
249
Winters, P, Corral, L. & Gordillo, G 2001, ‘Rural livelihood strategies and social
capital in Latin America: implications for rural development projects’, Working Paper
Series in Agricultural and Resource Economics No. 2001-6, Graduate School of
Agricultural and Resource Economics, University of New England.
Wooldridge, JM 2012, Econometric analysis of cross section and panel data (2nd
edn), The MIT Press, London.
Wooldridge, JM 1995, ‘Selection corrections for panel data models under conditional
mean independence assumptions’, Journal of Econometrics, vol. 68, pp. 115–32.
World Bank 2000, Vietnam 2010: entering the 21st century, Vietnam Development
Report 2001, World Bank, Hanoi, Vietnam.
World Bank 2003, Vietnam: delivering on its promise, Vietnam Development Report
2001, joint report of World Bank and Asian Development, Consultative Group
Meeting for Vietnam, Hanoi.
World Bank 2006, Vietnam: business, Development Report No 34474-VN, World
Bank, Hanoi, Vietnam.
World Bank 2007, Accelerating rural development in Vietnam, Hanoi, Vietnam.
World Bank 2008, Agriculture for development, World Development Report 2008,
World Bank, Washington, DC.
World Bank 2009, World Development Report 2009, Reshaping economic geography,
Washington, DC.
World Bank 2011a, Market economy for middle-income Vietnam, Vietnam
Development Report 2012, World Bank, Hanoi, Vietnam.
World Bank 2011b, Vietnam food security and rice value chain: policy notes, World
Bank, Hanoi, Vietnam.
World Bank 2012, Vietnam rice, farmers and rural development: From successful
growth to sustainable prosperity, World Bank, Hanoi, Vietnam.
World Bank 2014a, Skilling up Vietnam: preparing the workforce for a modern market
economy, Vietnam Development Report 2014, Hanoi, Vietnam.
World Bank 2014b, Taking stock: an update on Vietnam’s recent economic
developments, The World Bank, 07/2014, Hanoi, Vietnam.
Yamauchi, F 2014, ‘Wage growth, landholding, and mechanization in agriculture’,
Policy Research Working Paper 6789, The World Bank.