
Policy Overview and Status of the AIDS Epidemic in Zambia Dr Ben Chirwa Director General National...
43
Policy Overview and Status of the AIDS Epidemic in Zambia Dr Ben Chirwa Director General National HIV/AIDS/STI/TB Council NAC Z A M B IA GOVERNMENT OF ZAMBIA NATIONAL AIDS COUNCIL
-
Upload
griffin-smith -
Category
Documents
-
view
216 -
download
0
Transcript of Policy Overview and Status of the AIDS Epidemic in Zambia Dr Ben Chirwa Director General National...

Policy Overview and Status of the AIDS Epidemic in Zambia
Dr Ben ChirwaDirector General
National HIV/AIDS/STI/TB Council
NACZAM B IA
GOVERNMENT OF ZAMBIA NATIONAL AIDS COUNCIL

Contents
1. Status of the Epidemic1. Status of the Epidemic 1. Status of the Epidemic1. Status of the Epidemic
2. Blind Spots2. Blind Spots 2. Blind Spots2. Blind Spots
3. Policy/strategy3. Policy/strategy 3. Policy/strategy3. Policy/strategy
4. Achievements4. Achievements 4. Achievements4. Achievements
5. Way Forward 5. Way Forward 5. Way Forward 5. Way Forward

1. Status of the Epidemic1. Status of the Epidemic1. Status of the Epidemic1. Status of the Epidemic

1.3% drop between 2001 and 2007 from 16% to 14.3%
(DHS 2001 and 2007)
Location: Urban = 20%: Rural = 10.3%
Gender: Female = 16%: Male = 12%
HIV Prevalence

0720.8
0714.5
0715.2
076.9
0717.5
0713.3
0710.3
01 8.3
0717.0
0113.1
0117.6
0122.0
0115.3
019.2 0119.9
0113.7
07 6.8
0111.2
01 = year 2001/207 = year 2007
Source: ZDHS 2007
Prevalence in Zambia by Province 2001/2 – 2007

6
Comparison HIV Prevalence by Province for 2001/2 and 2007
0.0%
5.0%
10.0%
15.0%
20.0%
25.0%
Lusaka Central C/belt Western Southern Luapula Eastern N/western Northern2001-2 22.0% 15.3% 19.9% 13.1% 17.6% 11.2% 13.7% 9.2% 8.3%
2007 20.8% 17.5% 17.0% 15.2% 14.5% 13.2% 10.3% 6.9% 6.8%
22.0%
15.3%
19.9%
13.1%
17.6%
11.2%
13.7%
9.2% 8.3%
20.8%
17.5% 17.0%15.2% 14.5%
13.2%
10.3%
6.9% 6.8%
HIV
Pre
vale
nce
Changes in Provincial HIV Prevalence between 2001/2 and 2007 ZDHS Results
Central: Increased 15.3% to 17.5%Western: Increased 13.1% to 15.2%Luapula: Increased 11.2% to 13.2%REMAINING SIX Provinces = Decreased
Central: Increased 15.3% to 17.5%Western: Increased 13.1% to 15.2%Luapula: Increased 11.2% to 13.2%REMAINING SIX Provinces = Decreased
Highest: Lusaka = 22% (2002)/ 20.8% (2007)Lowest: Northern = 8.3% (2002)/ 6.8% (2007)
Highest: Lusaka = 22% (2002)/ 20.8% (2007)Lowest: Northern = 8.3% (2002)/ 6.8% (2007)

7
Trend of HIV Prevalence Among Youths from 1994 to 2006 showed decline Based
Trend of HIV Prevalence Among Youths from 1994 to 2006 showed decline Based
1994 1998 2002 2004 2006
15-19 14.1% 10.9% 12.6% 11.7% 8.7%20-24 21.9% 20.7% 19.2% 18.1% 15.5%15-24 18.8% 16.6% 16.4% 15.9% 12.9%
14.1%
10.9%12.6% 11.7%
8.7%
21.9%20.7%
19.2%18.1%
15.5%18.8%
16.6%16.4%
15.9%
12.9%
0.0%
5.0%
10.0%
15.0%
20.0%
25.0%
Perce
ntag
e of Y
outh
Infe
cted
Trends in HIV infection among youths 15-24 from 1994 to 2006
HSS Report 2006
1994 1998 2002 2004 2006
HIV Prevalence 20.0% 18.6% 19.1% 19.0% 16.7%
20.0%
18.6%
19.1%
19.0%
16.7%
15.0%
16.0%
17.0%
18.0%
19.0%
20.0%
21.0%
Axis T
itle
Trend ANC Sentine Surviellance HIV Prevalence 1994-2006

There is increase in HIV prevalence in some sites-HIV % prevalence by year of ANC SS survey, 7 sentinel
sites, Zambia, 1993-2006
0
5
10
15
20
25
30
35
40
1993 1994 1995 1996 1997 1998 1999 2000 2001 2002 2003 2004 2005 2006
HIV
Pre
vale
nce in
Su
rvey S
ites
Kalabo Macha Chelstone Chilenje
Kalingalinga Matero Nchelenge Mean Rate

Status of the Epidemic
0
200000
400000
600000
800000
1000000
1200000
1400000
Tota
l po
pu
lati
on
15
ye
ars
an
d o
lde
r
Year
Total population
Total new infections
Total deaths

HIV Incidence in Zambia

HIV Incidence in Zambia
• HIV incidence rate reduces, the absolute number of new infections increases due to the increase in population size
• The estimated number of annual new infections in the adult population aged 15-49 years in 2007 and 2008 was 79,755 and 80,442, respectively.
• The number of annual new HIV infections among adults aged 15-49 years was estimated to have peaked in 1991 at 107,645.
• The lowest number of new infections among adults 15 years and older was 62,422 in 1997.
• The increase in the number of new cases after 1997 could be due to the increasing population size

0
0.5
1
1.5
2
2.5
3
3.5
4
4.51
97
0
19
72
19
74
19
76
19
78
19
80
19
82
19
84
19
86
19
88
19
90
19
92
19
94
19
96
19
98
20
00
20
02
20
04
20
06
20
08
20
10
20
12
20
14
Pe
rce
nta
ge o
f a
nn
ua
l ne
w in
fecti
on
s
Year
Males Females Total
Estimates HIV Incidence trend in Zambia

FigureRegression of HIV incidence among adults by year of end of
observation of cohort in different districts in Zambia
y = -0.1529x + 314.53R² = 0.0618
0.00
10.00
20.00
30.00
40.00
50.00
60.00
70.00
80.00
90.00
100.00
1986 1988 1990 1992 1994 1996 1998 2000 2002 2004
HIV
incid
ence
End year of cohortSource: USBUCEN HIV Global HIV database

2. Blind Spots2. Blind Spots 2. Blind Spots2. Blind Spots

Several blind spots which may contribute to another wave of increase exist!!!!!!!!

MSM study of N= 3,000 in four cities and two districts in Southern, Lusaka, Copperbelt and Luapula
Kaizar P. Zulu etal, 2004
ANAL Practice in different sub-pop

STI syndromes by Gender based on DHS 2007
0
1
2
3
4
5
6
7
STI Bad smelling/abnormal genital
discharge
Genital sore/ulcer STI/genitaldischarge/sore or
ulcer
STI Bad smelling/abnormal genital
discharge
Genital sore/ulcer STI/genitaldischarge/sore or
ulcer
Females Males
Reporting STI syndromes
% p
reva
lenc
e
Total 15-49
ZDHS 2007

LOW RATES OF MALE CIRCUMCISION
• Research shows ‘major’ benefit to males• Only 13% of men circumcised, despite general
openness to the practice – significant provincial differences
• HIV prevalence in circumcised men is slightly lower • Self-reported male circumcision is not always
accurate• Barriers exist in non-circumcising communities
• Note that women receive only slight deferred benefit from MC – still need to promote other strategies

Male Circumcision
Central Copperbelt Eastern Luapula Lusaka Northern North-Western
Southern Western TOTAL
Percentage of men 15-49 who report having been circumcised

MOBILITY & MIGRATION: Being away from home increases risk of for all in stable employment including
Government staff
• More nights away can increase risk for the traveller and/or those who stay home, esp for women
• Mobile workers and migrants form sexual networks with women who sell sex
• Large mobile groups in Zambia include truck drivers, sex workers (incl informal), fishermen/women and fish traders, seasonal agricultural workers, cross border traders, miners, uniformed services personnel, prisoners, and refugees.
• Migrant labour is associated with both males and females seeking partners outside marriage and has been a leading factor in the spread of STIs.

MODE OF TRANSMISSION MODELLING OF INCIDENCE:
Distribution of new infections by mode of exposure in the adult population
0 5 10 15 20 25 30 35 40
Injecting Drug Use (IDU)
Partners IDU
Sex workers
Clients
Partners of Clients
MSM
Female partners of MSM
Casual heterosexual sex
Partners CHS
Low-risk heterosexual
No risk
Medical injections
Blood transfusions
Risk
gro
up
Percent
MOT Report 2008
Adult Risk Behavior Incidence
% of incidence
Injecting Drug Use (IDU) 0 0.00 Partners IDU 0 0.00 Sex workers 557 0.75 Clients 2,997 4.04 Partners of Clients 1,341 1.81 MSM 732 0.99 Female partners of MSM 40 0.05 Casual heterosexual sex 25,222 33.96 Partners CHS 27,500 37.03 Low-risk heterosexual 15,734 21.19 No risk 0 0.00 Medical injections 124 0.17 Blood transfusions 16 0.02 TOTAL ADULT POPULATION 74,263

What does all these data tell us about the epidemic?
• There is decline in HIV prevalence in general population but increase in absolute number due to successful ART policy
• There hotspots existing which might contribute to another wave of increase in HIV incidence
• HIV prevalence is highest among widows and separated in both urban and rural among women
• HIV prevalence is positively correlated with employment and educational status

What does all these data tell us about the epidemic?
• HIV prevalence increases among pregnant women with increase in age disparity among partners
• Overall incidence is also on the decline but increase in absolute numbers due to population increase.
• Key behavioral indicators supporting this is partner reduction

prevalence
PLHA
incidence
Current response: prevention
determinants ofincidence
Current response: care and treatment
deathSource: ASAP Training, 2007

Drivers of Epidemic
Multiple and concurrent sexual partners
lack of male circumcision
low rates of condom use
high alcohol and drug abuse
Low Risk Perception
High mobility
High STIRisky cultural practicesGender based violence
High STIRisky cultural practicesGender based violence

Key Performance Indicators of the Response
0% 20% 40% 60% 80% 100%
KNOWLEDGE
HCT
PMTCT
ART
Zambia
2005 achievement 2007 achievement 2010 targets

3. Policy/strategy3. Policy/strategy 3. Policy/strategy3. Policy/strategy

‘3 Ones’ principles application
One national AIDS strategic framework 2006-2010
One national coordinating body - the NACReports to Cabinet Committee on AIDSDecentralised structuresStakeholders coordination through self-coordinating groups
including Cooperating partners
One M&E system
Multisectoral ResponseMultisectoral Response

National Goal, Vision and Mission
Universal
access
Halt and begin to revise spread
and mitigate impact
Multisectoral Response
Coordinated by NAC
A nation free from A nation free from the threat of HIV and the threat of HIV and
AIDS.AIDS.
Integrated into
dev agenda
Scale up prioritized actions

Prevention Response
PTS,MC, B
CC, STI,
Wor
kpla
ce
PMTC, health care settin
gs
Package
Blood safety
PEP, Injection safety
Stigma and Discrimination
CT
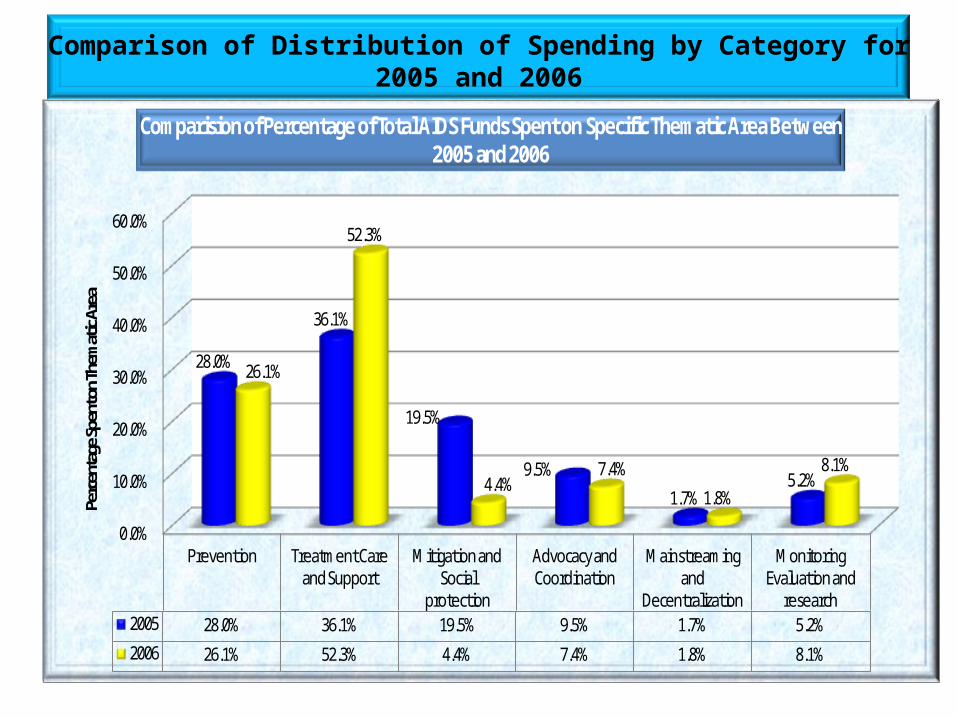
Comparison of Distribution of Spending by Category for 2005 and 2006
0.0%
10.0%
20.0%
30.0%
40.0%
50.0%
60.0%
Prevention Treatment Care and Support
Mitigation and Social
protection
Advocacy and Coordination
Mainstreaming and
Decentralization
Monitoring Evaluation and
research2005 28.0% 36.1% 19.5% 9.5% 1.7% 5.2%
2006 26.1% 52.3% 4.4% 7.4% 1.8% 8.1%
28.0%
36.1%
19.5%
9.5%
1.7%5.2%
26.1%
52.3%
4.4%7.4%
1.8%
8.1%
Perce
ntag
e Spe
nt on
Them
atic A
rea
Comparision of Percentage of Total AIDS Funds Spent on Specific Thematic Area Between 2005 and 2006

4. Achievements4. Achievements 4. Achievements4. Achievements

What is working in the Response
• PMTCT services has reduced transmission rate from mother to children from 30% to 12.4% (SIDA Report)
• We have 100% blood safety programme but we do not know the transmission rate through blood
• Peer programmes for young people are effective for promoting sexual debut

What is working in the Response
• There is sustained change in perception through BCC. But messages need to be segregated
• Condom promotion is effective in casual sex and among most at risk groups but need to look at stable relationships
• Positive prevention among PLHIV but need to scale interventions on discordant couples

Percentage of donated blood units screened for HIV in a quality-assured manner
Zambia maintained 100% screening for HIV of all blood units collected in a quality assured manner for both 2006 and 2007
Data does not include blood units collected or screened by the private sector and rural facility blood transfusion practices not linked to the nine national sites.

Percentage of women and men with advanced HIV infection receiving antiretroviral therapy
ART programe coverage increased from 32.9% in 2006 to 70% June 2009
245,000 total on ART of which 20,000 are children
427 ART sites established nationwide with cover.
Percentage of HIV-positive pregnant women who received anti-retroviral prophylaxis to reduce the risk of mother-to-child
transmission
• Increased from 29.7% in 2006 to 50% in June 2009
• The number of sites in all 72 districts have increased from 67 in 2005 to 307 in 2006 678 in 2007, and 937, 2009

Percentage estimated HIV-positive incident TB cases that received treatment for TB and HIV
• 39% of co-infected cases receive treatment for HIV and TB
• Approximately 70 percent of people with TB are co-infected with HIV

Percentage of women and men aged 15-49 who received an HIV test in the last 12 months and who know their results
• 15% of women and men aged 15-49 have a received a test in the 12 months and know their results.
• 85% does not know their status• Over 1500 sites established
nationwide

5. Way Forward 5. Way Forward 5. Way Forward 5. Way Forward

1. Target specific populations with specific programmes in specific areasBehaviour change communication programme
Couples The youthMobile populationsMSM
Social and cultural norm strengthening and change communication programme
Community leadersElders and advisors in the community
PMTCT programme All pregnant women and their partners,
Counselling and Testing programme Couples in urban areasIndividuals who request the service

2. Establish AIDS Fund
• This will sustain current investment by government


![Chirwa consolidated judgment - SAFLII · SKWEYIYA J 5 [11] Ms Chirwa refused to participate in the 22 November 2002 enquiry on the grounds that she objected to Mr Smith being “the](https://static.fdocuments.net/doc/165x107/5b92a0c109d3f23a718c308d/chirwa-consolidated-judgment-skweyiya-j-5-11-ms-chirwa-refused-to-participate.jpg)

