Policy Macropunctuations: How the US Budget Evolved
42
Center for American Politics and Public Policy Department of Political Science University of Washington Seattle, WA 98195 Policy Macropunctuations: How the US Budget Evolved Bryan D. Jones University of Washington Frank R. Baumgartner Pennsylvania State University James L. True Lamar University Paper distributed for discussion at Budgetary Policy Change: Measures and Models, Conference at Nuffield College, Oxford, March 8-9, 2002.
Transcript of Policy Macropunctuations: How the US Budget Evolved

Center for American Politics and Public Policy
Department of Political Science University of Washington
Seattle, WA 98195
Policy Macropunctuations: How the US Budget Evolved
Bryan D. Jones University of Washington
Frank R. Baumgartner
Pennsylvania State University
James L. True Lamar University
Paper distributed for discussion at Budgetary Policy Change: Measures and Models, Conference at Nuffield College, Oxford, March 8-9, 2002.

1
Policy Macropunctuations:
How the US Budget Evolved1
In policymaking, new ways of thinking about public problems, rapid mobilizations of new constituencies, changes in institutional structures, and the self-reinforcing effects of these trends occasionally combine to create dramatic and unpredictable policy changes in an issue area. Such punctuations are an important part of policymaking even if most policies most of the time are subject to no such dramatic events. Rather than making moderate adaptive adjustments to an ever-changing environment, political decision-making is sometimes characterized by stasis, when existing decision designs are routinely employed, and sometimes by punctuations, when a slowly growing condition suddenly bursts onto the agendas of a new set of policymakers or when existing decision makers shift attention to new attributes or dimensions of an existing situation. Complex interactive political systems do not react slowly and automatically to changing perceptions or conditions; rather it takes increasing pressure and sometimes a crisis atmosphere to dislodge established ways of thinking about policies.
Issue area by issue area, the political system considers and often adopts
major changes or redirections in policy without changing the general consensus about the duties and limits of government. Yet that understanding and the policies and budgets that follow it can also undergo a broad major change that we term a ‘macropunctuation’. The result is periods of stability interspersed with occasional, unpredictable, and dramatic change (Baumgartner and Jones 1993; Jones 1994; Dodd 1994; Kelly 1994; Carmines and Stimson, 1989, Jones, Baumgartner, and True 1996).
In this chapter and the chapter that follows, we detail a theory of budgeting
that 1) integrates budget theory into a broader model of policymaking; 2) solves the old debate over budget incrementalism; and 3) provides extensive examination of both macro and micro budget choices. The result is an entirely new approach to understanding government budgeting, one that is much more seamlessly integrated into our broader theory of the policy process. This chapter provides a bird’s eye view of public budgeting, focusing on “macro-punctuations” in government taxing and spending. In the next chapter, we study budget volatility masked by the macro-level patterns that serve as the focus of this chapter. In the end, we show
1) The occurrence of a limited number of distinct macro-punctuations in government budgeting that respond to a combination of external shocks and internal dynamics;
2) A pattern of punctuations that cannot be explained by typical political and economic factors: partisan control, public opinion, and economic growth;
1 This chapter draws in part on: Bryan D. Jones, Frank R. Baumgartner, and James L. True. 1998. Policy Punctuations: U.S. Budget Authority. 1947-1995. Journal of Politics 60: 1-33.

2
3) The occurrence of considerable year-to-year volatility in the funding of government programs even in the absence of macro-punctuations; and
4) A substantial and distinct decline in budget volatility in the post-war period.
Policy Traces
In the study of policy change, we cannot observe the past directly. Instead we rely on archival traces of past events. These traces can be contemporary accounts, including the reports of participants, news coverage of events, or academic studies of these events. It can also include interpretations of contemporary accounts produced from the written record, such as later recollections of participants or academic reconstructions of these events. Finally, it can include quantitative traces of these events. All of these approaches have validity; all have pitfalls. In this book, we rely primarily on quantitative traces of policy change, but of course we supplement with other sources in our reconstruction of the past.
The most studied, by far, quantitative indicator of past policy change are government budgets. Government budgets indicate the course of public policy: who wins, who loses, and what policy ideas are being implemented. Unfortunately political scientists have failed to produce the long-sought theory of budgeting (see Key, 1940). In general, studies of public budgeting have failed on two scores. They have neither convincingly linked the process of decision-making to budgetary outputs nor have they been able to unify the study of budgets within a broader framework of policy change.
Advantages of the government budget as a time trace of public policy include its seeming constantancy of measurement, its long-running character, and its use of policy content to categorize expenditures. It is also the quantitative indicator that is most subject to misinterpretation. Budget numbers do not always mean what they seem to mean. Public Budgets, Public Decisions
For better or for worse, the concept of incrementalism has dominated discussion of federal budgeting during the last third of a century. Scholars drawing on Wildavsky (1964) and others have argued that annual budget results tend to drift rather than to shift abruptly. Budgets seem to have been powerfully affected by the concepts of “base” and “fair-share,” which assume that each year’s budget should be based on the previous allocation and that any increment should be shared relatively equally across categories and agencies. The incrementalists based their approach to budget behavior on models of decision-making featuring “considerations of limited rationality in the face of complexity and uncertainty” (Davis, Dempster, and Wildavsky, 1974:421) In that framework, outputs are governed by standard operating procedures, and these SOP’s are incremental in nature. Participants have been expected to use incremental decision-rules for three reasons. The first involves the relative ease of reversing mistakes following incremental
3
changes. The second concerns the desire of participants to establish stable expectations in a complex and uncertain environment. The third concerns the nature of overlapping, conflicting, and interacting institutions in American politics, which push participants toward compromise (Lindblom, 1959; Wildavsky, 1964; Fenno, 1966; Davis, Dempster, and Wildavsky, 1966, 1974). The incrementalist theory of budgeting has, it would seem, been thoroughly routed. Critics have noted problems in the models used by Davis, Dempster, and Wildavsky (Natchez and Bupp, 1973; Gist, 1982; Meyers, 1994), in the measures used (Wanat, 1974), in the conceptual clarity of terms (Berry, 1990; Hayes, 1992), and in the nature of the underlying decision-making model (Padgett, 1980). Others have complained of problems in capturing the complexities with simple theories of budgeting, particularly the incremental model (Schick 1988, Rubin 1988, Kiel and Elliott 1992)
The characterization of the early bounded rationalists in budget studies as supportive of incrementalism is not entirely true. Davis, Dempster, and Wildavsky (1966, 1974) detailed the operation of boundedly-rational budgetary procedures, but they were embedded within budgetary epochs. These epochs shifted the parameters of the incrementalist model (to larger or smaller coefficients during different periods), implying a non-incremental step between epochs. The epochs, however, were entirely driven exogenously 2 Decision-Making in Political Institutions Two premises underlie the approach we develop here. One premise concerns the process of individual political decision-making; the second relates to the process by which political institutions aggregate those choices. Choice in politics is attention-driven (Jones 2001). Attention is a scarce resource in politics, and, because of human cognitive architecture, can be devoted only to one element at a time. Attention may or may not be event-stimulated, and even then the policy solutions attached to the event may not be self-evident. As Cohen and March (1972) and Kingdon (1995) note, problem definition and solution choice can be quite independent events. In the case of such attention shifts, rapid changes in outcomes, including budget outcomes, are probable. Even though all choice situations are multifaceted, decision-makers tend to understand choices in terms of a very circumscribed set of attributes, and they tend to have considerable difficulties in making trade-offs among attributes. So there is a tendency in decision-making to hew to a decision design (which refers to the attributes used in structuring a choice [Jones, 2001]) until quite literally forced to re-evaluate it. When one re-evaluates, because of changing circumstances or because of changing understandings of them, the result is often not modest adjustment but major change in choice. As a consequence, decisions tend either to be static, arrived at by applying the
2 Davis and his colleagues estimated a statistical model in which exogenous variables that
presumably governed epoch shifts were allowed to influence the parameters that described the incremental budgeting procedures observed within the periods.

4
current decision design to the new choice situation, or disjoint, arrived at by utilizing a different decision design which incorporates new attributes into the choice structure. Decision-making takes place within political institutions, and political institutions amplify the tendency toward decisional stasis interspersed with abrupt change. American political institutions make mobilization to overcome entrenched interests necessary, thereby leading to institutionally-induced stability interrupted by bursts of change. Occasionally, in almost every issue area, the usual forces of negative feedback and subsystem maintenance are replaced by deviation-enhancing positive feedback forces. This leads to episodic and sporadic change (as institutionally-induced stability tends to reassert itself after the punctuation).
Our agenda-based model implies that punctuations ought to occur at all levels of policymaking, and not simply be driven by external (exogenous) factors in a top-down manner. This is a consequence of two factors. First, policymaking is rooted in human decision-making processes that are hostage to the statics and dynamics of selective attention to underlying attributes structuring a political situation, and these should more or less continually affect the policy process. Second, the model of punctuated policy equilibrium is based in part on a ‘bottom-up’ process in which policy change may occur in isolated subsystems or may spill over into other, related subsystems, or may be affected by exogenous shocks (Baumgartner and Jones, 1993). Because national budget decisions take place within political institutions, we expect that elements of hierarchy and strategy will produce an inequality in the transmission of punctuations from one level to another. Both the president and congress are capable of transmitting top-down budget changes to all agencies at once. This constraint implies that top-down punctuations from fiscal stress will be more easily transmitted to departments, agencies, and bureaus than bottom-up punctuations from within those institutions will be transmitted upward. This inequality in the transmission of punctuations implies fewer punctuations at the top than at the bottom levels of governmental organization. Many different models of the policy process predict abrupt change, but they generally postulate exogenous change. In particular, there is ample precedent in the empirical and theoretical literature on public budgeting to expect budget punctuations, beginning with Davis, Dempster, and Wildavsky. Their studies focused on the use by decision-makers of budget decision rules. These rules, understood by participants and offering a stable organizational environment for decision-making, were based on the concepts of base and fair-share, which led to incrementalism in both process and output. But they go on to say that “although it is basically incremental, the budget process does respond to the needs of the economy and society, but only after sufficient pressure has built up to cause abrupt changes precipitated by these events” [italics added] (Davis, Dempster, and Wildavsky, 1974: 421). That is, the budget process is punctuated by periods of abrupt change; the inter-change periods of stability were termed ‘epochs’. Models of exogenously-forced policy change are not only found in the budget literature, but also are suggested in the work of comparativists (Krasner, 1984), students of American institutions (Dodd, 1991; Kelly, 1994)), and students of the process of representation. In the case of representation, changes in public policy are exogenously

5
driven by changes in public opinion (Stimson, MacKuen, and Erikson, 1995), or both respond to opinion and cause changes in opinion through a thermostat-like device (Wlezien, 1995). Punctuations should occur in such models only if there are changes in macro-level forces. Other authors have allowed for endogenous and exogenous changes. Kiel and Elliott (1992) have suggested that budgeting be approached from a perspective of nonlinear dynamics. They write that the existence of likely nonlinearities in the budgeting process in which “exogenous and endogenous forces simply have varying impacts on budget outlays over time” (Kiel and Elliott 1992: 143). Such nonlinear, interactive processes imply occasional punctuations. Thurmaier (1995) reports the results of experiments in budget scenarios in which decision-makers shift from economic to political rationalities after the introduction of new information about political calculations. Such shifts in the bases of decisions can lead to punctuations. One scholar has provided a model of budget decision-making that does not rely on the artificial distinction between exogenous punctuations and more typical and incremental decision-making. Padgett’s (1980:366) serial judgment model implies “the occasional occurrence of very radical changes”. Decision-makers move from a status quo point by serially processing the next closest option until a satisfactory one is found. External changes can shift the attention of policymakers to new political realities, changing the internal dynamics of decision. Both Padgett’s serial judgment model and our agenda-based approach allow for endogenous mobilizations as well as exogenous shocks, whereas Davis, Dempster, and Wildavsky suggest only exogenous shocks, but all three suggest punctuations in the budget process. The mistake of those focusing on exogenous change is to ignore the role of internal dynamics in delaying or exaggerating responses to perceived change. Our theory of budgeting, then, centers on the interaction between factors internal to the participants of the policymaking process and exogenous events in the political and economic environment. The mistake of the incrementalists was to ignore the reverberations of external events on the organizational processes upon which budgets rest. The mistake of those focusing on exogenous forces is to ignore the role of internal dynamics in responses to external change. Part I: A Long View of US Budget Change Figure 1 presents a very long-range view of the US national budget. We present the inflation-adjusted annual totals for budget outlays3 from 1801 through the present on a logarithmic scale. Several aspects of the graph are noteworthy. First, wars always ratchet up governmental expenditures substantially relative to the baseline of expenditures before the war. Once ratcheted up, the level of expenditures following the war never drop back to the pre-war level—a phenomenon
3 Budget outlays are government payments, and as a consequence are entered when the expenditure occurs. In many cases, expenditures may not be entered at the same time that allocations are made; as a consequence, they are not always a good measure of government decision making. Outlays, however, are the only reliable totals available for the period before the Second World War.

6
noted for Great Britain by Peacock and Wiseman (1961[1994]). Finally, it is clear that the period since the Second World War has been a period characterized by a declining rate of increase in the size of the US government. The use of a logarithmic scale means that changes on the graph are actually changes in the rate of change, so that the declines do not mean that government is shrinking, but they do mean that the rate of growth is growing evermore smaller.
[Figure 1 about here] Is the ‘war ratchet’ simply a matter of not being able to cut military expenditures once the war is over? Figure 2 indicates that this is not at all the case. Following the Civil War, military expenditures dropped back to their pre-war levels, but domestic expenditures continued at their wartime maximum—right through until the First World War. During the WWI, domestic and military expenditures ratcheted up to the same level. After the war, defense expenditures dropped to their pre-war level, while domestic spending dropped, but only to a level much higher than the pre-war level. During the Second World War, both domestic and military expenditures exploded. After the war, defense outlays dropped, but stabilized at a level much higher than the pre-war level. Domestic expenditures did not drop.
[Figure 2 about here] Defense expenditures ratcheted up during the Korean War, this time to remain at the higher level, but what happened to domestic expenditures was quite different and quite remarkable. This time, there was no war-related domestic ratchet, but domestic spending seems to have been stimulated into an increasing rate of growth, a rate that did not stabilize until the mid-1980s. War, then, causes major changes in government expenditures, but the long-run effects are much more severe for domestic than for defense expenditures. The simple, easy explanation that war benefits military bureaucracies does not seem to be correct. Somehow wars empower domestic constituencies. Expenditures are only part of the story of government finances; the other part involves taxes. Figure 3 examines the war ratchet from the perspective of tax receipts rather than expenditures. Between 1941 and 1945, national government receipts soared from 7 to over 20% of GDP. The national government ‘take’ stabilized at around 18% until the early 1990s, when it experienced a sustained period of growth. Government expenditures, however, did not grow during this time, because deficits shrunk and from 1997 through 2000 the national government ran substantial surpluses.
[Figure 3 about here] Figure 4 studies the politics of deficit financing. Beginning in the early 1950s, right through 1980, the US government was on a glide path toward increasing deficits. The decline is linear throughout the period, but by the 1970s the results of this deficit regime were becoming pronounced. With Reagan’s election the deficit situation grew sharply worse, as the slope of the curve became sharply negative. The Reagan and First Bush presidencies rung up tremendous deficits in comparison to what might have been predicted from the previous thirty years of government finance history. From the historical perspective of government finance, Reagan’s first term marked a dramatic break from the past.
[Figure 4 about here]
7
Even more dramatic is the turn-around in the deficit picture that occurred immediately after the election of Bill Clinton. As a consequence of budget balancing attempts by GHW Bush and Clinton in the early 1990s, some Congressional process controls in the Budget Enforcement Act of 1990, and a steadily expanding US economy, deficits began rapidly shrinking, until in FY 1997 the total federal budget moved into the black. Another sharp turn in deficit financing has occurred in FY2002, as GW Bush ran the first deficit since 1997. At least since 1981, presidential elections replacing one party with the other have proved to be turning points in deficit politics. Figure 5 makes it clear that the turning point affected expenditures pivoted in 1991, prior to the election of Clinton, during the late GW Bush presidency. The politics of expenditure limitation and deficit reduction that characterized that period clearly had effects in the macro-finances of the Federal Government.
[Figure 5 about here] The particulars of the Second World War era in US finance may be seen in more detail in Figure 6. There we graph the budget shares consumed by major budget functions. Between 1952 and 1975, defense consistently lost budget share to domestic priorities (denoted here by income transfers to individuals and intergovernmental grants). The defense decline was halted that year, and the defense share actually grew during the Reagan years. Most remarkably, the Viet Nam War reduced the decline in defense share only for two years, 1965 and 1966.
[Figure 6 about here] Interestingly, transfer payments to individuals did not consume an increasing share of the national budget until the Nixon administration. During the Kennedy and Johnson years, the budget share going to transfers was constant. Between Nixon’s inauguration and his resignation, transfer payments by the national government rose from 24% to 43% of the US budget. Note, too, the increasing share going to transfers during the Eisenhower presidency. If we examine federal budgeting over the very long run, we observe lots of incrementalism and drift. Mostly the year-to-year changes in federal expenditure patterns are quite stable. But there are several very important dramatic shifts, generally associated with war mobilizations that change the trajectory of federal financing. Moreover, these changes mostly affect domestic budgeting. It is unclear which federal functions are most affected by war, but what is clear is that wars offer a huge opportunity for the building of new domestic program initiatives. In addition, there occur in the budget trajectory turning points that define budget eras. An examination of overall expenditure and taxation patterns indicates that a clear break with past practices occurred around 1992. The pattern is clear for deficits and for expenditures. As we see below, a focus on domestic spending only suggests an earlier break, but there is little doubt that the Clinton presidency marked a dramatic shift in budget politics. PART II: Macropunctuations in the US Budget since the Second World War
We now turn to a more intense scrutiny of policy punctuations in US
policymaking since the Second World War. Policy punctuations can occur at all

8
levels of activity—in programs, in agencies, within broad functional categories of government activities, and within government overall. Punctuations may affect, say, related subsystems without affecting the rest of government. But when major changes in the understanding of the role of government occur, virtually all programs and subsystems of activity will be affected.
Here we use a new dataset tabulating congressional budget authority at the
Office of Management and Budget (OMB) subfunction level that ensures strict comparability across time. Our analysis indicates the presence of two dramatic shifts in spending for domestic programs since the Second World War. These two shifts effectively divide the post-war period into three epochs. These epochs seem to correspond to widely shared, but dramatically different, conceptions of the proper role of government during these three periods.
Several scholars have argued that shared understandings about the proper
role of government and its policy instruments change over time (Kingdon 1995). In some periods, cultural underpinnings support an active government that may solve some problems and redistribute income, but which may also undermine economic growth. In others, efficiency in government and growth-oriented policies may be favored (Webber and Wildavsky 1986; Hirschman 1988). These epochs of shared understandings can shift fairly quickly (Dodd 1994; Kelly 1994).
Abrupt shifts in policy can also result from an inherently non-incremental
nature for some policies (Schulman 1980), and may affect some subfunctions or subsystems and not others (Baumgartner and Jones, 1993). At the highest level, however, shifts in attention, decisions, and policies can affect all categories of governmental expenditures simultaneously, although some categories may be affected more than others. This implies that we should be able to isolate periods of higher general government spending and periods of lower spending separated by disjoint punctuations.
The theory of policy punctuations does not lead simply to point predictions of when and in what area the next punctuation will occur. Punctuations are not easily associated with the ebb and flow of political and economic forces. If episodes of disjoint change were simply and directly associated with such forces, then an independent theory of policy change based on notions of punctuated equilibrium would not be necessary. If, for instance, government budgets simply adjust reasonably quickly to economic circumstances, and economic circumstances cyclically undergo booms and busts, then one does not need a theory of political change that acts independently of economic shifts. Indeed, this was the thinking of the early scholars employing quantitative indicators to study public policy (Dye 1966). If electoral mobilizations result in an activist party being elected, and this party expands government, one needs a theory of electoral change, but one does not need an independent theory of policy punctuations. Similarly, if public opinion drives the policy process, measures of change in opinion should predict outcomes in such a way as to render superfluous any notions of punctuation and disjoint change. If these or other economic and political forces are sufficient to account for observed policy punctuations, then we have no need for a model of punctuations.
9
If, on the other hand, institutions of government do not allow for smooth and
continual adjustment to the various social, political, and economic forces that affect the federal budget, then no set of indicators should predict clearly when we will observe dramatic shifts in policy outputs. We should expect changes to correspond roughly to changes in general understandings of the proper role of government, but the precise timing and size of these changes may not be predictable. As a consequence, the traditional statistical approaches in political science, relying on linear models that predict the exact occurrence of a policy change, need to be supplemented. We proceed as follows. First, we hypothesize the existence of punctuations that will emerge in aggregate budgetary time series. That is, punctuations will not simply be confined to policy subsystems, but will also emerge at the macropolitical level. Second, we hypothesize a generalized stasis between these punctuations, even in the face of changing exogenous circumstances. Economic and political trends may affect these periods of budgetary stasis at the margins, but the stasis should, in effect, dominate the variability in economic and political trends.
To make empirical progress, we first think through what we might expect in
recent political history if the punctuation hypothesis were correct. As a starting-point, we suggest that the post-war period can be divided into three epochs divided by two major punctuations. Many have argued that the post-war period can be divided into a period of quiescence, especially during the 1950s; a period of political reform and activism during the 1960s and 1970s (see Mayhew 1991, 162); and an “era of limits” in which the public mood has emphasized the virtues of smaller government (see Dodd 1995). Unfortunately we have no way of specifying the exact occurrence of these punctuations, if they exist, and we will need to turn to an examination of our time series to pinpoint them. The absence of any statistically significant punctuations in our budget series would be clear evidence against the theory of punctuated change, but their presence could also be due to rival hypotheses. Our strategy is, therefore, to demonstrate first that there are clearly definable epochs, then to attempt to explain the punctuations we observe with potential rival hypotheses. We leave the details of our tests to an appendix.
To study these aspects of national budgeting, we use our data U.S. budget authority from Fiscal Year (FY) 1947 through FY 2000 (see Data Appendix for details). Here we focus on Congressional Budget Authority, whereas previous expenditure and budget studies have examined either appropriations (which can omit trust fund spending and confuse the timing for contract spending) or outlays (which are far “downstream” from the political decision-making process). Because outlays in effect “spend out” budget authority over a period of time, they will mute punctuations that occur in the actual decision-making process. Budget authority reflects the decisions that policymakers are called upon to make.
Such data have previously been unavailable for such an extended period of time. We use the Office of Management and Budget’s subfunction level, which divides the seventeen core governmental functions into 74 groupings based on the national purposes they are supposed to serve. Subfunctions focus on the long-term government purpose that is served, e.g., food and nutrition assistance, conservation

10
and land management, pollution control and abatement, or atomic energy defense activities). Subfunctions can be aggregated into functions (such as income security, natural resources, or national defense) and, with care, into macrofunctions (such as mandatory or discretionary spending). Here we concentrate on the 14 functions and 56 subfunctions associated with domestic spending. Isolating the Punctuations
Figure 7 presents the medians of annual percentage changes in the domestic budget from FY 1947 through FY FY2000 after the effects of inflation have been removed. The median change captures the typical shift in government programs characterizing a budget year; as a consequence, it captures the disaggregated nature of much congressional budgeting.
[Figure 7 about here] Figure 7 shows that the typical pattern across domestic subfunctions during
the post-war period is for government to grow; exceptions are particularly notable during the early Eisenhower and Reagan presidencies as well as in FY 1973-74 during Nixon’s large budget impoundments (Wlezien 1994).4 The period between 1956 and 1973 was the period in which the typical federal subfunction grew most—it is the only period in which the median subfunction never declined. Since then, the typical government function has grown only glacially. The technical appendix includes information about the estimation of an intervention time series analysis using two punctuations and three epochs. The model fits very well statistically, and the predictions from that model are displayed on Figure 7.
As damaging as this simple model is to the unvarnished incrementalist
position, it nevertheless continues to mask great underlying volatility. In all years a number of subfunctions decreased even when the typical subfunction grew rapidly. In each year, a considerable number of federal budget categories saw dramatic downward adjustments while others were experiencing sharp increases. Even during periods of relative growth, that growth was not evenly distributed; the idea that government programs are rarely cut, only increased, is largely myth. It would be inaccurate to base an understanding of budgetary politics only on measures of central tendency across budget categories, and we examine this budget volatility in the next chapter.
Historians may argue that the whole period since the Second World War constitutes a single period in our nation’s history—given the disruption in even domestic spending patterns that a major war brings (Peacock and Weisman 1961 [1994]) and its long-term effects on the institutions of government and the economy (Hughes 1991). But within this period, there seem to be three identifiable epochs: One of large transitions between war and peace; a second associated with general growth of government; and the last associated with spending restraint.
4 Kiewiet and McCubbins (1991, 189–91) reported a roughly similar pattern for a less inclusive dataset.
11
Eisenhower’s Peace Dividend: 1956. In retrospect, the shift from the large changes of the Truman administration and the early Eisenhower years was a dramatic one. 5 Large growth was occurring in the U.S. military forces and in the atomic weapons called for in the New Look and Massive Retaliation, but the spend-down associated with the end of the Korean War offered the possibility of a real ‘peace dividend’. Early Eisenhower administration concerns that large allocations to the military should not unbalance U.S. institutions or the domestic economy (NSC-162/2 1953; Murphy 1956; Huntington 1961; Schilling, Hammond, and Snyder 1962) appear to have changed radically in 1956 and 1957 with major new urban housing and renewal efforts, the passage of the Interstate Highway Act and multiple national responses to the Soviet launch of Sputnik (see Dodd 1994).
Until FY 1956 large increases were prevalent in national budgets, but they
were balanced by many large decreases. The high level of median percentage changes after FY 1956 indicate that government had embarked on a period of large real growth that continued through the Kennedy, Johnson, and first Nixon administrations. The middle years of the Eisenhower administration seemed to mark a shift in which the U.S. government adopted both an internationalist stance in foreign policy, emphasizing a globally capable, standing military force and nuclear deterrence, and simultaneously committed itself to improve the domestic infrastructure. Before Johnson’s “Guns and Butter” there was Eisenhower’s “Bombs and Highways.”
The Budget Wars: 1976. The end of the epoch of large increases in the mid-
1970s was marked by intense congressional-executive disagreement concerning control of the budgeting process—the so-called “Seven Year Budget War” (Kiewiet and McCubbins 1991, 77). The events of the mid-1970s seem to have acted as a delimiter between an era of growth, in which the typical response of governmental officials was to try to build programs, and an era of restraint, in which politicians have struggled with tax limitations (especially in the indexing of the income tax) and soaring deficits.
In 1973, President Nixon claimed the authority to impound congressional
appropriations; these impoundments had considerable effects on the budget process (Wlezien 1994). The ensuing budget fight culminated in the Congressional Budget and Impoundment Control Act of 1974, which was first fully implemented in President Ford’s proposed budget for Fiscal Year 1976. The act limited the president’s ability to impound congressional appropriations and imposed a measure of discipline on the internal congressional budgeting process. It established the present Congressional
5 When Davis, et al., (1966, 539) examined shift points in bureau-level domestic appropriations for FY 1948-1962, they found the preponderance of the shifts occurred in the first two years of the Eisenhower administrationFenno (1966) focused on organizational integrity and excluded organizations that had experienced startups or large changes; he then found that his results supported incrementalism (1966: xxiv, 354-5). However, Davis, et al., (1966) did not make this exclusion and found that their results supported both incrementalism and bureau-level “shift points,” most of which occurred in the FY 1954 and FY 1955 budgets of the Eisenhower administration (1966:540-1).

12
budget process, the House and Senate Budget Committees, and the Congressional Budget Office (Wander et al. 1984; Schick 1995).
The conventional wisdom is that the act resulted not in more fiscal discipline,
but less (Fisher 1985; Kamlet and Mowery 1992 [1985]), and this view agreed with the opinions of the participants in the budget process at the time (Kiewiet and McCubbins 1991, 77–91; cf. Wander 1984; Schick 1995). And, of course, deficits soared after that period. The empirical record, however, suggests that the budget battles of the mid-1970’s changed the course of US budget policy, transforming the post-war period from one of robust growth in real dollar spending to one of very modest increases. Discretionary vs. Mandatory Spending The Budget Impoundment and Control Act gave Congress a mechanism for examining and controlling discretionary spending, but it was likely to be less effective in the case of mandatory spending (Padgett 1995). So we disaggregate domestic spending into its mandatory and discretionary components. Discretionary spending is largely considered annually by the Appropriations Committees and Subcommittees, once the traditional “Guardians of the Treasury” (Wildavsky 1964; Fenno 1966); it is financed from the general fund. Mandatory spending usually has a permanent appropriation (Schick 1995), and responsibility for adjustments is dispersed among the revenue, public works, and appropriations committees (Cogan 1994); it is usually financed through trust funds.
We examined the budget series separately for mandatory spending and discretionary spending. Discretionary spending changes rose dramatically in the second epoch and dropped dramatically in the epoch of restrained spending. The changes were statistically significant, and the punctuations appear clear. Full information is presented in the technical appendix.
Mandatory spending responded to the epochs as discretionary spending did,
but the changes were not so large nor was the second punctuation as clear-cut as was the case with discretionary spending (full information on the estimation of this model is presented in the technical appendix). The Congressional Budget Act of 1974 may mark an epoch change for mandatory spending, but it is less likely to have had much causal effect on it.6 Although the Act called for new forms of mandatory spending to be referred to the Appropriations Committees, existing trust funds (such as Social Security and Medicare hospital insurance) were largely exempt from this new control on backdoor spending. (They also avoided the permanent sequestration requirements of Gramm-Rudman-Hollings [Meyers 1994, 139]).
6 In the 1970s, mandatory spending was influenced by two major changes. This was the period of the greatest expansions in indexing of entitlements (Weaver 1988). On the other hand, the 1974 Congressional Budget Act at least provided a framework in which to consider changes to entitlements in the form of the reconciliation process (White 1995).

13
Congress mandated the de facto removal of the trust-funded programs from the budget agenda through the spread of automatic indexations. As Weaver (1988) explained, indexation is a form of automatic government, yet many saw indexation as a method of control because it avoided recurring Congressional bidding wars over election year increases. By tying certain programs to an external index (typically the Consumer Price Index), Congress surrendered the credit-claiming possibilities of election year raises in benefits and put those programs on a financial autopilot. The third, and by far the largest, wave of such indexation occurred from 1971 through 1980 (Weaver 1988, 139). Consequently, the spread of indexation in the 1970s may have had an effect on mandatory spending similar to that of the Congressional Budget and Impoundment Control Act effect on discretionary spending although the timing is less clearly associated with a single budget year. Indexation may have actually slowed the growth of the typical mandatory subfunction by removing it from the partisan budgetary politics of the day. In addition, the 1990 Budget Enforcement Act may have had an effect by requiring that spending for new entitlements be offset by new revenues or other spending reductions. Mandatory expenditures continued to grow in the 1990s but at a slower rate than before.
Three Possible Explanations We now turn to examining three possible explanations for the macropunctuations we observe in US budget history. The three possibilities are shifts in partisan control of government, growth in wealth that results in growth in government, and shifts in public opinion with a corresponding shift in budgetary patterns.
Partisan Control. In the United States, Democrats are far more favorable to the use of government than are Republicans, and hence governmental programs would seem to be more likely to expand under Democratically-controlled governments (Sundquist 1968; Kiewiet and McCubbins 1991). While the Democratic party has dominated the legislative branch for the most part since the Second World War, it has not dominated the executive. If the Democratic political control hypothesis is true, we would expect to find higher spending during periods of unified Democratic control with its presumed consensus on positive government. During periods when Republicans controlled the White House, we would expect to find fewer increases and more reductions in public expenditures.7
If the punctuation hypothesis is correct, then traditional political divisions will
not be very important in causing government to grow or shrink when we control for the epoch. On the other hand, the political control hypothesis calls for Democratic presidents, in league with a Democratically-controlled congress, to have increased the size of government and domestic spending more than Republican presidents, and this should hold regardless of epoch. The long-term budget record indicates that this has not been the case. Rather, there seems to have been a period of increases
7 While we have no studies of the role of divided government on budget policy, there is evidence that little difference exists between divided and unified government in the passage of major legislation (Mayhew 1991).

14
in the Eisenhower, Kennedy, Johnson, and Nixon presidencies, and a period of more restraint in the Ford, Carter, Reagan, Bush, and Clinton presidencies, as shown in Table 1.
[Table 1 about here] Table 1 presents the direction of change, in percentage terms, for all 62
programmatic subfunctions of government since FY 1947, by presidency. It includes not only discretionary domestic spending and mandatory domestic spending but also national security spending in order to provide a broad overview of any partisan differences over time. Based upon an examination of the distribution of annual percentage changes for all programmatic subfunctions and upon Spearman’s rho tests of subfunction rankings under various break points (Bohrnstedt and Knoke 1988, 326–8), we defined a large annual increase as greater than +20 percent and a large decrease as more than -15 percent (after the effects of inflation have been removed). We have divided the Eisenhower administration into two parts to sharpen our view of the first and second epochs in growth discussed above. Note that the secular tendency for government functions to grow less, on average, in later years is more important than the particular individuals who hold the presidency.
The apparent unimportance of partisan control led us to make more
systematic tests of the partisan activism hypothesis that Democratic congresses and presidents have been more active in their support of the growth of domestic programs than Republican or divided alternatives (see Sundquist 1968 or Kiewiet and McCubbins 1991). Results of these tests indicated no relationship between partisan control and macropunctuations (full information is in the technical appendix).
Capitalist Surplus. It is possible that democratic politics is simply a way of
dividing up the enormous wealth produced by a relatively unfettered capitalist system. That is, budgeting in a democracy is driven by the health of the economy (Kamlet and Mowery 1987; Su, Kamlet, and Mowery 1993). As the economy grows rapidly, politicians have only to allocate the excess resources, and expenditures naturally increase. As the economy falters, government spending either adjusts by falling to a lower level or it drops only very slowly due to an inherent ratchet effect as politicians use inflation to reduce real expenditures, rather than facing the disagreeable job of removing an allocation already in place. In this view, epochs should be evident, but changes in government spending would follow, not precede, changes in the national economy. In any case, if the economy drives the budget, any patterns in budgeting should be associated with patterns of growth in the national economy.
If the economy was growing rapidly in the 1960s and early 1970s, large
numbers of budget increases might naturally be more prevalent then than later when the economy was growing at a slower pace. Despite the plausibility of the hypothesis, it was not supported by our analysis of the annual percentage changes in budget authority for domestic spending (see technical appendix for the details of model estimation).
Public Opinion. Surely, in a democracy, public policies follow public opinion.
Indeed, empirical evidence indicates that this happens (Page and Shapiro 1992;

15
Stimson, Erikson, and MacKuen 1995). It is plausible that epochs of public spending, if they exist, just follow changes in public opinion. One might argue that broad understandings about the proper role of government (and consequently, epochs) are just another form of public opinion. If public opinion in a democracy were a simple matter, we should be able to capture it through repeated surveys of a large sample of the population and test for policy relationships (Page and Shapiro 1992; Stimson, McKuen, and Erickson 1995). The best tool for studying historical change in aggregate public opinion is Stimson’s public mood measure (Stimson, 1991). This measure was developed from an exacting examination and collation of numerous public opinion measures taken by polling organizations since the mid-1950s. It assesses the extent to which weighted aggregate totals of opinion measures, termed by Stimson the public mood, changes over time.
Our analysis shows that changes in the generalized mood of public opinion, as
tapped by Stimson’s measure, do not explain the budgetary eras that we have isolated (again, details are presented in the technical appendix). It is probable that the connection between budgetary punctuations and public opinion are more nuanced than our examination reveals. In any case, we can say that the role of public opinion is played out in a historical context, a historical context that occasionally shifts dramatically in response to some complex combination of external events and internal system dynamics. One of the features of these dynamics is surely public opinion.

16
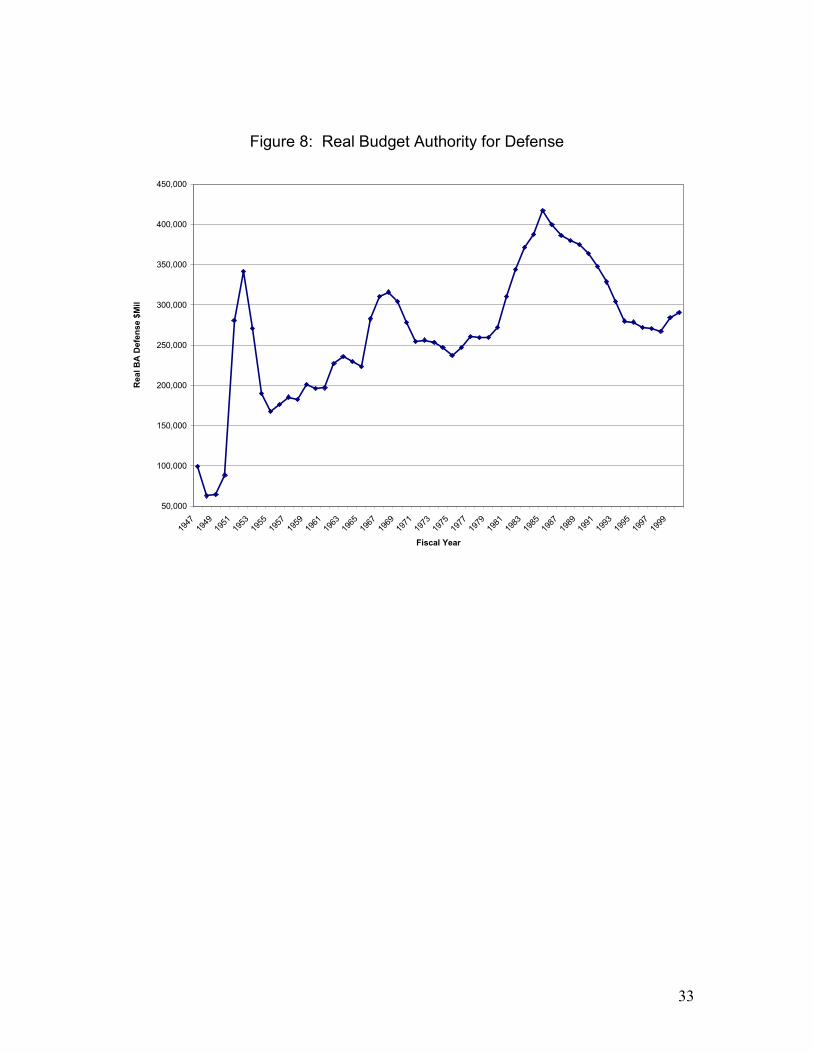
A Brief Look at Defense
For domestic expenditures in the post-war period, two macropunctuations not simply associated with exogenous events or trends dominate the expenditure pattern. We now briefly look at defense expenditures in Figure 7, which depicts real Congressional Budget Authority for the same period. The Korean War spend-down is clearly in evidence, as is the three-year spend-up for Viet Nam and the just-as-rapid return to normalcy in 1970-1972. What dominates the graph, however, is the Reagan mobilization. Neither war, nor a change in threat capabilities, but macropolitical attention drove a vast and sustained defense mobilization between 1980 and 1985. The Reagan buildup began in the last years of the Carter Administration. Following the 1979 Soviet invasion of Afghanistan and the failed US effort to rescue embassy hostages in Iran, the last Carger budget submission called for substantial increases for defense. That was augmented by a Reagan supplemental budget request in 1981, with new growth in defense expenditures until 1986. Fiscal 1987 through FY 1995 represented the “End of the Cold War” military retrenchment, but it might better be described as the “End of the Reagan Mobilization”.
No better picture of how exogenous and endogenous factors combine to yield public
policy can be drawn than this picture of defense spending. War mobilizations since the Second World War yielded less pronounced increases in military spending than the 1980s Reagan build-up. Conclusions
Our examination of US budget change shows periods of drift and incrementalism interspersed with occasional major punctuations. Punctuations are associated with war, but clearly war ratchets have implications for domestic programs. The general pattern is for domestic expenditures to remain replace military spending rather after war mobilizations. Since the Second World War, however, major policy punctuations have occurred in domestic spending categories independently of war. Moreover, the Reagan defense mobilization was not associated with war; rather domestic politics seem to have driven the dramatic increase.
In the next chapter, we examine the patterning of budgetary changes below the
macropunctuation level. It is possible that macropunctuations are transmitted down to the program level hierarchically. We show a different pattern, however.

17
TECHNICAL APPENDIX
We use an ARIMA (autoregressive-integrated-moving average) format to
estimate macropunctuations in the US budget (Box and Tiao 1975; Box, Jenkins, and Reinsel 1994; McCleary and Hay 1980). If the punctuations clear the bar of conventional benchmarks of statistical significance, then we move to the study of alternate hypotheses.8
We first test these hypotheses singly with appropriate “pre-whitening” along
with the ARIMA intervention (punctuation) estimates. Then we proceed with joint tests. Our design offers three ways to disconfirm empirically the punctuation hypothesis: 1) no punctuations are observed in the data; 2) punctuations emerge, but they are not statistically significant; and 3) punctuations emerge, they are statistically significant, but they can be simply accounted for by traditional political and economic forces.
Time series of annual budget data present special problems for statistical
analyses because they usually fail to meet the classical assumptions for linear regression. Most series of annual budget levels exhibit nonstationarity, significant autoregression, and a non-normal univariate distribution. As a consequence, regression analysis can yield inappropriate results, making it a poor tool for differentiating among rival hypotheses (Granger and Newbold 1974; Wanat 1974; Padgett 1980; Tucker 1982; Beck and Katz 1996). Here we control for non-stationarity by using annual percentage changes of subfunction budget authority. We control for non-normal univariate distribution of the dependent variable by using the median annual percentage change. And we control for autoregressive and moving average components by using ARIMA.
Statistical Tests of the Punctuation Hypothesis.
We are in no position to predict the specific occurrence of policy punctuations other than from an examination of the data. Having found them, however, we can demand that they survive tests of statistical significance and the imposition of alternative hypotheses. Tests are performed on domestic spending overall as well as separately on its components of domestic discretionary spending and domestic mandatory spending. We examine three potential interventions: a permanent step intervention for the Eisenhower ‘peace dividend’ (commencing in FY 1956), a temporary pulse intervention in FY 1974 for Nixon’s impoundments, and a second permanent step intervention for the Budget and Impoundment Control Act (commencing in FY 1976). Phillips-Perron tests indicated that the time series of the medians of annual percentage changes were stationary,9 and we proceeded with the analysis. Table A1 shows the results. 8 The analyses presented here are for the years FY1947-FY1995. Inspection of the more recent data indicated no changes in the basic conclusions presented here. 9 Studying percentage changes has the effect of differencing the series. Inspection of correlograms indicates that the series is stationary, and Phillips-Perron tests allow the rejection of the null hypothesis of a unit root in the series using Davidson-MacKinnon asymptotic critical values for .10 (White 1993).

18
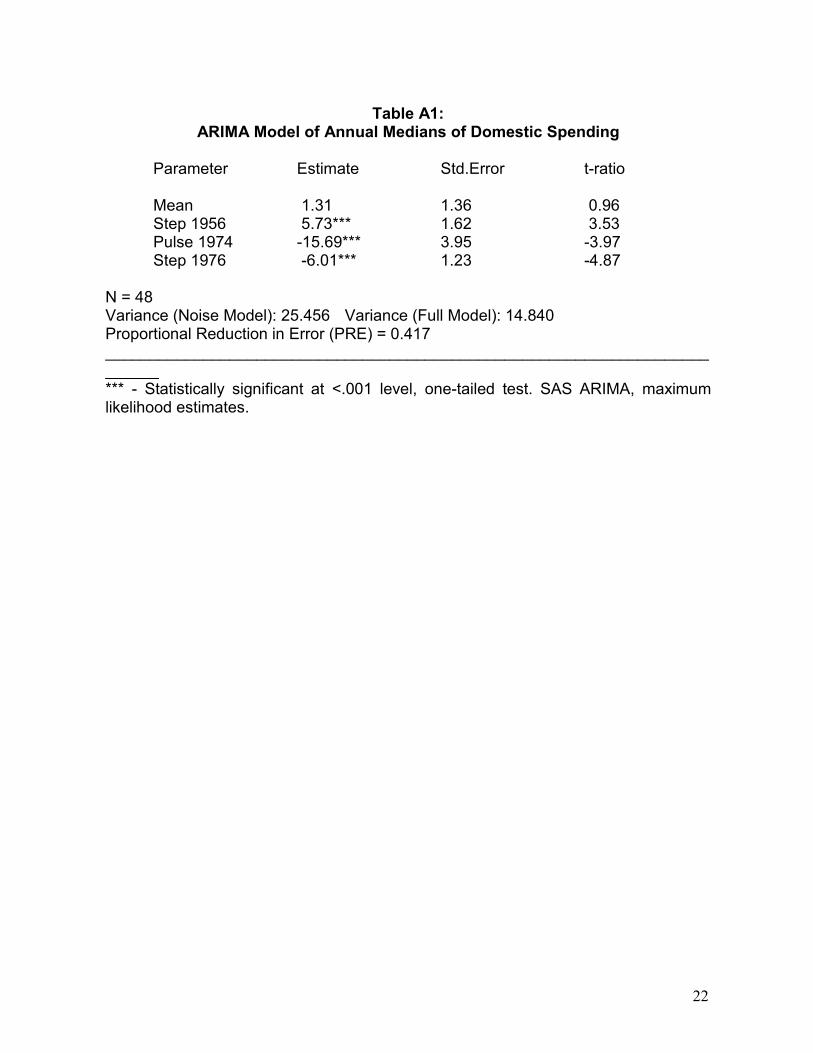
[TABLE A1 ABOUT HERE] All interventions are statistically significant. The typical year-to-year real
growth in the median domestic subfunction during the first postwar epoch was 1.3%, although the small N and large variability from FY 1948 through FY 1955 keeps that estimate from statistical significance (that is, it is statistically indistinguishable from 0).10 The first step in FY 1956 signals the addition of 5.7% to the typical real annual percentage increase. Nixon’s impoundments for 1974 (the pulse) temporarily subtracted over 15% from this average, while the step function entering in 1976 subtracted 6% permanently (that is, for the rest of the series).11 The model thus indicates that the average real growth rate (in median percentage changes across subfunctions) between FY 1956 and FY 1974, the era of expansion, was 7.0%, and after 1976 it was 1.0%.
The observed and predicted changes for discretionary spending mirror the
results of Table A1, in that all three interventions were significant [Mean = 1.83, t =1.05; Step 1956 = 5.81, t = 2.80; Pulse 1974 = -25.72, t = -5.10; Step 1976 = -6.72, t = -4.26; Proportional Reduction in Error (PRE)12 = 0.434]. The estimated model for mandatory spending is slightly different. The intervention for Nixon impoundments was deleted because it did not apply to mandatory spending categories. An ARIMA approach estimating a model using only the step functions indicated an FY 1956 increase of 6.2% (t = 3.59) from the widely varying early period growth which averaged 0.2% (t = 0.13) and a 1976 decline of 4.1% (t = -3.16) for the last epoch (PRE =0.24). However, since mandatory spending includes counter-cyclical subfunctions such as unemployment compensation and farm subsidies, a fuller model was also estimated to include the effects of changes in economic growth on changes in mandatory spending. Maximum likelihood estimates for the fuller model appear below. Partisan Control. We extended the previous ARIMA models with a dummy variable for those years when both the presidency and the Congress were Democratic (= 1 when both were Democratic; else = 0). The results for changes in domestic subfunctions (with mandatory and discretionary combined) and for discretionary 10 SAS PROC ARIMA t-ratios are reported throughout this appendix. Greene (1995:560-561) reminds us to be cautious in the potential presence of autocorrelated errors, as both Monte Carlo and analytical approaches indicate that conventional critical values can overstate the significance of relationships. 11 We also tested for the possibility of a period of transition between the changes of FY 1976 and those after FY 1982 (the first complete budget year of the Reagan Administration). This three-step intervention model did dot survive tests for statistical significance for discretionary spending, but for mandatory spending, the estimate for the 1976 punctuation would be reduced to -2.71 (t=-2.34), and the estimate for a 1982 punctuation would be -2.60 (t=-2.14). The early Reagan decreases occurred primarily in discretionary spending, and OMB Director Stockman’s efforts for cuts in Social Security were singularly unsuccessful (Light 1985). In addition, the strongly autoregressive character of the variable, which is explicitly captured in ARIMA modeling, suggests that post-1982 changes are better characterized as a slowly changing continuation of the epoch begun in FY 1976. 12 Proportional reduction in error = [Sum of the squared errors from the mean - sum of the squared errors from the model) / sum of the squared errors from the mean]; or, when autocorrelations must be modeled to produce a univariate series that approximates “white noise,” [(the variance of the noise model less the variance of the full model) divided by the variance of the noise model]. Thus proportional reduction in error provides information on the contribution of the full model to variance reduction without regard to parsimony.

19
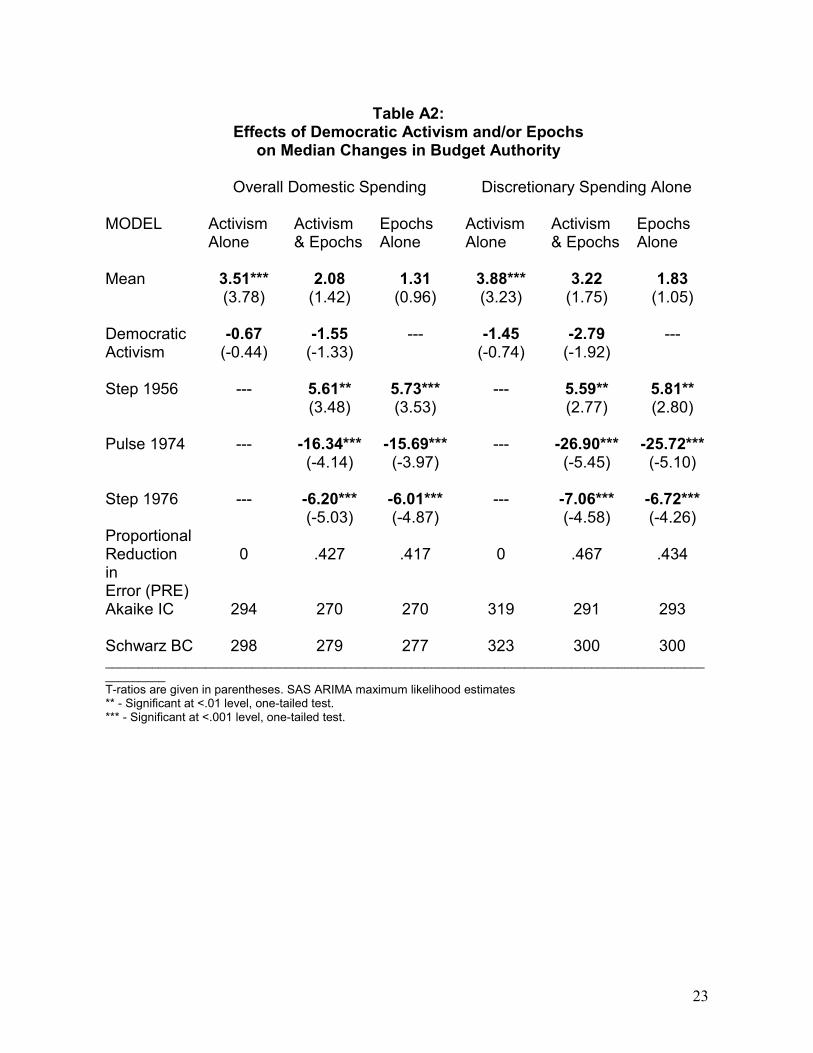
subfunctions separately provide evidence that years of Democratic activism were not associated with large growth in domestic subfunctions or with growth in discretionary subfunctions either alone or after controlling for the changes in epochs, as shown in Table A2.13
[TABLE A2 ABOUT HERE] If we assume it takes more than one year for Democratic control to make itself felt, we must lag the partisan control variable for an additional year and re-analyze the relationship. Now the unified control coefficient is statistically significant, but the sign is still negative. In either the simple or the lagged case, the partisan activism hypotheses of larger increases under Democratic control is not supported by the data. Capitalist Surplus. We studied the effects of real (inflation-adjusted) percentage changes in the gross domestic product on median percentage changes in subfunction spending. The series were deemed to be stationary. Overall, percentage changes in domestic spending had no significant cross-correlation with percentage changes in gross domestic product either during the year of a GDP change or for lags of up to twelve years after. Adding a contemporaneous GDP variable in the epoch equation for domestic spending produced neither a statistically significant coefficient estimate nor any improvement in proportional reduction in error, Akaike Information Criterion (AIC), or Schwarz Bayesian Criterion (SBC).
Mandatory spending contains several subfunctions usually considered to have an automatic counter-cyclical effect on the economy. Counter-cyclical subfunctions in this macrofunction include farm income stabilization, unemployment compensation, food and nutrition assistance (food stamps), and other income security (Supplemental Security Income and Aid to Families with Dependent Children). It seems reasonable to assume that mandatory subfunctions with counter-cyclical elements would generate increased mandatory spending when the economy sags and reduced mandatory spending when the economy recovers. On the other hand, it is possible that discretionary spending decreased during such downturns.
We again disaggregated domestic spending into its discretionary and
mandatory components, performing separate ARIMA analyses. Our analysis of discretionary spending allowed us to rule out the possibility that annual economic growth directly influenced annual increases in the median domestic discretionary subfunction.14 As hypothesized, however, mandatory spending had a 13 Divided government, however, does have an effect on budget volatility. The intersextile ranges of annual budget changes are greater during periods of divided government, suggesting that more disparate changes (and hence less predictability) is associated with periods of divided government (see Jones, True, and Baumgartner 1997). 14 The analysis actually indicated that changes in discretionary budget authority precede, rather than follow, changes in GDP. With discretionary spending as the dependent variable, statistically significant cross-correlations occur at lag -1 and lag -6. With GDP as the dependent variable, statistically significant cross-correlations occur at lag +1 (+0.36) and lag +6 (+0.33). Residuals approximated white noise with no statistically significant relationship of residuals with the independent variable. Clearly, GDP changes do not directly influence changes in discretionary budget authority.

20
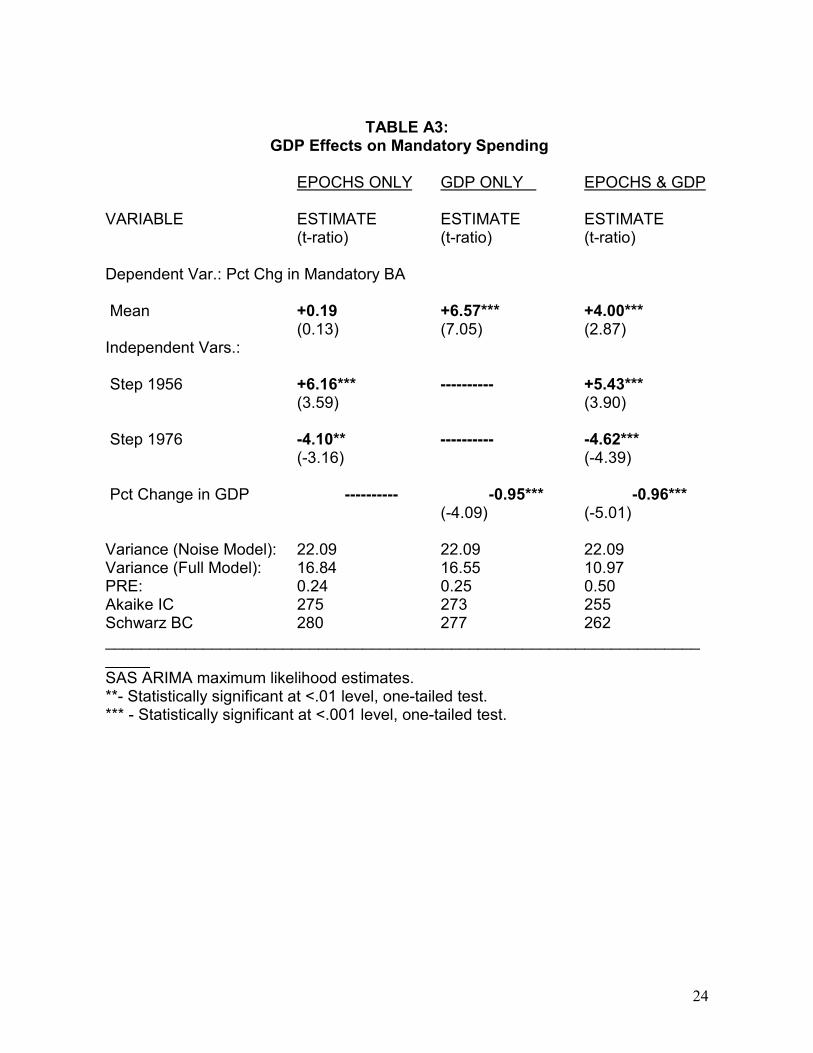
contemporaneous countercyclical response to changes in GDP, with mandatory spending increasing when the economy sags and declining when the economy improves.15 Assuming that annual changes in GDP contemporaneously influence annual changes in mandatory spending, we can use ARIMA to produce maximum likelihood estimates of that relationship with and without budgetary epochs. The results appear in Table A3.
[TABLE A3 ABOUT HERE] The combined model indicates that both budgetary epochs and changes in
GDP influenced changes in mandatory budget authority. Their inclusion in the full model resulted in improvements in proportional reduction in error as well as improvements in AIC and SBC. Mandatory spending responded to both of the hypothesized epochs as well as counter-cyclically to changes in national production. Public Opinion. We cannot here fully examine the complex relations between expenditure policies and mass public opinion, yet multivariate ARIMA analysis allows at least a partial look at relationships between Stimson’s mood series and budgets over time. Characterizing mood as the independent variable with an ARIMA 1,1,0 noise model,16 we found no statistically significant cross-correlations between changes in mood and changes in domestic, discretionary, or mandatory budget authority from 1955 through 1990—whether the variables were measured as annual percentage changes or as first differences. Models with mood alone as well as models with epochs and changes in gross domestic product were estimated. Using mood as the only independent variable and “pre-whitening” with its noise model increased (rather than reduced) model variance, AIC, and SBC from the univariate budget noise models.
We estimated a more complete model correlating either first differences in the sums of budget authority by macrofunction or annual percentage changes in budget subfunctions as dependent upon the first differences or percentage changes in mood and real GDP as well as our hypothesized epochs. None of the models yielded significant cross-correlations between mood and spending, and neither a zero shift, one-year shift (see Stimson, et al, 1995, 561), nor a five-year shift produced maximum likelihood estimates of the mood coefficient that were statistically significant. Cross-correlations between mood and both domestic and discretionary spending at lags of minus one year (spending leads opinion) and plus five years (opinion leads spending) fell short of statistical significance.
15 Percentage changes in mandatory budget authority were related to percentage changes in GDP for the period under study. The two series were contemporaneously correlated but with a negative coefficient. The only statistically significant cross-correlation was -0.52 at lag 0. That is, economic declines are associated with increases in mandatory expenditures. The cross-correlation between mandatory spending and changes in gross domestic product was evident whether the time series was of the medians of annual percentage changes or of first differences in the annual sum of the budget authority for mandatory subfunctions. 16 We used the updated version of Domestic Policy Mood for 1955 through 1990 as presented in Table A-4 of Stimson, et al. (1995). Since the mood series is bounded, one would not expect it to have a unit root; however, correlograms and augmented Dickey-Fuller tests indicate that differencing is required before cross-correlations are estimated, and an AR-1 model after one differencing produced acceptable correlograms and Q statistics.

21
Multivariate Tests. As a final exercise, we performed multivariate ARIMA analyses of the punctuation hypothesis and the alternate hypotheses combined, using, as usual, the median annual percentage change in budget authority for domestic subfunctions. Since it employs several independent variables, this approach does not allow for the pre-whitening of the series studied . The results are presented in Table 4. Because the public opinion measure begins in 1956, we performed separate analyses for the full period (1947-95) and the period for which the liberalism measure was available (1956-90).
[TABLE A4 ABOUT HERE]
In the multivariate ARIMA, the punctuations are statistically significant, whereas the alternate hypotheses are not. Note that the partisan control hypothesis would be statistically significant if a two-tailed test were used (that is, even when the punctuations and the variables assessing the other hypotheses were controlled, there was a tendency for divided governments to spend more than governments unified under the Democrats).
22
Table A1:
ARIMA Model of Annual Medians of Domestic Spending Parameter Estimate Std.Error t-ratio Mean 1.31 1.36 0.96 Step 1956 5.73*** 1.62 3.53 Pulse 1974 -15.69*** 3.95 -3.97 Step 1976 -6.01*** 1.23 -4.87 N = 48 Variance (Noise Model): 25.456 Variance (Full Model): 14.840 Proportional Reduction in Error (PRE) = 0.417 __________________________________________________________________________ *** - Statistically significant at <.001 level, one-tailed test. SAS ARIMA, maximum likelihood estimates.
23
Table A2:
Effects of Democratic Activism and/or Epochs on Median Changes in Budget Authority
Overall Domestic Spending Discretionary Spending Alone
MODEL
Activism Alone
Activism & Epochs
Epochs Alone
Activism Alone
Activism & Epochs
Epochs Alone
Mean 3.51*** (3.78)
2.08 (1.42)
1.31 (0.96)
3.88*** (3.23)
3.22 (1.75)
1.83 (1.05)
Democratic Activism
-0.67 (-0.44)
-1.55 (-1.33)
--- -1.45 (-0.74)
-2.79 (-1.92)
---
Step 1956 --- 5.61** (3.48)
5.73*** (3.53)
--- 5.59** (2.77)
5.81** (2.80)
Pulse 1974 --- -16.34***
(-4.14) -15.69*** (-3.97)
--- -26.90*** (-5.45)
-25.72*** (-5.10)
Step 1976 --- -6.20***
(-5.03) -6.01*** (-4.87)
--- -7.06*** (-4.58)
-6.72*** (-4.26)
Proportional Reduction in Error (PRE)
0
.427
.417
0
.467
.434
Akaike IC 294 270 270 319 291 293 Schwarz BC 298 279 277 323 300 300 ___________________________________________________________________________________________________ T-ratios are given in parentheses. SAS ARIMA maximum likelihood estimates ** - Significant at <.01 level, one-tailed test. *** - Significant at <.001 level, one-tailed test.
24
TABLE A3: GDP Effects on Mandatory Spending
EPOCHS ONLY GDP ONLY EPOCHS & GDP VARIABLE ESTIMATE ESTIMATE ESTIMATE (t-ratio) (t-ratio) (t-ratio) Dependent Var.: Pct Chg in Mandatory BA Mean +0.19 +6.57*** +4.00*** (0.13) (7.05) (2.87) Independent Vars.: Step 1956 +6.16*** ---------- +5.43*** (3.59) (3.90) Step 1976 -4.10** ---------- -4.62*** (-3.16) (-4.39) Pct Change in GDP ---------- -0.95*** -0.96*** (-4.09) (-5.01) Variance (Noise Model): 22.09 22.09 22.09 Variance (Full Model): 16.84 16.55 10.97 PRE: 0.24 0.25 0.50 Akaike IC 275 273 255 Schwarz BC 280 277 262 ________________________________________________________________________ SAS ARIMA maximum likelihood estimates. **- Statistically significant at <.01 level, one-tailed test. *** - Statistically significant at <.001 level, one-tailed test.

25
Table A4:
Multivariate ARIMA Results for Median Annual Percentage Change
in Budget Authority for Domestic Subfunctionsa Coefficients Period: 1947-1995 Period: 1956-1990 Mean 4.90** 7.38*** (3.07) (5.82) Step 1956 4.34** - - - (2.91) Pulse 1974 -17.54*** -17.08*** (-5.09) (-4.75) Step 1976 -6.79*** -6.73*** (-6.26) (-5.54) Partisan -4.00b,c -3.36 c Activism (-3.79) (-2.37) Pct Change -0.16 0.28 in GDP (-0.80) (-0.78) Pct Change - - - -0.20d in Pub Opinion (-0.78) Variance (Noise Model) 25.456 27.143 Variance (Full Model) 11.067 11.324 Proportional Reduction 0.565 0.583 in Error N 48 34 ____________________________________________________________________________________ a SAS ARIMA maximum likelihood estimates; t-ratios are in parentheses. b Input lagged one-year based on cross-correlation function. c Insignificant for one-tailed test because of the sign opposite to theory; it would be significant using two-tailed test. d Input lagged one-year based on Stimson et al. 1995. ** Significant at <0.01 level, one-tailed test. *** Significant at <0.001 level, one-tailed test.

26
Figure 1: Total US National Government Outlays, Constant Dollars, 1801-2000
0.10
1.00
10.00
100.00
1000.00
10000.00
100000.00
1800
18
05 18
10 18
15 18
20 18
25 18
30 18
35 18
40 18
45 18
50 18
55 18
60 18
65 18
70 18
75 18
80 18
85 18
90 18
95 19
00 19
05 19
10 19
15 19
20 19
25 19
30 19
35 19
40 19
45 19
50 19
55 19
60 19
65 19
70 19
75 19
80 19
85 19
90 19
95 20
00
Fiscal Year
US
Out
lays
, Con
stan
t (19
84) D
olla
rs, L
ogar
ithm
ic S
cale

27
Figure 2: Defense and Domestic Outlays of the US National Government, 1801-1988, Adjusted for Inflation and Population, Logarithmic Scale
0.1
1
10
100
1000
10000
1800
18
07
1814
18
21
1828
18
35
1842
18
49
1856
18
63
1870
18
77
1884
18
91
1898
19
05
1912
19
19
1926
19
33
1940
19
47
1954
19
61
1968
19
75
1982
Fiscal Year
Out
lays
, Log
Sca
le
Defense
Domestic

28
Figure 3: Receipts of the US National Government as a Percentage of GDP, 1934-2000
---
5.0
10.0
15.0
20.0
25.0
1934
1937
1940
1943
1946
1949
1952
1955
1958
1961
1964
1967
1970
1973
1976
1978
1981
1984
1987
1990
1993
1996
1999
Fiscal Year
Rec
eipt
s as
% o
f GD
P

29
Figure 4: Surpluses and Deficits, Constant (1996) Dollars, 1940-2000/
(500.0)
(400.0)
(300.0)
(200.0)
(100.0)
0.0
100.0
200.0
300.0
1940
1942
1944
1946
1948
1950
1952
1954
1956
1958
1960
1962
1964
1966
1968
1970
1972
1974
1976
1977
1979
1981
1983
1985
1987
1989
1991
1993
1995
1997
1999
Surp
lus,
Con
stan
t 199
6 $
Reagan electedClinton elected
Kennedy-Johnson

30
Figure 5: Inflation-Adjusted Outlays of the Federal Government, FY1947-FY2000.
0
2000
4000
6000
8000
10000
12000
1947
19
49
1951
19
53
1955
19
57
1959
19
61
1963
19
65
1967
19
69
1971
19
73
1975
19
77
1979
19
81
1983
19
85
1987
19
89
1991
19
93
1995
19
97
1999
Fiscal Year
Rea
l Out
lays

31
Figure 6: The Changing Composition of the US Budget: Category of Expenditure as a Percentage of Total Outlays
0.0
10.0
20.0
30.0
40.0
50.0
60.0
70.0
80.0
90.0
1940 1944 1948 1952 1956 1960 1964 1968 1972 1976 1979 1983 1987 1991 1995 1999
% o
f Out
lays
Defense
Transfers
Interest
S&L Grants
ReaganKennedy-Johnson
Nixon
Eisenhower
Clinton

32
Figure 7 Median Annual Percentage Change in OMB Subfunctions for US Budget
Authority, Actual and Predicted
-10
-5
0
5
10
15
1948
1950
1952
1954
1956
1958
1960
1962
1964
1966
1968
1970
1972
1974
1976
1978
1980
1982
1984
1986
1988
1990
1992
1994
1996
1998
2000
Fiscal Year
Med
ian
Ann
ual P
erce
ntag
e C
hang
e
Predicted
33
Figure 8: Real Budget Authority for Defense
50,000
100,000
150,000
200,000
250,000
300,000
350,000
400,000
450,000
1947
1949
1951
1953
1955
1957
1959
1961
1963
1965
1967
1969
1971
1973
1975
1977
1979
1981
1983
1985
1987
1989
1991
1993
1995
1997
1999
Fiscal Year
Rea
l BA
Def
ense
$M
il

34
Table 1: Percentage Changes in Budget Authority by Presidencies
Large Large Increase Decrease Incremental Administration (Fiscal Years) N [ > 20%] [ < -15%] [-15% < 20%] Truman (FY 1948-53) 281 24% 24% 52% Eisenhower 1 (FY 1954-55) 103 21% 22% 56% Eisenhower 2 (FY 1956-61) 316 29% 12% 59% Kennedy (FY 1962-63) 106 18% 13% 69% Johnson (FY 1964-69) 324 19% 15% 67% Nixon (FY 1970-75) 337 26% 15% 59% Ford (FY 1976-77) 116 17% 13% 70% Carter (FY 1978-81) 248 10% 12% 79% Reagan (FY 1982-89) 496 11% 15% 74% Bush (FY 1990-93) 248 12% 9% 79% Clinton (FY 1994-95) 124 7% 15% 78% Overall 2699 18% 15% 67% Note that the series begins with percentage changes from FY 1947 to FY 1948 and that outgoing presidents were credited with the fiscal year underway when the new president was sworn in.
35
References
Baumgartner, Frank R. and Bryan D. Jones. 1993. Agendas and Instability in American Politics. Chicago: University of Chicago Press.
Beck, Nathaniel, and Jonathan N. Katz. 1995. “What To Do (and Not To Do) With Time-Series-Cross-Section Data in Comparative Politics.” American Political Science Review 89:634-647.
Berry, William D. and David Lowery. 1990. “An Alternate Approach to Understanding Budgetary Trade-Offs.” American Journal of Political Science 34: 671-705.
Berry, William D. and David Lowery. 1987. Understanding United States Government Growth. New York: Praeger.
Box, George E.P., Gwilym M. Jenkins, and Gregory C. Reinsel. 1994. Time Series Analysis: Forecasting and Control. Englewood Cliffs, NJ: Prentice-Hall.
Box, G.E.P., and Tiao, G. C. 1975. “Intervention Analysis with Application to Economic and Environmental Problems.” Journal of the American Statistical Association 65:1509-26.
Cobb, Roger and Charles D. Elder. 1983. Participation in American Politics: the Dynamics of Agenda-Building. Baltimore: John Hopkins University Press.
Cogan, John F. 1994. “The Dispersion of Spending Authority and Federal Budget Deficits.” In Cogan, Timothy J. Muris, and Allen Schick, eds. The Budget Puzzle. Stanford: Stanford University Press.
Cohen, Michael, James G. March, and Johan P. Olsen. 1972. A Garbage Can Theory of Organizational Choice. Administrative Science Quarterly 17: 1–25.
Correa, Hector and Ji-won Kim. 1992. "A Causal Analysis of the Defense Expenditures of the USA and USSR." The Journal of Peace Research. 29:161-174.
Cyert, R. M., and James G. March. 1963. A Behavioral Theory of the Firm. Englewood Cliffs NJ: Prentice-Hall.
Davis, Otto A., M.A.H. Dempster, and Aaron Wildavsky. 1966. A Theory of the Budget Process. American Political Science Review 60: 529-47.

36
Davis, Otto A., M.A.H. Dempster, and Aaron Wildavsky. 1974. Towards a Predictive Theory of Government Expenditure: US Domestic Appropriations. British Journal of Political Science 4: 419-52.
Dodd, Lawrence C. 1993. Congress Reconsidered. 5th edition. Washington: CQ Press.
Dodd, Lawrence C. 1994. Political Learning and Political Change: Understanding Development Across Time. In The Dynamics of American Politics, Lawrence C. Dodd and Calvin Jilson, eds. Boulder: Westview Press.
Dodd, Lawrence C. 1995. “The New American Politics: Reflections of the Early 1990s.” In The New American Politics, Bryan Jones, ed. Boulder: Westview.
Dye, Thomas. 1966. Politics, Economics, and the Public: Policy Outcomes in the American States. Chicago: Rand McNally.
Fenno, Richard F., Jr. 1966. The Power of the Purse: Appropriations Politics in Congress. Boston: Little, Brown.
Fisher, Louis. 1985. “Ten Years of the Budget Act: Still Searching for Controls.” Public Budgeting & Finance 5:3-28.
Granger, C.W.J. and P. Newbold. 1974. "Spurious Regressions in Econometrics," Journal of Econometrics. 2:111-120.
Greene, William H. 1993. Econometric Analysis, 2nd Ed. New York: Macmillan.
Hartley, Thomas, and Bruce Russett. 1992. “Public Opinion and the Common Defense: Who Governs Military Spending in the United States?” American Political Science Review 86:905-15.
Hsiao, Cheng. 1986. Analysis of Panel Data. Cambridge: Cambridge University Press.
Hughes, Jonathan R. T. Hughes. 1991. The Governmental Habit Redux: Economic Controls from Colonial Times to the Present. Princeton: Princeton University Press.
Huang, Chi, and Alex Mintz. 1991. “Defence Expenditures and Economic Growth: The Externality Effect.” Defence Economics. 3:35-40.
Huntington, Samuel P. 1961. The Common Defense: Strategic Programs in National Politics. New York: Columbia University Press.

37
Huntington, Samuel P. 1981. American Politics: The Promise of Disharmony. Cambridge: Harvard.
Jones, Bryan D. 1994. Reconceiving Decision-Making in Democratic Politics. Chicago: University of Chicago Press.
Jones, Bryan D. 1996. “Attributes, Alternatives, and the Flow of Ideas: Information Processing in Politics.” Presented at the annual meeting of the American Political Science Association in San Francisco.
Jones, Bryan D. 2001. Politics and the Architecture of Choice. Chicago: University of Chicago Press.
Jones, Bryan D., Frank R. Baumgartner, and Jeffery C. Talbert. 1993. The Destruction of Issue Monopolies in Congress. American Political Science Review 87: 657–71.
Jones, Bryan D., Frank R. Baumgartner, and James L. True. 1996. “The Shape of Change: Punctuations and Stability in U.S. Budgeting, 1946-94.” Presented at the annual meeting of the Midwest Political Science Association, Chicago.
Jones, Bryan D., James L. True, and Frank R. Baumgartner. 1997. “Does Incrementalism Stem From Political Consensus or From Institutional Gridlock?” American Journal of Political Science 41 (October 1997): 1319-39.
Jones, Bryan D., Frank R. Baumgartner and James L. True. 1998. Policy Punctuations: US Budget Authority, 1947-95. Journal of Politics 60: 1-30.
Kamlet, Mark S., and David C. Mowery. 1992 [1985]. “The First Decade of the Congressional Budget Act: Legislative Imitation and Adaptation in Budgeting.” In Government Budgeting: Theory, Process, and Politics. Albert C. Hyde, ed. Pacific Grove: Brooks/Cole.
Kamlet, Mark S., and David C. Mowery. 1987. Influences on Executive and Congressional Budgetary Priorities, 1955-1981. American Political Science Review 81:155-178.
Kelly, Sean Q. 1994. Punctuated Change and the Era of Divided Government. In Lawrence C. Dodd, ed., New Perspectives on American Politics. Washington, DC: Congressional Quarterly.
Kiewiet, Roderick and Matthew McCubbins. 1991. The Logic of Delegation. Chicago: University of Chicago Press.

38
Kingdon, John. 1995. Agendas, Alternatives, and Public Policies, Second Ed. Boston: Little, Brown.
Light, Paul. 1985. Artful Work: The Politics of Social Security Reform. New York: Random House.
Lindblom, Charles E. 1959. “The Science of ‘Muddling Through.’” Public Administration Review. 29:79-88.
Mandelbrot, Benoit. 1963. New Methods in Statistical Economics. Journal of Political Economy 1:79-106.
Mayhew, David. 1991. Divided We Govern. New Haven: Yale University Press.
McCleary, Richard and Richard A. Hay, Jr. 1980. Applied Time Series for the Social Sciences. Beverly Hills, CA.: Sage.
Meyers, Roy T. 1994. Strategic Budgeting. Ann Arbor: University of Michigan Press.
Mintz, Alex. 1988. The Politics of Resource Allocation in the U.S. Department of Defense: International Crisis and Domestic Constraints. Boulder: Westview Press.
Murphy, Charles J. V. 1956. The Eisenhower Shift. Fortune, January:86ff and March:111ff.
NSC-162/2. 1953. “Review of Basic National Security Policy.” In Pentagon Papers, Gravel Edition, Vol. I, pp. 412-29.
Ostrom, Charles W., and Robin F. Marra. 1986. "U.S. Defense Spending and the Soviet Estimate," American Political Science Review 80:821-842.
Padgett, John F. 1980. Bounded Rationality in Budgetary Research. American Political Science Review 74: 354-72.
Padgett, John F. 1981. Hierarchy and Ecological Control in Federal Budgetary Decision Making. American Journal of Sociology 87: 75-128.
Padgett, John F. 1995. Correspondence with the authors.
Page, Benjamin I., and Robert Y. Shapiro. 1992. The Rational Public: Fifty Years of Trends in American's Policy Preferences. Chicago: University of Chicago Press.

39
Peacock, Alan T., and Jack Wiseman. 1961[1994]. The Growth of Public Expenditures in the United Kingdom. 2nd Ed., reprinted. Aldershot, England: Gregg Revivals.
Rundle, John B., Donald L. Turcotte, and William Klein, eds. 1996. Reduction and Predictability of Natural Disasters. Reading, MA.: Addison-Wesley.
Schattschneider, E. E. 1960. The Semi-Sovereign People. New York: Holt, Rinehart, and Winston.
Schlesinger, Arthur M. 1986. The Cycles of American History. Boston: Houghton-Mifflin.
Schick. Allen. 1995. The Federal Budget: Politics, Policy, Process. Washington, DC: Brookings.
Schilling, Warner R., Paul Y. Hammond, and Glenn H. Snyder. 1962. Strategy, Politics, and Defense Budgets. New York: Columbia University Press.
Schulman, Paul R. 1980. Large-Scale Policymaking. New York: Elsevier North Holland.
Simon, Herbert A. 1957. Models of Man. New York: Wiley.
Simon, Herbert A. 1977. “The Logic of Heuristic Decision-Making.” In Models of Discovery, ed., R.S. Cohen and M.W. Wartofsky. Boston: D. Reidel.
Simon, Herbert A. 1983. Reason in Human Affairs. Stanford: Stanford University Press.
Simon, Herbert A. 1985. “Human Nature in Politics: The Dialogue of Psychology with Political Science.” American Political Science Review 79:293-304.
Steinbruner, John D. 1974. The Cybernetic Theory of Decision: New Dimensions of Political Analysis. Princeton: Princeton University Press.
Stimson, James A. 1991. Public Opinion in America: Moods, Cycles, and Swings. Boulder: Westview.
Stimson, James A., Michael B. MacKuen, and Robert S. Erikson. 1995. “Dynamic Representation.” American Political Science Review 89:543-64.
Su, Tsai-Tsu, Mark S. Kamlet, and David Mowery. 1993. “Modeling U.S. Budgetary and Fiscal Outcomes: A Disaggregated, Systemwide Perspective.” American Journal of Political Science 37: 213-45.

40
Sundquist, James L. 1968. Politics and Policy: The Eisenhower, Kennedy, and Johnson Years. Washington DC: Brookings.
Thurow, Lester, 1996. The Future of Capitalism. New York: Basic Books.
True, James L. 1995. “Is the National Budget Controllable?” Public Budgeting & Finance 15:18-32.
Tucker, Harvey. 1982. “Incremental Budgeting: Myth or Model?” Western Political Quarterly 35: 327-338.
Wanat, John. 1974. “Bases of Budgetary Incrementalism.” American Political Science Review 68:1221-28.
Wander, W. Thomas. 1984. “The Politics of Congressional Budget Reform.” In Congressional Budgeting, Thomas Wander, F. Ted Hebert, and Gary W. Copeland, eds. Baltimore: Johns Hopkins University Press.
Wander, W. Thomas, F. Ted Hebert, and Gary W. Copeland. 1984. Congressional Budgeting. Baltimore: Johns Hopkins University Press.
Weaver, R. Kent. 1988. Automatic Government: The Politics of Indexation. Washington: Brookings Institution.
Webber, Carolyn and Aaron Wildavsky. 1986. A History of Taxation and Expenditure in the Western World. New York: Simon and Schuster.
Western, Bruce. 1995. Concepts and Suggestions for Robust Regression Analysis. American Journal of Political Science 39: 786-817.
White, Joseph. 1995. (Almost) Nothing New Under the Sun: Why the Work of Budgeting Remains Incremental. In Naoimi Caiden and Joseph White, eds., Budgeting, Policy, and Politics. New Brunswick NJ: Transaction Publishers.
White, Kenneth J. 1993. Shazam User’s Reference Manual Version 7.0. New York: McGraw-Hill.
Wildavsky, Aaron. 1964. The Politics of the Budgetary Process. Boston: Little, Brown.
Wildavsky, Aaron. 1992. The New Politics of the Budgetary Process, 2nd Ed. Boston: Little, Brown.
Wlezien, Christopher. 1994. The Politics of Impoundments. Political Research Quarterly 47: 59-84.

41
Wood, B. Dan, and Richard W. Waterman. 1994. Bureaucratic Dynamics: The Role of Bureaucracy in a Democracy. Boulder: Westview.