Policy Brief FACTORS THAT INFLUENCE INCARCERATION RATES...
24
Policy Brief Policy Brief FACTORS THAT INFLUENCE INCARCERATION RATES FACTORS THAT INFLUENCE INCARCERATION RATES GOVERNOR’S OFFICE OF PLANNING AND BUDGET GOVERNOR’S OFFICE OF PLANNING AND BUDGET October 2008 October 2008
Transcript of Policy Brief FACTORS THAT INFLUENCE INCARCERATION RATES...

Policy BriefPolicy Brief
FACTORS THAT INFLUENCE INCARCERATION RATESFACTORS THAT INFLUENCE INCARCERATION RATES
GOVERNOR’S OFFICE OF PLANNING AND BUDGETGOVERNOR’S OFFICE OF PLANNING AND BUDGET
October 2008October 2008

This page intentionally left blank

Policy Brief
FACTORS THAT INFLUENCE INCARCERATIONS RATES Governor’s Office of Planning and Budget October 2008
Leading Factors • Discontinuance of
Earned Time Credit in the mid-1980’s
• Increased amount of mandatory sentencing statues in the mid-1990’s
• Lower proportion of inmate population paroled
• Increased amount of time served by offenders
Facts and Figures • The length of time
served by Georgia offenders has grown an average of 11% per year since 1991.
• The number of parole releases has dropped from 88% in 1991 to 62% in 2007 while the number of prison ‘max-outs’ has increased from 12% in 1991 to 38% in 2007
• Georgia Offenders: - Approximately 75-80%
have substance abuse problems
- Over half (56%) have mental health problems
- 31% have the equivalent of a GED
________________________ Key Contact: Governor’s Office of Planning and Budget Planning, Research, and Evaluation Division (404) 656-7966
Executive Summary
Purpose The purpose of this paper is to identify the principal factors that influence incarceration rates by affecting the number of admissions, the length of stay, and the number of releases. The paper provides an introductory summary of the primary policies, laws, programs, and personal factors that influence the incarceration rate. The research is intended to spark more in-depth analyses of variables that policy makers can control to improve the management of the offender population. Background In 2007, Georgia had the 6th highest incarceration rate in the nation, and over $700 million was spent on state prisons. In addition, the state’s rate of incarceration has remained higher than the national average for the past 29 years. The evidence shows that ‘tough on crime’ policies implemented in the 1990’s have had their intended effect by ensuring that prisoners serve a greater portion of their sentence. However, the heightened number of prisoners has financial implications for the citizens of Georgia. As the ratio of prisoners to residents increases, so does the cost to taxpayers. This policy brief seeks to identify the major factors that impact the incarceration rate.
Incarceration Rate
Number of Offenders Convicted and
Committed
Length of Time Served in Prison Recidivism Rate
Laws
Environmental Factors
Intrinsic Factors
Courts
Laws Policies
Programs
Policing
Parole
Incarceration Rate
Number of Offenders Convicted and
Committed
Length of Time Served in Prison Recidivism Rate
Laws
Environmental Factors
Intrinsic Factors
Courts
Laws Policies
Programs
Policing
Parole
Georgia’s incarceration rate continues to be affected by the number of offenders convicted and committed, the length of time served in prison, and the rate of recidivism. Although no single factor can be considered the sole cause, using quality research as a roadmap for adjusting the factors documented in this paper should provide guidance in reducing the incarceration rate in Georgia. This paper makes it clear that the state’s incarceration rate is influenced by factors that cross organizational and societal boundaries. Consequently, to best manage the state’s offender population, a holistic approach should be used to help ensure optimal results. State agencies, local governments, non-profit groups and communities should work together to influence the factors driving incarceration.

This page intentionally left blank

TABLE OF CONTENTS PURPOSE........................................................................................................................... 1 INTRODUCTION................................................................................................................. 1 BACKGROUND INFORMATION ON GEORGIA’S INCARCERATION RATE................... 2 FACTORS THAT INFLUENCE INCARCERATION RATES............................................... 4 FACTOR 1: NUMBER OF OFFENDERS CONVICTED AND COMMITTED ...................... 5
Sub-Factor 1: Laws......................................................................................................... 5 Sub-Factor 2: Environment .............................................................................................. 5
Socio-economic Status................................................................................................. 5 Neighborhoods............................................................................................................. 6 Personal Associations .................................................................................................. 6 Employment ................................................................................................................. 6 Family Influences and Social Bonding.......................................................................... 7
Sub-Factor 3: Intrinsic Behavior Motivators .................................................................... 7 Educational Level ......................................................................................................... 7 Substance Abuse ......................................................................................................... 8 Mental Health ............................................................................................................... 8
Sub-Factor 4: Policing...................................................................................................... 8 Level of Enforcement ................................................................................................... 8 Police Officer Discretion ............................................................................................... 9
FACTOR 2: LENGTH OF STAY ......................................................................................... 9
Sub-Factor 1: Laws.......................................................................................................... 9 Habitual Offender Laws................................................................................................ 9 Time Served Legislation............................................................................................. 10 Good Behavior Credit................................................................................................. 11
Sub-Factor 2: Courts...................................................................................................... 12 Judicial Discretion (Judge Decides the Length of Stay) ............................................. 12 Split Sentencing and Probation .................................................................................. 12 Drug and Mental Health Courts.................................................................................. 12
Sub-Factor 3: Parole...................................................................................................... 13 FACTOR 3: RECIDIVISM RATE....................................................................................... 13
Sub-Factor 1: Policies.................................................................................................... 13 Detention and Parole.................................................................................................. 13
Sub-Factor 2: Programs................................................................................................. 16 Rehabilitative Services ............................................................................................... 16 Inmate Programs........................................................................................................ 16 Community Programs................................................................................................. 18
CONCLUSION .................................................................................................................. 18

Page 1 of 19
Purpose The purpose of this paper is to identify the principal factors that influence incarceration rates by affecting the number of admissions, the length of stay, and the number of releases.1 In Fiscal Year 2007, Georgia spent over $700 million2 on state prisons; our intent is to provide a high-level summary of the primary policies, laws, programs, and personal factors that influence the rate of imprisonment. This research is intended to spark more in-depth analyses of variables that policy makers can control to improve the management of the offender population.
Introduction This report uses information that was gathered from a variety of sources. To summarize this information, this report frames Georgia’s incarceration rate in terms of “Flow.” Under this model, the state’s high rate of incarceration is a result of the combined influences of an increased inflow of committed offenders, the length of time they serve, and the number of offenders who recidivate. Figure 1 illustrates this cyclical model.
Figure 1
1 For the purposes of this text, the incarceration rate is defined as the rate of offenders (to total population) who are in federal prisons, state prisons or in local jails. Additionally, Georgia’s incarceration rate is defined as the rate of offenders in state prisons (to the total state population). 2 Georgia Department of Corrections – includes allocation of central office costs to the prisons.
Number
Convicted and Committed
Length of Time Served
Rate of Recidivism
Inmates Who Exit and Never Recidivate
Offender Flow Through the
Prison System

Page 2 of 19
Background Information on Georgia’s Incarceration Rate Georgia’s incarceration rate in 2007 (558 prisoners per 100,000 residents) resulted in Georgia being ranked 6th highest in the nation behind Louisiana (857), Mississippi (723), Texas (682), Oklahoma (670) and Alabama (611). All of these states were significantly above the national average of 509 prisoners per 100,000 residents.3 Additionally, historical data illustrates that Georgia’s rate of incarceration has been higher than the national average for the past 29 years.4 Chart 1
US and Georgia Incarceration Rates 1977 - 2005
0
100
200
300
400
500
600
700
1977 1981 1985 1989 1993 1997 2001 2005
Georgia U.S. Total
The higher than average incarceration rate has financial implications for the citizens of Georgia. As the ratio of prisoners to residents increases, the cost to taxpayers increases. Accordingly, this policy brief seeks to identify the major factors that impact incarceration rates. A number of legal changes over the past 25 years have impacted Georgia’s incarceration rate. Chart 2 shows the rate of incarceration per 100,000 residents from 1925 through 2006 and provides a timeline of significant legal and policy changes that have impacted the rate.
3 Bureau of Justice Statistics. (2008). Prison Inmates at Midyear– Appendix Table 5: Imprisonment Rates of Sentenced Male and Female Prisoners Under the Jurisdiction of State and Federal Correctional Authorities, by Gender, Region, and Jurisdiction, June 30, 2007. 4 Bureau of Justice Statistics. (2007). Correctional Populations in the United States for Years 1977 through 2005 (Extracted from Prison Population Reports). Retrieved from www.ojp.usdoj.gov/bjs/pubalp2.htm#CorrectionalpopulationsintheUnitedStates

Page 3 of 19
Chart 2
1925-2006 Georgia's Incarceration Rate
0
100
200
300
400
500
600
700
1925
1928
1931
1934
1937
1940
1943
1946
1949
1952
1955
1958
1961
1964
1967
1970
1973
1976
1979
1982
1985
1988
1991
1994
1997
2000
2003
2006
Year
Pris
oner
s pe
r 100
,000
R
esid
ents
1984: End of Earned Time Credit - This decision resulted in parole being the only state agency w ith the ability to release inmates before the end of their sentence. 1994: “Seven Deadly Sins”
1) 1st offense: Mandatory minimum of 10 years for certain violent offenses – O.C.G.A. 17-10-6.12) 2nd offense: Life w ithout parole 17-10-7
1994: O.C.G.A 17-10-7 - “three strikes law ” requires 4th time felony offender to serve the maximum time for the last offense
Vietnam WarWWII
1997: 90% Parole policy enacted for 20 offenses
2004: 90% Parole policy stopped
2006: O.C.G.A. 17-10-6.1- Persons sentenced to life are required to serve 30 years before being parole eligible; Mandatory Minimum increases to 25 years for sex offenders
Sources: Correctional Statistics
Data for 1925 to 1997 taken from a www.pap.state.ga.us/otisweb/1925pop.htm document [E. Decostanzo (OPB)]; Data from 1999 DCOR Annual Report, Data from Monthly Statistics on DCOR website Population Statistics
U.S. Census Bureau. Statistical Abstracts of U.S.

Page 4 of 19
Factors that Influence Incarceration Rates Over the past 40 years, a number of studies have identified factors that contribute to an individual’s likelihood of incarceration. These contributing factors may arise at various points along the criminal justice continuum or “flow.” Although many issues can contribute to the rate of incarceration, no one factor can be considered the sole cause. Overall, the macro-level factors that impact the incarceration rate are:
1. The number of offenders convicted and committed to prison terms; 2. The length of time they serve in prison; and 3. The rate of released prisoners who re-offend and are sent back to prison.
The Macro-level factors and sub-factors are summarized in Figure 2. The chart in Appendix A breaks these sub-factors into a lower level of detail.
Figure 2
The following sections provide detailed descriptions of the factors and how they influence the overall incarceration rate in Georgia.
Incarceration Rate
Number of Offenders Convicted and Committed
Length of Time Served in Prison
Recidivism Rate
Laws
Environmental Factors
Intrinsic Factors
Courts
Laws Policies
Programs
Policing
Parole

Page 5 of 19
Factor 1: Number of Offenders Convicted and Committed
Sub-Factor 1: Laws Statutes influence both the crime rate and the rate of incarceration. Moreover, the number of activities defined as criminal is positively related to the number of violators. If nothing were defined as illegal then there would be no crime and no incarceration rate. For example, the increased criminalization of drug offenses and the increased level of sanctions associated with drug offenses have served to increase the number of offenders convicted and committed to prison institutions. According to the U.S. Bureau of Justice Statistics, there were 19,000 drug offenders (6.5 percent of total prison population) incarcerated in state prisons throughout the United States in 1980.5 By 2005, this number had grown to more than 250,000 and accounted for approximately 20 percent of the total prison population.6 The available evidence indicates that drug statutes ―and the sanctions imposed for these violations― have a direct impact on the overall incarceration rate. Consequently, states with a higher number of sentencing enhancements for drug offenses tend to have higher incarceration rates.
Sub-Factor 2: Environment
Socio-economic Status There is no conclusive evidence proving that socioeconomic status is directly related to criminal behavior. Some research shows that a relationship exists between a person’s socio-economic status and the probability of the person committing a crime and being incarcerated; however, the strength and direction of this correlation has not been conclusively established.7 For example, Table 1 lists the self reported socioeconomic status of inmates admitted to the Georgia Department of Corrections in FY 2007 and almost half of the inmates indicated they were from the middle class or higher.8 Table 1
Socioeconomic Class Total Col % Welfare 1,777 9.44% Occasional Employment 880 4.67% Minimum Standard of Living 7,154 37.99% Middle Class or Higher 9,018 47.89%
Total Reported 18,829 100%
Not Reported 1,087 Grand Total 19,916
Source: Georgia Department of Corrections9
5 Bureau of Justice Statistics. (2007). Prisoners in 2005. Retrieved from http://www.ojp.usdoj.gov/bjs/abstract/p05.htm Bureau of Justice Statistics. (1995). Prisoners in 1994. Retrieved from http://www.ojp.usdoj.gov/bjs/pub/pdf/pi94.pdf 6 ibid 7 Bradley R. Entner Wright et al. (2006). “Reconsidering the Relationships between SES and Delinquency: Causation but not Correlation.” Criminology. 37:1. P.175-194. Canadian Department of Justice. (2008). Exploring the Link between Crime and Socio-Economic Status in Ottawa and Saskatoon: A Small Area Geographic Analysis. Retrieved from http://www.justice.gc.ca/eng/pi/rs/rep-rap/2006/rr06_6/p0.html For a further discussion of social status and its theoretical relationship to crime see Merton, Robert K. (1938) and Agnew, R. (1992) 8 Georgia Department of Corrections. (2007). Inmate Statistical Profile: Inmates Admitted During FY 2007. Retrieved from http://www.dcor.state.ga.us/pdf/FY07adm.pdf {Georgia Department of Correction statistics are self-reported} 9 ibid

Page 6 of 19
Neighborhoods One of the major components of socio-economic status is the neighborhood in which a person resides. Persons that come from economically depressed neighborhoods that have a higher prevalence of poverty and/or displacement are highly represented in the criminal justice system. Studies conducted from as far back as the 1930’s and 1940's suggest that the neighborhood where a person lives influences their likelihood of committing a crime and being incarcerated. In their book, Juvenile Delinquency and Urban Areas, Clifford Shaw and Henry McKay found that a neighborhood’s physical status, economic status, and population composition were related to its rate of crime.10 Furthermore, many troubled neighborhoods also lack a “collective efficacy,” which results in an inability of the residents to maintain order in streets, parks, and other public areas.11 The impact of neighborhoods on crime and incarceration rates may explain why many inmates come from similar geographic areas and communities. A report published by the Urban Institute in 2004 reported that “eight counties—Fulton, Cobb, DeKalb, Clayton, Richmond, Chatham, Muscogee, and Dougherty—received 43 percent of prisoners who were released from prison that year. Twelve percent of released prisoners returned to Fulton County alone; no other county in Georgia is home to more than 7 percent of releases. County-specific analyses in Fulton and Dougherty revealed that most released prisoners returned to the central cities of these counties, where unemployment is higher than in the rest of the county and city, and where large shares of the population live in poverty and in single parent, female-headed households. Within the central city of Atlanta, releases are most heavily concentrated in 5 of the city's 104 zip code areas, and within the city of Albany, releases are most heavily concentrated in 3 of the city's 13 zip code areas.”12
Personal Associations Of the numerous environmental factors that contribute to a person’s probability of committing a crime and being incarcerated, personal associations may have the greatest influence. Just like many other behaviors, criminal behavior is learned through interactions with other offenders or vicariously through a person’s environment. Edwin Sutherland, a professor at the University of Chicago, developed a widely accepted theory that criminal behavior is learned by “content” (i.e. specific techniques, attitudes, etc.) and through “processes” (i.e. through interaction with other offenders and communication with personal groups).13 This theory, regarding personal associations is the basis for some people’s belief that prisons are “universities” for criminals. The research also helps to explain why many incarcerated offenders come from the same geographic area. Accordingly, programs targeted at reducing school and community violence/crime may aid in reducing the risk of incarceration by proactively limiting the amount of crime/violence a person is exposed to.
Employment The relationship between employment and individual criminal involvement has not been conclusively established, and published studies continue to debate its influence on recidivism. Although many people assume that overall trends in unemployment are inversely related to crime and incarceration rates, this belief is not always supported in the national research. While the national research has not established a definite relationship between employment and incarceration, data from the Georgia Department of Corrections (FY 2007) shows that only 56
10 Shaw, Clifford, R. and Henry D. McKay. (1969). Juvenile Delinquency and Urban Areas. Chicago, IL: University of Chicago Press. 11 Sampson, Robert J., Stephen W. Raudenbush, and Felton Earls. (1997) “Neighborhoods and Violent Crime: A Multilevel Study of Collective Efficacy.” Science. 277:918-24. 12 La Vigne, Nancy G., Cynthia A. Mamalian. (2004). Prisoner Reentry in Georgia, http://www.urban.org/publications/411170.html 13 Vold, George B., Thomas J. Bernard, and Jeffrey B. Snipes. (2002). Theoretical Criminology. 5th ed. New York: Oxford University Press.

Page 7 of 19
percent of those incarcerated were employed full-time before entering prison.14 Additionally, the state’s figures suggest that each day of employment while on parole may result in a slight reduction in the likelihood of arrest.15 Furthermore, targeted programs that address employability such as vocational, educational, and life skills training while incarcerated may be helpful in reducing recidivism as well as increasing the likelihood of employment. Information from the Georgia State Board of Pardons and Paroles indicates that each month of attending programs during parole could result in a two percent reduction in the likelihood of arrest.16 However, before implementing programs in this area, more research on the effectiveness of specific programs applied to Georgia’s inmate population is needed.
Family Influences and Social Bonding A lack of family involvement is strongly related to crime and incarceration rates. In 1969, Travis Herschi’s Social Control Theory asserted that individuals who were tightly bonded to social groups such as the family, school, and peers would be less likely to commit delinquent acts.17 Since the publication of Herschi’s book, numerous studies have been conducted to test his theory and a majority support his original findings. People who have stronger ties to their families, their communities, and society are less likely to commit crimes and be incarcerated. Targeted programs aimed at family intervention, the prevention and treatment of child abuse and other social programs that increase family ties and community support may aid in reducing crime and the risk of incarceration. Georgia Department of Corrections statistics indicate that those who are married or have children are less likely to be incarcerated. The FY 2007 annual report shows:18
62.15 percent of those incarcerated were single at entry to prison 13.30 percent of those incarcerated were divorced at entry to prison 38 percent of those incarcerated did not have any children at entry to prison
Limited data is available on the social integration indicators of Georgia’s inmate population. High school graduation is an indicator of integration into community values/norms, and a common characteristic of Georgia’s prison population is the lack of a high school diploma. The impact of educational levels on incarceration is discussed in the following section.
Sub-Factor 3: Intrinsic Behavior Motivators
Educational Level A large percentage of prison inmates have low levels of education, and persons who did not complete high school are disproportionately represented in the penal system. In 2007, 31 percent of Georgia’s active inmates had the equivalent of a high school education compared to 83 percent of the State’s general population.19 Data from 2007 indicates that: 14 Georgia Department of Corrections. (2007). Inmate Statistical Profile: Inmates Admitted During FY 2007. p19 Retrieved from http://www.dcor.state.ga.us/pdf/FY07adm.pdf {Georgia Department of Correction statistics are self-reported} 15 State of Georgia. (2007). Georgia in Perspective 2007.p. 59. Retrieved from http://www.opb.state.ga.us/media/2270/georgia_in_perspective_fy07.pdf 16 ibid 17 Hirschi, Travis. (2002). Causes of Delinquency. Transaction Publishers. (Originally published by University of California Press, 1969) 18 Georgia Department of Corrections. (2007). Inmate Statistical Profile: Inmates Admitted During FY 2007. p. 8-9 Retrieved from http://www.dcor.state.ga.us/pdf/FY07adm.pdf {Georgia Department of Correction statistics are self-reported} 19 [Georgia Department of Corrections. (2007). Inmate Statistical Profile: Inmates Admitted During FY 2007. p. 46. Retrieved from http://www.dcor.state.ga.us/pdf/FY07adm.pdf – [U.S. Census Bureau. (2007). American Community Survey.]

Page 8 of 19
87 percent of inmates had more than a ninth grade education, 31 percent had the equivalent of a GED, 1.8 percent had a bachelors degree or higher, and 0.25 percent had a graduate degree.20
Research has shown that an increase in education/job skills while incarcerated is inversely related to crime.21 In addition, the continued expansion of programs to increase the high school graduation rate and promote educational attainment should help in reducing the incarceration rate in Georgia.
Substance Abuse The link between substance abuse and crime is well documented. In fact, substance abuse is linked to the incarceration of the majority of persons jailed or imprisoned in the United States.22 Research has shown offenders have a higher instance of substance abuse than the general population and it is estimated that between 60 and 83 percent of the nation’s offender population have used drugs at some point in their lives, as compared to 40 percent of the total United States population.23 Moreover, the National Institute of Justice estimates that up to 80 percent of offenders have some level of substance abuse problem related to their criminal activity.24 In Georgia, approximately 75 to 80 percent of adult offenders and over 60 percent of juvenile offenders have a substance abuse problem.25 In sum, individuals who habitually abuse alcohol or other illicit substances are at a much higher risk of being incarcerated.
Mental Health Mental health problems are often associated with substance abuse and crime. Currently, there is a major national effort to divert mental health offenders from incarceration. In 2006, the Bureau of Justice Statistics report on “Mental Health Problems of Prison and Jail Inmates” showed that more than half of all prison and jail inmates, including 56 percent of state prisoners, 45 percent of federal prisoners and 64 percent of jail inmates, were found to have a mental health problem.26 The figures also find that inmates with a mental health problem also had high rates of substance dependence or abuse in the year before their admission.27 Research has also shown that offenders with mental health problems tend to serve longer prison sentences and are at a higher risk of recidivating.28
Sub-Factor 4: Policing
Level of Enforcement An increase in law enforcement activity may result in a higher number of offenders who are caught committing crimes. Consequently, an increase in law enforcement activity could increase the number of arrests and lead to higher rates of incarceration by increasing the inflow of offenders
20 Georgia Department of Corrections. Inmate Statistical Profile: Inmates Admitted During FY07. Retrieved from http://www.dcor.state.ga.us/pdf/FY07adm.pdf - cumulative statistics computed by OPB 21 Lipsey, Mark W. and Francis T. Cullen. (2007). “The Effectiveness of Correctional Rehabilitation: A Review of Systematic Reviews.” Annual Review of Law and Social Science, Vol.3. Retrieved from http://www.vanderbilt.edu/VIPPS/ER&M/LipseyCullen_Offender_Rehabilitation.pdf 22 Stohr, Mary K. et al. (2003). Residential Substance Abuse Treatment for State Prisoners, Breaking the Drug-Crime Cycle Among Parole Violators. (NCJ 199948). Retrieved from http://www.ncjrs.gov/pdffiles1/nij/199948.pdf 23 Drug Policy Information Clearinghouse, Drug Treatment in the Criminal Justice System, Washington, DC: Office of National Drug Control Policy, March 2001. 24 Substance Abuse and Mental Health Services Administration, Planning for Alcohol and Other Drug Abuse Treatment for Adults in the Criminal Justice System, Rockville, MD: U.S. Department of Health and Human Services, 1995. 25 State of Georgia. (2008). Substance Abuse Treatment Programs for Adult and Youth Offenders. Retrieved from http://www.opb.state.ga.us/media/7906/substance%20abuse%20report%20july%202008.pdf 26 Bureau of Justice Statistics. (2006). Mental Health Problems of Prison and Jail Inmates. (NCJ 213600). Retrieved from www.ojp.usdoj.gov/bjs/abstract/mhppji.htm 27 ibid 28 Bureau of Justice Statistics. (2006). Mental Health Problems of Prison and Jail Inmates. (NCJ-213600). Retrieved from www.ojp.usdoj.gov/bjs/abstract/mhppji.htm

Page 9 of 19
into the system. For example, an increase in drug task force activity that impacts the number of arrests, convictions, and the number people who go to prison would tend to increase the overall incarceration rate.
Police Officer Discretion In addition to enforcement level, an agency’s policies on officer discretion also influence incarceration rates. “Zero tolerance” and mandatory arrest policies may serve to increase incarceration rates by requiring law enforcement officers to arrest an offender who may have been handled “outside” of the formal system.
Factor 2: Length of Stay
Sub-Factor 1: Laws
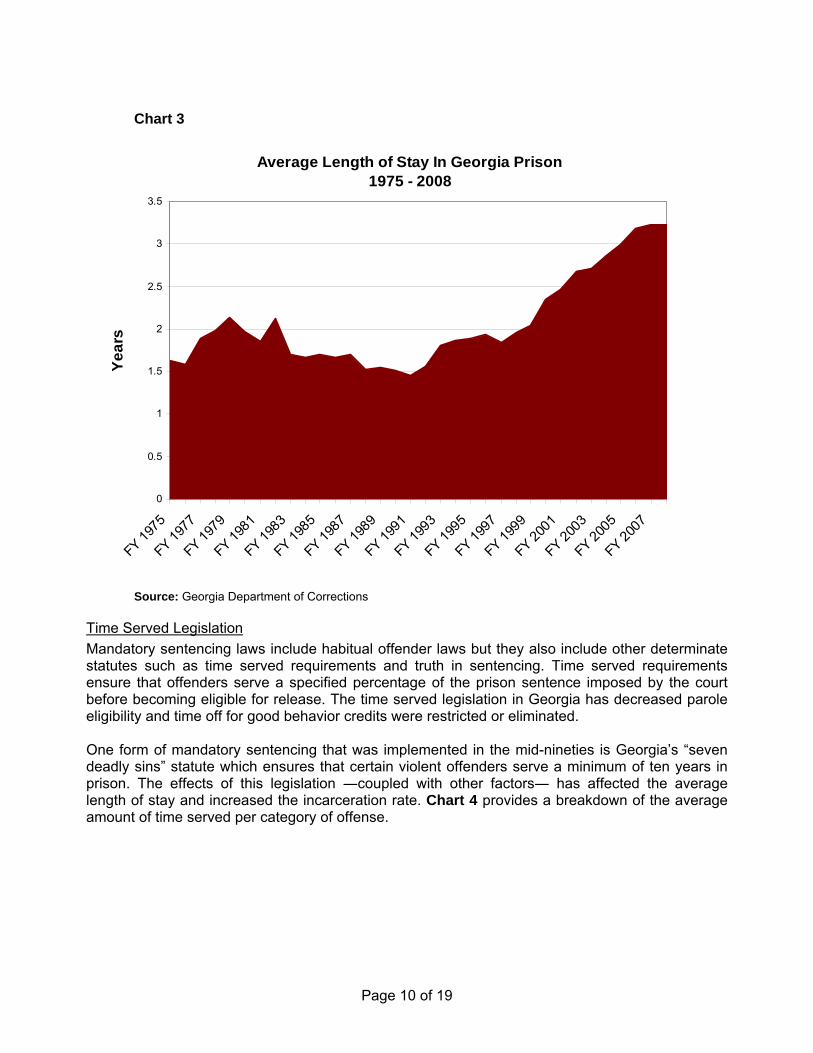
Habitual Offender Laws Habitual offender laws, commonly referred to as “Three Strikes Laws” are statutes that increase the severity of punishment for offenders who have serious prior felony convictions within a certain category of offenses. Lawmakers at both the state and federal levels have passed legislation increasing penalties for criminal offenses, particularly violent crimes. 29 These actions were in response to public concerns about crime and the belief that many serious offenders are released from prison too soon.30 Many such laws have come under the general label of “three strikes and you’re out.” In 1994, Georgia implemented a “Two Strikes” law for certain serious offenses referred to as the “seven deadly sins”, which has affected the state’s incarceration rate by increasing the amount of time served by specific offenders. Based on this legislation, first time offenders who commit certain violent crimes are sentenced to a minimum of ten years and second-time offenders are sentenced to life without the possibility of parole. Offenses that are covered under the “two strikes” statute include all serious violent offenses listed in O.C.G.A. 17-10-7.31 Georgia’s other habitual offender law is a “three strike” type of law which requires offenders to serve the maximum sentence allowable for their fourth felony conviction.32 Habitual offender laws, and other forms of mandatory minimum sentencing, have had an impact on the amount of time offenders serve. Chart 3 on the following page tracks the average length of stay in Georgia prisons. The data indicates that the length of stay for Georgia prisoners grew an average of 10.90 percent, per year, from 1991 to 2008.33 29 National Institute of Justice. (1997).”Three Strikes and You’re Out: A Review of State Legislation” (September 1997), Page 1. Accessed on September 25, 2008 at: http://www.ncjrs.gov/pdffiles/165369.pdf 30 ibid 31 O.C.G.A 17-10-7 and O.C.G.A. 17-10-6.1 32 O.C.G.A 17-10-7 33 Georgia Department of Corrections. (2008). “Prisoner Length of Stay Report: Time Served by Departing Inmates Who Were New Court Commitments.”
Page 10 of 19
Chart 3
Average Length of Stay In Georgia Prison1975 - 2008
0
0.5
1
1.5
2
2.5
3
3.5
FY 19
75
FY 19
77
FY 19
79
FY 19
81
FY 19
83
FY 19
85
FY 19
87
FY 19
89
FY 19
91
FY 19
93
FY 19
95
FY 19
97
FY 19
99
FY 20
01
FY 20
03
FY 20
05
FY 20
07
Year
s
Source: Georgia Department of Corrections
Time Served Legislation Mandatory sentencing laws include habitual offender laws but they also include other determinate statutes such as time served requirements and truth in sentencing. Time served requirements ensure that offenders serve a specified percentage of the prison sentence imposed by the court before becoming eligible for release. The time served legislation in Georgia has decreased parole eligibility and time off for good behavior credits were restricted or eliminated. One form of mandatory sentencing that was implemented in the mid-nineties is Georgia’s “seven deadly sins” statute which ensures that certain violent offenders serve a minimum of ten years in prison. The effects of this legislation ―coupled with other factors― has affected the average length of stay and increased the incarceration rate. Chart 4 provides a breakdown of the average amount of time served per category of offense.

Page 11 of 19
Time Served: FY 1996 to FY 2008
0.0%
10.0%
20.0%
30.0%
40.0%
50.0%
60.0%
70.0%
80.0%
90.0%
100.0%
FY 1996
FY 1997
FY 1998
FY 1999
FY 2000
FY 2001
FY 2002
FY 2003
FY 2004
FY 2005
FY 2006
FY 2007
FY 2008
Perc
enta
ge o
f Sen
tenc
e Se
rved
Source: Georgia Department of Corrections. “Prisoner Length of Stay Report.” 07/01/2008
Good Behavior Credit To combat overcrowding in penal institutions, many states have implemented policies that award eligible inmates credit toward early release. In general, good-behavior credit does not involve a decision by a parole or clemency authority to release the inmate. Good behavior (or time) credit is generally defined as automatic time off from a sentence based on behavior while in prison. The utilization of good-behavior credit varies by state and differs in the amount of credit available and the way it is awarded.34 Some states use good-behavior credit to reward an inmate for favorable behavior and to manage the prison population, while others acknowledge having the credit system in place but rarely using it.35 Currently, fifteen of the sixteen states36 in the National Conference of State Legislatures’ Southern Legislative Conference (SLC) offer some form of sentence commutation through good-behavior credits.37 The only SLC state that does not award sentence reducing credits is Georgia, which discontinued the practice in 1984.38 34 Edwards, Todd. (2001). “Correctional Good-Time Credits in Southern States.” Regional Resource. Atlanta, GA: The Council of State Governments. 35 Ibid 36 States in the NCSL SLC: AL, AR, FL, GA, KY, LA, MA, MS, MO, NC, OK SC, TN, TX, VA and WV. 37 Ibid 38 O.C.G.A. § 42-5-100 abolished good-behavior credit. However, the State Board of Pardons and Paroles has a Performance Incentive Credit (PIC) process where the tentative parole release date can be moved forward up to six months by meeting certain criteria such as enrolling in a drug treatment program and receiving technical education.
Chart 4
Drug Sales (39%) Avg sentence 5.9 yrs, avg served 2.3 yrs
Drug Possession (47%) Avg sentence 3.6 yrs, avg served 1.7 yrs
Property (64%) Avg sentence 3.6 yrs, avg served 2.3 yrs
Violent (84%) Avg sentence 6.3 yrs, avg served 5.3 yrs
Sex Offenders (95%) Avg sentence 6.5 yrs,
avg served 6.2 yrs

Page 12 of 19
Sub-Factor 2: Courts
Judicial Discretion (Judge Decides the Length of Stay) Despite the mandatory sentencing laws, judges in Georgia still possess a great deal of discretion in sentencing. For example, a person convicted of the offense of aggravated assault is punished by imprisonment of not less than one nor more than 20 years.39 This is just one example of how the statutory guidelines give judges the opportunity to consider aggravating or mitigating circumstances. However, the degree of discretion can be problematic with regard to forecasting prison bed space because wide variations in sentences may serve to increase the number of prisoners above the estimated amount. In sum, variations in sentencing have a direct impact on the state’s rate of incarceration. Split Sentencing and Probation40 A recent trend in commitment has been an increased usage of split-sentences. Almost half of Georgia inmates sent to prison in 2006 (11,345 of 22,282) had a split-sentence, which is when a judge imposes a sentence of a set number of years with a portion of it to be spent in prison followed by probation.41 For example, a sentence might consist of five years where three years must be served in prison and two years on probation. This method of sentencing reduces the incarceration rate because it reduces the amount of time served in prison. Using a form of sentencing that includes probation means that offenders could be assigned to street probation, intermediate sanctions or to a probation facility depending on their risk level. Street probation requires offenders to report to their probation officers at specified intervals, obey their probation rules, pay their fines and fees and generally live a normal life. Intermediate sanctions are for when regular probation is not enough and it consists of close supervision and may also include house arrest, electronic monitoring, and/or assigning the offender to a day reporting center. Additionally, for the highest level of supervision outside of prison, the judge may assign probationers to a short-term of incarceration in a probation facility, which allows them to work outside the facility but requires them to report to the center at night. Statistics from the Georgia Department of Corrections show that roughly half of probationers are successful at completing their term of probation, which saves the State from having to pay to keep them incarcerated.42 The cost of regular probation is $475 per inmate, per year, and intensive probation costs $1,241 while incarceration costs $16,841 per year on average.43
Drug and Mental Health Courts One of the prevalent forms of alternative sentencing is drug courts. Drug courts were established in response to the increase in drug related cases entering the courts in the late 1980’s. The purpose of drug courts is to use the power of the court to require drug treatment.44 The primary goal of these courts is to reduce recidivism and substance abuse among offenders by successfully treating the offender’s substance abuse.45 The State of Washington conducted two cost-benefit analyses on the state’s drug courts, one in 1999, which showed a $2.46 return for each dollar invested and one in 2003, which showed a return of $1.74 for every dollar invested.46 39 O.C.G.A. § 16-5-21 40 This section is based on the premise that judges use split sentencing as an alternative to requiring that the entire sentence be served behind bars rather than using it to increase the punishment for offenders who would have otherwise been sentenced to probation only. 41 GDC data warehouse “Discoverer” query, 10-Sep-2008 42 Georgia Department of Corrections. (2007,2005,2003,2001). Probation Release Profiles. Retrieved from http://www.dcor.state.ga.us/Reports/Annual/AnnualStatistics.html 43 Georgia Department of Corrections. (2007). Annual Report. Retrieved from http://www.dcor.state.ga.us/Reports/Annual/AnnualReport.html 44 Washington State Institute for Public Policy. (1999). “Can Drug Courts Save Money for Washington State Taxpayers?” 45 Washington State Institute for Public Policy. (2003). “Washington State’s Drug Court for Adult Defendants: Outcome Evaluation and Cost-Benefit Analysis.” 46 ibid

Page 13 of 19
Another form of alternative sentencing that has seen increased usage is mental health courts. “A mental health court is a special docket criminal court designed to divert mentally ill offenders out of the criminal justice system and into mental health treatment while at the same time ensuring public safety.”47 A study of Allegheny County’s Mental Health Court (State of Pennsylvania) found that special courts that sentenced people with mental illnesses (who are convicted of misdemeanors and low-level felonies) to treatment instead of jail, has the potential to save taxpayers money.48
Sub-Factor 3: Parole Discretionary parole is the authority a parole board has to release an offender from incarceration whose sentence has not expired.49 This conditional release is dependent on sustained lawful behavior and requires that the offender submit to monitoring by parole personnel who ensure compliance with the terms of release. Discretionary parole decisions are based on various factors that weigh the need for punishment, successful community reintegration and victim and community restoration. These factors include the nature of the crime, the offender’s criminal history, behavior in prison, social background and risk posed to the community; and information from crime victims and the affected communities. Discretionary parole decisions can enhance public safety by working to keep dangerous offenders incarcerated and ensuring that offenders selected for release receive the necessary structure and assistance to become law-abiding citizens. In Georgia, the State Board of Pardons and Paroles is the only agency with the authority to release prisoners prior to the expiration of their court imposed sentence. Consequently, the parole board is the only post-sentencing body that can impact the inmate population with discretionary releases.
Factor 3: Recidivism Rate
Sub-Factor 1: Policies
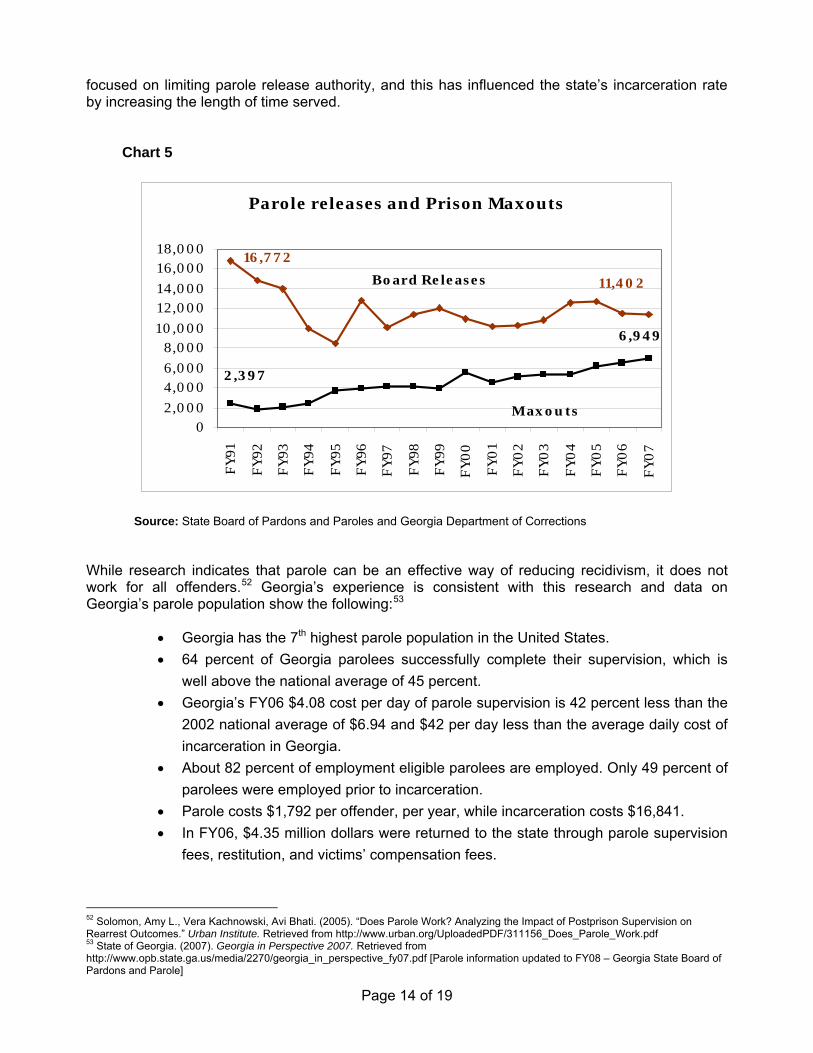
Detention and Parole Inmates are released from prison by parole or by serving their entire sentence (maxouts). Between 11,000 and 12,000 inmates are paroled each year. However, the percentage of parole releases as a portion of all releases decreased from about 88 percent in FY 1991 to 62 percent in FY 2007.50 Meanwhile the number of inmates serving their entire sentence and released without supervision grew from about 2,000 (about 12 percent) to almost 7,000 (about 38 percent).51 The growth in the number of inmates released without parole supervision is influenced by the increasing number of sentences that forbid parole. Overall, legal and other policy changes have
47 Ridgely et al. (2007). “Justice, Treatment, and Cost: An Evaluation of the Fiscal Impact of Allegheny County Mental Health Court.” Rand Corporation. Retrieved from http://www.rand.org/pubs/technical_reports/2007/RAND_TR439.pdf 48 ibid 49 This information in this paragraph was derived from the American Probation and Parole Association (APPA) web site’s section on discretionary parole: http://www.appa-net.org/about/ps/discretionaryparole.htm Site accessed on September 23, 2008. 50 The State was in the middle of an emergency early release program due to prison overcrowding in FY 1991 and 1992. Consequently, the 88% number in FY 1991 was higher than normal. Source: State Board of Pardons and Paroles. 51 [Georgia State Board of Pardons and Parole. (2007). Annual Report 2007. Retrieved from http://www.pap.state.ga.us/opencms/export/sites/default/resources/07Annual_Report.pdf ] - [Georgia Department of Corrections. Inmate Statistical Profiles. Retrieved from http://www.dcor.state.ga.us/Reports/Annual/AnnualStatistics.html
Page 14 of 19
focused on limiting parole release authority, and this has influenced the state’s incarceration rate by increasing the length of time served.
Chart 5
Parole releases and Prison Maxouts
02,000
4,0006,000
8,00010,000
12,00014,000
16,00018,000
FY
91
FY
92
FY
93
FY
94
FY
95
FY
96
FY
97
FY
98
FY
99
FY
00
FY
01
FY
02
FY
03
FY
04
FY
05
FY
06
FY
07
Maxouts
Board Releases
2,397
6,949
16,772
11,402
Source: State Board of Pardons and Paroles and Georgia Department of Corrections While research indicates that parole can be an effective way of reducing recidivism, it does not work for all offenders.52 Georgia’s experience is consistent with this research and data on Georgia’s parole population show the following:53
• Georgia has the 7th highest parole population in the United States. • 64 percent of Georgia parolees successfully complete their supervision, which is
well above the national average of 45 percent. • Georgia’s FY06 $4.08 cost per day of parole supervision is 42 percent less than the
2002 national average of $6.94 and $42 per day less than the average daily cost of incarceration in Georgia.
• About 82 percent of employment eligible parolees are employed. Only 49 percent of parolees were employed prior to incarceration.
• Parole costs $1,792 per offender, per year, while incarceration costs $16,841. • In FY06, $4.35 million dollars were returned to the state through parole supervision
fees, restitution, and victims’ compensation fees.
52 Solomon, Amy L., Vera Kachnowski, Avi Bhati. (2005). “Does Parole Work? Analyzing the Impact of Postprison Supervision on Rearrest Outcomes.” Urban Institute. Retrieved from http://www.urban.org/UploadedPDF/311156_Does_Parole_Work.pdf 53 State of Georgia. (2007). Georgia in Perspective 2007. Retrieved from http://www.opb.state.ga.us/media/2270/georgia_in_perspective_fy07.pdf [Parole information updated to FY08 – Georgia State Board of Pardons and Parole]

Page 15 of 19
Additionally, the Georgia correctional statistics show that approximately half of the state inmates released between FY 2001 and FY 2006 were serving their first prison sentence. About five percent of inmates who had served a previous sentence had been incarcerated four or more times.54 More research is needed, but programs and policies that provide a transition from prison to life outside prison may serve to reduce the recidivism rate.55 In an effort to reduce recidivism, Georgia has adopted COMPAS, a system-wide offender risk and needs assessment tool that will be used at all stages of the offender’s movement through the system: prison, probation, and parole. Doing the assessment as early as possible in the process will help ensure that the inmate is assigned an appropriate placement within the system and that he/she receives the correct services.
54 Georgia Department of Corrections. (2006-2001). Inmate Statistical Profile. Retrieved from http://www.dcor.state.ga.us/Reports/Annual/AnnualStatistics.html 55 Burke, Peggy. (2007). “An Overview of NIC’s Transition from Prison to the Community Initiative.” National Institute of Corrections. Washington, DC. Retrieved from http://nicic.org/Downloads/PDF/Library/022778.pdf

Page 16 of 19
Sub-Factor 2: Programs
Rehabilitative Services Numerous studies have found that prisoners who participate in programs while in prison have lower recidivism rates than those who do not participate in such programs.56 A study published by the Urban Institute found that those who participated in job training, educational programs, and substance abuse treatment while incarcerated have better reentry outcomes and are less likely to return to prison.57 In 2006, the Washington State Institute for Public Policy published “Evidence-Based Adult Corrections Programs: What Works and What Does Not”58 and “Evidence-Based Public Policy Options to Reduce Future Prison Construction, Criminal Justice Costs and Crime Rates.”59 The first study reviewed 291 evaluations of various programs for adult offenders and the second study reviewed 571 evaluations and broadened the review to include juvenile corrections and prevention programs. The studies included program specific cost/benefit analysis as shown in Table 2. Table 2
Programs that Work for Reducing Crime for Adult Offenders60
Programs for Adult Offenders Expected Crime Reduction Program Cost Program Benefits
Minus Program Cost
Intensive supervision with treatment orientated programs -16.7% $7,124 $11,563
Drug treatment in the community -9.3% $574 $10,054 Vocational education in prison -9% $1,182 $13,738 Adult drug court -8% $4,333 $ 4,787 General education in prison -7% $962 $10,669 Cognitive therapy in prison or
community -6.3% $105 $10,299
Correctional industries in prison -5.9% $417 $9,439 Drug treatment in prison -5.7% $1,604 $7,835
Inmate Programs61 The Georgia Department of Corrections offers programs in education, vocational training, substance abuse treatment and cognitive-behavioral change. The correctional data that compares the 3-year felony reconviction rates for inmates who attended programs and those who did not suggests that:
56 Lipsey, Mark W., and Francis T. Cullen. (2007). “The Effectiveness of Correctional Rehabilitation: A Review of Systematic Reviews.” Annual Review of Law and Social Science. Vol.3. Retrieved from http://www.vanderbilt.edu/VIPPS/ER&M/LipseyCullen_Offender_Rehabilitation.pdf 57 La Vigne, Nancy G., Cynthia A. Mamalian. (2004). Prisoner Reentry in Georgia, http://www.urban.org/publications/411170.html 58 Aos, Steve. et al. (2006). “Evidence-Based Adult Corrections Programs: What Works and What Does Not.” Retrieved from http://www.wsipp.wa.gov/pub.asp?docid=06-01-1201 59Aos, Steve. et al. (2006). “Evidence-Based Public Policy Options to Reduce Future Prison Construction, Criminal Justice Costs, and Crime Rates.” Retrieved from http://www.wsipp.wa.gov/pub.asp?docid=06-10-1201 60 Includes indirect benefits to 1) taxpayers and 2) crime victims. See appendix B of Aos et al. for a complete description. 61 The comparability of general population inmates to program graduates may require further evaluation. It is thought that program graduates may be less likely to recidivate by default because they enter the program voluntarily due to their desire to change. DOC asserts that participants come from the general population and are comparable.

Page 17 of 19
• Inmates who participated in vocational training had an 11.2% lower return rate than those who did not have vocational training (16.2 percent vs. 27.4 percent);
• Inmates who participated in academic education had a 6.7 percent lower return rate than those who did not participate in academic education (20.7 percent vs. 27.4 percent); and
• Inmates with serious substance abuse issues who complete Residential Substance Abuse Treatment have a 5.5 percent lower return rate (21.9 percent vs. 27.4 percent).62
Using data provided by the Department of Corrections, the following table provides an overview of the benefits of these programs and their impact on recidivism rates. In viewing the table, it is important to consider the fact that Residential Substance Abuse Treatment (RSAT) is an enabler for inmate involvement in other programs and is crucial to employability upon release/parole/probation. In addition, the majority of RSAT participants are also in vocational programs. Table 3[1]
Vocational Training Cost Analysis
Program Sample
Population Incarceration
Costs Treatment
Cost YR 1 Total
Cost
3-Yr Felony Reconviction
Rate Returning Inmates
Return Incarceration
Cost Cost /
Benefit Vocational Training 1,000 $16,841 $419 $17,260,000 16.20% 162 $2,728,242 No Treatment Group 1,000 $16,841 $0 $16,841,000 27.40% 274 $4,614,434
Cost of Treatment $419,000 Cost Avoidance $1,886,192 $1,467,192
Academic Education Cost Analysis
Program Sample
Population Incarceration
Costs Treatment
Cost YR 1 Total
Cost
3-Yr Felony Reconviction
Rate Returning Inmates
Return Incarceration
Cost Cost /
Benefit Academic Education 1,000 $16,841 $408 $17,249,000 20.70% 207 $3,486,087 No Treatment Group 1,000 $16,841 $0 $16,841,000 27.40% 274 $4,614,434 Cost of Treatment $408,000 Cost Avoidance $1,128,347 $720,347 Residential Substance Abuse Treatment Cost Analysis
Program Sample
Population Incarceration
Costs Treatment
Cost YR 1 Total
Cost
3-Yr Felony Reconviction
Rate Returning
Inmate
Return Incarceration
Cost Cost /
Benefit RSAT 1,000 $16,841 $1,534 $18,375,000 21.90% 219 $3,688,179 No Treatment Group 1,000 $16,841 $0 $16,841,000 27.40% 274 $4,614,434 Cost of Treatment $1,534,000 Cost Avoidance $926,255 ($607,745)
[1] Cost avoidance does not include the indirect benefits like the Aos et al. study does. Instead it is calculated solely on direct cost and does not account for any indirect savings. Source: Office of Planning and Budget using data provided by Georgia Department of Corrections
62 Georgia Department of Corrections – Risk Reduction Services

Page 18 of 19
Community Programs In 2004, Georgia was one of seven states that participated in the inaugural National Governor’s Association’s Prisoner Reentry State Policy Academy. The states assembled interdisciplinary reentry policy teams comprised of representatives from the Governor’s Office and key state agencies such as corrections, public safety, health and human services, welfare, workforce, and housing. The goal of the academy was the development of statewide strategic action plans that coordinate services across agencies and improve reentry outcomes along a number of dimensions. Additionally, the state continues to participate in the Georgia Reentry Impact Project, which is a separate initiative with similar goals. The Georgia Reentry Impact Project (GRIP) can be divided into three phases:63
• Making a Plan: Protect and Prepare: Institutionally-Based Programs • Coming Home: Control and Restore: Community-Based Transition • Staying Home: Responsibility and Productivity: Community-Based Long-Term Support
The project is aimed at shifting Georgia from a “one size fits all approach” to a more individualized reintegration approach.64 Some of the programs created as a result of GRIP are:
• Fatherhood Initiative - program designed to encourage non-custodial parents who are unemployed/underemployed to find jobs, make their child support payments, and take a more active role in raising their children
• Identification Program - helps offenders obtain critical identification papers before release so they can prove eligibility for employment
• Partnership Reentry Housing Project - helps provide housing for work-ready convicted felons who remain in prison after the Parole Board has authorized their release due solely to having no residential options
Although these programs are still in their early phases, the results are showing promise but need continued evaluation.
Conclusion Georgia’s incarceration rate continues to be affected by the number of offenders convicted and committed, the length of time served in prison, and the rate of recidivism. Although no single factor can be considered the sole cause, using quality research as a roadmap for adjusting the factors documented in this paper should provide guidance in reducing the incarceration rate in Georgia. This paper makes it clear that the state’s incarceration rate is influenced by factors that cross organizational and societal boundaries. Consequently, to best manage the state’s offender population, a holistic approach should be used to help ensure optimal results. State agencies, local governments, non-profit groups and communities should work together to influence the factors driving incarceration.
63 U.S. Department of Justice – Office of Justice Programs. Georgia Impact Project. Retrieved from http://www.reentry.gov/sar/pdf/wp1_ga.pdf 64 ibid

Appendix A Incarceration Rate
Number of Offenders Convicted and Committed
Length of Time Served in Prison Recidivism Rate
Laws
Environmental Factors
Intrinsic Factors
Policing
Drug Laws
Socio-economic Status
Neighborhoods
Personal Associations
Employment
Family Influences
Educational Level
Substance Abuse Prob.
Mental Health Prob.
Level of Enforcement
Police Officer Discretion
Laws
Habitual Offender Laws
Time Served Legislation
Courts
Judicial Discretion
Split Sentencing
Policies
Programs
Correctional Mission
Parole Revocation Policies
Rehabilitative Services
Inmate Programs
Community Programs
Drug & Mental Health Courts
Parole
“Good-time” Credit