Policy Brief Competitive global players...
19
Policy Brief BRICS Cities: Competitive global players June, 2013 BRICS-Urbe
-
Upload
duongtuong -
Category
Documents
-
view
214 -
download
0
Transcript of Policy Brief Competitive global players...

Policy Brief
BRICS Cities:
Competitive global players
June, 2013
BRICS-Urbe
BRICS POLICY CENTER – POLICY BRIEF
BRICS CITIES: Competitive global players
1
Author: Carolina Vilela Figueiredo.
BRICS CITIES: Competitive global
players
This Policy Brief presents a policy-oriented discussion on BRICS cities
competitiveness in the global network of investment flows through the lens of city-
network analysis, extracting recommendations for public policies focused on
investments attraction and city competitiveness.
From Spectators to Protagonists
Hosts of mega-sporting events, home of 43% of the world´s population and the
main drivers of the global economic growth in the decades ahead, BRICS cities are
considered key and essential nodes to the network of global cities. This group
represents a shift in the global balance of power and command by holding leading
positions at the intersection of the international trade and investment flows. Because of
this, they are also seen as a threat (or opportunity) to the system of global cities in the
developed world (Horne 2010).
The Beijing Summer Olympic and Paralympic Games (2008), Delhi
Commonwealth Games (2010), South Africa FIFA World Cup (2010), Sochi Winter
Olympic and Paralympic Games (2014), Brazil FIFA World Cup (2014), Rio de Janeiro
Summer Olympic and Paralympics Games (2016) and Russia FIFA World Cup (2018)
reveal a non-coincidental frequency of how the BRICS ‘giants’ have attracted a number
of investments in mega-sporting events, especially in infrastructure to support the
games. The host cities, however, are the loci where the phenomena take place. Linking
the emerging cities into the world economy, such attractiveness also configure new
economic geographies for the BRICS cities, shaping new connections, centrality,
power, porosity, functions, flows and competition in the world system of cities,
investments and prestige.

BRICS POLICY CENTER – POLICY BRIEF
BRICS CITIES: Competitive global players
2
Although Rio de Janeiro, Sao Paulo, Moscow, Delhi, Beijing, Johannesburg,
amongst other BRICS cities have been highly competitive for investments in the
emerging world, they share a number of similar vulnerabilities. The increasing
socioeconomic disparities, income polarization and spatial fragmentation still feature
BRICS cities territories. Also, the social burden and poor quality of life in some BRICS
cities have not accompanied their outstanding economic growth, level of
competitiveness and investment flows.
BRICS cities face a number of battles in order to win the game not only inside
stadiums, but also outside, where there´s a vast territory lagging behind the spaces of
flows and capital accumulation. This fact sheet raises the discussion that in order to
become global players in the international arena of power and command, BRICS cities
must work on their increased competitive status alongside key indicators that really
brand global and sustainable cities, towards meeting the local needs of the population
and assuring sustainable development.
Forms, Functions and Flows
International debates about city competitiveness have focused on how
globalization has imposed a new geography of centrality in the world. Cities have
become decoupled from their local geography to be in a position in the international
networks of investments and trade. In this sense, cities are increasingly likely to
become the loci of global business rather than nations.
As appointed by some experts, the current trend reveals the emergence of
‘geopolitical urban vectors’ that will shape the global economy, which is no longer a
result from state-to-state transactions, but rather about urban axes that bring together
key cities (Sassen 2012), such as: Washington - New York - Chicago; Geneva - Vienna
- Nairobi; Beijing - Hong Kong - Shanghai; Sao Paulo - Rio de Janeiro - Brasília. These
urban vectors are connected not only through economic flows, but also geopolitical
relations. Since cities compete with each other mostly in form of investments and
political power, when they attract investments and capture more of the command and
control functions of the world economy, their status and hierarchy in the urban network
improve (Alderson & Beckfield 2004; Friedmann 1986, Burger et al 2011).
OA city’s level of competitiveness, however, relies not only on the financial
dimension, but also on location factors and the scope and nature of its connections

BRICS POLICY CENTER – POLICY BRIEF
BRICS CITIES: Competitive global players
3
with other cities (Friedmann 1986). In other words, competition involves a complex
relationship between the built environment (forms), economic functions and flows (Wall
2009).
It is crucial to understand the intrinsic relations between BRICS cities
competitiveness, economic power, and urban networks, once the more connections a
city has, the more competitive and powerful it is over the other cities in the global
network. A clear understanding of the relations of competition (and cooperation) within
an urban system enables strategic planning and supportive public policies focused on
long-term economic growth and development (Malecki 2004).
Investments flows to BRICS
Data from the latest Foreign Direct Investments (FDI) report (fDi Intelligence
2013) reveal how BRICS countries share a similar pattern of resilience to the global
economic recession. The giants, excluding South Africa, attracted almost one-fifth
(22%) of global FDI projects in 2012. Although the expected overall market share of
BRICS FDI is to decline in 2013, inward investments are projected to rebound from
2014 onwards due to stronger growth and location factors that should stimulate
investments into BRICS, such as the Olympic Games and FIFA World Cup (fDi
Intelligence 2013).
BRICS POLICY CENTER – POLICY BRIEF
BRICS CITIES: Competitive global players
4
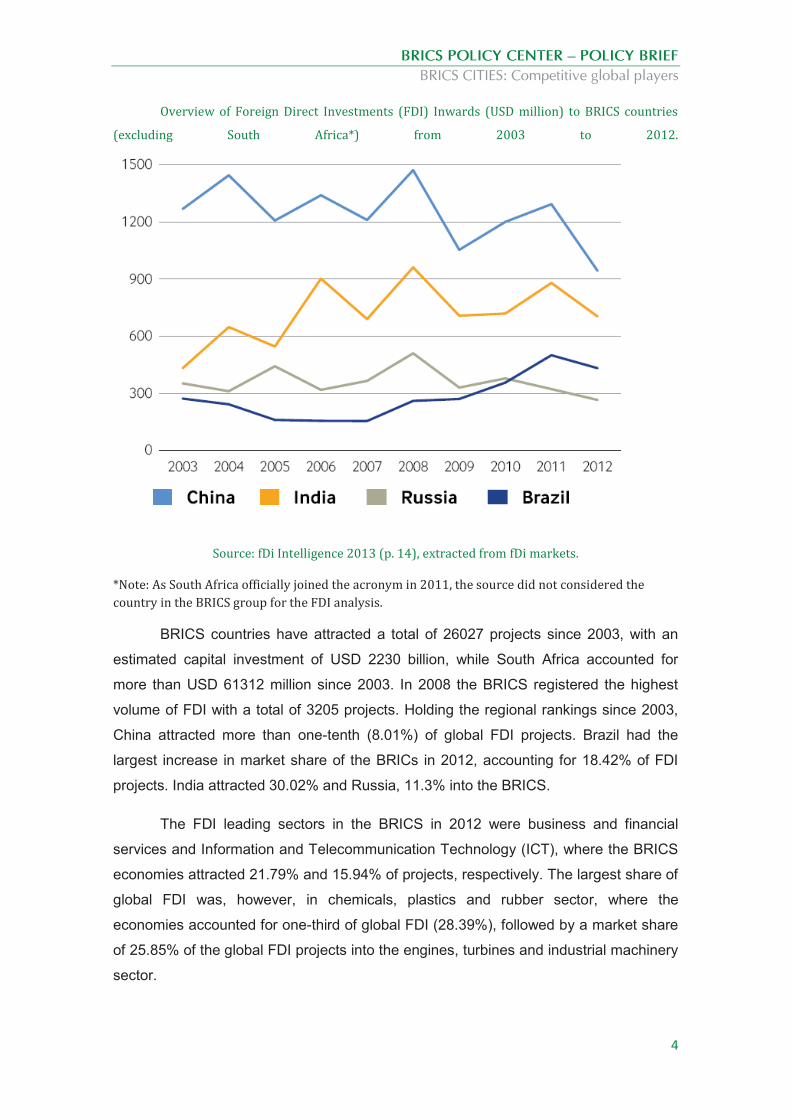
Overview of Foreign Direct Investments (FDI) Inwards (USD million) to BRICS countries
(excluding South Africa*) from 2003 to 2012.
Source: fDi Intelligence 2013 (p. 14), extracted from fDi markets.
*Note: As South Africa officially joined the acronym in 2011, the source did not considered the
country in the BRICS group for the FDI analysis.
BRICS countries have attracted a total of 26027 projects since 2003, with an
estimated capital investment of USD 2230 billion, while South Africa accounted for
more than USD 61312 million since 2003. In 2008 the BRICS registered the highest
volume of FDI with a total of 3205 projects. Holding the regional rankings since 2003,
China attracted more than one-tenth (8.01%) of global FDI projects. Brazil had the
largest increase in market share of the BRICs in 2012, accounting for 18.42% of FDI
projects. India attracted 30.02% and Russia, 11.3% into the BRICS.
The FDI leading sectors in the BRICS in 2012 were business and financial
services and Information and Telecommunication Technology (ICT), where the BRICS
economies attracted 21.79% and 15.94% of projects, respectively. The largest share of
global FDI was, however, in chemicals, plastics and rubber sector, where the
economies accounted for one-third of global FDI (28.39%), followed by a market share
of 25.85% of the global FDI projects into the engines, turbines and industrial machinery
sector.

BRICS POLICY CENTER – POLICY BRIEF
BRICS CITIES: Competitive global players
5
The main source countries investing in the BRICS are USA, Japan, Germany and UK,
contributing more than half of FDI in the BRICS since 2003, responsible for 56%
projects and approximately 8 million direct jobs.
At city level, the international ‘greenfield' investments1 have placed six BRICS cities
amongst the top ten most invested cities in 2012. This rapid ascension of BRICS cities
reveals how much of the global economy is running through emerging cities.
Top 10 cities responsible for the highest volumes of International Greenfield Investments
in 2012
Source: Global Cities Investment Monitor 2012 (KPMG & Greater Paris Investment Agency 2012).
Shanghai and Hong Kong are firmly established at top 3, while São Paulo ranks
4th and Beijing, 7th. Moscow arrives at 8th, accounting for 25.13% of FDI into Russia
and Mumbai continues its rapid ascend at 10th. Again, the leading economic sectors
for investments were business activities, financial services and ICT.
Key Players
BRICS cities networks have been considered in the group of the most
significant urban vectors of the next decade: Beijing - Hong Kong - Shanghai and Sao
Paulo - Rio de Janeiro - Brasília (Sassen 2012). Staring amongst the top invested
1 International Greenfield Investments happen when a company settles new activities in a city,
creating jobs and building local economic power. Real state transactions or alliances are not included. The International Greenfield Investments are collected by “fDi Markets” data (KPMG & Greater Paris Investment Agency 2012).

BRICS POLICY CENTER – POLICY BRIEF
BRICS CITIES: Competitive global players
6
cities, these urban axes prove to be shaping the global economy bringing together key
players in the game of investments flows and competitiveness.
The following cross-border investment flows diagram shows the city-to-city
transactions between Chinese cities and their investors around the world. The linkages
represent the total of FDI inflows between the cities in different economic sectors. The
bolder the line, the stronger the investment flows between the cities. A large node
reveals how connected the city is with other actors in the network, therefore, how
‘attractive’ the city is for investments.
Overview of FDI flows into China from 2003 to 2011
Source: adapted from Zhang, Z (2012, p.30), extracted from fDi markets.
China is gaining leadership in the worldwide economy and international investments
networks through the development of the country’s urban vector, Shanghai, Hong Kong
and Beijing. These three major cities have been heavily invested by New York, London,
Paris, Tokyo, Hong Kong, Singapore and Zurich.
Shanghai is the leading national industrial and financial center, attracting FDI
mainly in the financial and ICT sectors, generating more than 720 thousand jobs in this
field since 2003. It is also the city with the largest node, therefore, the most connected
city in the Chinese network of investments. Shanghai’s extremely attractive territory for
investments and high connectivity are the response of the national government efforts

BRICS POLICY CENTER – POLICY BRIEF
BRICS CITIES: Competitive global players
7
in urban infrastructure improvements, mobility and sanitation (Bocayuva & Júnior
2011). Together with Beijing, Shanghai attracted 35.74% of FDI into China since 2012
(fDi Intelligence 2013). Beijing, also a center of power, accounts for a FDI capital
investment of more than USD 102752 million up to 2011, mainly in financial services.
Hong Kong, the third global city with the highest volume of greenfield
investments projects, plays a critical role in the geopolitics of the country. The city
showed a rather modest node when compared to highly connected Shanghai; however,
the domestic investments between Hong Kong and Chinese cities reveal the power of
the city in the investment network. Hong Kong invested more than USD 22821 million
the ICT, financial, construction, retail and business sectors in Beijing and Shanghai
from 2003 to 2011 (Zhang 2012).
Although positioned outside the orbit of the Chinese urban investment network
and not as connected as the three national stars, the cities of Quanzhou, Zhanjiang,
Huizhou, Dalian and Ordos may still be considered competitive enough for FDI inflows
and also prominent to rapid ascension in the investment network.
Moving southwest, the Brazilian investment network also reveals key players
through the spatial concentration of investments. Sao Paulo and Rio de Janeiro hold an
undisputed leadership in Brazil FDI share and whereas Sao Paulo is the leader in the
ICT & Electronics investments, Rio de Janeiro takes the front in Energy and Physical
Sciences. Sao Paulo accounted for almost 25% of projects into the country between
2003 to 2012 (fDi Intelligence, 2013), with an estimated capital investment of more than
USD 77678 million up to 2011. The city’s most attractive economic sectors for FDI
were ICT (40%), physical sciences (13%) and environmental technology (11%).
Rio de Janeiro is also a preferred FDI target due to urban renewal projects,
recent discoveries in oil and gas and also the upcoming mega events in the city (Ernst
& Young 2012; Bocayuva & Júnior 2011). Since 2003, Rio de Janeiro accounted for an
estimated capital investment of USD 50000 million, where 34.83% were destined to the
Energy sector. Investments in oil and gas in Rio de Janeiro are forecast to reach USD
188 billion (62% of the total expected amount) in the next years (Rio Negócios 2011).
The city also leads the investments in Retail Trade, Industrial and Physical Sciences
compared to Sao Paulo.
BRICS POLICY CENTER – POLICY BRIEF
BRICS CITIES: Competitive global players
8
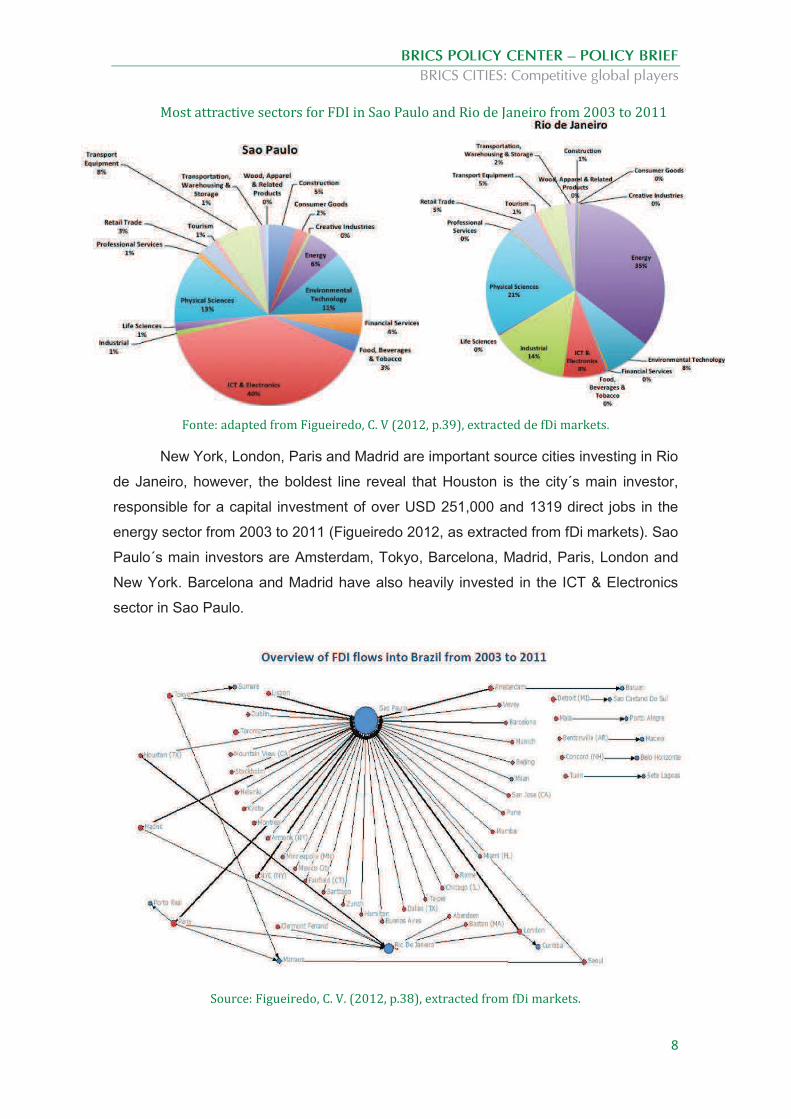
Most attractive sectors for FDI in Sao Paulo and Rio de Janeiro from 2003 to 2011
Fonte: adapted from Figueiredo, C. V (2012, p.39), extracted de fDi markets.
New York, London, Paris and Madrid are important source cities investing in Rio
de Janeiro, however, the boldest line reveal that Houston is the city´s main investor,
responsible for a capital investment of over USD 251,000 and 1319 direct jobs in the
energy sector from 2003 to 2011 (Figueiredo 2012, as extracted from fDi markets). Sao
Paulo´s main investors are Amsterdam, Tokyo, Barcelona, Madrid, Paris, London and
New York. Barcelona and Madrid have also heavily invested in the ICT & Electronics
sector in Sao Paulo.
Source: Figueiredo, C. V. (2012, p.38), extracted from fDi markets.

BRICS POLICY CENTER – POLICY BRIEF
BRICS CITIES: Competitive global players
9
Sao Caetano do Sul, Porto Alegre, Maceio, Belo Horizonte and Sete Lagoas
stand outside the Brazilian traditional business regions and FDI hubs. It is interesting,
however, how these cities are listed as the country’s most competitive cities and
prominent emerging markets (Brookings 2013), proving their rapid ascension in the
arena of investment flows.
Although Brasilia, has not appeared in this city-to-city investment flows diagram,
the capital city plays a critical geopolitical role in the country as the focal point for the
Federal Government, and together with Rio de Janeiro and Sao Paulo form the
“politico-economic heavyweight axis next to now-established China” (Sassen 2012, p.
8).
It is clear from the evidences presented that Beijing - Hong Kong - Shanghai
and Sao Paulo - Rio de Janeiro - Brasília reveal how BRICS national governments
have been using urban vectors as a strategy to stimulate foreign investment attraction
to the countries and cities. This also shows how these global cities are configured as
the loci of commerce, geopolitics and international relations between nations. While
these cities stand as national stars, others (particularly middle sized cities) are thriving
to become more connected to the archipelago of investment flows.
BRICS Cities Competitiveness
Measuring city competitiveness is an attempt to estimate a city’s relative
economic strength and potential compared to others in the urban system. Location
factors are indicators that explain why some companies prefer to invest and settle in
some cities rather than others. Cities are constantly trying to improve these location
factors in order to achieve a better competitive position, once it is the city’s task to
create a favourable environment capable of attracting not only investments but also
business and human capital and, therefore, become more successful in the network
(Sassen 2002). In other words, ‘investment will flow to – and exports will flow from –
those cities that provide better educated and higher skilled workers, globally linked
infrastructures, and flexible and responsible public and private organizations’
(Rondinelli et al. 1998, p.73).
According to the latest city competitiveness report from the Economist
Intelligence Unit (2012), a total of 29 BRICS cities are listed amongst the 120 most
competitive cities in the world according to their scores in 8 location factors: economic

BRICS POLICY CENTER – POLICY BRIEF
BRICS CITIES: Competitive global players
10
strength, financial maturity, social and cultural character, environmental and natural
hazards, physical capital, institutional effectiveness, human capital and global appeal.
Brazil has seen rapid improvements in infrastructure and reduction in corruption
vis-a-vis other BRICS, placing Sao Paulo (62nd), Rio de Janeiro (76th), Belo Horizonte
(98th) and Porto Alegre (102nd) amongst the 120 most competitive cities for doing
business. Sao Paulo scored higher than the others in economic strength, physical and
human capital, and global appeal. Porto Alegre leads amongst the Brazilian cities in
institutional effectiveness while Belo Horizonte takes the front in environmental and
natural hazards. Together with Hong Kong, Rio de Janeiro and Sao Paulo presented
the highest scores in social and cultural character amongst the 29 BRICS cities,
however Rio de Janeiro, Belo Horizonte and Porto Alegre stand at bottom three
amongst BRICS cities in terms of human capital.
Some experts and recent studies point out that one of the reasons why Rio de
Janeiro and Sao Paulo are so attractive for investments is because of the cities’
momentum of intense strategies in city marketing and international relations. These
aspects have been heavily invested in international policy circles, roadshows and fora
due to the upcoming mega sporting events, especially by Rio de Janeiro that will host
high-profile global events over the next four years, standing as a promising source of
investment opportunities and a key city for the country’s aspirations of becoming a
more relevant actor in the international arena (Ernst & Young 2012; Bocayuva & Júnior
2011).

BRICS POLICY CENTER – POLICY BRIEF
BRICS CITIES: Competitive global players
11
Source: Hot spots: Benchmarking global city competitiveness 2012 (The Economist Intelligence
Unit 2012)
Russia is represented by Moscow at 58th and Saint Petersburg at 100th.
Moscow outstands in financial maturity and global appeal, however, as Saint
Petersburg, must improve government effectiveness and regulatory bodies. India saw
Delhi and Mumbai at 68th and 70th and Ahmedabad, Pune, Hyderabad, Chennai and
Kolkata at lower positions. Indian cities’ economic indicators still lag behind those of
BRICS cities, especially Chinese cities. Bangalore and Pune take the front in
environmental and natural hazards amongst BRICS cities.
Not surprisingly, China was represented by 11 cities and the top 3 Chinese
cities with the greatest share of the global FDI are also the most competitive BRICS
cities in the ranking. Hong Kong ranked as the 4th most competitive city worldwide
scoring 100 in physical capital and financial maturity, while Beijing and Shanghai

BRICS POLICY CENTER – POLICY BRIEF
BRICS CITIES: Competitive global players
12
showed better economic strength arriving at 39th and 43rd, respectively. The ease of
doing business, investments in infrastructure and a growing middle class are likely to
continue pushing the Chinese urban vector and other cities towards a larger global
presence with special attention to Beijing due to the strengthening of its healthcare
system (A.T. Kearney 2012).
South Africa had Johannesburg (67th) and Durban (94th) representing the
country amongst the 120 most competitive cities, scoring impressive results in
institutional effectiveness when compared to other BRICS cities. Nevertheless, there
are a number of impediments and fragilities that avoid South African cities to respond
rapidly to the external pressures of global competitiveness, such as weak economic
development and financial maturity. Other competitiveness reports and recent research
have also indicated the compelling trend of how financial and business investments in
BRICS cities are pushing them to the top of the competitiveness rankings, rather than
other dimensions that make for a global city, such as education, health, quality of life,
culture and human capital. These vulnerabilities represent a drawback to BRICS cities
and should be addressed in order to reach a global protagonism.
Dribbling battles to win the game
This fact sheet has shown how Foreign Direct Investments (FDI) are driving
emerging market growth, however, much more will be needed to secure their
protagonism in the global network of investments and competitiveness. Despite the
socioeconomic peculiarities, BRICS cities share similar challenges towards achieving
social, economic and sustainable development. In order to bridge the gap between the
competitiveness status, economic flows and social burden, BRICS cities should extract
lessons from one another and focus on specific aspects.

BRICS POLICY CENTER – POLICY BRIEF
BRICS CITIES: Competitive global players
13
Location Factors for
Competitiveness
Indicators (The
Economist
Intelligence Unit
2012)
Successful
BRICS cities
(highest
scores)
Recommendations
Economic Strength
- City’s overall GDP; - Growth rate; - Size of middle class; - Relative income; - Regional market integration
Tianjin, Shenzhen, Dalian, Guangzhou
and Xangai
- Focus on cooperation and complementarity in the urban network of investment flows; - Focus on regional clusters/markets; - Incentives for intra-BRICS investments; - Fiscal Responsibility, etc. - Cities: Johannesburg, Rio de Janeiro, and Durban
Financial Maturity
- Breadth and depth of the financial cluster
Hong Kong, Shanghai,
Shenzhen, Beijing, Moscow
Social and Cultural Character
- Freedom of expression; - Human rights; - Openness and diversity; - Violence; - Culture
Hong Kong, São Paulo, Rio de
Janeiro
- Improvements in social security; - Incentive for cultural activities, entertainment and diversity, etc. - Cities: Chongqing, Qingdao, Hangzhou, and Tianjin
Envirolmental and natural
hazards
- Risk of natural disasters; - Environmental government
Bangalore, Chengdu and Pune
- Application of LID (Low Impact Development) strategies; - Improvement of green and ecological infrastructure; - Development of renewable energy; - Commitment to climate change policies; - Sustainable urban planning, etc.
Physical Capital
- Physical infrastructure; - Public transport; - Telecommunication transport
Hong Kong, Shanghai,
Shenzhen, Beijing, Moscow
- Incentives for PPP (Public Private Partnerships); - Urban strategies towards “smart growth”; - Innovative tools for financing urban infrastructure, etc. - Cities: Chennai, Bangalore, Pune
Institutional readiness
- Electoral process; - Local government fiscal autonomy; - Taxation; - Rule of law; - Government effectiveness
Hong Kong, Johannesburg,
Cape Town
- Less bureaucracy and lower costs to settle new business; - Stronger regulatory bodies; - Political and functional decentralization, etc. - Cities: Moscow and Saint Petersburg
Human Capital
- Population growth; - Education; - Healthcare;; - Working age population; - Hiring of foreign nationals; - Entrepreneurship
Hong Kong, Cape Town, Shenzhen
and Delhi
- Reducing immigration rates; - Strengthening public health care system and education; - Improvements in small-particle pollution reports, etc. - Cities: Rio de Janeiro, Belo Horizonte, and Porto Alegre
Global appeal
- Number of large corporations (Fortune 500); - Frequency of international flights; - International conferences and conventions; - Global leadership in higher education and think-thanks
Beijing, Hong Kong, Shanghai, Sao Paulo and
Moscow
- City marketing and branding strategies; - Collaboration across BRICS research institutions to support peer-learning; - Government incentives for the establishment of transnational corporations, etc. - Cities: Dalian and Pune' - Cities: Kolkata, Mumbai, and Tianjin
BRICS POLICY CENTER – POLICY BRIEF
BRICS CITIES: Competitive global players
14
Soft Aspects
The most pressing challenge for BRICS cities in the near future is whether they
can focus their development not only on infrastructure and skyscrapers, but also on
human capital. (A.T.Kearney 2012). Improvements in public healthcare, education and
quality of life will be crucial to BRICS cities´ ability to attract foreign capital and
tomorrow´s talent. Another challenge will be BRICS cities’ ability to grapple with the
pollution and violence that threaten the quality of life of their citizens, especially in
Moscow, Sao Paulo, Rio de Janeiro and Johannesburg.
Focus on regional clusters and complementarity
Cities do not have power in isolation and, therefore, need a well-structured local
and regional network in order to be more competitive in the global market, because a
region is more powerful than cities when attracting investments. Evidences show that
companies are looking at cluster of cities for market opportunities (McKinsey Global
Institute 2012), for example in China, India and Brazil where there are significant
regional market differences. Thus, instead of working only on a competitive edge,
BRICS cities should focus on building regional complementary and specialized
connections to other cities in order to consolidate a sustainable and attractive cluster
for investments.
For instance, the Brazilian urban vector Sao Paulo - Rio de Janeiro - Brasília
can work together on the basis of complementary services in the ICT and energy
sectors alongside the geopolitical approach. Due to recent oil discoveries offshore the
Brazilian Southeast coast, in the next 20 years Rio de Janeiro and Sao Paulo will see
progressive investments in energy, oil & gas technology, infrastructure and related
sectors. Therefore, both cities can work together towards attracting and clustering
‘green’ investments while supporting each other in specialized services. While Sao
Paulo takes the front in logistical support and financial services, clustering the
headquarters of transnational companies, Rio de Janeiro, with its natural and touristic
endowments, stands as the country´s high-tech pole in energy, innovation and
supportive infrastructure for the oil extraction activities (Rio Negócios 2011). Also, the
upcoming mega-sporting events happening in both cities are boosting opportunities for
complementary services in ICT and in the tourism & hospitality industry (Ernst & Young
2012). Despite the geographical distance, Brasilia plays a critical and heavy role on the

BRICS POLICY CENTER – POLICY BRIEF
BRICS CITIES: Competitive global players
15
geopolitical approach. The focal point for the Brazilian Federal Government holds the
country´s largest concentration of policy decision makers.
Therefore, the trend for complementary urban networks is a potential alternative
for BRICS fragmented territories, once cooperation between cities may decrease
regional disparities and the islands of prosperities across the countries. Moreover, by
competing for specific investments and providing complementary and specialized
services, middle sized cities that are lagging behind the orbit of FDI flows may have the
opportunity to capture the FDI spillover effects of main BRICS cities and increase their
competitiveness.
Institutional readiness and governance
BRICS cities, with special attention to Moscow, Bangalore, Kolkata, Mumbai,
New Delhi, Sao Paulo and Rio de Janeiro must provide a sound and fair legal and
administrative environment for business. Less bureaucracy, stronger institutions and
more effective regulatory environment for business are some improvements BRICS
cities should focus on. While in South Africa, China, India and Russia it takes up to 38
days to start a new business, in Brazil it takes approximately 119 days (Global
Competitiveness Report 2012/13). Also, the corruption increase, especially in South
African cities and New Delhi are challenges to be addressed in order to score better
results in competitiveness and, consequently, investments attraction.
Effective local governance and capacity building are at the core of any
successful global city that sets political, social and economic development as a priority
of their policy agenda.
Fiscal responsibility and sustainability
BRICS cities should manage growth in a way that builds the basis of a
sustainable economic performance. In 2012, cities in developing worlds contributed to
24% of the global economic growth according to the Global Metro Monitor (Brookings
2012), however, high absorptive capacity as the ability to internalize and maximize the
positive spillover effects of investments and effective fiscal responsibility play a
fundamental role for any economically sustainable municipality. The ability of a
municipality to raise funds, capture the value and returns of foreign investments and
BRICS POLICY CENTER – POLICY BRIEF
BRICS CITIES: Competitive global players
16
still provide effective solutions for local deficiencies are key strategies of a city that
holds a sustainable investment portfolio.
BRICS-to-BRICS
In order to strengthen BRICS cities protagonism in the international arena of
investments and attractiveness, BRICS cities should also work towards establishing
mechanisms of cooperation and cohesive integration as already appointed by the
BRICS Action Plan at Sanya Declaration (2011).
Comparative analysis of BRICS cities investment portfolios, legislation and
regulatory marks should also give more insights of their peculiarities and similarities,
pointing out the possibilities of intra-BRICS cooperation towards a larger global
presence. Furthermore, as stated by Sanya Declaration (2011), collaboration not only
in international trade and commerce, but also in research and peer learning through a
BRICS network of research institutions can also enhance the cities weight and global
appeal at a worldwide scale.
Bibliography
Alderson, A. S. & Beckfield, J. 2004. ‘Power and Position in the World City System’, AJS, vol. 109, no.
4, pp. 811-851.
A.T.Kearney, Inc 2012. Global Cities Index and Emerging Cities Outlook. Accessed:
http://www.atkearney.com/documents/10192/dfedfc4c-8a62-4162-90e5-2a3f14f0da3a
Bocayuva, P. C. C. & Veloso dos Santos, S. 2011. ‘Cidades-BRICS e o fenômeno urbano global’, Carta
Internacional, vol. 6, no. 2, pp. 55-75.
Brookings Institution. 2012. Global Metro Monitor 2012. Slowdown, recovery and interdependence.
Accessed:
http://www.brookings.edu/~/media/research/files/reports/2012/11/30%20global%20metro%
20monitor/30%20global%20monitor.pdf
Burger, M. J., van der Knaap, G.A. & Wall, R.S. 2011. ‘Revealed Competition for Greenfield
Investments between European Regions', Journal of Economic Geography, Oxford University Press.

BRICS POLICY CENTER – POLICY BRIEF
BRICS CITIES: Competitive global players
17
Ernst & Young. 2012. Capturing the momentum. Ernst & Young´s 2012 attractiveness survey, Brazil.
Accessed:
http://www.ey.com/Publication/vwLUAssets/Capturing_the_momentum_Brazil/$FILE/Capturing_
the_momentum_Brazil.pdf
fDi Intelligence. 2013. The fDi Report 2013. Global Greenfield Investment Trends. Accessed:
http://www.fdiintelligence.com/Custom/Special-Reports/fDi-Report-2013/Executive-
Summary#microsite
Figueiredo, C. V. 2012. Sao Paulo beyond borders: An investigation of the city´s competitiveness and
complementarity in Latin America. Master Thesis, Institute for Housing and Urban Development
Studies, Erasmus University of Rotterdam, Rotterdam.
Friedmann, J. 1986. World City Hypothesis. Development and Change, vol. 17, pp. 69-83, London,
Beverly Hills and New Delhi, SAGE.
Horne, J. 2010. Building BRICs by Building Stadiums: Preliminary Reflections on Recent and Future
Sports Mega-Events in Four Emerging Economies. Accessed:
http://www.bl.uk/sportandsociety/exploresocsci/sportsoc/mega/buildingbricks.pdf
KPMG & Greater Paris Investment Agency. 2012. Global Cities Investment Monitor 2012. New
rankings, trends and criteria. Accessed:
http://www.kpmg.com/FR/fr/IssuesAndInsights/News/Documents/GPIA-KPMG-CIM-2012.pdf
Malecki, E. J. 2004, ‘Jockeying for Position: What It Means and Why It Matters to Regional
Development Policy When Places Compete’, Regional Studies, vol. 38.9, pp. 1101–1120.
McKinsey Global Institute. 2012. Urban world: mapping the economic power of cities. Accessed:
http://www.mckinsey.com/insights/urbanization/urban_world
Rio Negócios. 2011. Annual Report Rio Negócios 2010-2011. Accessed: http://rio-
negocios.com/en/uploads/2011/05/Relatorio-Anual-Rio-Negocios.pdf
Rondinelli, D. et al. 1998. ‘The Changing Forces of Urban Economic Development: Globalization and
City Competitiveness in the 21st Century’, Cityscape: A Journal of Policy Development and
Research, vol. 3, no 3, pp. 71-105.
Sanya Declaration. 2011. Accessed: http://www.itamaraty.gov.br/temas-mais-informacoes/saiba-
mais-bric/documentos-emitidos-pelos-chefes-de-estado-e-de-governo-pelos-chanceleres/iii-brics-
summit-sanya-declaration
Sassen, S. 2002. ‘Locating Cities on Global Circuits’. Globalization and Cities, Environment and
Urbanization, vol. 14, no 1, pp. 13-30.
BRICS POLICY CENTER – POLICY BRIEF
BRICS CITIES: Competitive global players
18
Sassen, S. 2012. ‘Beyond State-to-State Geopolitics: Urban Vectors Dominate’. In: A.T.Kearney, Inc.
2012. Global Cities Index and Emerging Cities Outlook. Accessed:
http://www.atkearney.com/documents/10192/dfedfc4c-8a62-4162-90e5-2a3f14f0da3a
The Economist Intelligence Unit. 2012. Hot spots: Benchmarking global city competitiveness 2012.
Accessed:
Wall, R. S. 2009. Netscape: cities and global corporate networks. ERIM and Haveka Publishers.
World Economic Forum. 2012. The Global Competitiveness Report 2012-2013. Accessed:
http://www3.weforum.org/docs/WEF_GlobalCompetitivenessReport_2012-13.pdf
Zhang, Z. 2012. The story behind the Hu-Line: FDI and City Competitiveness Analysis of Coastal and
Inland Chinese Major Cities. Master Thesis, Institute for Housing and Urban Development Studies,
Erasmus University of Rotterdam, Rotterdam.