Authenthic Learning & Collaboration with Web 2.0 Technologies
Upload
nguyendienCategory
view
225download
0
Policy Analysis 2.0 – Structured Collaboration Using Projected Outcome Matrices from the Eightfold Path
By Zev Winkelman
A dissertation submitted in partial satisfaction of the
requirements for the degree of
Doctor of Philosophy
in
Public Policy
in the
Graduate Division
of the
University of California, Berkeley
Committee in charge:
Professor Michael Nacht, Chair Professor Eugene Smolensky
Professor Steve Weber
Spring 2012
1
Abstract
Policy Analysis 2.0 – Structured Collaboration Using Projected Outcome Matrices from the Eightfold Path
by
Zev Winkelman
Doctor of Philosophy in Public Policy
University of California, Berkeley
Professor Michael Nacht, Chair
The Eightfold Path is a methodology for policy analysis taught at the Goldman School of Public Policy, at the University of California, Berkeley. At the center of this methodology is a matrix in which each cell represents the projected outcome of the policy alternative corresponding to the cell’s row, as measured by the criterion corresponding to the cell’s column. Policy analysts use this methodology to explore complex policy problems, consider the tradeoffs between different alternatives, and orient decision makers as to the choices they face. A similar methodology has been developed for the analysis of competing hypotheses (ACH) regarding intelligence assessments of streams of evidence. The ACH method, also based on a matrix, represents evidence, hypotheses, and analyst’s assessments of the consistency of a particular piece of evidence with a given hypothesis. The ACH methodology has been implemented as open source software that enables collaboration between intelligence analysts and contributes to more robust analysis. This dissertation starts with the open source implementation of ACH, and adapts it to fit the Eightfold Path methodology. Debates from a 2009 Congressional hearing on sunsetting provisions from the USA PATRIOT Act are then used as a case study to demonstrate that benefits from the ACH system can also be captured by policy analysts using the Eightfold Path.

i
For both of my grandfathers, whom I never met,
both of my grandmothers, who spoiled me with their affection,
and my parents, without whom none of this would have been possible.
Thank you.
ii
Table of Contents Abstract ........................................................................................................................................... 1 I. Introduction ................................................................................................................................. 1
Motivation ................................................................................................................................... 2
Case Study ............................................................................................................................... 2
Methodology ............................................................................................................................ 3
Findings ....................................................................................................................................... 5
Outline ......................................................................................................................................... 5
II. Language Models ....................................................................................................................... 6 Manual Coding ............................................................................................................................ 6
Inter coder Reliability.................................................................................................................. 7
Automation .................................................................................................................................. 7
III. Visualizations ............................................................................................................................ 8 Reference Design ........................................................................................................................ 9
Coverage Analysis....................................................................................................................... 9
Revised Design .......................................................................................................................... 11
IV. Application ............................................................................................................................. 19 Process ....................................................................................................................................... 19
The Eightfold Path Ontology ................................................................................................. 19
Individual Matrices ................................................................................................................... 21
Policy Matrix: Kris Testimony .............................................................................................. 21
Policy Matrix: Spaulding Testimony ..................................................................................... 30
Policy Matrix: Wainstein Testimony ..................................................................................... 34
Policy Matrix: Graves Testimony .......................................................................................... 38
Policy Matrix: Fine Testimony .............................................................................................. 42
Group Matrix ............................................................................................................................. 46
Linking Alternatives and Criteria ....................................................................................... 46
The Group View ........................................................................................................................ 50
V. Conclusions .............................................................................................................................. 51 Meeting Design Objectives ....................................................................................................... 51
Content ...................................................................................................................................... 58
Enumerating Issues of Disagreement .................................................................................... 58
iii
Exploring Disagreements ...................................................................................................... 59
Analyst Clustering ................................................................................................................. 63
Applications .............................................................................................................................. 63
Decision Maker Support ........................................................................................................ 63
Auditing Policy Analysis ....................................................................................................... 64
Engaging Public Debate ........................................................................................................ 66
Bibliography ................................................................................................................................. 67
Index of Figures Figure 1: Reference Design .......................................................................................................... 10 Figure 2: ACH Personal View ...................................................................................................... 14 Figure 3: ACH Group View .......................................................................................................... 15 Figure 4: Revised Design Showing Cell Density ......................................................................... 16 Figure 5: Revised Design Showing Aggregate Density for Alternatives and Criteria ................. 17 Figure 6: Revised Design Showing Density at Analyst Level - Smith ......................................... 18 Figure 7: Revised Design Showing Density at Analyst Level - Jones ......................................... 18 Figure 8: Revised Design Showing Density at Analyst Level - Baker ......................................... 18 Figure 9: Kris Matrix - Full .......................................................................................................... 24 Figure 10: Kris Matrix - Zoom ..................................................................................................... 25 Figure 11: Kris Matrix - Zoom on Support ................................................................................... 26 Figure 12: Kris Matrix - Zoom on Criticism ................................................................................ 27 Figure 13: Projected Outcome Detail ........................................................................................... 28 Figure 14: Kris Matrix - Summary ............................................................................................... 29 Figure 15: Spaulding Matrix - Summary ...................................................................................... 31 Figure 16: Spaulding Matrix - Zoom on Support ......................................................................... 32 Figure 17: Spaulding Matrix - Zoom on Criticism ....................................................................... 33 Figure 18: Wainstein Matrix - Summary ...................................................................................... 35 Figure 19: Wainstein Matrix - Zoom on Support ......................................................................... 36 Figure 20: Wainstein - Zoom on Criticism ................................................................................... 37 Figure 21: Graves Matrix - Summary ........................................................................................... 39 Figure 22: Graves Matrix - Zoom on Support .............................................................................. 40 Figure 23: Graves Matrix - Zoom on Criticism ............................................................................ 41 `Figure 24: Fine Matrix - Summary .............................................................................................. 43 Figure 25: Fine Matrix - Zoom on Criticism ................................................................................ 44 Figure 26: Fine Matrix - Zoom on Support .................................................................................. 45 Figure 27: Simple Linking of Alternatives ................................................................................... 47 Figure 28: Complex Linking of Alternatives ................................................................................ 48 Figure 29: Linking Criteria ........................................................................................................... 49
iv
Figure 30: Group View Matrix - Summary .................................................................................. 52 Figure 31: Group View Matrix - Zoom on Criticism ................................................................... 53 Figure 32: Disagreement Cell Detail - Extreme Dispute - Criticism ............................................ 54 Figure 33: Group View Matrix - Zoom on Support ...................................................................... 55 Figure 34: Disagreement Cell Detail - Extreme Dispute - Support .............................................. 56 Figure 35: Disagreement By Omission Not Dispute .................................................................... 65
Index of Tables Table 1: Eightfold Path Ontology ................................................................................................. 20 Table 2: Group Disagreement on the Ratings of Projected Outcomes ......................................... 59
v
Acknowledgements
There are many people to whom I am tremendously thankful for the unwavering support they have given me during the course of this journey. Thanks to my advisor, Michael Nacht, who has been exactly the kind of mentor I had hoped to have showing me the way. You have provided both the breadth and the depth I was in search of in a manner which I don’t think anyone else could, and I am eternally grateful. Thanks to Eugene Smolensky for the guidance he has provided, and continues to provide to me and to all of the PhD students at the Goldman School of Public Policy (GSPP). Your tireless patience, attention, and efforts to help each of us to be our best are recognized by all. Also thanks to Steve Weber for taking me under his wing as I endeavored to learn the art of Political Science. The countless insights you have provided have driven me to hone my own abilities to think critically in search of the same.
I would also like to thank Sean Farhang for helping to set me on a sure course with his invaluable questions and feedback during my qualifying examination, and to Stephanie Weber and Elizabeth Tedsen for helping me to prepare for the ordeal. Harold Smith, I did not know that I would have the benefit of your wisdom and experience when I applied to Berkeley, but I consider myself extremely fortunate that you were here. Your active involvement with the broad community of researchers on campus has had significant impact on my own personal development, as well as that of many others. Robert Reich, thank you for the opportunity to be a part of your courses on leadership, and wealth and poverty. Working with you was an important part of my transition to Berkeley, and I am thankful for the exposure to a new set of perspectives from your course material and the students. Eugene Bardach, without the “Eightfold Path” you set out, there is no telling how long I would have had to wander in search of the structure I needed to complete this research. Your contribution to the study of policy analysis has left an indelible mark on me and countless other practitioners in the field. John Ellwood, the indispensable simulation exercises you chaired gave me a more complete and well rounded understanding of the inner workings of government, and I can only say that I hope I never actually have to get a budget resolution passed. Thank you for the care you have given to the PhD program in general, and to your advice and feedback throughout the years to me specifically.
I would be remiss not to thank all of the peers I have had the chance to work with at GSPP for their enduring friendship, and to specifically name at least two. Kimberly Jackson, it was clear that we shared the same interests from day one. Your personal experience and passion for what you do kept me constantly on my toes – in a good way. Sarah Tahamont, thanks for sharing your ideas with me, and giving me your feedback on my own ideas. It is true that some of mine were, shall we say, ‘unrealistic’, but I hope you don’t mind if go ahead and try a few of them anyhow. Finally, I would like to thank my parents, who, together with Samuel Graff, my master’s degree advisor at the John Jay College of Criminal Justice, thought it would be a good idea for me to finally get serious and pursue a PhD. You were all right.
1
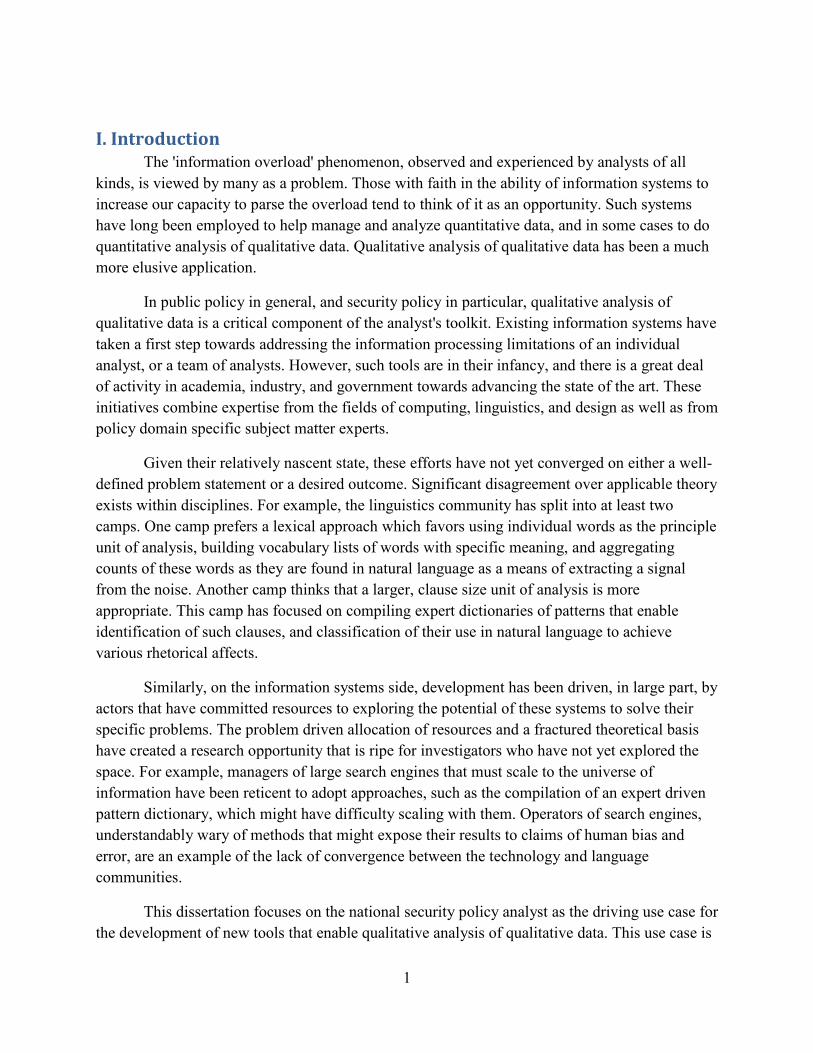
I. Introduction The 'information overload' phenomenon, observed and experienced by analysts of all
kinds, is viewed by many as a problem. Those with faith in the ability of information systems to increase our capacity to parse the overload tend to think of it as an opportunity. Such systems have long been employed to help manage and analyze quantitative data, and in some cases to do quantitative analysis of qualitative data. Qualitative analysis of qualitative data has been a much more elusive application.
In public policy in general, and security policy in particular, qualitative analysis of qualitative data is a critical component of the analyst's toolkit. Existing information systems have taken a first step towards addressing the information processing limitations of an individual analyst, or a team of analysts. However, such tools are in their infancy, and there is a great deal of activity in academia, industry, and government towards advancing the state of the art. These initiatives combine expertise from the fields of computing, linguistics, and design as well as from policy domain specific subject matter experts.
Given their relatively nascent state, these efforts have not yet converged on either a well-defined problem statement or a desired outcome. Significant disagreement over applicable theory exists within disciplines. For example, the linguistics community has split into at least two camps. One camp prefers a lexical approach which favors using individual words as the principle unit of analysis, building vocabulary lists of words with specific meaning, and aggregating counts of these words as they are found in natural language as a means of extracting a signal from the noise. Another camp thinks that a larger, clause size unit of analysis is more appropriate. This camp has focused on compiling expert dictionaries of patterns that enable identification of such clauses, and classification of their use in natural language to achieve various rhetorical affects.
Similarly, on the information systems side, development has been driven, in large part, by actors that have committed resources to exploring the potential of these systems to solve their specific problems. The problem driven allocation of resources and a fractured theoretical basis have created a research opportunity that is ripe for investigators who have not yet explored the space. For example, managers of large search engines that must scale to the universe of information have been reticent to adopt approaches, such as the compilation of an expert driven pattern dictionary, which might have difficulty scaling with them. Operators of search engines, understandably wary of methods that might expose their results to claims of human bias and error, are an example of the lack of convergence between the technology and language communities.
This dissertation focuses on the national security policy analyst as the driving use case for the development of new tools that enable qualitative analysis of qualitative data. This use case is
2
not the same as a search engine, nor is it the same as a private company that wants to mine social media for the expression of sentiment regarding its products or services. Therefore, the approaches explored here are not subject to the same constraints regarding language models or generalizability.
Augmenting human capacity to process information in a meaningful way is one of the most interesting challenges of our time. The applicability of techniques that accomplish this goal extends far beyond the present focus on national security policy. Nevertheless, this domain is filled with examples of the complexity of the problems that need to be solved, and the diversity of approaches that will need to be harnessed. A combined approach of information processing and visualization will guide policy analysts toward methods that remain cognitively accessible both to those who employ them in the process of analysis, and to those who wish to understand the results and how they were reached. In today's hyper connected world, developing the capability to engage more minds and leverage greater participation in problem solving is critical to making sure that we do not remain in the unstable state of being increasingly overloaded by a supply of information that exceeds our processing capability.
Motivation This research uses the debate surrounding USA PATRIOT Act and Foreign Intelligence
Surveillance Act (FISA) law as a substantive case study to motivate the exploration of a new methodology for policy analysis. The case study was chosen because it is an example of a challenging and dynamic policy problem that cannot be solved with simple approaches. The methodology combines the structured analytic techniques of ontology population and analysis of competing hypotheses (ACH)1, with a conceptual model for policy analysis called “The Eightfold Path” (TEP)2. By extracting, transforming and loading the data from the case study into an information system derived from an open source implementation of ACH, this research examines the applicability of the baseline features of the ACH methodology, discovers new capabilities that result from the integration with the other structured analytic approaches and conceptual models, and suggests concrete applications for the new portfolio of policy analysis capabilities.
Case Study The balance of civil liberties and security involve issues that provide generally
convincing choices for the case study. Constitutional rights, and the debate over how they should be interpreted, have a huge effect on the everyday lives of all Americans. It is, therefore, not surprising that when conflicting views do arise they can all be both vigorously and rationally defended.
1 (Heuer, 1999) 2 (Bardach, 2005)
3
Case studies in this category have the following three advantages:
• Constitutional rights are intimately involved with the fabric of American society. • American society has been incredibly dynamic regarding the diversity of political views. • Addressing Constitutional rights involves returning to the founding of the United States.
These advantages yield important benefits. The diversity of political views on fundamental issues ensures that a broad base of relevant stakeholders will be included in the analysis. Similarly, tracking how a complex policy issue has been treated since the drafting of the Constitution ensures that observations will be made as to how the debates have evolved during changing circumstances in American society.
Analysis of Fourth Amendment protections against unreasonable search and seizure involves both the breadth of stakeholders, and the historical depth desired for this case study. After September 11, 2001, these protections were particularly challenged by arguments for greater powers of surveillance by the government in order to prevent future attacks and by the subsequent passage of the USA PATRIOT Act on October 25, 2001 which modified FISA surveillance procedures and gave law enforcement officials many new tools intended to detect and prevent terrorism. This case study is made even more relevant for contemporary analysis by virtue of the fact that it included several sunsetting provisions, three of which were due to expire at the end of 2009. Sunsetting provisions have expiration dates built in to reflect that the original intention was to force further consideration before the authorities are either made permanent, allowed to expire, or temporarily extended. Though Congress has repeatedly extended these sunset expirations, hearing transcripts from the debates held each time the deadlines draw near provide ample material for analysis of the competing problem definitions and arguments that have been presented. These debates are a perfect example of one type of qualitative information overload that can be mitigated through the augmentation of the information processing capabilities of the analyst. The case study developed for this research was based on the Senate Committee on the Judiciary hearing on “Reauthorizing the USA PATRIOT Act: Ensuring Liberty and Security”, chaired by Senator Patrick Leahy on September 23, 2009.3
Methodology Visualization is an important area of focus for tools that augment our ability to process
information due to the power it has to leverage human cognitive abilities and increase the amount of information one can absorb. Visualization, however, implicitly requires an underlying information model to which visual encodings and interactions are mapped.
The two types of information models or ontologies explored in the course of this research were argument models such as Toulmin's evidence based argumentation4, and TEP for policy analysis. These models offer structured representations of qualitative data, and instances of 3 (111th Congress, 2009) 4 (Toulmin, 2003)

4
various elements from their corresponding schemas are scattered throughout the text found in the case study materials. Because these instances are expressed in natural language, their extraction is difficult to automate. When human analysts perform this task, a degree of subjectivity is inevitably introduced, and the overall analysis is subject to the constraints of the information processing capabilities of the single analyst or team of analysts. Though Toulmin's model for evidence based reasoning could have a place in the visualization of policy arguments, the development of such a capability was discarded at an early stage of this research. Evidence based reasoning is employed to support many types of arguments in policy debates, and, in some cases Toulmin diagrams could reveal inconsistencies, or hidden assumptions that would completely invalidate the consideration of a flawed alternative. Nevertheless, for challenging problems in the policy context, it is often the case that one must decide between alternatives that are internally consistent, and externally incommensurate. In such cases the primary challenge is to compare these complex tradeoffs, and the more domain specific model of project outcome matrices (POM) provided advantages by facilitating the rapid juxtaposition of the various possibilities.
Whether seeking to perform extraction using manual, automated or hybrid techniques, it is important to have a baseline measure of the reliability of the coding system employed. The 'gold standard' for many qualitative analysis tasks is how human analysts would manually code the material. By performing an inter coder reliability test, a baseline could be constructed measuring the extent to which independent coders using TEP as a schema would be consistent in their labeling of a common set of documents. The results of this test could be used for two purposes. The first is to investigate how robust the chosen coding scheme is. The second is to help automate further extraction. This extraction can be performed by hybrid methods such as the development of an expert based rule set for classification, or semi-automated methods such as the training of classifiers using machine learning algorithms. This confirmatory task represents a major project for future research.
Once instances of the ontology have been extracted, either manually, or with some degree of automation, the next challenge is to design visualizations and interactions which the analyst will use to explore the data. The criterion used for these designs is that they must improve the analyst's ability to perform certain tasks. This research begins with the inherent ACH task of discovering and exploring disagreements across a team of analysts and show that this benefit could extend to a team of policy analysts. The redesign of the policy outcome matrix is further motivated using the task of determining 'coverage' density across a team of analysts. Coverage density is defined to mean the percentage of the overall range of possible combinations of alternatives and criteria for which the analysts provides projected outcomes and ratings. In addition, coverage density is also defined to refer to the percentage of the source text that the analyst used as part of the population of the ontology. Finally, the application of the methodology to the case study material reveals several other important analysis tasks that are augmented. These tasks include analyst clustering, the objective enumeration of criteria and
5
alternatives, decision maker support, analysis process audit capabilities, and establishment of a common operating picture to motivate broad engagement with policy issues.
Like the use of TEP as a coding mechanism, measuring the actual improvement that the visualizations and interactions provide to analysts charged with the performance of these tasks, would require empirical validation. Testing these designs could be performed using a control group of analysts without access to the designs, and a test group that was given access, and comparing how well they performed the execution these tasks. This also constitutes a project for future research.
Findings The research for this dissertation has been a combination of substantive policy analysis
regarding a historical balance of security and civil liberties, and methodological exploration of ways to process the qualitative data attached to the associated debate. The 'findings' presented here are focused on the latter objective. Though specific insights regarding the debate surrounding the USA PATRIOT Act and FISA provisions are offered, the objective is not to suggest a view of the 'correct' answer to this complicated debate. Instead, the intent of the research was to explore how new methods and technology could help to organize and objectively process this qualitative data.
Asserting that the prototype system built here meets or comes close to meeting the design objectives initially set out is almost tautological. In a strict sense, the claims of even these successes require empirical external validation from other analysts trying to use this system and methodology under controlled research settings. Performance of this validation step, however, is beyond the scope of the current research.
What follows is an exploration of new ways of analyzing policy arguments and enabling collaboration across teams of analysts engaged with the same policy problems. The choice to avoid making claims as to who is right or who is wrong in this debate, or to identify the optimum course of action, was therefore consciously made, and in this sense the most important finding about endless policy debates is revealed: for complex policy issues where competing and sometimes irreconcilable values are involved, it may sometimes be the case that efforts to find an objectively optimal, justifiable, and acceptable solution could be beneficially expended towards organizing the information in a manner that more transparently represents focused, important, specific matters of disagreement that require dispassionate resolution, if possible.
Outline This dissertation describes three stages of research leading towards the prototype system
for collaborative policy analysis. The first stage was the development of a language model, based on TEP, as an ontology for manual coding of domain specific corpus. The second stage involved extracting manually coded instances of elements from the ontology, and loading them into the ACH-derived POM system. The third stage investigated the specific application of the method to
6
the case study materials. Finally, other specific applications for this system are suggested, including the exploration of disagreement and consensus in the corpus, decision making support, policy analysis auditing, and increasing public engagement.
II. Language Models The eight folds of TEP are used as a language model or schema for the elements of a
policy argument. The five documents from the PATRIOT Act hearing used for the case study were manually coded using this schema. The lack of automation of this step reflects one major bottleneck in the information overload problem, but it does suggest a way forward toward some degree of automation. The first step would be to establish a baseline of how robust the model is as a coding mechanism for human analysts. An inter coder reliability study could provide this baseline, as well as a dataset that would enable a second step towards automation. The second step would be to use machine learning algorithms or other natural language processing techniques in the development of classifiers that could determine whether a given sentence or piece of text corresponded to one of the classes from the language model with a known degree of precision. A third and slightly more challenging step would involve developing methods to extract the relationships between the instances in the model in order to populate a more complicated ontology. Though the successful implementation of these steps is beyond the scope of the present research, such an implementation could potentially mitigate the information overload problem faced by many policy analysts. By leveraging automated techniques to prepopulate a POM with policy alternatives, criteria, and projected outcomes extracted from the vast sources of unstructured data which the analyst would otherwise search manually, the time required to orient oneself to analyses that have already been performed could be drastically reduced, as could the likelihood that efforts would be unknowingly wasted in their duplication.
Manual Coding Manual coding required reading every sentence of the source documents and identifying
two features. The first feature was whether the sentence represented an instance of one of the steps of TEP. This subjective step requires the reader to interpret whether the author's intention was to express the definition of a problem, suggest evidence supporting an argument, put forth a policy alternative, project the subsequent outcomes, develop criteria by which to judge outcomes of the alternatives, examine the tradeoffs between the outcomes, make a decision, or tell a story. The second feature was the set of relationships to attach to the identified instance. Examples of the most common relationships include the following: an alternative or criterion to address a particular problem definition, the alternative and criterion for which an outcome is projected, evidence supporting the declaration of a problem definition, policy alternative, criterion, or projected outcome, and the decision regarding a particular alternative. Noticeably absent in the dataset for this case study were confrontations of the tradeoffs.
7
Though not empirically measured, an important side effect of processing documents in this way is the active reading component of these classification tasks. Casual reading would have allowed many sentences to be processed on a more shallow level, with some degree of the intended effect absorbed by the reader. Actively reading and coding the same sentences brings a constant awareness and questioning of how the text being read fits into the schema of the entire argument. On several occasions, sentences in the text required significant deliberation as to whether they represented an alternative or a criterion, for example, and initial classifications were also revisited and changed.
Another important side effect of the coding process is that one can make several definitive empirical statements regarding the number of instances and relationships extracted from the text, exactly where they were extracted from, and the overall coverage of the entire document. This trace back and auditing component could significantly increase the accountability and transparency for the subsequent policy analysis.
Inter coder Reliability The manual coding step does little to alleviate a major bottleneck in the policy analysis
process, but it does suggest a first step towards examining whether automated techniques could do some of this manually intensive work. In the present case study, only one analyst coded the source documents. An important criticism is that a second analyst, given the exact same materials and instructions, might code the document very differently and completely alter the resulting analysis. If such a result were to be observed, revisiting the methodology and specifying the instructions in greater detail might solve the problem. However, given the inherently subjective nature of some domains of discourse, politics being a prime example, better instructions may not solve the problem. Nevertheless, the important thing to learn, regardless of the outcome, is what the inter coder reliability is, given a particular schema. The focus of the present research was on the improvements to policy analysis that could be extracted from interactive visualizations such as those found in the ACH system, based on the assumption that TEP could be used as a robust coding schema. The choice to explore the benefits of this new methodology first, despite the presence of such a significant underlying assumption, was a conscious decision with the objective of subsequently motivating an inter coder reliability study that would validate the schema on which the desired benefits were based.
Automation Assuming that TEP performs reasonably well in the inter coder reliability step, an
immediate follow up study to search for patterns that machines can recognize could be performed using the data generated by the study. If such patterns existed, many natural language processing techniques could be leveraged to alleviate the information processing bottleneck. The search for such patterns could be bootstrapped by dividing the coded data into a training set and a test set. The pattern recognition algorithms would be trained using the 'known' human analyst classifications from the training set, and then run on the test set blinded to the original

8
classifications. A comparison of the performance of the algorithms classifications of the test set data, compared to the baseline of the original human analyst's classification of the same data, would provide a reasonable approximation of the precision and recall of the algorithms compared to the baseline.
When discussing the 'automation' of work that previously required the attention of human analysts, it is important to add the caveat that the automated version is unlikely to reflect the depth of reading of which humans are capable. Though there is some disagreement as to whether computers will ever be able to read and understand natural language as well as humans, progress towards this end is no longer merely the subject of science fiction. The performance of IBM’s machines against human competitors in complex games like chess and quiz shows like Jeopardy are only a harbinger of what is likely to follow. 5 For the time being, and for the purposes of this research, the goal is to augment, not replace a human analyst's ability to process the information by leveraging information processing technology to the greatest extent possible.
III. Visualizations The need for effective visualizations in the context of this research is motivated by three
important drivers. The first driver is to aid an analyst performing manual coding of policy arguments to manage the data they themselves have extracted. The second driver hypothesizes the challenges that will be faced when an analyst is leveraging automated techniques to extract policy arguments from text and examining the output. A slight variation of this second driver includes the process of communicating the information that is extracted to those not involved in the extraction process itself, whether performed in an automated or entirely manual process. The third driver is to enable a team of analysts to collaborate in a structured manner on the examination of a particular policy issue.
In addition to forming the basis of the coding schema for the case study documents, TEP also provides a reference design for the visualization of a policy argument. This reference design is a POM and it serves as the baseline for subsequent design revisions to address the three motivating drivers.
The choice of a matrix as the central component for visualization of policy arguments allows previous work in the field of structured analytical techniques for intelligence analysis to be applied. The ACH methodology is of particular relevance given its focus on the use of a matrix as a visualization. Furthermore, ACH was built to enable collaboration across a team of analysts and therefore is a good fit for the drivers motivating the present case study. Finally, an open source version of software implementing ACH was released by its creators. 6 The visualizations for the present case study were implemented using the ACH software as a starting point, and modifying it for application to policy arguments instead of intelligence analysis. 5 (Kurzweil, 2011) 6 (Burton, The Open Source Analysis of Competing Hypotheses Project, 2010)
9
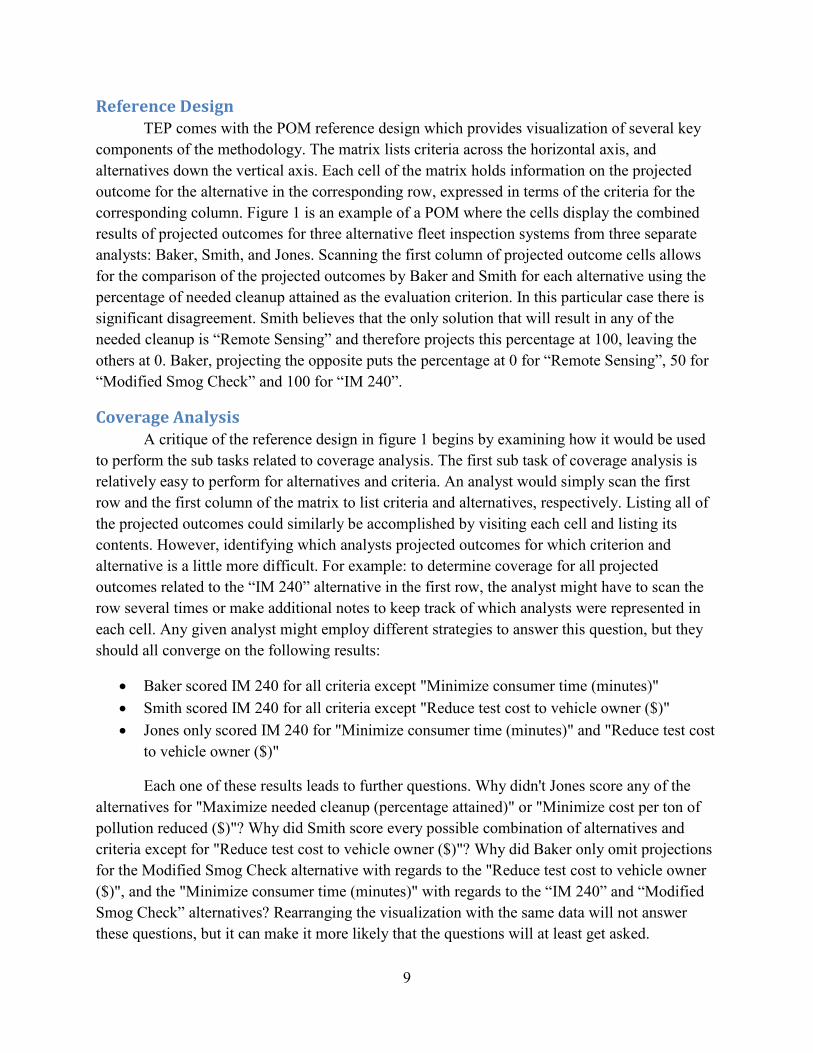
Reference Design TEP comes with the POM reference design which provides visualization of several key
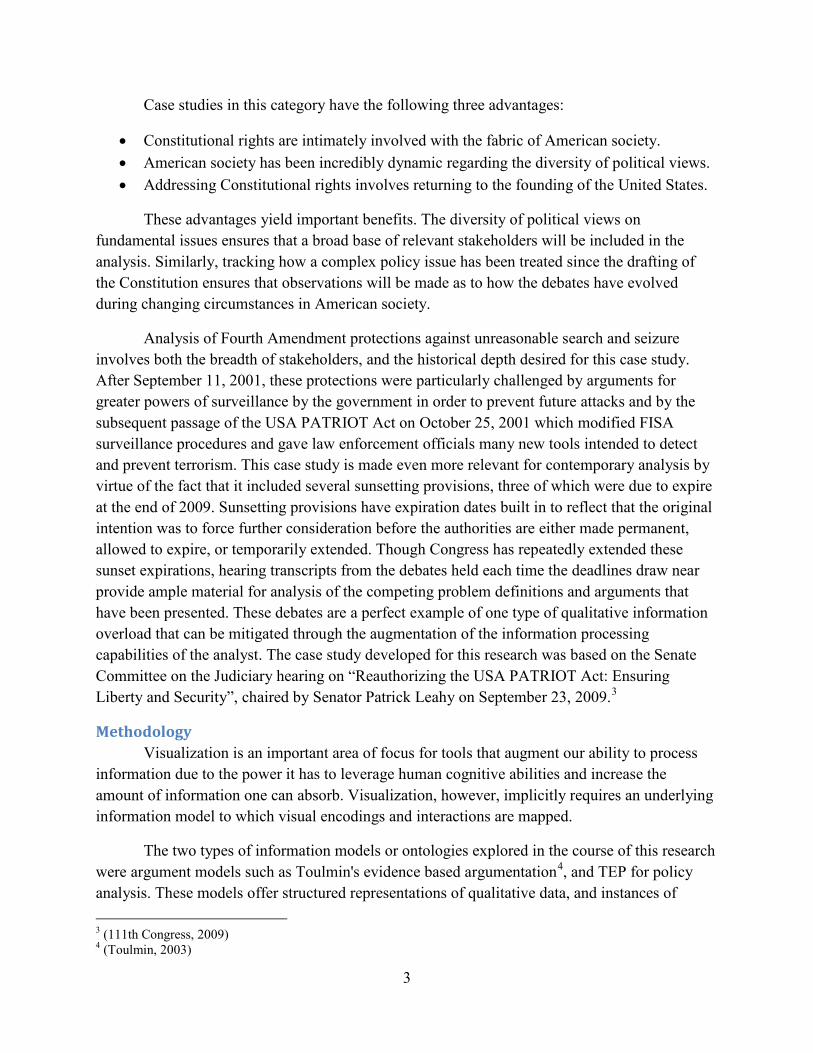
components of the methodology. The matrix lists criteria across the horizontal axis, and alternatives down the vertical axis. Each cell of the matrix holds information on the projected outcome for the alternative in the corresponding row, expressed in terms of the criteria for the corresponding column. Figure 1 is an example of a POM where the cells display the combined results of projected outcomes for three alternative fleet inspection systems from three separate analysts: Baker, Smith, and Jones. Scanning the first column of projected outcome cells allows for the comparison of the projected outcomes by Baker and Smith for each alternative using the percentage of needed cleanup attained as the evaluation criterion. In this particular case there is significant disagreement. Smith believes that the only solution that will result in any of the needed cleanup is “Remote Sensing” and therefore projects this percentage at 100, leaving the others at 0. Baker, projecting the opposite puts the percentage at 0 for “Remote Sensing”, 50 for “Modified Smog Check” and 100 for “IM 240”.
Coverage Analysis A critique of the reference design in figure 1 begins by examining how it would be used
to perform the sub tasks related to coverage analysis. The first sub task of coverage analysis is relatively easy to perform for alternatives and criteria. An analyst would simply scan the first row and the first column of the matrix to list criteria and alternatives, respectively. Listing all of the projected outcomes could similarly be accomplished by visiting each cell and listing its contents. However, identifying which analysts projected outcomes for which criterion and alternative is a little more difficult. For example: to determine coverage for all projected outcomes related to the “IM 240” alternative in the first row, the analyst might have to scan the row several times or make additional notes to keep track of which analysts were represented in each cell. Any given analyst might employ different strategies to answer this question, but they should all converge on the following results:
• Baker scored IM 240 for all criteria except "Minimize consumer time (minutes)" • Smith scored IM 240 for all criteria except "Reduce test cost to vehicle owner ($)" • Jones only scored IM 240 for "Minimize consumer time (minutes)" and "Reduce test cost
to vehicle owner ($)"
Each one of these results leads to further questions. Why didn't Jones score any of the alternatives for "Maximize needed cleanup (percentage attained)" or "Minimize cost per ton of pollution reduced ($)"? Why did Smith score every possible combination of alternatives and criteria except for "Reduce test cost to vehicle owner ($)"? Why did Baker only omit projections for the Modified Smog Check alternative with regards to the "Reduce test cost to vehicle owner ($)", and the "Minimize consumer time (minutes)" with regards to the “IM 240” and “Modified Smog Check” alternatives? Rearranging the visualization with the same data will not answer these questions, but it can make it more likely that the questions will at least get asked.

10
Figure 1: Reference D
esign (Bardach, 2005)
11
Though the example data is hypothetical, it nevertheless illustrates that in the process of gathering evidence for a policy analysis, the analyst is likely to identify multiple sources of information. In order to merge these sources together in the matrix, a new row must be created for each alternative extracted, and a new column must be created for each new criteria extracted. If all sources use the same criteria, and discuss the same alternatives, a high degree of density would be expected. Conversely, if different sources identify very different alternatives and criteria the resulting matrix would be very sparse. Returning to the hypothetical example, we have three analysts, three alternatives, and four criteria. Complete density would therefore require 3 * 3 * 4 = 36 projected outcomes, but our example has only 25 (~69%). Density can be expressed for each source: Smith = 11/12 (~92%), Baker = 9/12 (75%), Jones = 5/12 (~42%). Density can also be expressed for each alternative: “IM 240” = 8/12 (~67%), “Modified Smog Check” = 7/12 (~58%), “Remote Sensing” = 10/12 (~83%). Density can also be expressed for each criterion: "Minimize consumer time (minutes)" = 7/9 (~78%), all others 6/9 (~67%). Finally density could be expressed for each projected outcome: “Remote Sensing” + "Minimize consumer time (minutes)" = 3/3 (100%), “Remote Sensing” + "Reduce test cost to vehicle owner ($)" = 3/3 (100%), “Modified Smog Check” + "Reduce test cost to vehicle owner ($)" = 1/3 (~33%), all others 2/3 (~66%).
Employing these density metrics as descriptive statistics reveals important information about qualitative components of the policy analysis itself and the sources of information used to arrive at a conclusion. The metrics can also be used to objectively compare competing analyses regarding the same problem definition but based on different sources, as well as to compare the density characteristics across unrelated analyses in different areas of policy.
Revised Design Density data, as previously characterized, is a quantitative description of a qualitative
feature. Therefore, strictly speaking it does not directly provide qualitative analysis of qualitative data. With a fixed zero point, density data belongs on a ratio scale, as opposed to an interval scale. Furthermore, a significant share of the qualitative data found in many policy arguments is either ordinal, or nominal in nature. Mackinlay7 suggests that the following encodings are best suited for these two categories of data: position, density (val), color saturation, color hue and texture for ordinal data; and position, color hue, texture, connection and containment for nominal data. The ACH methodology provides another reference visualization that accomplishes a similar objective using some of these encodings.
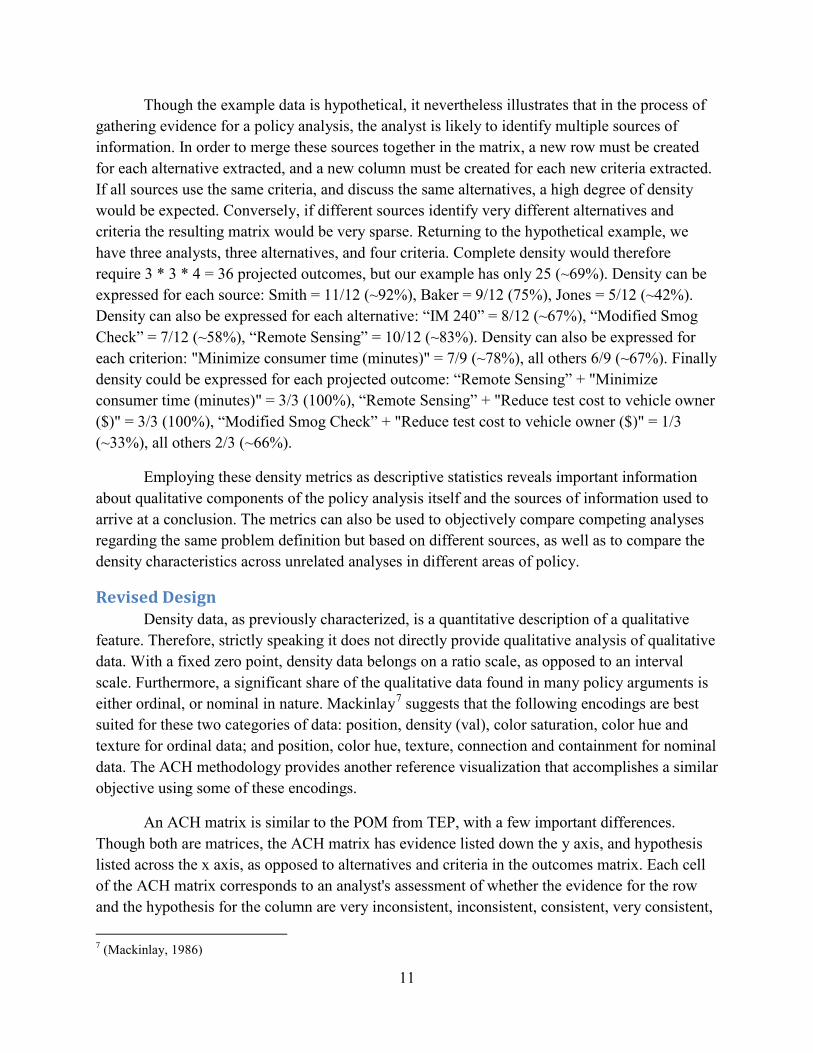
An ACH matrix is similar to the POM from TEP, with a few important differences. Though both are matrices, the ACH matrix has evidence listed down the y axis, and hypothesis listed across the x axis, as opposed to alternatives and criteria in the outcomes matrix. Each cell of the ACH matrix corresponds to an analyst's assessment of whether the evidence for the row and the hypothesis for the column are very inconsistent, inconsistent, consistent, very consistent, 7 (Mackinlay, 1986)
12
neutral, or not applicable. These assessments each carry an associated score: -2, -1, 1, 2, 0, and 0, respectively. In the ACH personal view only inconsistent and very inconsistent scores are aggregated across the top because the methodology seeks to draw user’s attention to these inconsistencies.
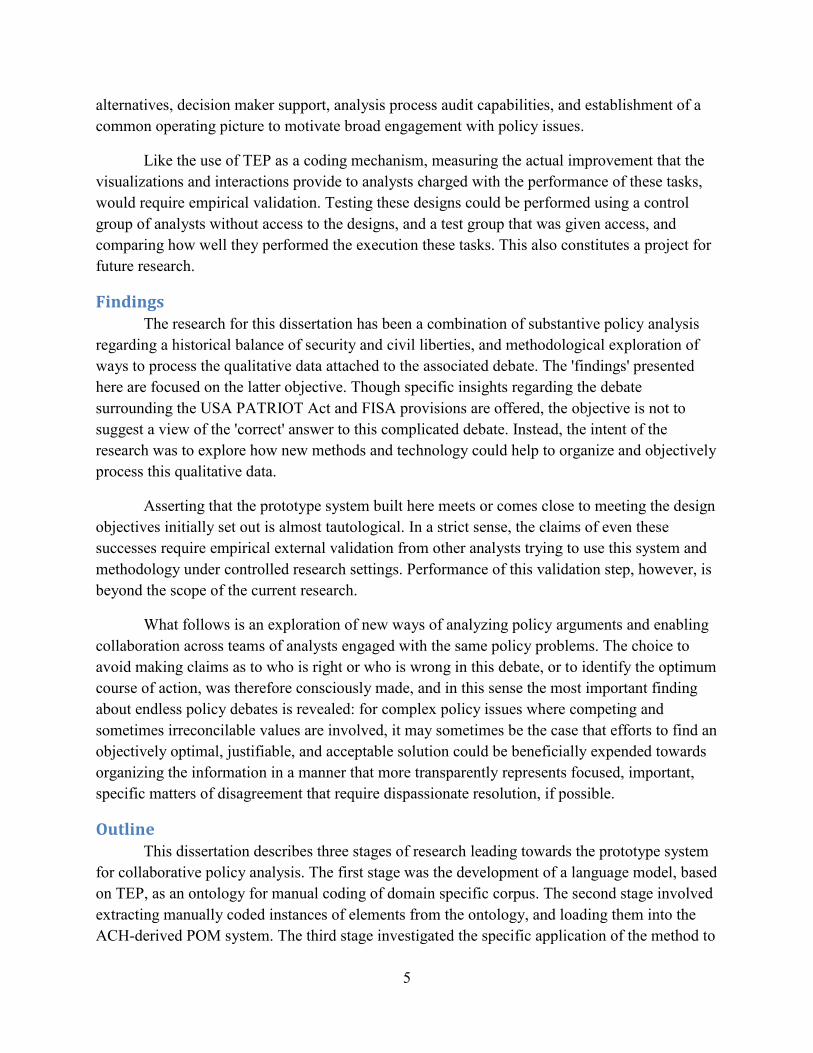
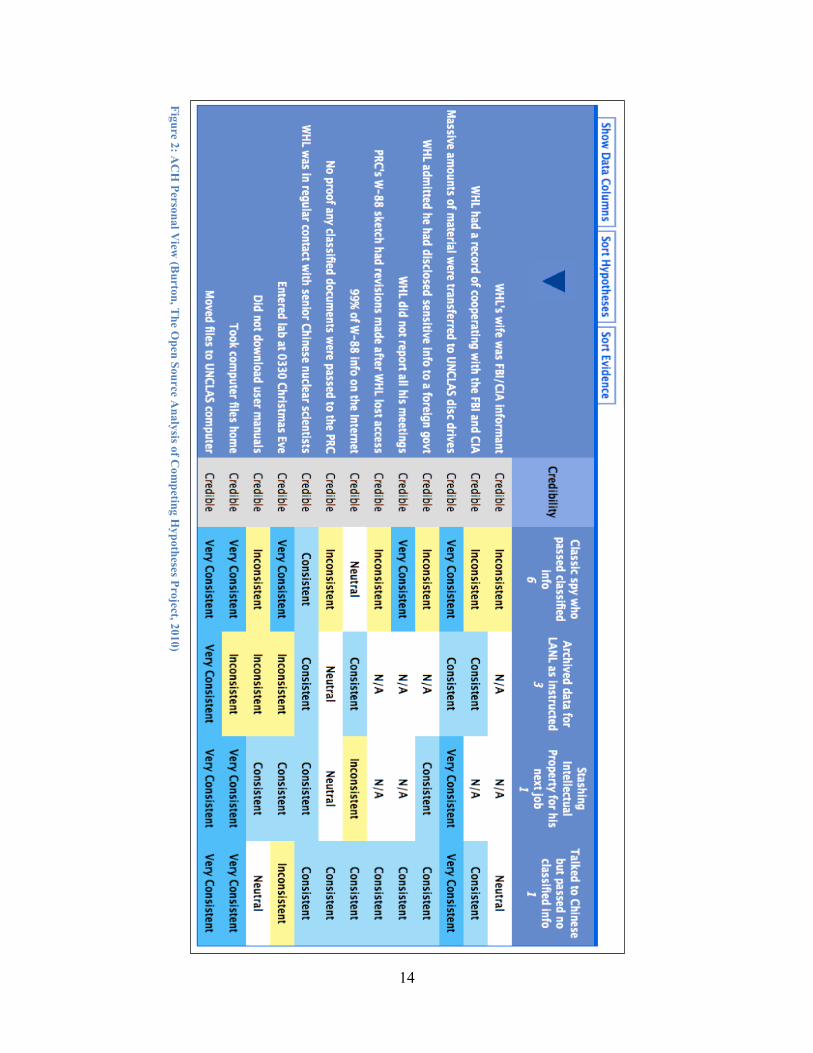
Figure 2 shows an example ACH matrix representing an individual intelligence analyst's evaluation of the consistency of 13 pieces of evidence with 4 possible hypotheses regarding the case of Wen Ho Lee, a scientist who was accused of passing information from Los Alamos National Labs (LANL) to China. Blue cells indicate the analyst's evaluation that the evidence is consistent with the hypothesis, while yellow cells indicate the opposite. Comparing column 4 which represents the hypothesis that Lee talked to the Chinese but did not pass them classified information, with column 1 which represents the hypothesis that he was a classic spy who passed classified data, we can see that the analyst finds great inconsistencies with the latter and significant support for the former. The biggest exception to this evaluation is the evidence that Lee entered the lab at 3:30am on Christmas Eve, as seen in the fourth row from the bottom of the matrix.
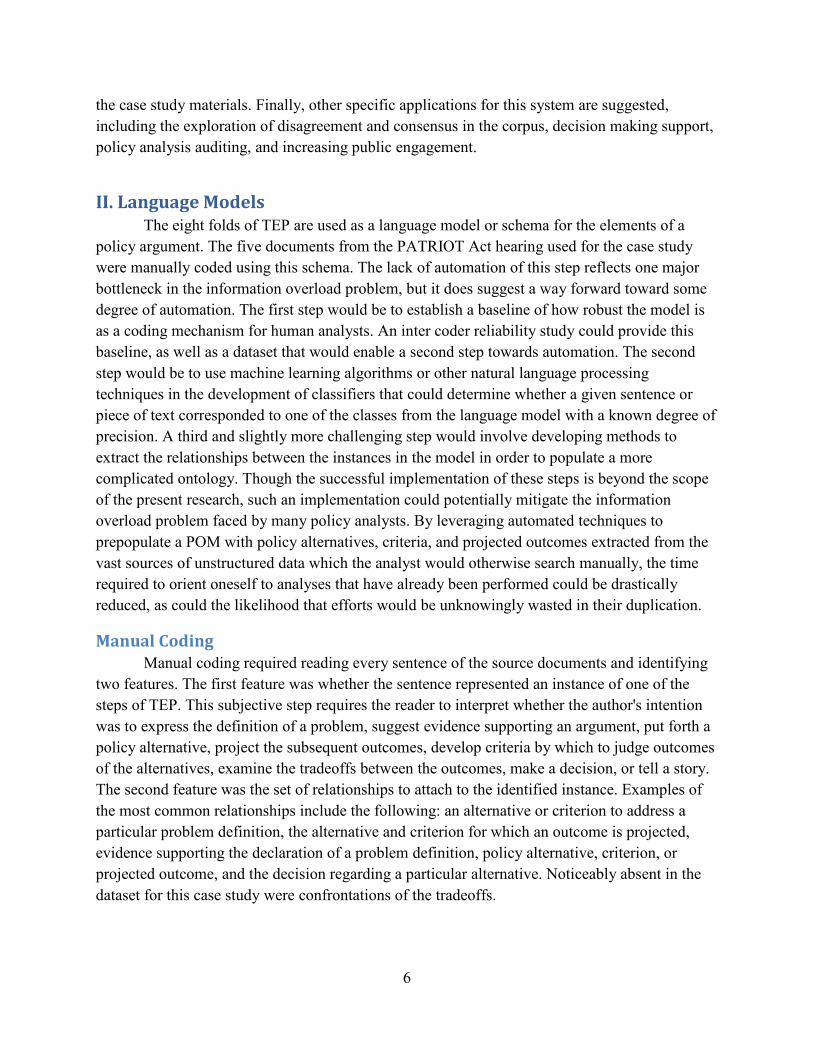
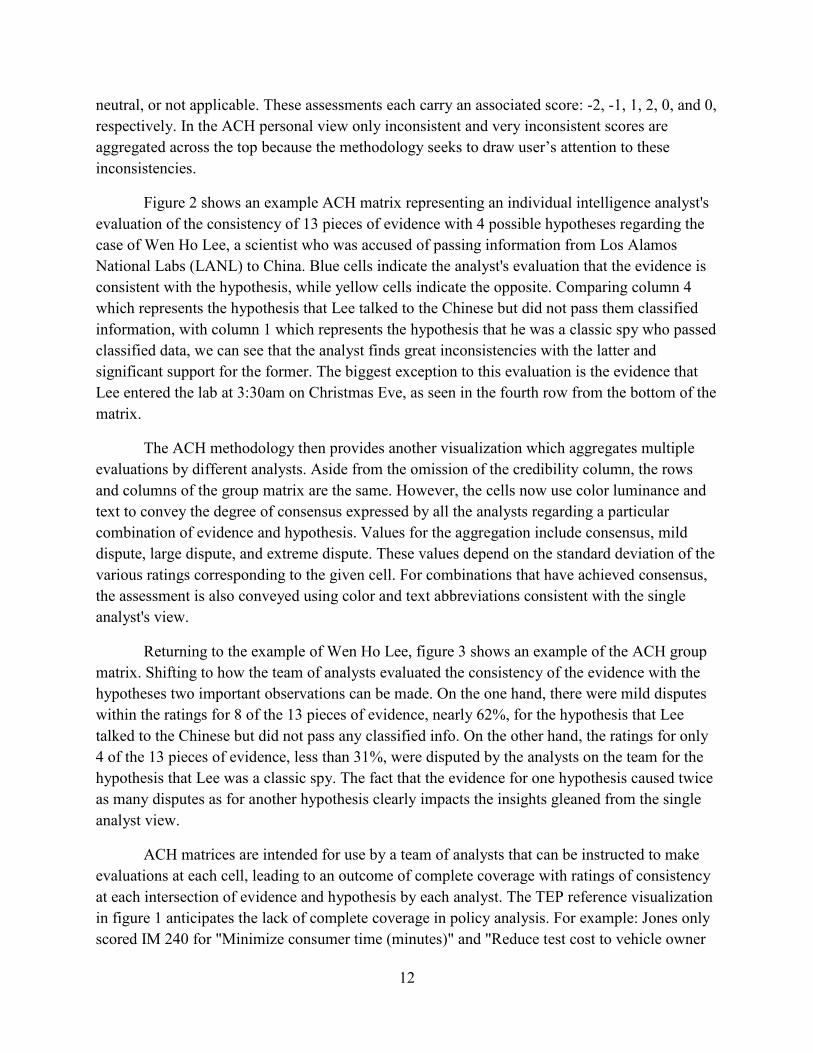
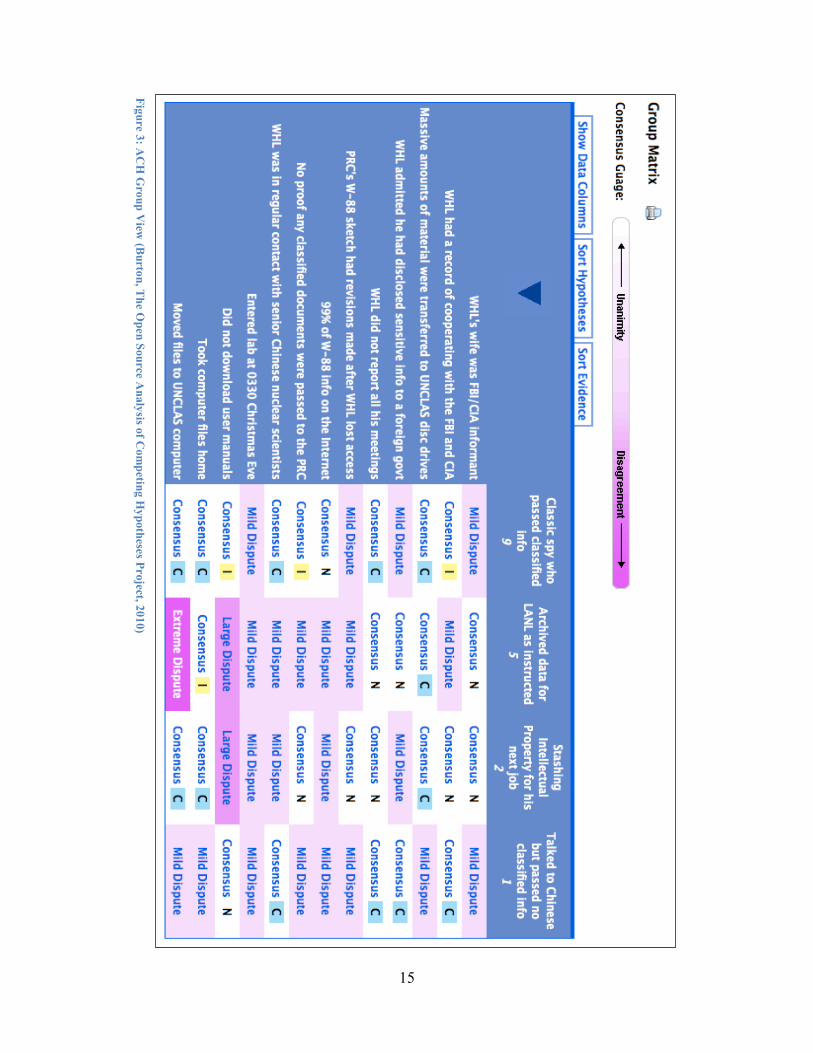
The ACH methodology then provides another visualization which aggregates multiple evaluations by different analysts. Aside from the omission of the credibility column, the rows and columns of the group matrix are the same. However, the cells now use color luminance and text to convey the degree of consensus expressed by all the analysts regarding a particular combination of evidence and hypothesis. Values for the aggregation include consensus, mild dispute, large dispute, and extreme dispute. These values depend on the standard deviation of the various ratings corresponding to the given cell. For combinations that have achieved consensus, the assessment is also conveyed using color and text abbreviations consistent with the single analyst's view.
Returning to the example of Wen Ho Lee, figure 3 shows an example of the ACH group matrix. Shifting to how the team of analysts evaluated the consistency of the evidence with the hypotheses two important observations can be made. On the one hand, there were mild disputes within the ratings for 8 of the 13 pieces of evidence, nearly 62%, for the hypothesis that Lee talked to the Chinese but did not pass any classified info. On the other hand, the ratings for only 4 of the 13 pieces of evidence, less than 31%, were disputed by the analysts on the team for the hypothesis that Lee was a classic spy. The fact that the evidence for one hypothesis caused twice as many disputes as for another hypothesis clearly impacts the insights gleaned from the single analyst view.
ACH matrices are intended for use by a team of analysts that can be instructed to make evaluations at each cell, leading to an outcome of complete coverage with ratings of consistency at each intersection of evidence and hypothesis by each analyst. The TEP reference visualization in figure 1 anticipates the lack of complete coverage in policy analysis. For example: Jones only scored IM 240 for "Minimize consumer time (minutes)" and "Reduce test cost to vehicle owner
13
($)", but not for "Maximize needed cleanup (percentage attained)" or "Minimize cost per ton of pollution reduced ($)". This interesting type of observation is not immediately highlighted by the reference design.
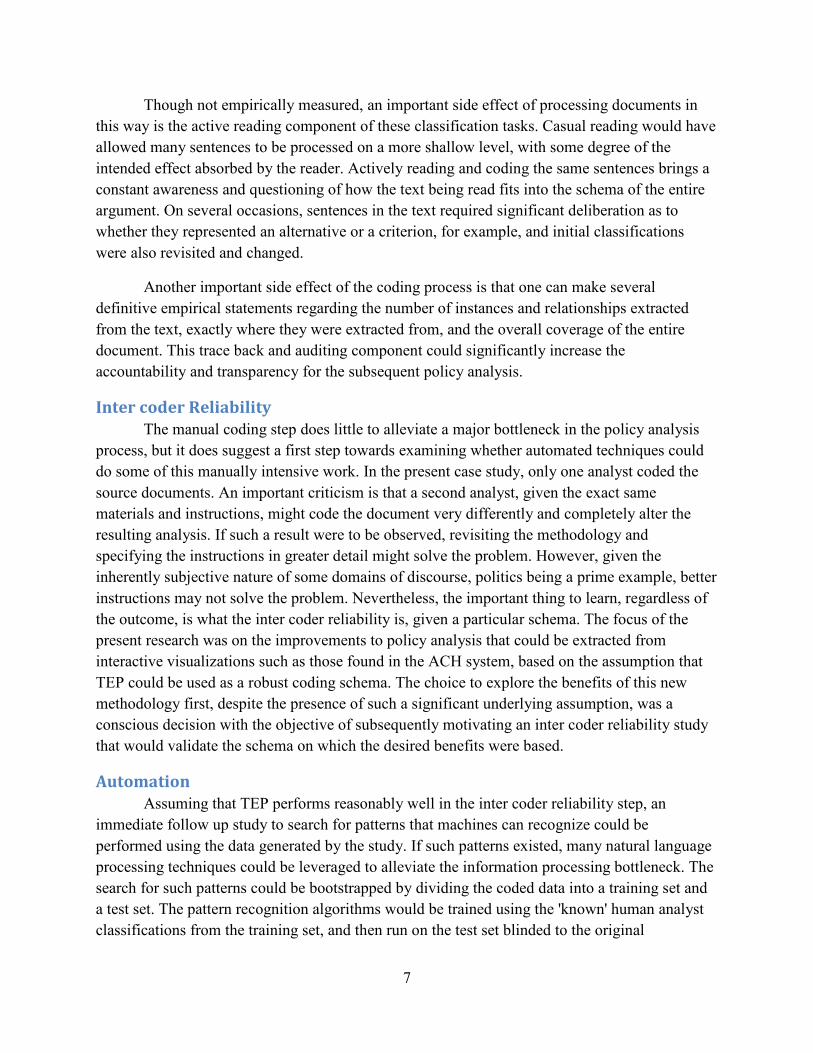
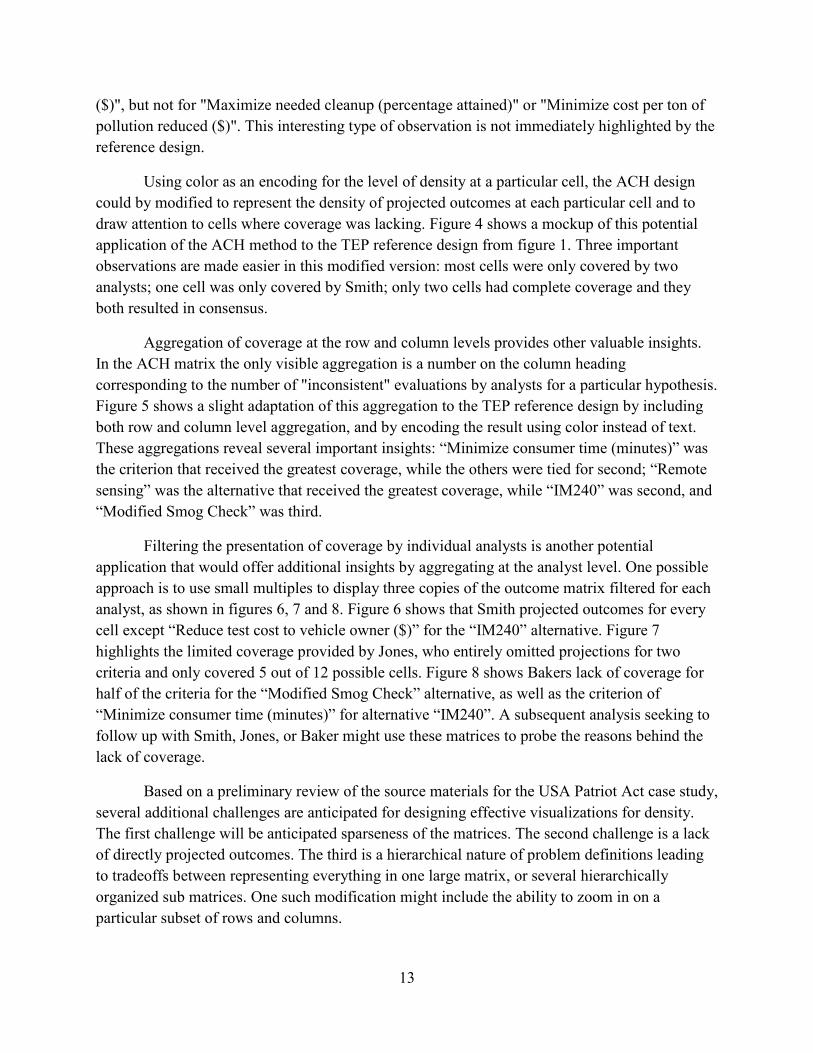
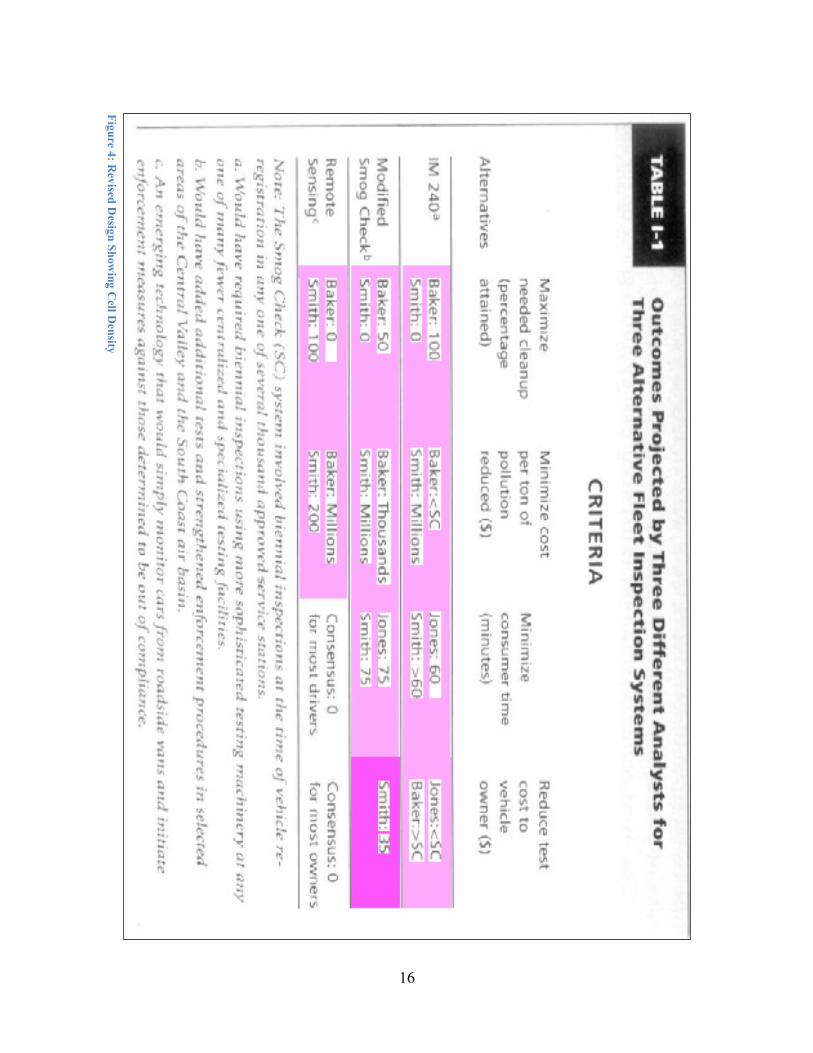
Using color as an encoding for the level of density at a particular cell, the ACH design could by modified to represent the density of projected outcomes at each particular cell and to draw attention to cells where coverage was lacking. Figure 4 shows a mockup of this potential application of the ACH method to the TEP reference design from figure 1. Three important observations are made easier in this modified version: most cells were only covered by two analysts; one cell was only covered by Smith; only two cells had complete coverage and they both resulted in consensus.
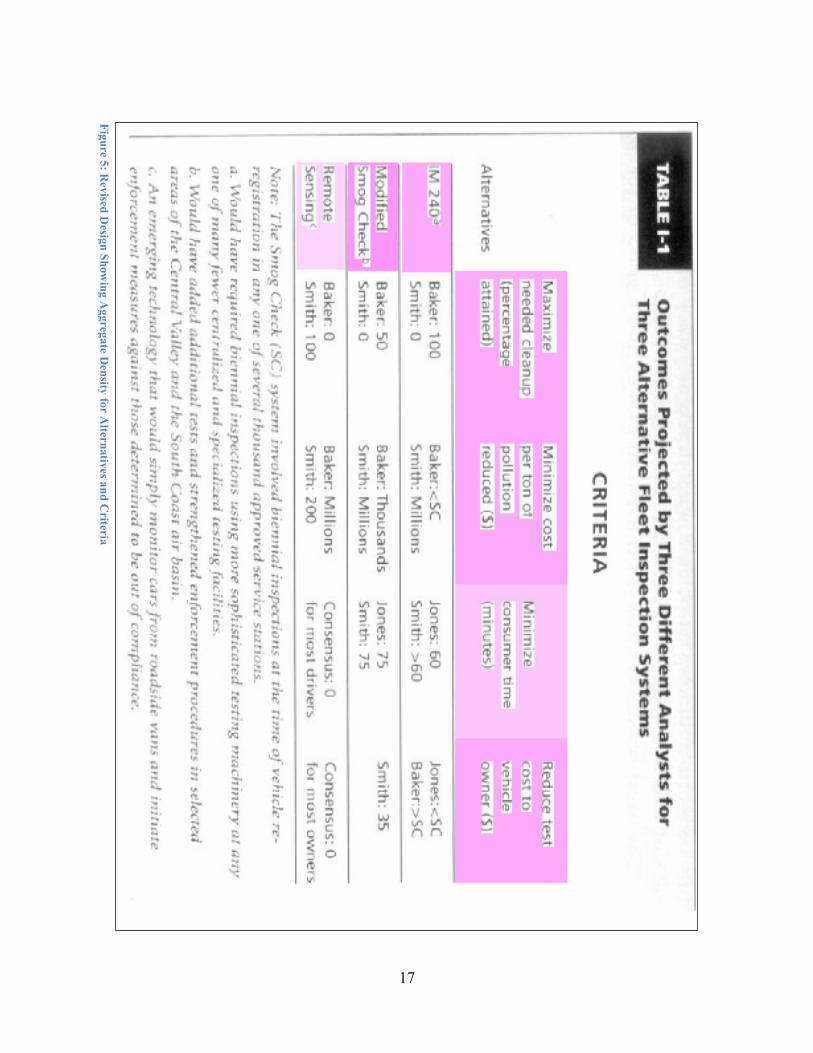
Aggregation of coverage at the row and column levels provides other valuable insights. In the ACH matrix the only visible aggregation is a number on the column heading corresponding to the number of "inconsistent" evaluations by analysts for a particular hypothesis. Figure 5 shows a slight adaptation of this aggregation to the TEP reference design by including both row and column level aggregation, and by encoding the result using color instead of text. These aggregations reveal several important insights: “Minimize consumer time (minutes)” was the criterion that received the greatest coverage, while the others were tied for second; “Remote sensing” was the alternative that received the greatest coverage, while “IM240” was second, and “Modified Smog Check” was third.
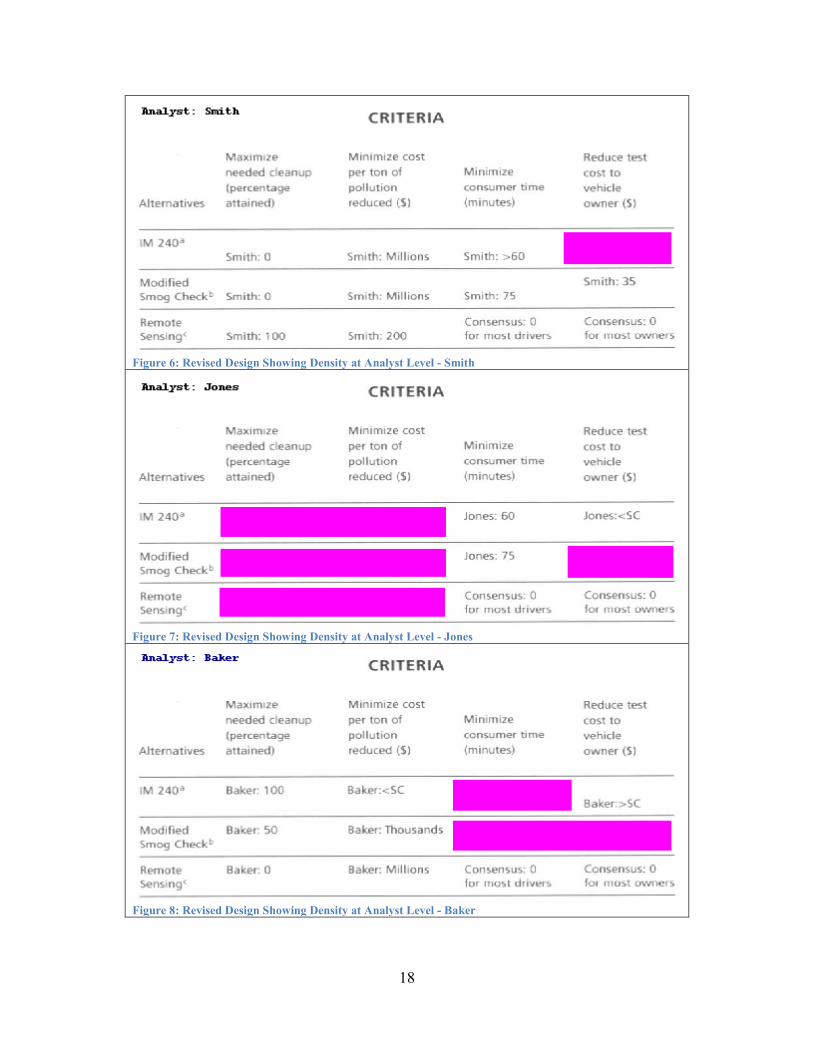
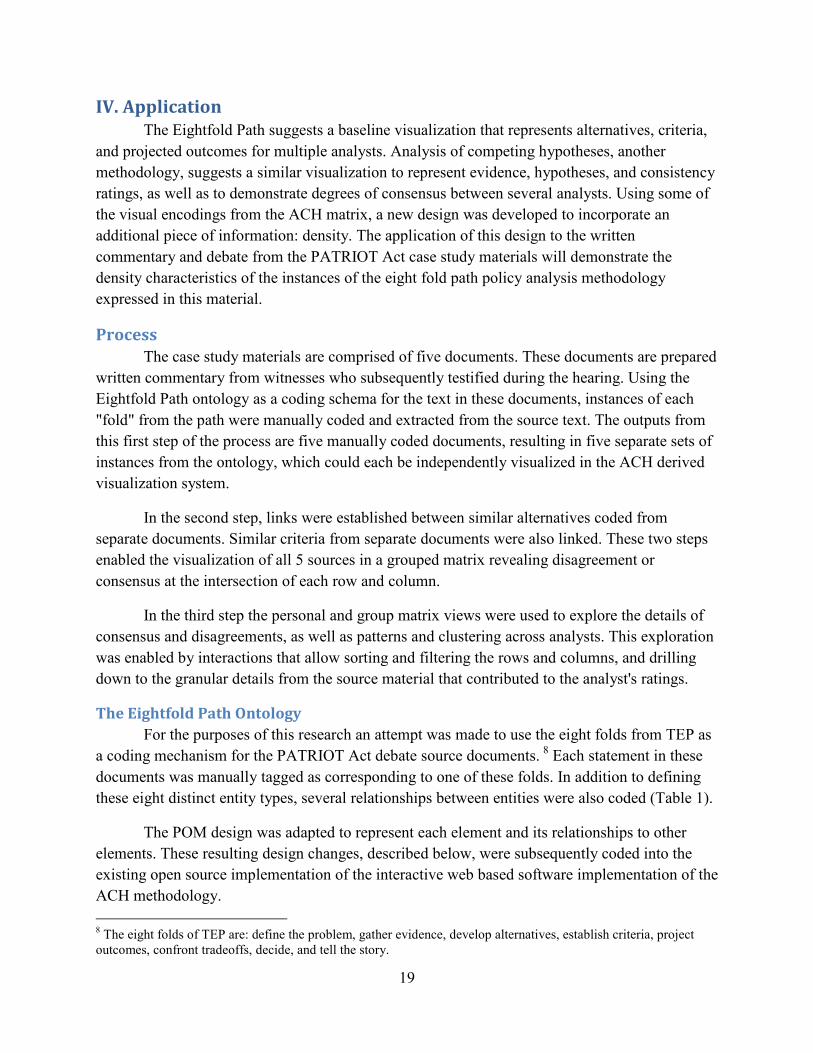
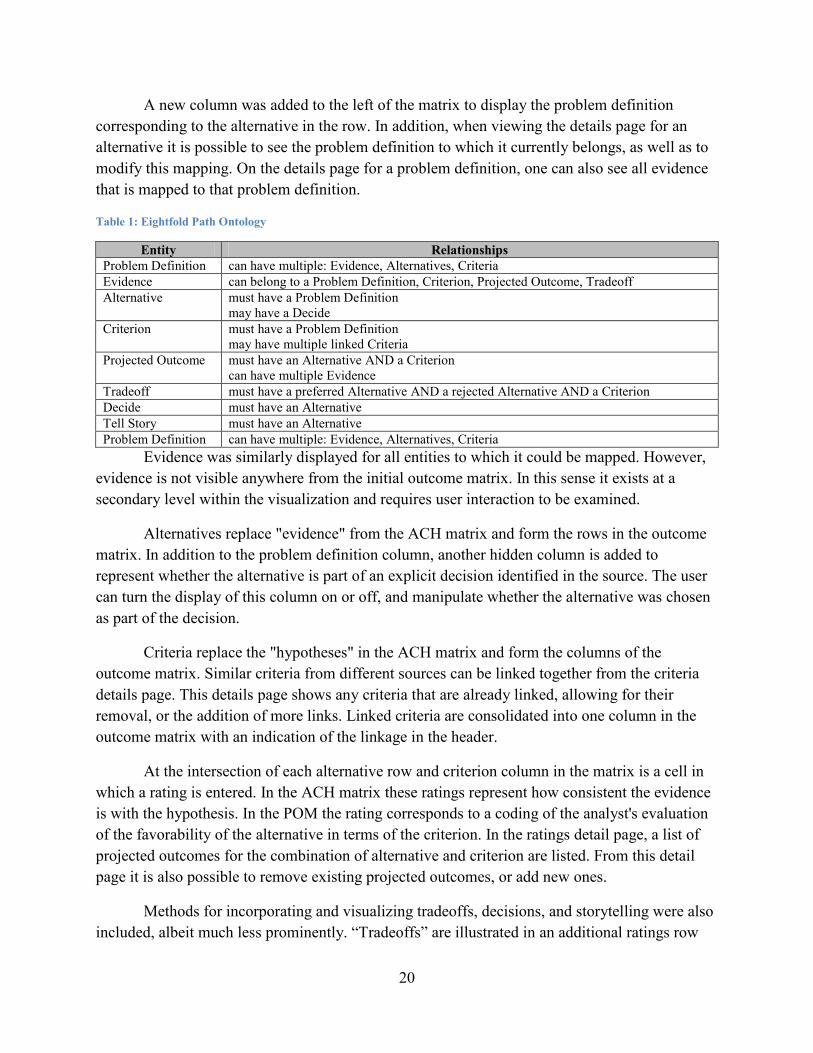
Filtering the presentation of coverage by individual analysts is another potential application that would offer additional insights by aggregating at the analyst level. One possible approach is to use small multiples to display three copies of the outcome matrix filtered for each analyst, as shown in figures 6, 7 and 8. Figure 6 shows that Smith projected outcomes for every cell except “Reduce test cost to vehicle owner ($)” for the “IM240” alternative. Figure 7 highlights the limited coverage provided by Jones, who entirely omitted projections for two criteria and only covered 5 out of 12 possible cells. Figure 8 shows Bakers lack of coverage for half of the criteria for the “Modified Smog Check” alternative, as well as the criterion of “Minimize consumer time (minutes)” for alternative “IM240”. A subsequent analysis seeking to follow up with Smith, Jones, or Baker might use these matrices to probe the reasons behind the lack of coverage.
Based on a preliminary review of the source materials for the USA Patriot Act case study, several additional challenges are anticipated for designing effective visualizations for density. The first challenge will be anticipated sparseness of the matrices. The second challenge is a lack of directly projected outcomes. The third is a hierarchical nature of problem definitions leading to tradeoffs between representing everything in one large matrix, or several hierarchically organized sub matrices. One such modification might include the ability to zoom in on a particular subset of rows and columns.
14
Figure 2: AC
H Personal V
iew (B
urton, The O
pen Source Analysis of C
ompeting H
ypotheses Project, 2010)
15
Figure 3: AC
H G
roup View
(Burton, T
he Open Source A
nalysis of Com
peting Hypotheses Project, 2010)
16
Figure 4: Revised D
esign Showing C
ell Density
17
Figure 5: Revised D
esign Showing A
ggregate Density for A
lternatives and Criteria
18
Figure 6: Revised Design Showing Density at Analyst Level - Smith
Figure 7: Revised Design Showing Density at Analyst Level - Jones
Figure 8: Revised Design Showing Density at Analyst Level - Baker
19
IV. Application The Eightfold Path suggests a baseline visualization that represents alternatives, criteria,
and projected outcomes for multiple analysts. Analysis of competing hypotheses, another methodology, suggests a similar visualization to represent evidence, hypotheses, and consistency ratings, as well as to demonstrate degrees of consensus between several analysts. Using some of the visual encodings from the ACH matrix, a new design was developed to incorporate an additional piece of information: density. The application of this design to the written commentary and debate from the PATRIOT Act case study materials will demonstrate the density characteristics of the instances of the eight fold path policy analysis methodology expressed in this material.
Process The case study materials are comprised of five documents. These documents are prepared
written commentary from witnesses who subsequently testified during the hearing. Using the Eightfold Path ontology as a coding schema for the text in these documents, instances of each "fold" from the path were manually coded and extracted from the source text. The outputs from this first step of the process are five manually coded documents, resulting in five separate sets of instances from the ontology, which could each be independently visualized in the ACH derived visualization system.
In the second step, links were established between similar alternatives coded from separate documents. Similar criteria from separate documents were also linked. These two steps enabled the visualization of all 5 sources in a grouped matrix revealing disagreement or consensus at the intersection of each row and column.
In the third step the personal and group matrix views were used to explore the details of consensus and disagreements, as well as patterns and clustering across analysts. This exploration was enabled by interactions that allow sorting and filtering the rows and columns, and drilling down to the granular details from the source material that contributed to the analyst's ratings.
The Eightfold Path Ontology For the purposes of this research an attempt was made to use the eight folds from TEP as
a coding mechanism for the PATRIOT Act debate source documents. 8 Each statement in these documents was manually tagged as corresponding to one of these folds. In addition to defining these eight distinct entity types, several relationships between entities were also coded (Table 1).
The POM design was adapted to represent each element and its relationships to other elements. These resulting design changes, described below, were subsequently coded into the existing open source implementation of the interactive web based software implementation of the ACH methodology. 8 The eight folds of TEP are: define the problem, gather evidence, develop alternatives, establish criteria, project outcomes, confront tradeoffs, decide, and tell the story.
20
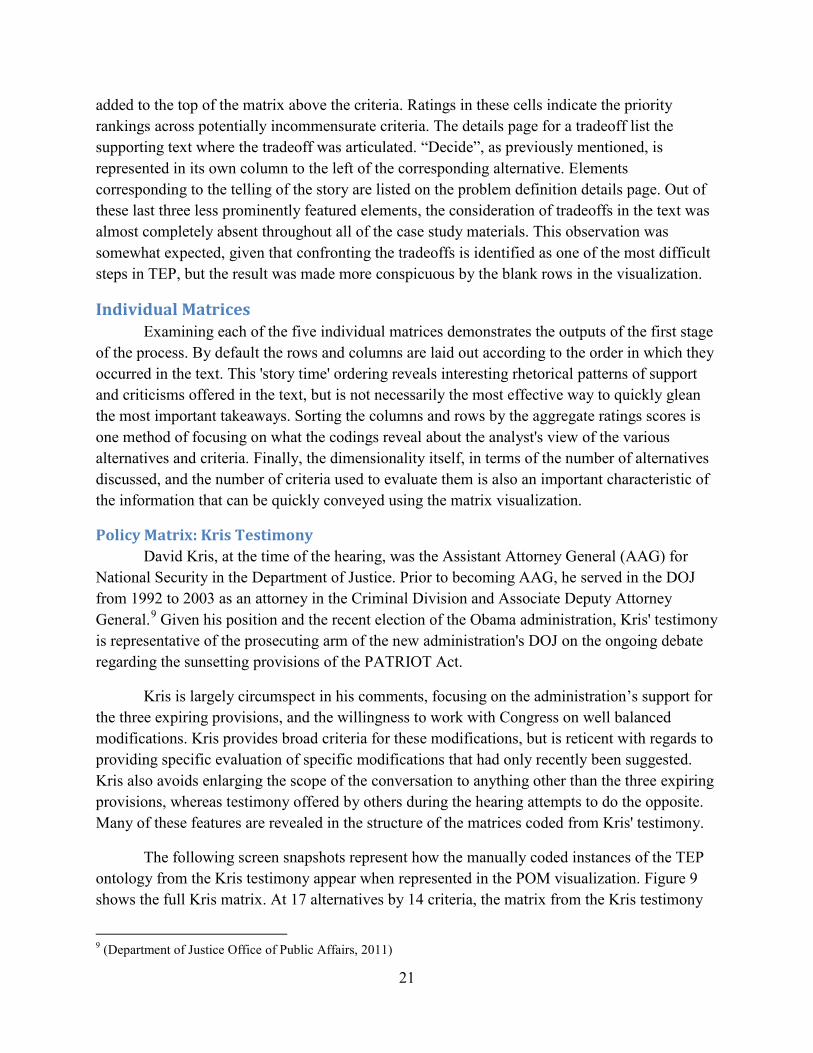
A new column was added to the left of the matrix to display the problem definition corresponding to the alternative in the row. In addition, when viewing the details page for an alternative it is possible to see the problem definition to which it currently belongs, as well as to modify this mapping. On the details page for a problem definition, one can also see all evidence that is mapped to that problem definition.
Table 1: Eightfold Path Ontology
Entity Relationships Problem Definition can have multiple: Evidence, Alternatives, Criteria Evidence can belong to a Problem Definition, Criterion, Projected Outcome, Tradeoff Alternative must have a Problem Definition
may have a Decide Criterion must have a Problem Definition
may have multiple linked Criteria Projected Outcome must have an Alternative AND a Criterion
can have multiple Evidence Tradeoff must have a preferred Alternative AND a rejected Alternative AND a Criterion Decide must have an Alternative Tell Story must have an Alternative Problem Definition can have multiple: Evidence, Alternatives, Criteria
Evidence was similarly displayed for all entities to which it could be mapped. However, evidence is not visible anywhere from the initial outcome matrix. In this sense it exists at a secondary level within the visualization and requires user interaction to be examined.
Alternatives replace "evidence" from the ACH matrix and form the rows in the outcome matrix. In addition to the problem definition column, another hidden column is added to represent whether the alternative is part of an explicit decision identified in the source. The user can turn the display of this column on or off, and manipulate whether the alternative was chosen as part of the decision.
Criteria replace the "hypotheses" in the ACH matrix and form the columns of the outcome matrix. Similar criteria from different sources can be linked together from the criteria details page. This details page shows any criteria that are already linked, allowing for their removal, or the addition of more links. Linked criteria are consolidated into one column in the outcome matrix with an indication of the linkage in the header.
At the intersection of each alternative row and criterion column in the matrix is a cell in which a rating is entered. In the ACH matrix these ratings represent how consistent the evidence is with the hypothesis. In the POM the rating corresponds to a coding of the analyst's evaluation of the favorability of the alternative in terms of the criterion. In the ratings detail page, a list of projected outcomes for the combination of alternative and criterion are listed. From this detail page it is also possible to remove existing projected outcomes, or add new ones.
Methods for incorporating and visualizing tradeoffs, decisions, and storytelling were also included, albeit much less prominently. “Tradeoffs” are illustrated in an additional ratings row
21
added to the top of the matrix above the criteria. Ratings in these cells indicate the priority rankings across potentially incommensurate criteria. The details page for a tradeoff list the supporting text where the tradeoff was articulated. “Decide”, as previously mentioned, is represented in its own column to the left of the corresponding alternative. Elements corresponding to the telling of the story are listed on the problem definition details page. Out of these last three less prominently featured elements, the consideration of tradeoffs in the text was almost completely absent throughout all of the case study materials. This observation was somewhat expected, given that confronting the tradeoffs is identified as one of the most difficult steps in TEP, but the result was made more conspicuous by the blank rows in the visualization.
Individual Matrices Examining each of the five individual matrices demonstrates the outputs of the first stage
of the process. By default the rows and columns are laid out according to the order in which they occurred in the text. This 'story time' ordering reveals interesting rhetorical patterns of support and criticisms offered in the text, but is not necessarily the most effective way to quickly glean the most important takeaways. Sorting the columns and rows by the aggregate ratings scores is one method of focusing on what the codings reveal about the analyst's view of the various alternatives and criteria. Finally, the dimensionality itself, in terms of the number of alternatives discussed, and the number of criteria used to evaluate them is also an important characteristic of the information that can be quickly conveyed using the matrix visualization.
Policy Matrix: Kris Testimony David Kris, at the time of the hearing, was the Assistant Attorney General (AAG) for
National Security in the Department of Justice. Prior to becoming AAG, he served in the DOJ from 1992 to 2003 as an attorney in the Criminal Division and Associate Deputy Attorney General.9 Given his position and the recent election of the Obama administration, Kris' testimony is representative of the prosecuting arm of the new administration's DOJ on the ongoing debate regarding the sunsetting provisions of the PATRIOT Act.
Kris is largely circumspect in his comments, focusing on the administration’s support for the three expiring provisions, and the willingness to work with Congress on well balanced modifications. Kris provides broad criteria for these modifications, but is reticent with regards to providing specific evaluation of specific modifications that had only recently been suggested. Kris also avoids enlarging the scope of the conversation to anything other than the three expiring provisions, whereas testimony offered by others during the hearing attempts to do the opposite. Many of these features are revealed in the structure of the matrices coded from Kris' testimony.
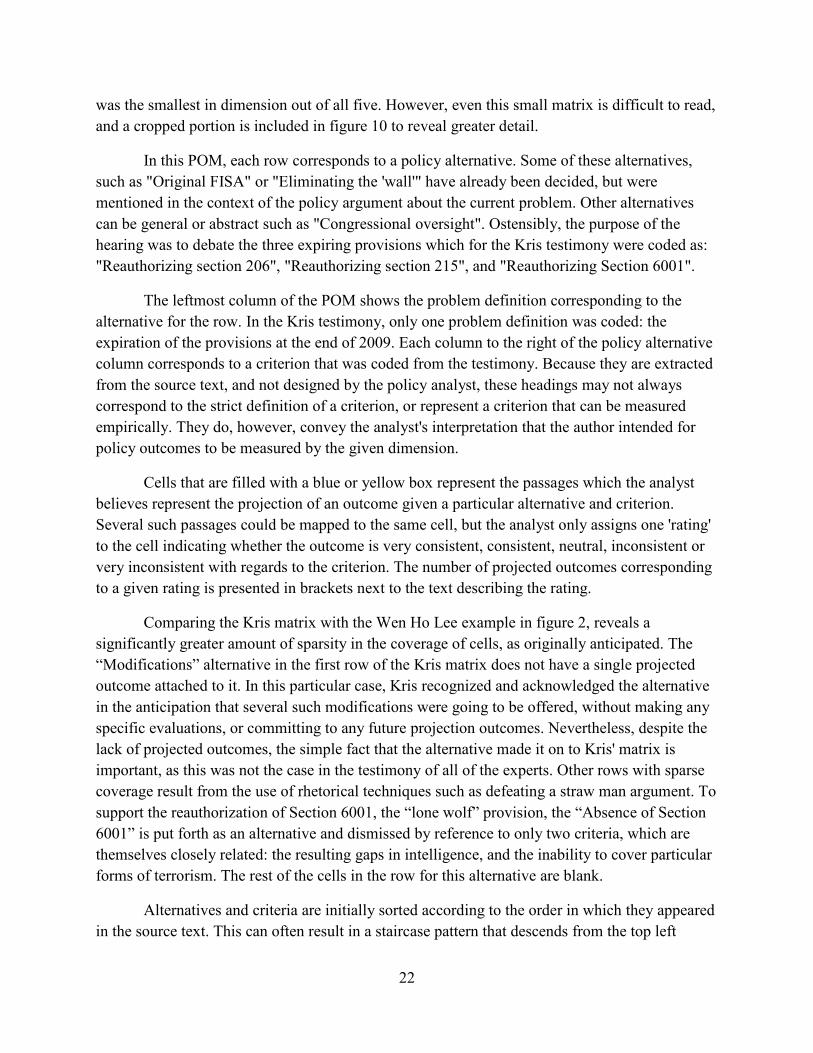
The following screen snapshots represent how the manually coded instances of the TEP ontology from the Kris testimony appear when represented in the POM visualization. Figure 9 shows the full Kris matrix. At 17 alternatives by 14 criteria, the matrix from the Kris testimony
9 (Department of Justice Office of Public Affairs, 2011)
22
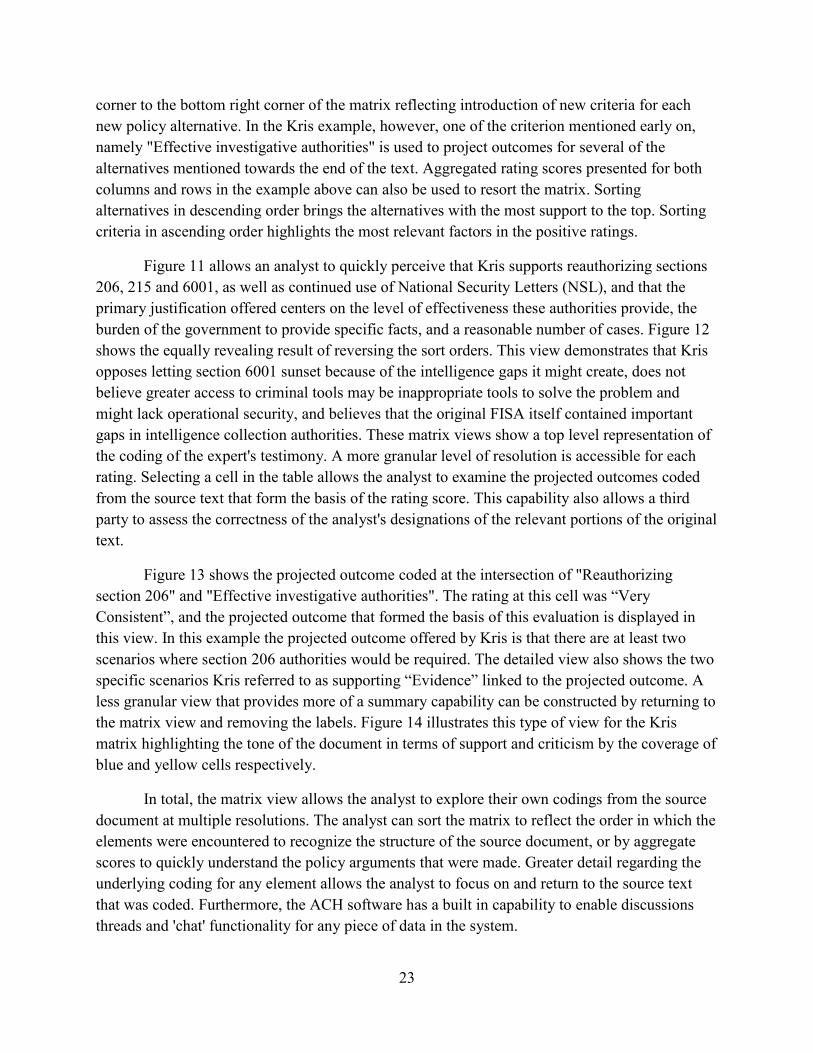
was the smallest in dimension out of all five. However, even this small matrix is difficult to read, and a cropped portion is included in figure 10 to reveal greater detail.
In this POM, each row corresponds to a policy alternative. Some of these alternatives, such as "Original FISA" or "Eliminating the 'wall'" have already been decided, but were mentioned in the context of the policy argument about the current problem. Other alternatives can be general or abstract such as "Congressional oversight". Ostensibly, the purpose of the hearing was to debate the three expiring provisions which for the Kris testimony were coded as: "Reauthorizing section 206", "Reauthorizing section 215", and "Reauthorizing Section 6001".
The leftmost column of the POM shows the problem definition corresponding to the alternative for the row. In the Kris testimony, only one problem definition was coded: the expiration of the provisions at the end of 2009. Each column to the right of the policy alternative column corresponds to a criterion that was coded from the testimony. Because they are extracted from the source text, and not designed by the policy analyst, these headings may not always correspond to the strict definition of a criterion, or represent a criterion that can be measured empirically. They do, however, convey the analyst's interpretation that the author intended for policy outcomes to be measured by the given dimension.
Cells that are filled with a blue or yellow box represent the passages which the analyst believes represent the projection of an outcome given a particular alternative and criterion. Several such passages could be mapped to the same cell, but the analyst only assigns one 'rating' to the cell indicating whether the outcome is very consistent, consistent, neutral, inconsistent or very inconsistent with regards to the criterion. The number of projected outcomes corresponding to a given rating is presented in brackets next to the text describing the rating.
Comparing the Kris matrix with the Wen Ho Lee example in figure 2, reveals a significantly greater amount of sparsity in the coverage of cells, as originally anticipated. The “Modifications” alternative in the first row of the Kris matrix does not have a single projected outcome attached to it. In this particular case, Kris recognized and acknowledged the alternative in the anticipation that several such modifications were going to be offered, without making any specific evaluations, or committing to any future projection outcomes. Nevertheless, despite the lack of projected outcomes, the simple fact that the alternative made it on to Kris' matrix is important, as this was not the case in the testimony of all of the experts. Other rows with sparse coverage result from the use of rhetorical techniques such as defeating a straw man argument. To support the reauthorization of Section 6001, the “lone wolf” provision, the “Absence of Section 6001” is put forth as an alternative and dismissed by reference to only two criteria, which are themselves closely related: the resulting gaps in intelligence, and the inability to cover particular forms of terrorism. The rest of the cells in the row for this alternative are blank.
Alternatives and criteria are initially sorted according to the order in which they appeared in the source text. This can often result in a staircase pattern that descends from the top left
23
corner to the bottom right corner of the matrix reflecting introduction of new criteria for each new policy alternative. In the Kris example, however, one of the criterion mentioned early on, namely "Effective investigative authorities" is used to project outcomes for several of the alternatives mentioned towards the end of the text. Aggregated rating scores presented for both columns and rows in the example above can also be used to resort the matrix. Sorting alternatives in descending order brings the alternatives with the most support to the top. Sorting criteria in ascending order highlights the most relevant factors in the positive ratings.
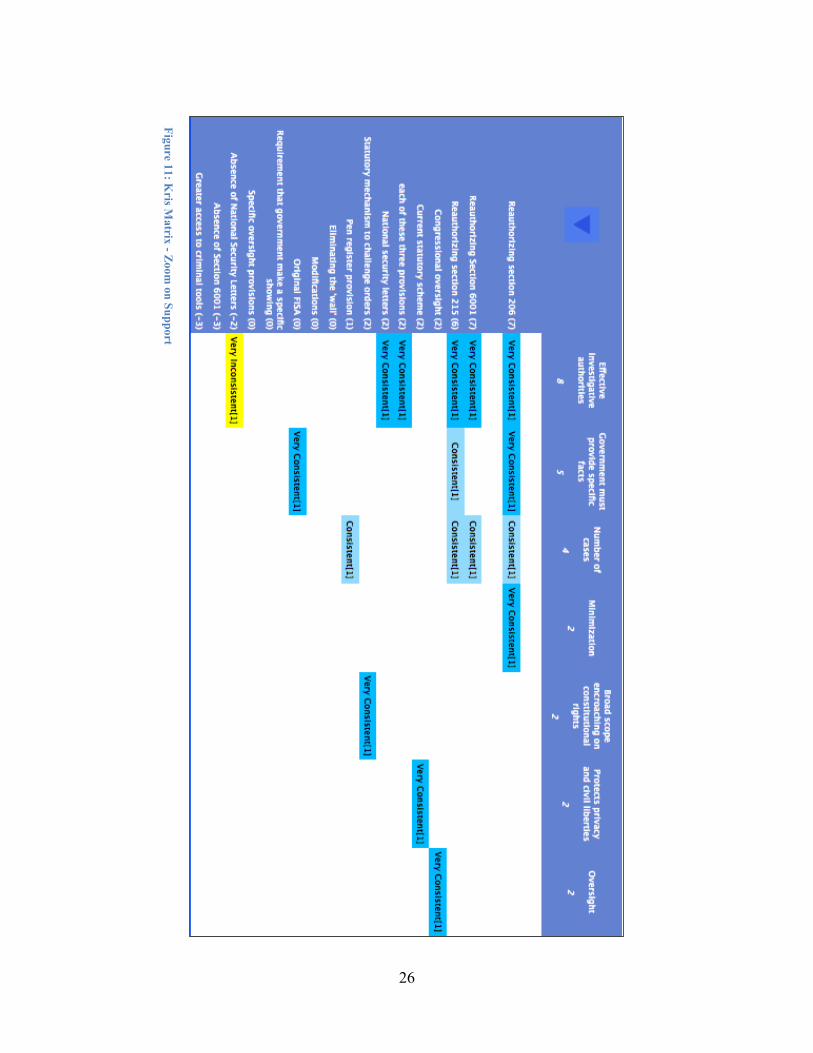
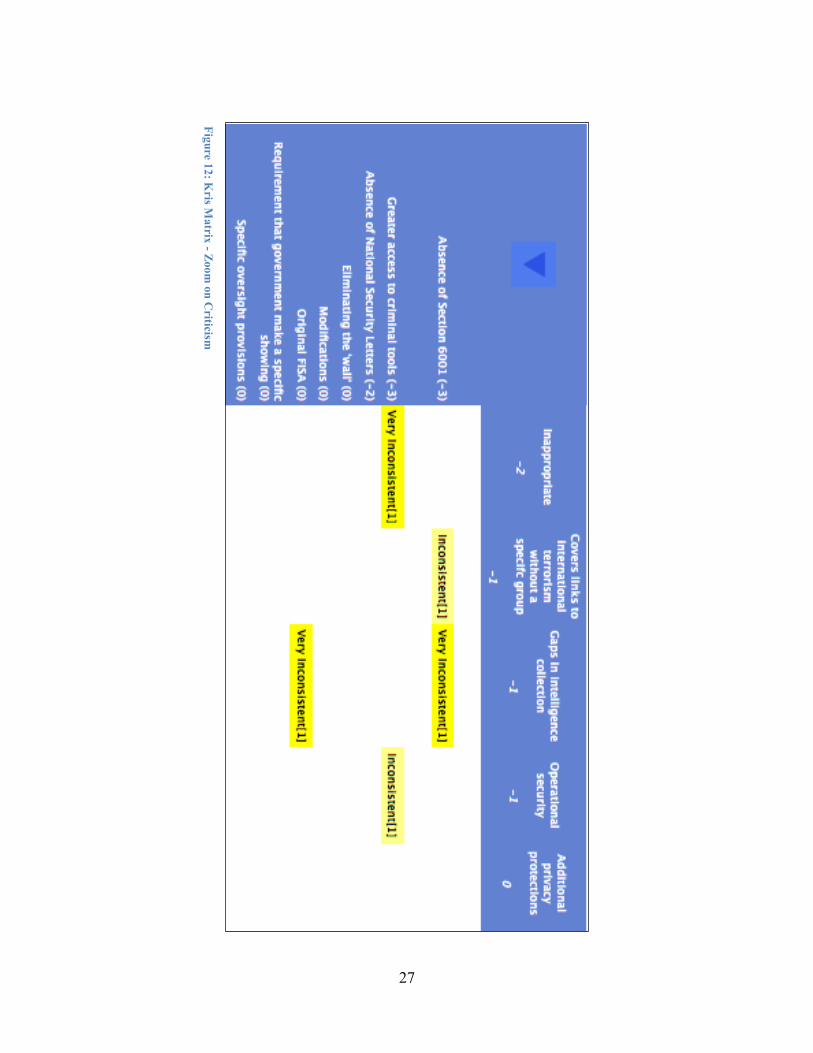
Figure 11 allows an analyst to quickly perceive that Kris supports reauthorizing sections 206, 215 and 6001, as well as continued use of National Security Letters (NSL), and that the primary justification offered centers on the level of effectiveness these authorities provide, the burden of the government to provide specific facts, and a reasonable number of cases. Figure 12 shows the equally revealing result of reversing the sort orders. This view demonstrates that Kris opposes letting section 6001 sunset because of the intelligence gaps it might create, does not believe greater access to criminal tools may be inappropriate tools to solve the problem and might lack operational security, and believes that the original FISA itself contained important gaps in intelligence collection authorities. These matrix views show a top level representation of the coding of the expert's testimony. A more granular level of resolution is accessible for each rating. Selecting a cell in the table allows the analyst to examine the projected outcomes coded from the source text that form the basis of the rating score. This capability also allows a third party to assess the correctness of the analyst's designations of the relevant portions of the original text.
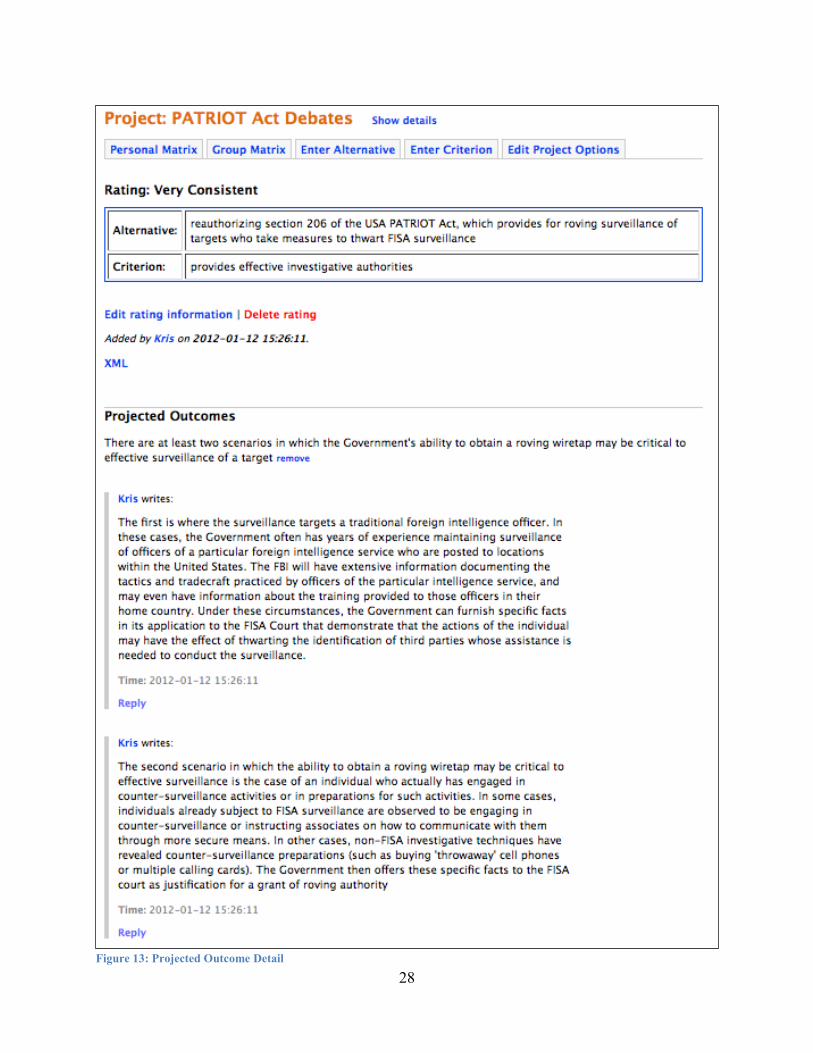
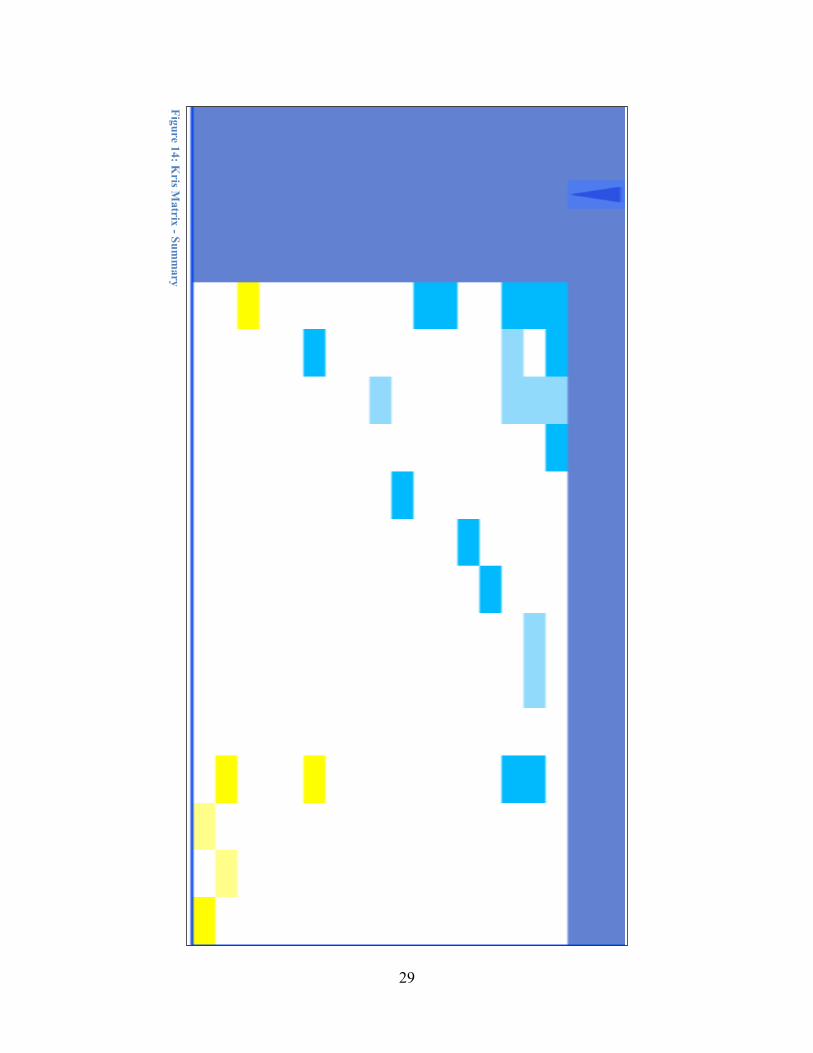
Figure 13 shows the projected outcome coded at the intersection of "Reauthorizing section 206" and "Effective investigative authorities". The rating at this cell was “Very Consistent”, and the projected outcome that formed the basis of this evaluation is displayed in this view. In this example the projected outcome offered by Kris is that there are at least two scenarios where section 206 authorities would be required. The detailed view also shows the two specific scenarios Kris referred to as supporting “Evidence” linked to the projected outcome. A less granular view that provides more of a summary capability can be constructed by returning to the matrix view and removing the labels. Figure 14 illustrates this type of view for the Kris matrix highlighting the tone of the document in terms of support and criticism by the coverage of blue and yellow cells respectively.
In total, the matrix view allows the analyst to explore their own codings from the source document at multiple resolutions. The analyst can sort the matrix to reflect the order in which the elements were encountered to recognize the structure of the source document, or by aggregate scores to quickly understand the policy arguments that were made. Greater detail regarding the underlying coding for any element allows the analyst to focus on and return to the source text that was coded. Furthermore, the ACH software has a built in capability to enable discussions threads and 'chat' functionality for any piece of data in the system.
24
Figure 9: Kris M
atrix - Full
25
Figure 10: Kris M
atrix - Zoom
26
Figure 11: Kris M
atrix - Zoom on Support
27
Figure 12: Kris M
atrix - Zoom on C
riticism
28
Figure 13: Projected Outcome Detail
29
Figure 14: Kris M
atrix - Summ
ary

30
Policy Matrix: Spaulding Testimony Suzanne Spaulding's testimony represents a different perspective in the debate
surrounding the sunsetting provisions. At the time of the hearing she was working in the private sector as a Principal in Bingham Consulting Group, and Of Counsel to Bingham McCutchen, advising clients on national security issues. Before the private sector, however, Spaulding had a great deal of experience working in government on national security issues on Capitol Hill, and in the CIA. Having served as both the Democratic Staff Director for the US House of Representatives Permanent Select Committee on Intelligence, and as General Counsel for the Senate Select Committee on Intelligence, the orientation of Spaulding's testimony is closely related to the oversight capacity of these committees.
In contrast to Kris, Spaulding's testimony does seek to extend the context of the debate beyond a discussion focused only on the three sunsetting provisions. Nevertheless, her evaluations of the sunsetting provisions, and the other issues she addresses, are relatively balanced and they address specific deficiencies and remedies to the problems identified. These features are also reflected in the matrices coded from her testimony.
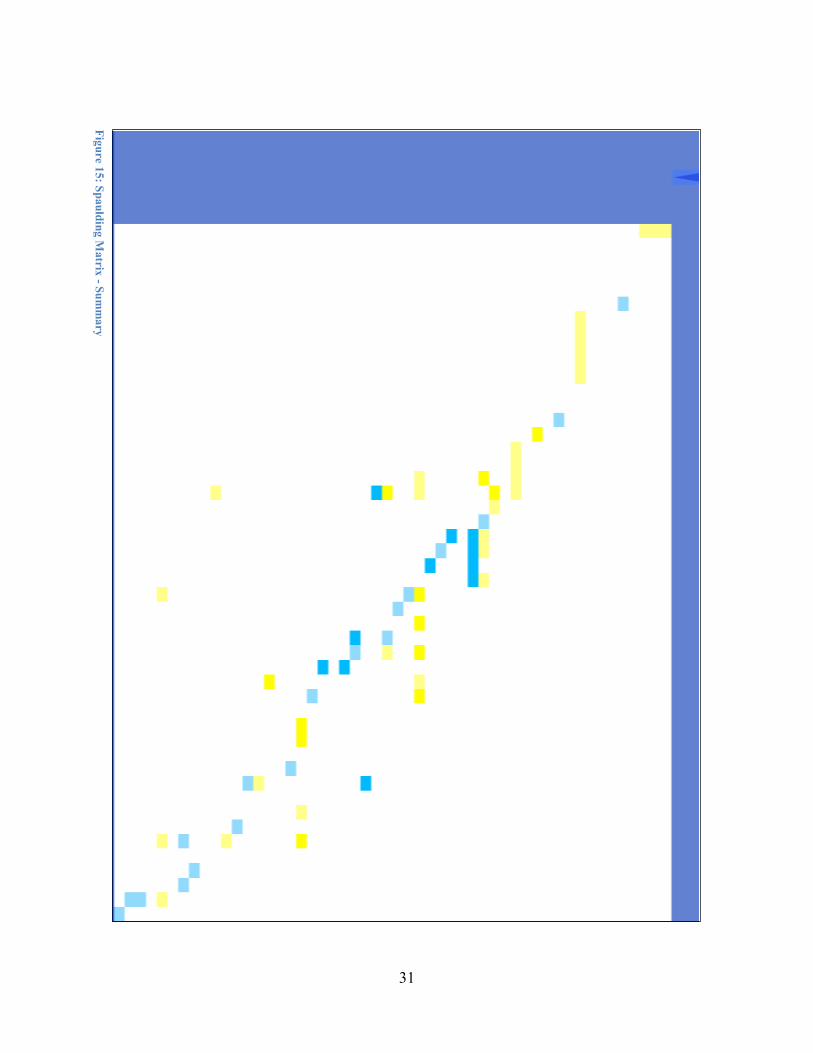
The summary view of the codings for Spaulding’s testimony is shown in Figure 15. With 52 alternatives and 48 criteria, the Spaulding matrix is difficult to see with labels on one screen, but the summary view reveals a more even balance between blue and yellow, suggesting equal amount of criticism and support. The summary view also reveals more of the staircase pattern, though some criteria are reused in later parts of the document. Long yellow dashes on the same line suggest heavy criticism leveled at the corresponding alternative. When followed by long blue lines immediately below, it often reflects the suggestion of a remedy for the preceding problem.
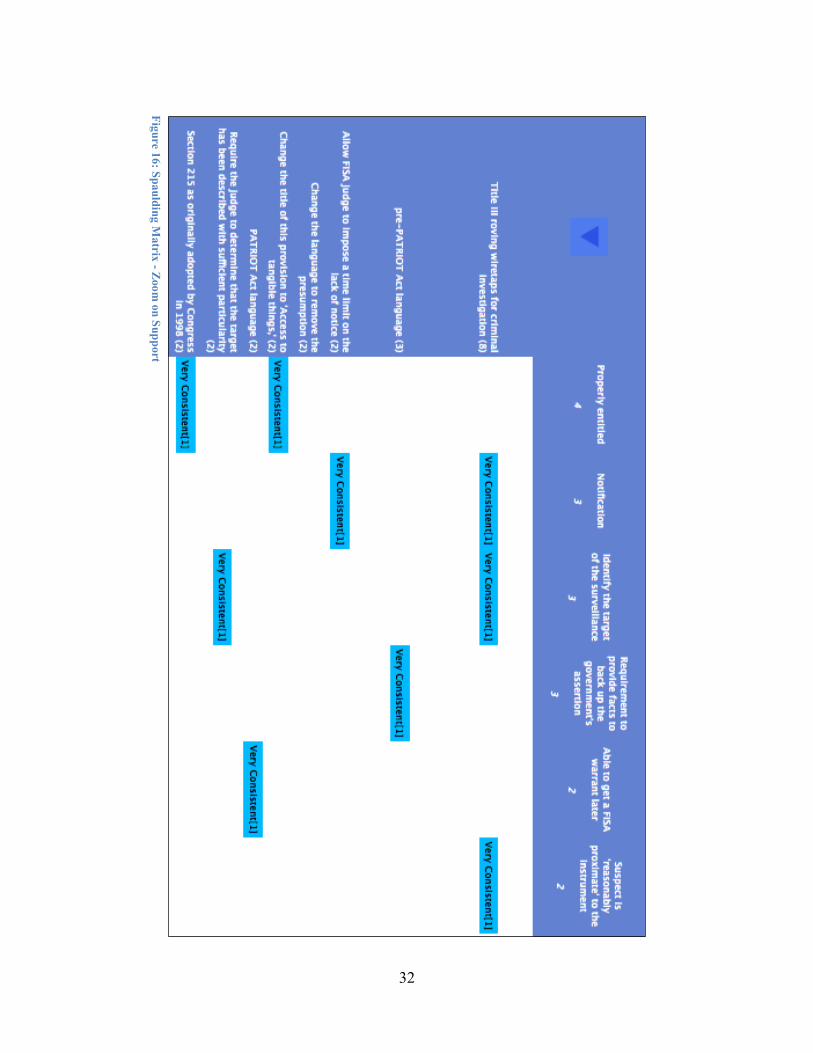
Performing the same sorting routines done on the Kris matrix, the visualization quickly reveals how the analyst coded the central features of what Spaulding supports and criticizes, and which criteria is used in the process. Examining the alternatives with the greatest support shown in figure 16 the analyst can observe support for law enforcement authorities, and modifications to PATRIOT Act authorities based on a mix of safeguards and oversight mechanisms.
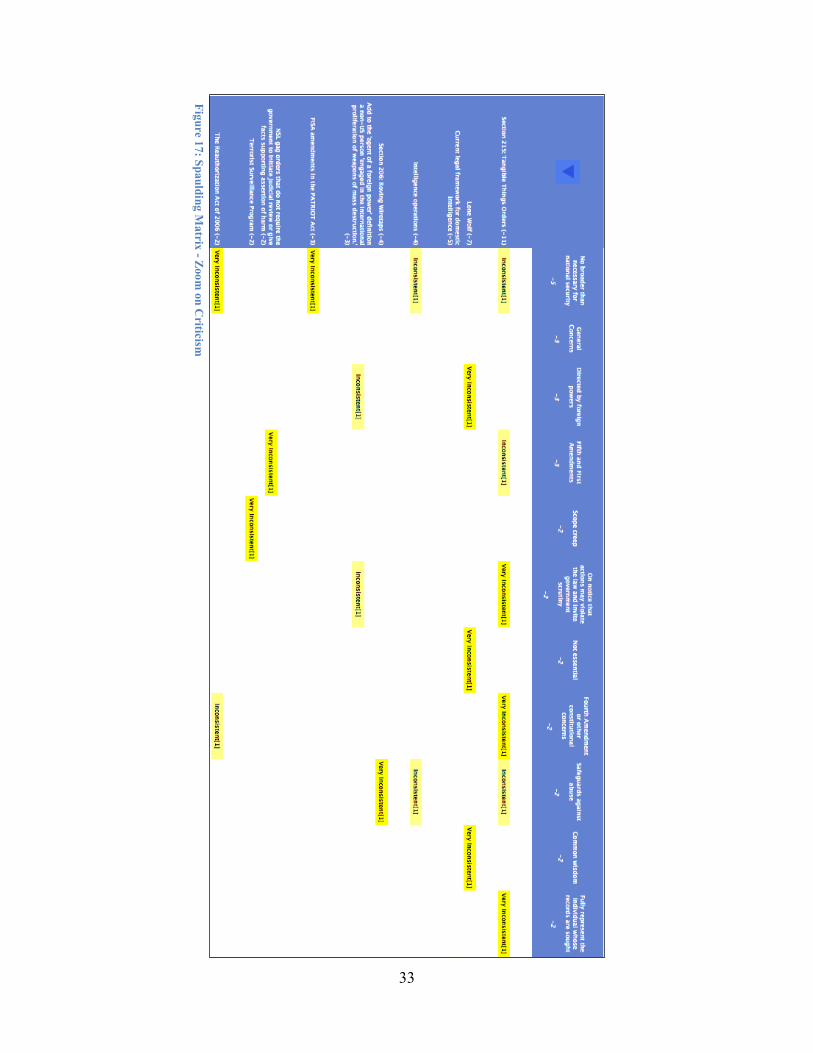
Reversing the sort allows the analyst to examine the alternatives for which Spaulding has the greatest criticism. Figure 17 reveals that, according to the analyst's coding, Spaulding has serious concerns regarding all three of the expiring provisions, as well as the current legal framework for domestic intelligence, intelligence operations in general, the original PATRIOT Act, NSLs, the Terrorist Surveillance Program, and the PATRIOT Reauthorization Act of 2006. Some of the most important criteria used to level these criticisms are the breadth of the authorities, encroachment on constitutional rights, the severity of the threat based on its source, safeguards against abuse, and the representation and notification of the individuals who are being surveilled.
31
Figure 15: Spaulding Matrix - Sum
mary
32
Figure 16: Spaulding Matrix - Z
oom on Support
33
Figure 17: Spaulding Matrix - Z
oom on C
riticism
34
Policy Matrix: Wainstein Testimony Ken Wainstein was also working in the private sector at the time of his testimony as a
Partner at O'Melveny & Myers LLP. Like Spaulding, however, he had an extensive prior record of public service in government. In fact, Wainstein had previously served in the same capacity as Kris as the AAG for National Security at the DOJ. Wainstein had also served as the Homeland Security Advisor for President Bush, General Counsel and Chief of Staff of the FBI, and a career federal prosecutor. Wainstein's testimony is similar in its orientation to that of Kris with a few important differences. First, since he was no longer in government at the time of the hearing, Wainstein could be less cautious about making statements that would be interpreted as representing the position of the new administration. Second, and closely related, is that because Wainstein held the same position as Kris in the previous administration, his views reflected the perspective that had defined the landscape that the new administration was inheriting. The symmetry of roles between these two experts was likely intended to provide a direct basis of bipartisan comparison.
Wainstein's testimony, like Kris' limits the discussion to the sunsetting provisions and does not open the door to discussions of broader reforms. A great deal of the testimony goes towards providing support for the decisions that had been made, and the justifications of the previous administration for the new authorities. The limited criticism is focused on the deficiencies of legislation predating the original PATRIOT Act, and the shortcomings which in Wainstein's opinion constrained national security investigations to the detriment of public safety. As with the previous examples, the matrices coded from Wainstein's testimony convey these features.
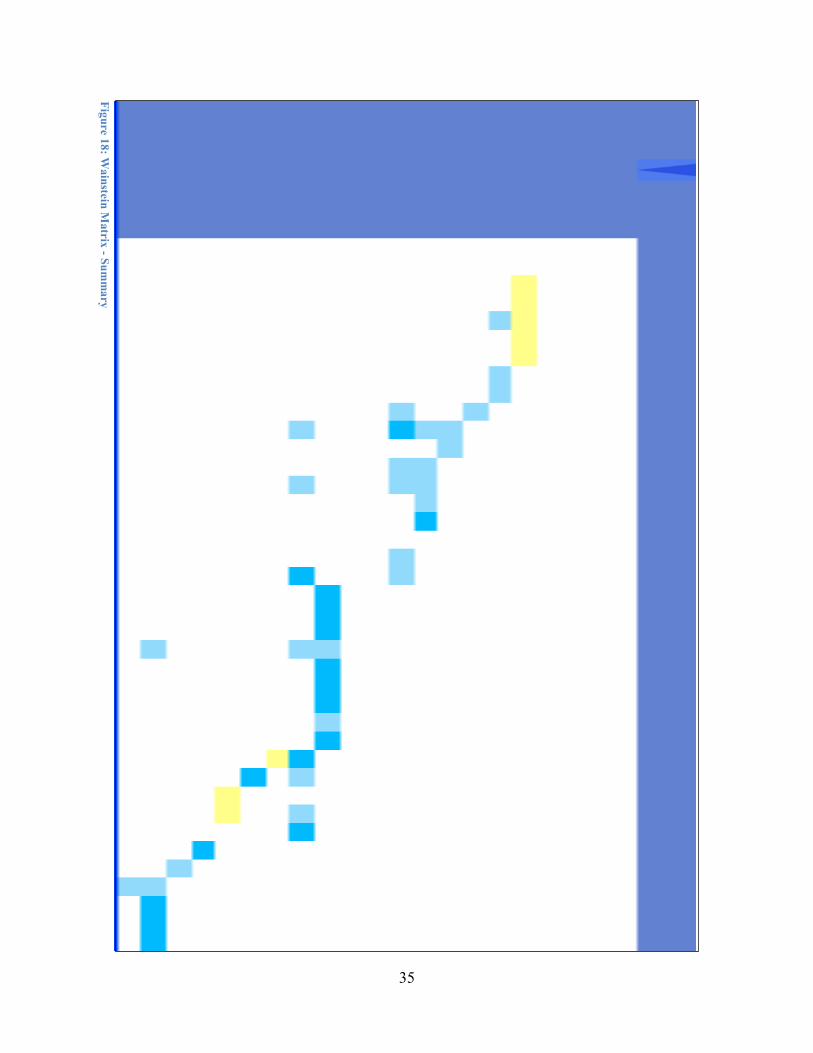
The Wainstein matrix is 21 alternatives by 39 criteria, and it too requires a summary view that hides the labels (Fig. 18). This matrix also illustrates an initial string of criticism, in this case pertaining to the pre 9/11 authorities, followed by support of the subsequent PATRIOT Act legislation in a blue stair case pattern.
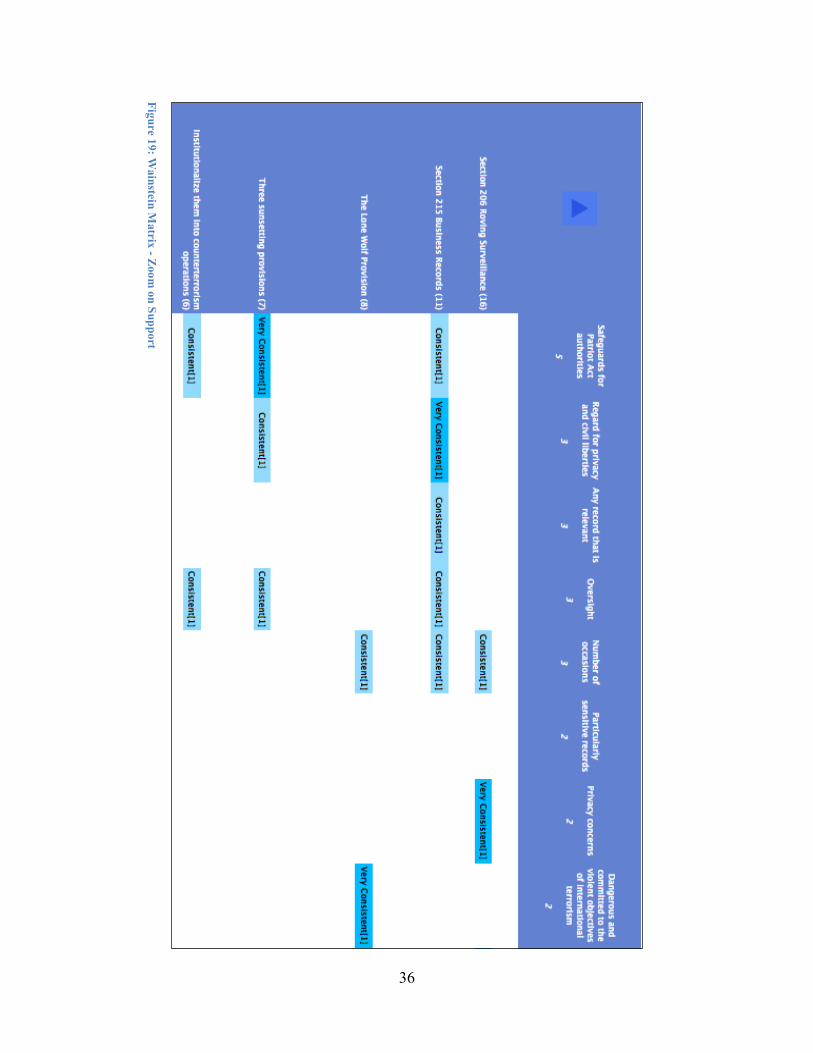
The alternatives having the greatest support according to the coding of Wainstein's testimony are shown in Figure 19. The view shows Wainstein's support for all three expiring provisions and the suggestion that beyond simply reauthorizing for a few more years, they should perhaps be made permanent and institutionalized into counterterrorism operations. The criteria that Wainstein uses for support include the existence of adequate safeguards, privacy and civil liberties protections, and oversight mechanisms, as well as a limited use of the authorities, and the dangers posed by 'lone wolves', despite the lack of a connection to a foreign power.
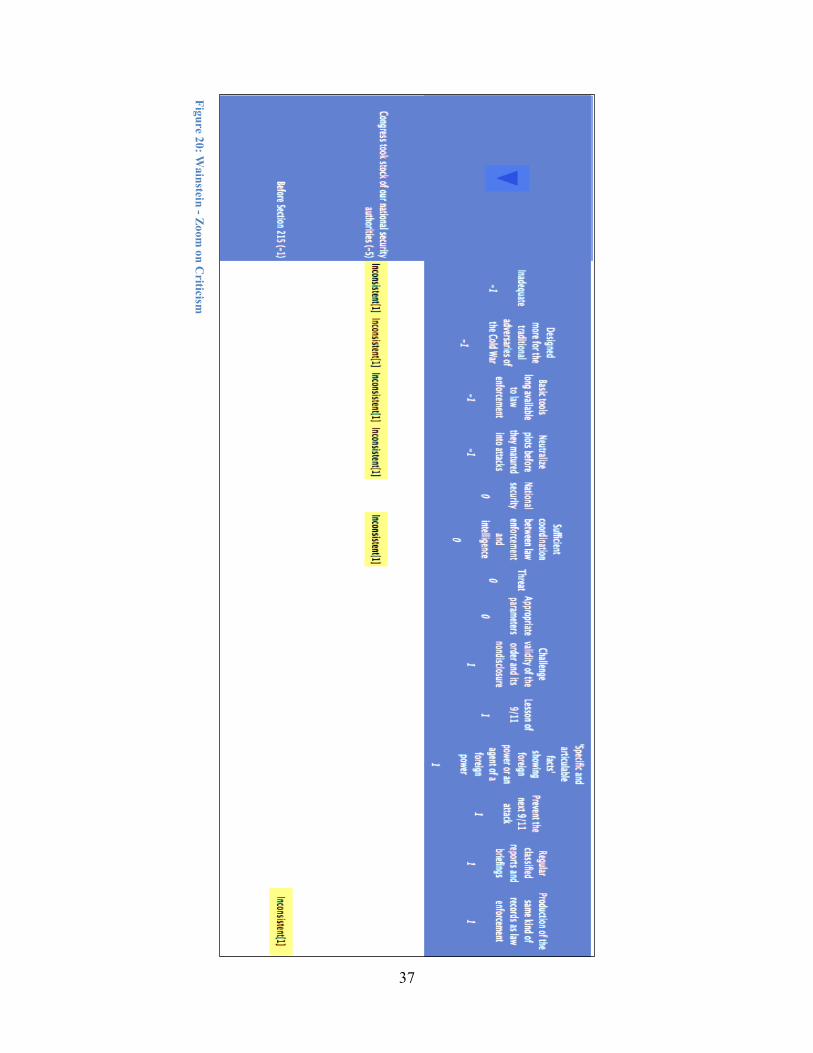
Wainstein's criticism is reserved for a very small number of alternatives all predating the original PATRIOT Act (Fig. 20). According to the analyst's coding of Wainstein's testimony, the focus was on the inadequacy of investigative authorities before the PATRIOT Act was passed, and the handicapping of national security personnel tasked with neutralizing plots before they matured into attacks by denying them the tools that law enforcement personal had available.
35
Figure 18: Wainstein M
atrix - Summ
ary
36
Figure 19: Wainstein M
atrix - Zoom
on Support
37
Figure 20: Wainstein - Zoom
on Criticism
38
Policy Matrix: Graves Testimony At the time of the hearing Lisa Graves was the Executive Director of The Center for
Media and Democracy: “a nonprofit dedicated to promoting transparency and informed debate by exposing government propaganda and corporate spin.” She had previously served as the Senior Legislative Strategist for the American Civil Liberties Union (ACLU), and as Chief Nominations Counsel for the Chair of the hearing, Senator Leahy. Graves had also served as the Deputy Chief of the Article III Judges Division of the US Courts, and Deputy AAG in the Office of Legal Policy/Office of Policy Development at the DOJ. Graves' commitment to the protection of civil liberties and concern regarding oversight of investigative authorities is made evident in her testimony.
Of all of the witnesses offering testimony, Graves makes the greatest effort to expand the policy window as far as possible. Graves makes her case for the consideration of broad reforms of investigative authorities, and expresses support for two bills recently introduced to provide elements of such reform. One of the bills was introduced by Senator Russ Feingold, and the other by the Chair of the committee hearing, and her former boss, Senator Leahy. Graves' adamant rejection of the suggestion to limit the debate to the sunsetting provisions is reflected both in the substantial portion of her testimony dedicated towards other matters such as the use of NSLs in hundreds of thousands of cases, and Suspicious Activity Reports in millions of instances, which she views as meriting much greater attention than the hundreds of uses of Section 215 orders. The matrices coded from Graves' testimony depict several of these dimensions.
With 63 alternatives and 94 criteria, the Graves matrix also requires a summary view for display of the entire matrix (Fig. 21). This view shows a great deal of yellow in comparison to blue, as well as the staircase pattern suggesting an iteration of alternatives and criteria used to criticize them. A particularly long stretch of yellow in the middle corresponds to the use of NSLs.
Figure 22 illustrates the alternatives that the analyst has coded Graves as supporting in her testimony. Two reform bills, one by Senator Feingold, and one by Senator Leahy (the chair of the hearing), garner praise for the additional oversight they would provide. Graves also suggests several modifications that would narrow the scope of the authorities, and provide greater accountability.
The focus of the criticism coded by the analyst from Graves' testimony is largely, but not exclusively, on the use of NSLs (Fig. 23). Criticisms for NSLs include their use against US citizens, and the large number of letters that were used. Criticism is also leveled at Section 215 orders for third party records which can be justified by an individual's mere contact with a suspect, and require the FISA judge to presume relevance of the information sought to an investigation. Other criticisms are pointed at the Reauthorization of the PATRIOT Act in 2006, and the FBI's use of data brokers, and data warehousing techniques.

39
Figure 21: Graves M
atrix - Summ
ary

40
Figure 22: Graves M
atrix - Zoom on Support
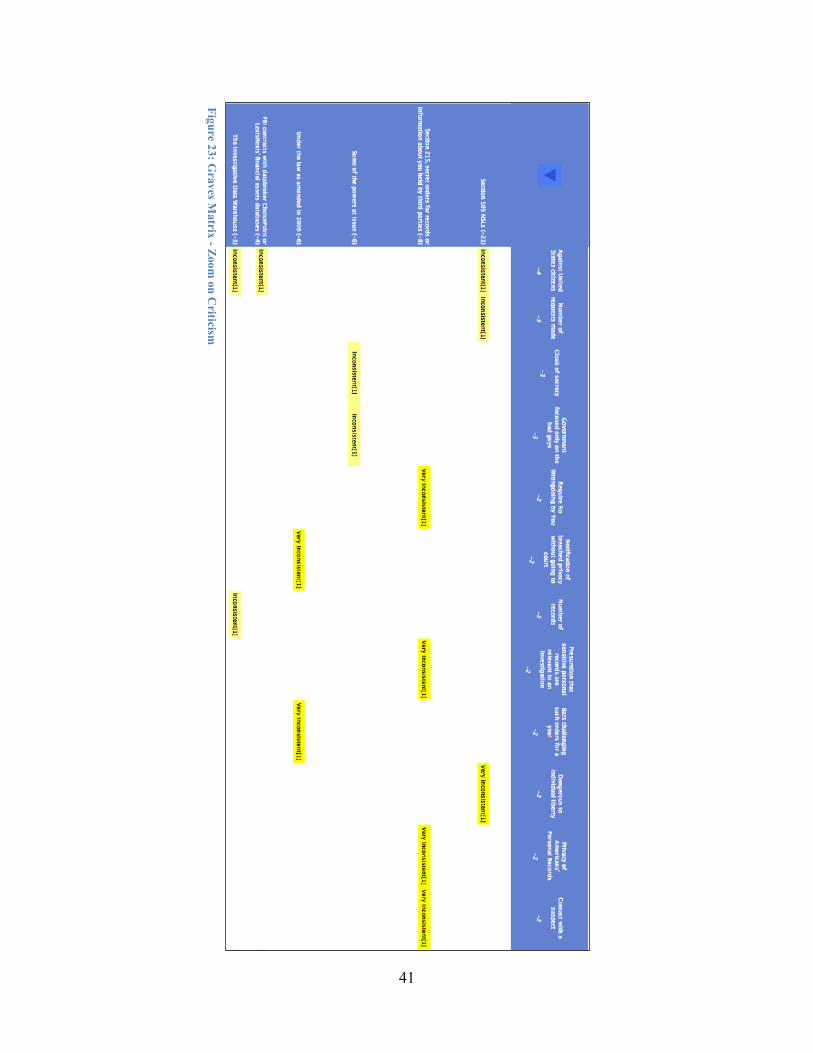
41
Figure 23: Graves M
atrix - Zoom on C
riticism
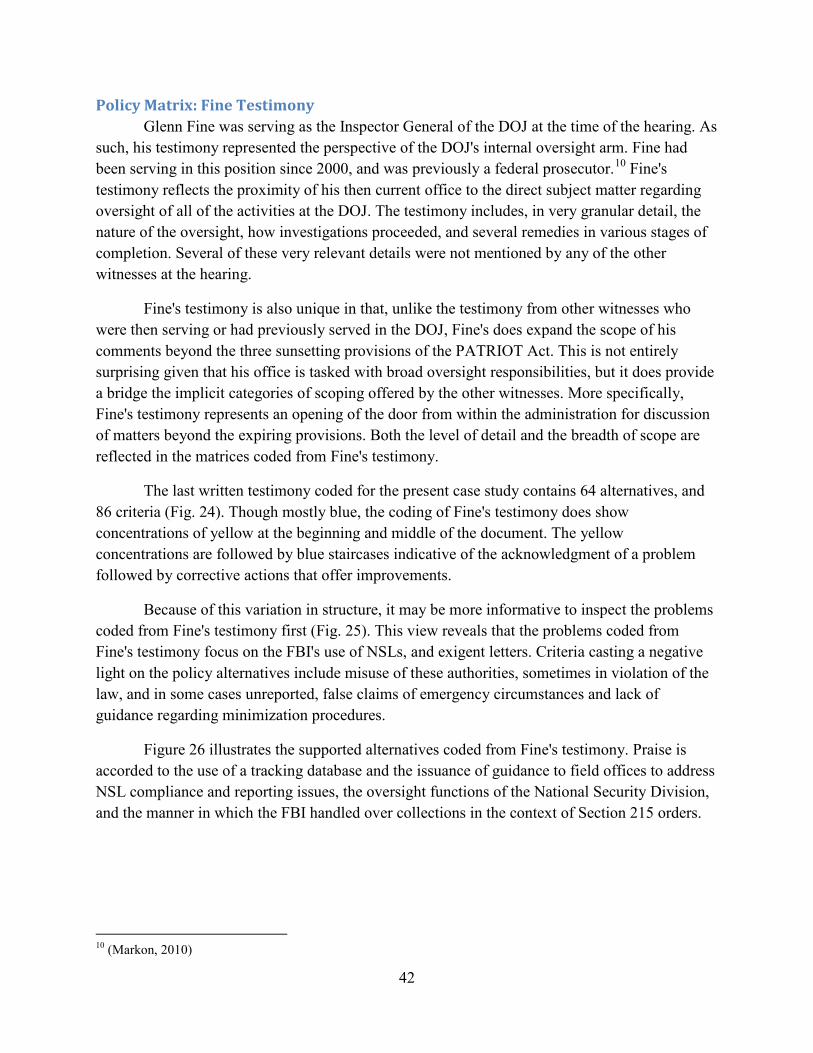
42
Policy Matrix: Fine Testimony Glenn Fine was serving as the Inspector General of the DOJ at the time of the hearing. As
such, his testimony represented the perspective of the DOJ's internal oversight arm. Fine had been serving in this position since 2000, and was previously a federal prosecutor.10 Fine's testimony reflects the proximity of his then current office to the direct subject matter regarding oversight of all of the activities at the DOJ. The testimony includes, in very granular detail, the nature of the oversight, how investigations proceeded, and several remedies in various stages of completion. Several of these very relevant details were not mentioned by any of the other witnesses at the hearing.
Fine's testimony is also unique in that, unlike the testimony from other witnesses who were then serving or had previously served in the DOJ, Fine's does expand the scope of his comments beyond the three sunsetting provisions of the PATRIOT Act. This is not entirely surprising given that his office is tasked with broad oversight responsibilities, but it does provide a bridge the implicit categories of scoping offered by the other witnesses. More specifically, Fine's testimony represents an opening of the door from within the administration for discussion of matters beyond the expiring provisions. Both the level of detail and the breadth of scope are reflected in the matrices coded from Fine's testimony.
The last written testimony coded for the present case study contains 64 alternatives, and 86 criteria (Fig. 24). Though mostly blue, the coding of Fine's testimony does show concentrations of yellow at the beginning and middle of the document. The yellow concentrations are followed by blue staircases indicative of the acknowledgment of a problem followed by corrective actions that offer improvements.
Because of this variation in structure, it may be more informative to inspect the problems coded from Fine's testimony first (Fig. 25). This view reveals that the problems coded from Fine's testimony focus on the FBI's use of NSLs, and exigent letters. Criteria casting a negative light on the policy alternatives include misuse of these authorities, sometimes in violation of the law, and in some cases unreported, false claims of emergency circumstances and lack of guidance regarding minimization procedures.
Figure 26 illustrates the supported alternatives coded from Fine's testimony. Praise is accorded to the use of a tracking database and the issuance of guidance to field offices to address NSL compliance and reporting issues, the oversight functions of the National Security Division, and the manner in which the FBI handled over collections in the context of Section 215 orders.
10 (Markon, 2010)
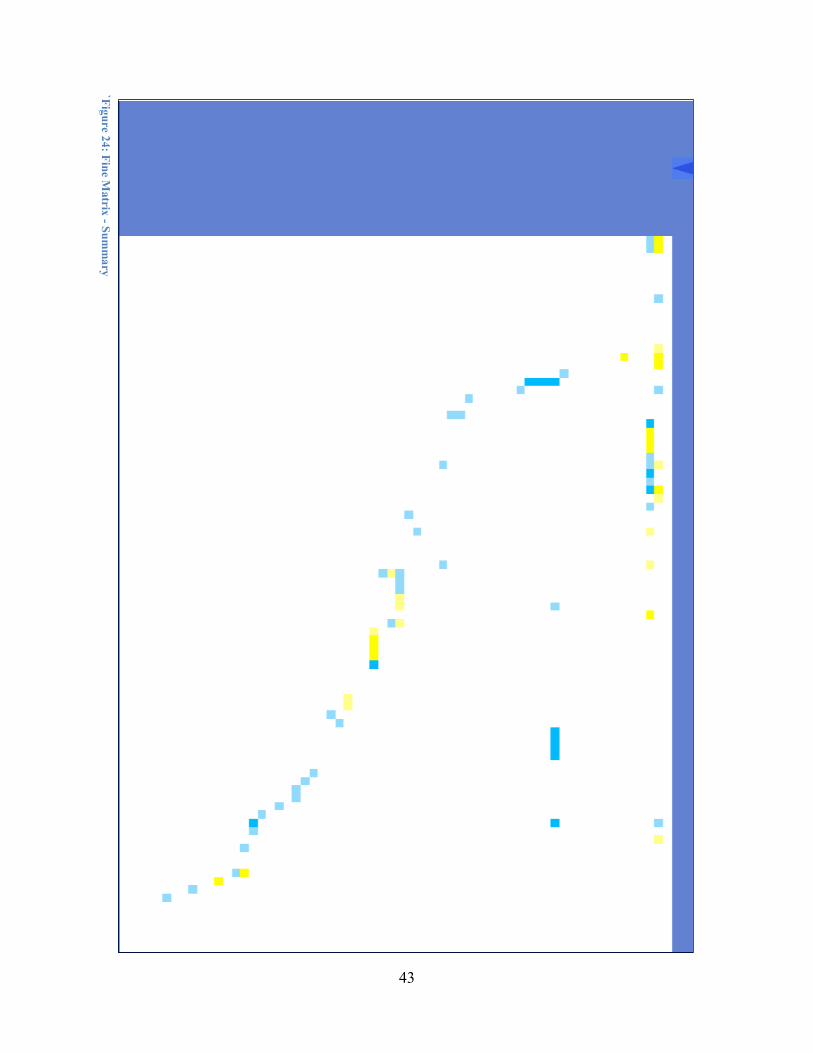
43
`Figure 24: Fine Matrix - Sum
mary
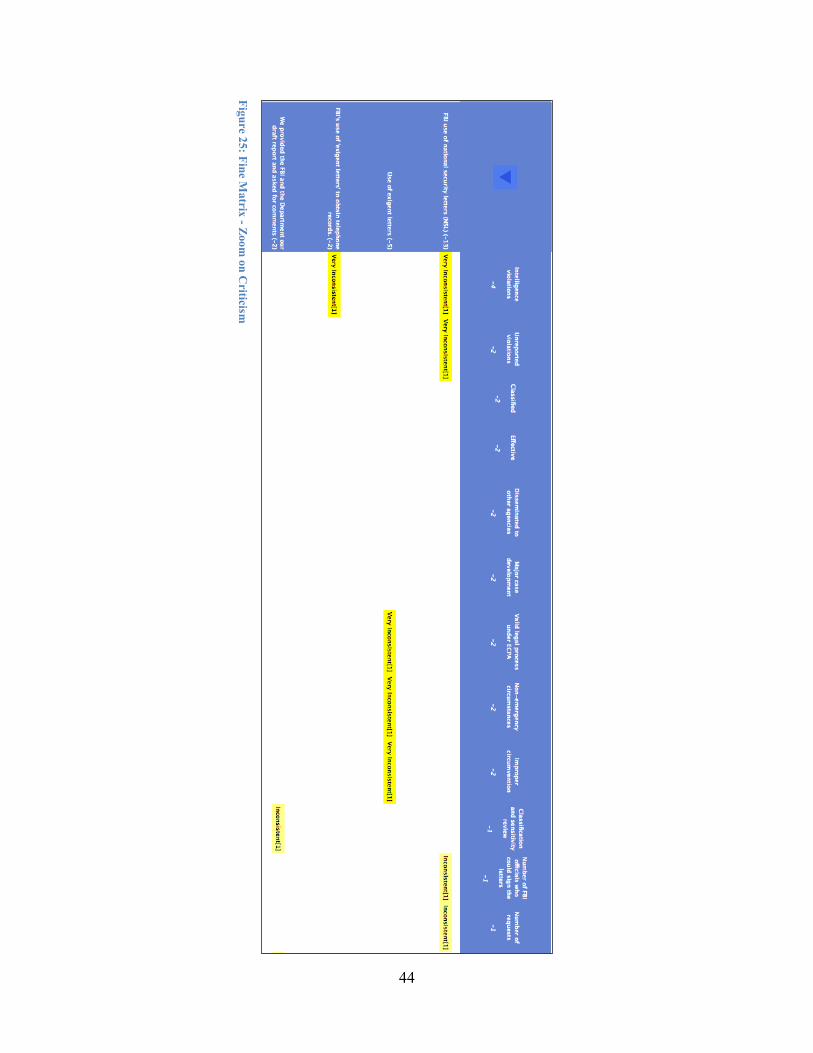
44
Figure 25: Fine Matrix - Zoom
on Criticism
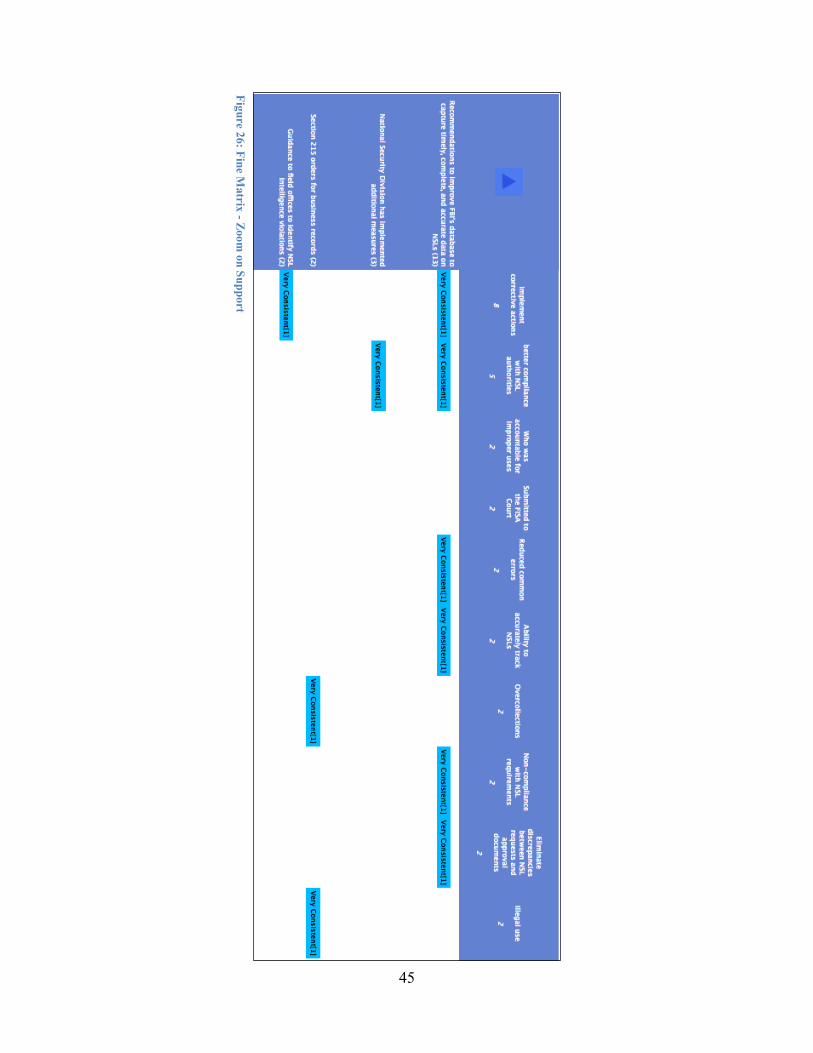
45
Figure 26: Fine Matrix - Zoom
on Support
46
Group Matrix The ACH system allows multiple users to rate symmetric evidence and hypothesis
matrices. For policy matrices the alternatives and criteria are unlikely to be symmetric across different analysts. However, the ACH system allows for several matrix comparison operations that should be preserved. In order to be able to reuse the design, new documents are treated as different users in the policy matrix system. In a given project, criterion and alternatives from all users will be displayed in the master matrix. The ACH comparison operations are preserved by allowing for the establishment of linked criteria and linked alternatives. Criteria and alternatives that are linked will be hidden in the group matrix while the projected outcomes and associated ratings will be carried in the row and column to which they are linked.
One important effect of the linkages emerges from the additional step that is required by the analyst to merge or link similar criteria, and similar alternatives together. Within these groupings, the contributions from each source will vary in a non-random manner distribution revealing criteria or value groupings addressed or neglected by the various input documents.
The most important effect of creating these linkages is that any given cell might contain multiple analyst ratings tied to projected outcomes coded from the source documents. The ACH methodology anticipates the need to reveal consensus and disagreement between analysts' ratings, and the linkages allow the same operation to be performed in POMs.
Linking Alternatives and Criteria As anticipated, the extracted matrix was extremely sparse, as were projected outcomes
for each combination of alternative and criterion. A first step to address the sparsity of alternatives and criteria was to allow instances to be manually grouped by the analyst. A manual grouping could be performed if the analyst determined that several alternatives were identical, despite being described differently, or if they were related closely enough to warrant grouping.
Linking alternatives is straightforward if the requirement is that the link refers to exactly the same alternative. A tradeoff exists between relaxing the requirement to allow related alternatives, which would be less deterministic, but might reveal more insights when intersected with other sources. Ensuring consistency across analysts using this method as a team might require making the balance explicit, but the choice of balance might vary across different teams using the method for different applications. An example of a set of alternative linkages coded in this case studies is "Section 206: Roving Wiretaps", first encountered in the Kris testimony.
Figure 27 is an example of how the linkages are represented in the system. On this page, the text label shown in the “Alternative” field was derived from the text taken directly from Kris' testimony and shown in the “Details” field. This list is an example where the exact same policy alternative was coded from the testimony of Spaulding, Wainstein and Graves, and has therefore been linked to the original appearance in Kris. This operation will cause all of the rows in the
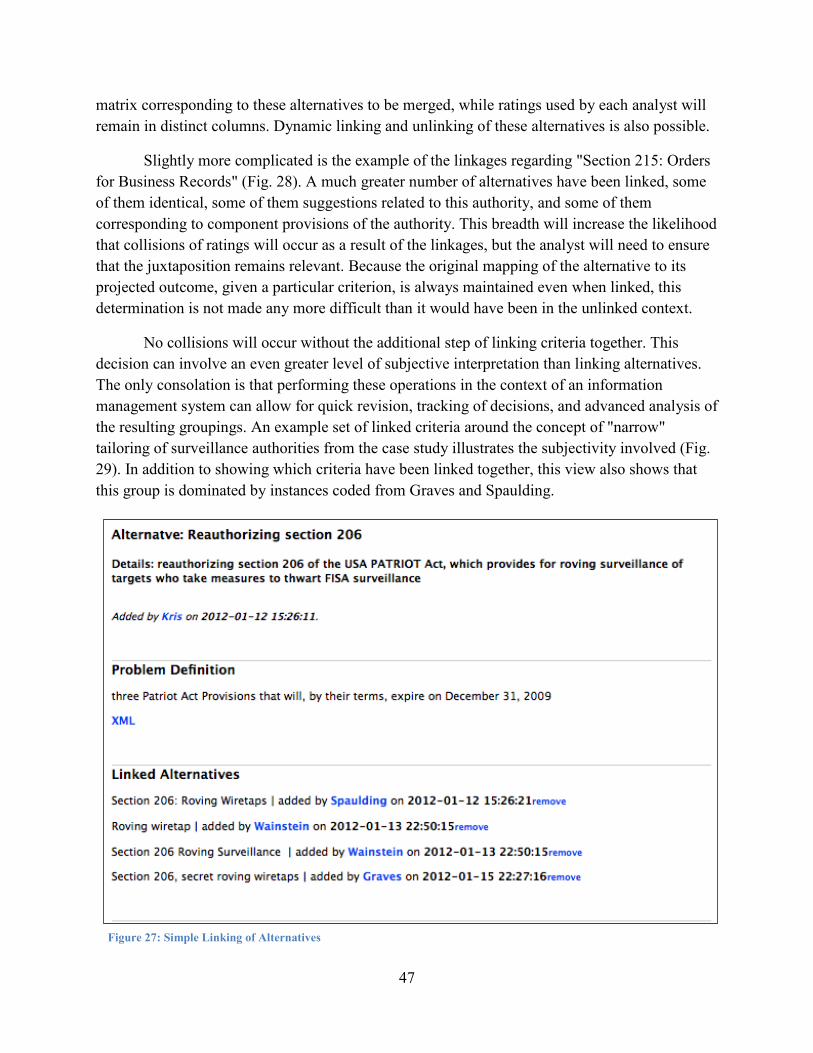
47
matrix corresponding to these alternatives to be merged, while ratings used by each analyst will remain in distinct columns. Dynamic linking and unlinking of these alternatives is also possible.
Slightly more complicated is the example of the linkages regarding "Section 215: Orders for Business Records" (Fig. 28). A much greater number of alternatives have been linked, some of them identical, some of them suggestions related to this authority, and some of them corresponding to component provisions of the authority. This breadth will increase the likelihood that collisions of ratings will occur as a result of the linkages, but the analyst will need to ensure that the juxtaposition remains relevant. Because the original mapping of the alternative to its projected outcome, given a particular criterion, is always maintained even when linked, this determination is not made any more difficult than it would have been in the unlinked context.
No collisions will occur without the additional step of linking criteria together. This decision can involve an even greater level of subjective interpretation than linking alternatives. The only consolation is that performing these operations in the context of an information management system can allow for quick revision, tracking of decisions, and advanced analysis of the resulting groupings. An example set of linked criteria around the concept of "narrow" tailoring of surveillance authorities from the case study illustrates the subjectivity involved (Fig. 29). In addition to showing which criteria have been linked together, this view also shows that this group is dominated by instances coded from Graves and Spaulding.
Figure 27: Simple Linking of Alternatives
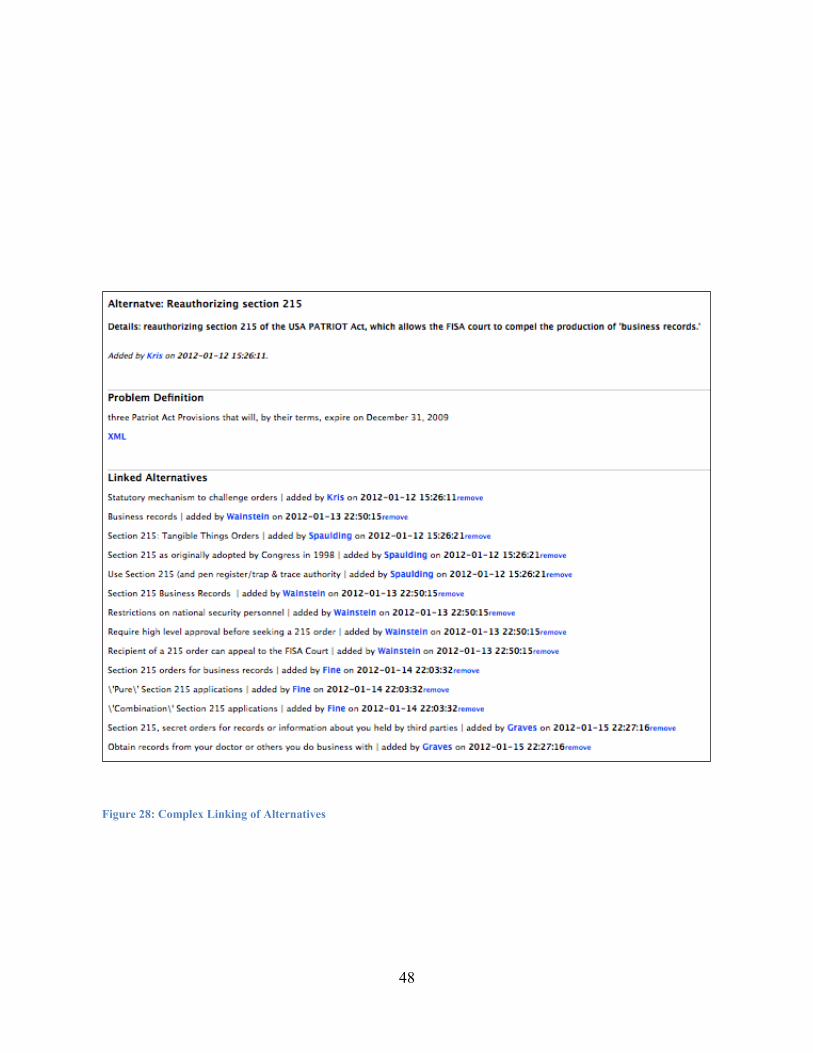
48
Figure 28: Complex Linking of Alternatives
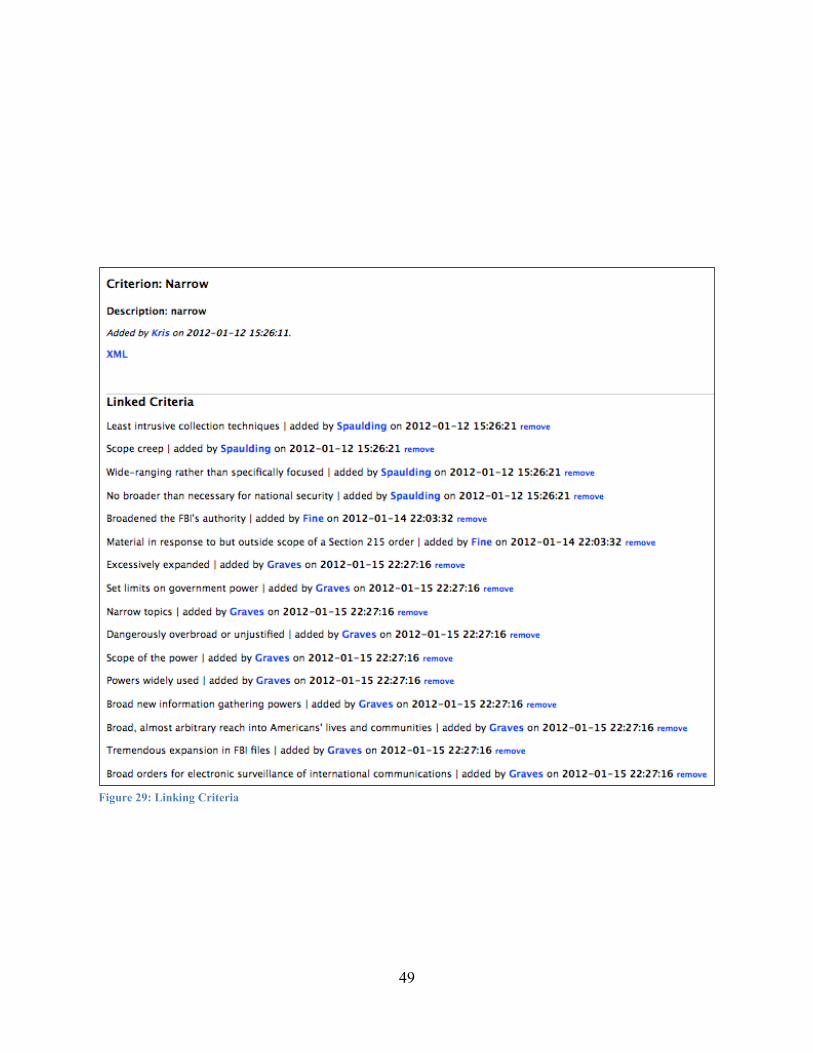
49
Figure 29: Linking Criteria

50
The Group View Once the links have been established between similar alternatives and across similar
criteria, the payoff is that the ACH methodology will reveal consensus or disagreement between analysts with regard to their ratings of the projected outcomes. ACH calculates the standard deviation between all of the ratings in a given cell, and color codes the cell according to the magnitude of the standard deviation in order to express the degree of consensus. In the present case study, the combined matrix of 183 alternatives and 257 criteria was reduced to a group matrix with 34 alternatives and 24 criteria via the linking process. The summary view in figure 30 shows a top level representation of the consensus between ratings coded from all documents.
Figure 31 highlights the alternatives with the least support. An important observation is that none of the expiring provisions show up in the list of the most heavily criticized alternatives. They are, of course, technically part of the 'current statutory scheme' which does contain cells with significant disputes, but the alternatives in this grouping are more general and therefore representative of the entire set of domestic intelligence authorities. We also see that the most negatively coded criteria focus on safeguards against abuse, overly broad powers, lack of protection for constitutional rights, and the evidentiary burden for the use of these powers.
In addition, we see that the area of greatest dispute in this cluster is at the intersection of the current statutory scheme and the need for safeguards against abuse. We can examine this dispute further to see what the component ratings are, and what linkages were used. Figure 32 shows that Spaulding finds safeguards in intelligence operations lacking in comparison to criminal investigations where successful prosecution could be at risk. Wainstein points out that in addition to the safeguards in the original PATRIOT Act, two of the authorities were augmented with new and substantial safeguards. Finally, Graves questions the validity of the whole process because she views some of the 'facts' that have been offered in the context of the debates regarding these powers as deliberately misleading or outright propaganda.
Figure 33 shows alternatives coded as having the most support. All three of the expiring provisions are in this list of alternatives, even though two of them have resulted in extreme disputes in the coding of the testimony offered regarding their reauthorization. Of all three provisions, the roving wiretap seems most favored, having generated criticism only in the category of criteria related to the legitimacy of the targets. Section 215 orders generated the greatest amount of dispute regarding how effective an authority it is, the legitimacy of the targets, and whether the constitutional rights of the targets were protected by existing safeguards. Many of the modifications coded from the testimony received positive ratings, but they also generated dispute in the category of criteria related to corrective actions.
A key dispute regarding Section 215 orders can be explored further, revealing the underlying disagreement. Figure 34 is an example of higher resolution of cells in the group view. The headings describe the base alternative and criteria to which the others were linked. Below the headings is a split view table. The top half of each column in the table represents a linked
51
alternative, criterion, and projected outcome merged into the given group cell. The bottom half of the table is populated with the corresponding rating in the row associated with the analyst to which it was linked. In the example in figure 34, the first column corresponds to the data coded from Kris, the second column corresponds to the data coded from Spaulding, and the third column corresponds to the data coded from Wainstein. At the very bottom of this view, the standard deviation of the set of linked rating scores is shown. This score forms the basis for the color coding of the level of dispute in the group matrix.
Focusing on the content of the cells in this view reveals that both Kris and Wainstein reference the availability of a statutory mechanism to challenge Section 215 orders, and the fact that no recipient has ever done so as evidence that reauthorizing these orders would be consistent with protection of the constitutional rights of the subject of the records being sought. A challenge to this argument has been coded from Spaulding's testimony where she points out that the recipients of these orders are usually not the subjects of the records themselves. Instead they are most often third party record holders, who inherit the burden of overcoming a presumption of relevance if they wish to challenge the order. She claims that the burden of overcoming the presumption and the fact that the hearing is conducted in an ex-parte setting, where the subject of the records being sought is not actually present, make it difficult to claim that the constitutional rights of the subject of the record are being fully represented.
V. Conclusions The USA PATRIOT Act case study has revealed several findings regarding applicability
of structured analytic techniques from the intelligence community to general problems of policy analysis. Though this study did not include user testing of the system, the first set of findings highlights the successful mapping of ACH features to the steps of TEP in pursuit of the original design objectives. The next set of conclusions considers the method's contribution to the analysis of the content from the PATRIOT Act case study. Finally, though the case study was driven with the policy analyst as the primary user, policy analysts must often perform several more specific tasks. Suggestions of how such tasks can be performed using this methodology are also offered.
Meeting Design Objectives Based on the symmetry between the matrix in ACH, and the TEP matrix, it was a
reasonable expectation that the same benefits derived from ACH for intelligence analysis could also be extracted for policy analysis. The experience of using the PATRIOT Act case study as a test leads to an initial, albeit unsubstantiated, claim that those benefits were in fact captured. In order to validate this claim, another study would be required to test the new method developed in this dissertation. Even though such a test was beyond the scope of this research, it might involve a control group without access to the collaborative tool, and a test group with access. Both would be given the same analysis task and source material. Comparing the performance of these groups would be a first step to measuring the contribution of the method to policy analysis.
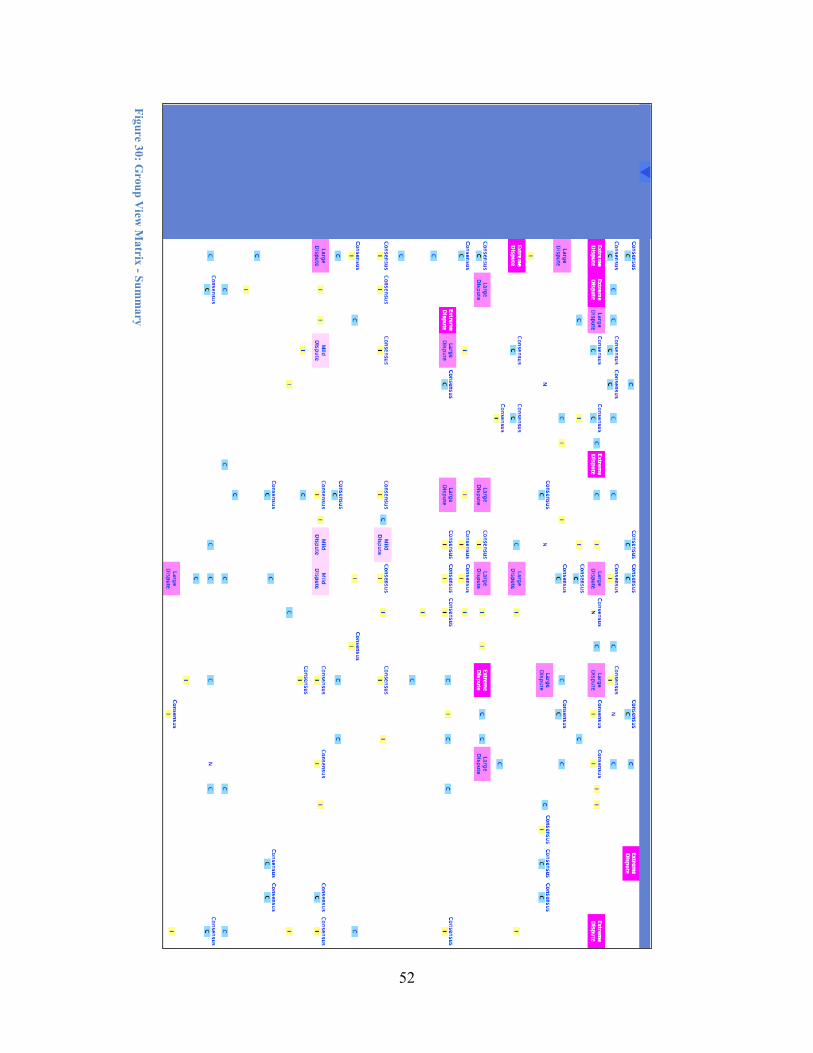
52
Figure 30: Group V
iew M
atrix - Summ
ary
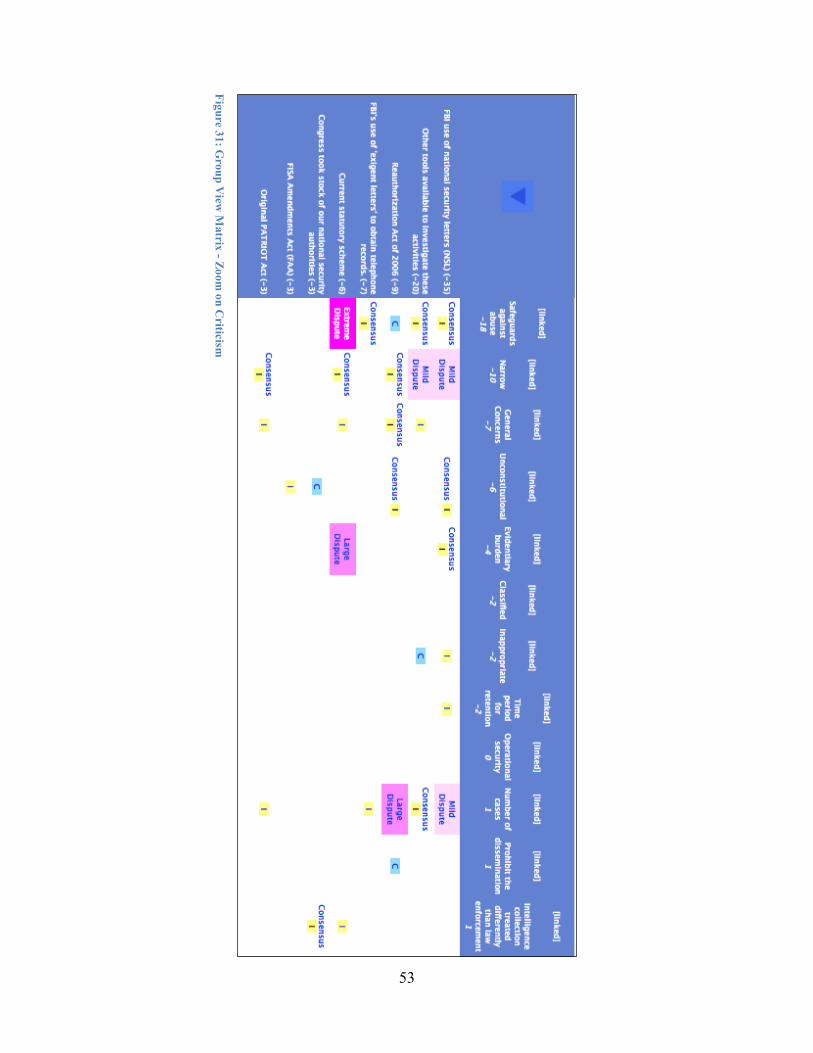
53
Figure 31: Group V
iew M
atrix - Zoom on C
riticism
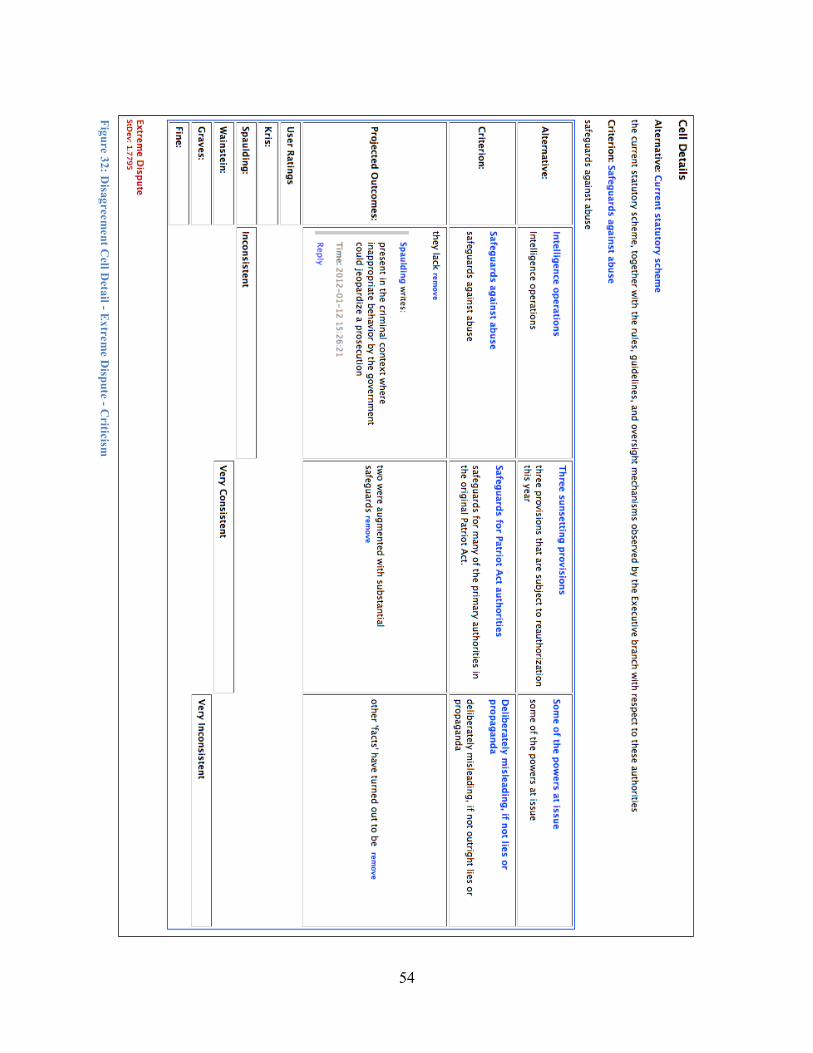
54
Figure 32: Disagreem
ent Cell D
etail - Extreme D
ispute - Criticism
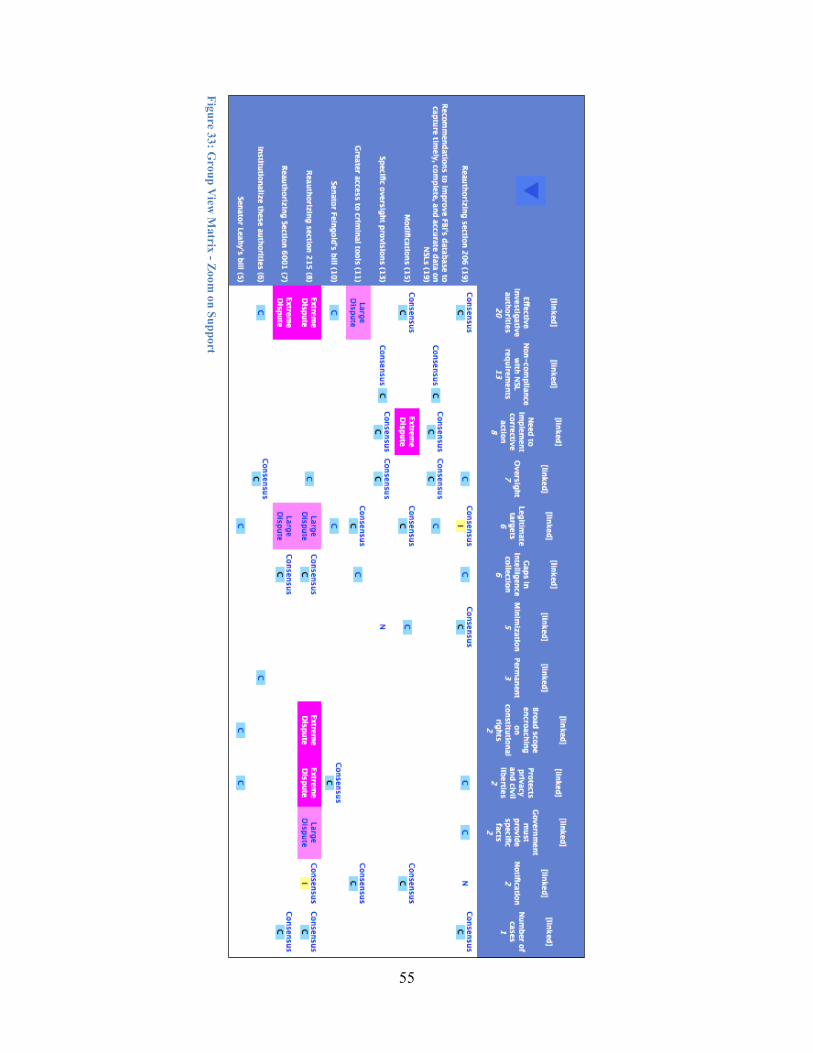
55
Figure 33: Group V
iew M
atrix - Zoom on Support
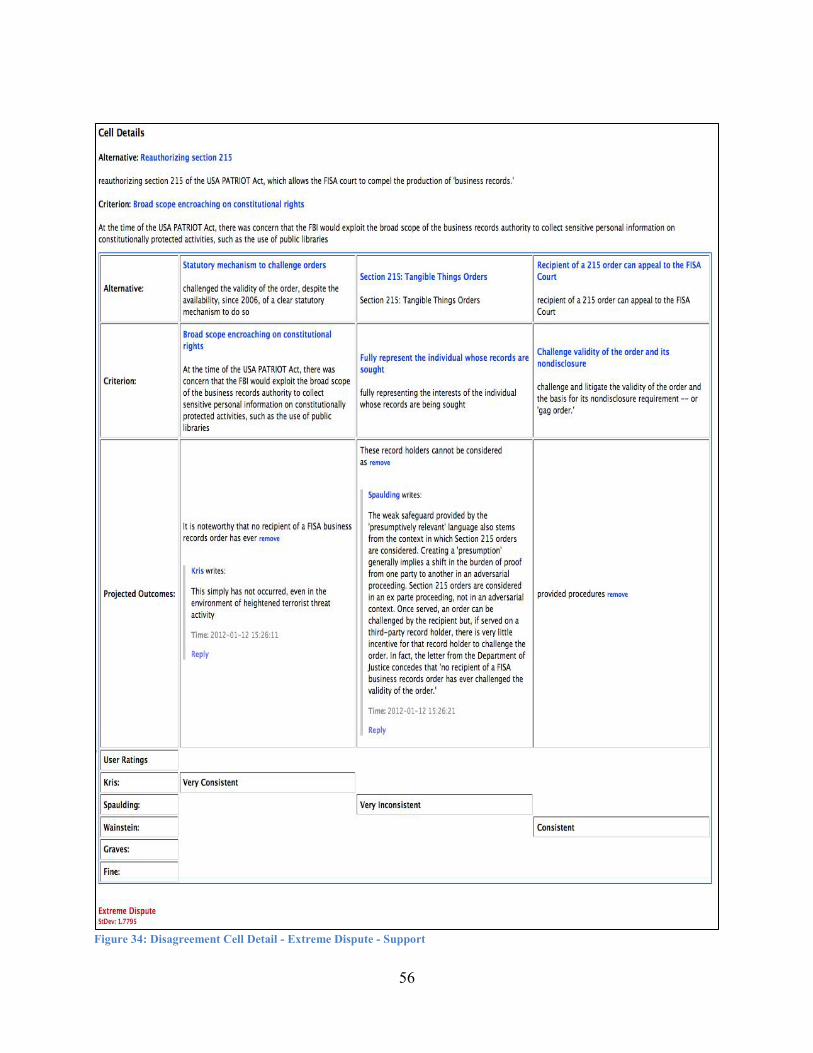
56
Figure 34: Disagreement Cell Detail - Extreme Dispute - Support
57
Despite deferring these questions of the specific empirical measurements of the effectiveness of this new method of policy analysis, some important observations reviewing how several of the design features were implemented in the system can still be made. The first desired goal was to represent a policy argument at multiple levels of resolution. The current system achieves this goal by providing three levels of analysis. At the most granular level the system displays a specific coding of a projected outcome, its corresponding alternative and criterion, and any supporting evidence, as well as a rating for whether the outcome is positive or negative with regards to the criterion. Within the scope of an entire document, the analyst's matrix represents all such ratings spatially mapped to the rows and columns corresponding to the alternatives and criterion, while hiding the evidence, and projected outcomes themselves. Finally, given a corpus of documents and an intermediate linkage step, the aggregate group view represents the ratings of all of the analysts across all intersections of alternatives and criteria. These layers of abstraction allow the user to see the big picture context of the policy argument, while still being able to drill down to the details of each component.
The ability of the design to reveal the degree of consensus across the codings of the different source documents is not surprising, again given the congruence between the ACH matrix and the POMs. However, one significant difference in the intent of the ACH methodology and the manner in which it was applied here prevented the goal of coverage analysis from easily being attained. That difference is that in classical ACH use, the different 'users' are actual analysts who have the specific goal of evaluating each piece of evidence with regard to each hypothesis. Such analysts are working in a team, and can therefore be instructed to give attention to each cell in the matrix. In the PATRIOT Act case study, the 'user' represents an analyst's coding, using TEP as a schema, of a source document corresponding to congressional testimony from one source. This testimony was not prepared specifically for ACH-style analysis and as a result the resulting matrices exhibited a tendency towards being extremely sparse. This expectation of a significant lack in complete coverage across all sources at each intersection was a significant driver of this study, and the initial results, although untested with regards to the external validity of the codings and the linkage step, seem to confirm this expectation.
Another significant driver of this methodology was the desire to bring systematic and objective analysis to bear on problems that involve a great deal of subjective value judgments. The system that emerged succeeded in some ways with respect to this objective, but failed in others. Among the successes are the abilities to trace each coding represented in the system back to the source material, and therefore to state empirically how much of the source material was coded as part of the analysis. This is an important contribution whose significance should not be underestimated. Coding every sentence of a source document is a tedious and time consuming process, but it avoids the pitfalls of allowing an analyst to cherry pick out of context selections of text that support their argument, while ignoring nuances, reservations, caveats and even direct criticism that do not. Furthermore, the artifact created by using this extraction process allows for important qualitative components of the source document to be communicated quickly. Creating
58
a list of the alternatives referenced, and the criteria suggested in the context of a policy debate, provides an important point of reference that provides analysts with an orientation towards the current stakeholders and the problem definitions they offer, as well as scaffolding from which to build future analysis of the same or similar issues.
Unfortunately, the current methodology introduces two sources of uncertainty and subjectivity. The first is the significant disagreement that might exist between analysts in the initial coding of the source documents according to the eightfold path ontology. This ontology is untested in terms of its reliability as a coding schema. It is almost a certainty that different analysts given the same source document and instructions to use the eightfold path schema would produce codings that were not identical, even if they were trained in the eightfold path methodology. What is uncertain is how substantial this disagreement might be. Fortunately, inter coder reliability tests could provide a baseline, and therefore reduce methodological concerns regarding this step.
The second source of uncertainty is introduced in the linkage step of the methodology. As with the initial coding, different analysts given the same instructions might link alternatives and criteria into groups that are not identical. Several clustering algorithms based on computational linguistics could produce deterministic and somewhat reliable groupings. However, such automated techniques might be overly aggressive and group concepts that are actually separate. Or they may be too cautious and miss groupings that require deeper reading of the text or context. It is a consolation, however, that the groupings, though subjectively produced, are easy to inspect for inconsistencies and adjust manually. Making the groupings explicit is, at least, a major improvement over ambiguously drawing comparisons between similar elements of overlapping analyses on undocumented subjective bases.
Content The following analysis of the content of the case study materials was enabled by the
policy outcome matrix methodology derived from ACH. These findings, though not the focus of the research itself, nevertheless illustrate the vast amount of information processing capabilities that are required. Without the methodology and an information management system that supported this level of granular analysis, the barriers would have been virtually insurmountable and would have prevented the same level of breadth and depth.
Enumerating Issues of Disagreement Table 2 summarizes all 21 instances of disagreement that resulted from the coding of the
written testimony from the congressional hearing. The first column indicates how many ratings were ultimately linked in the group view, and the second column indicates the standard deviation across the scores associated with the ratings. The value of the standard deviation is used as the threshold for ‘mild’, ‘large’, and ‘extreme’ disputes, and it is set at .25, 1, and 1.75 respectively.
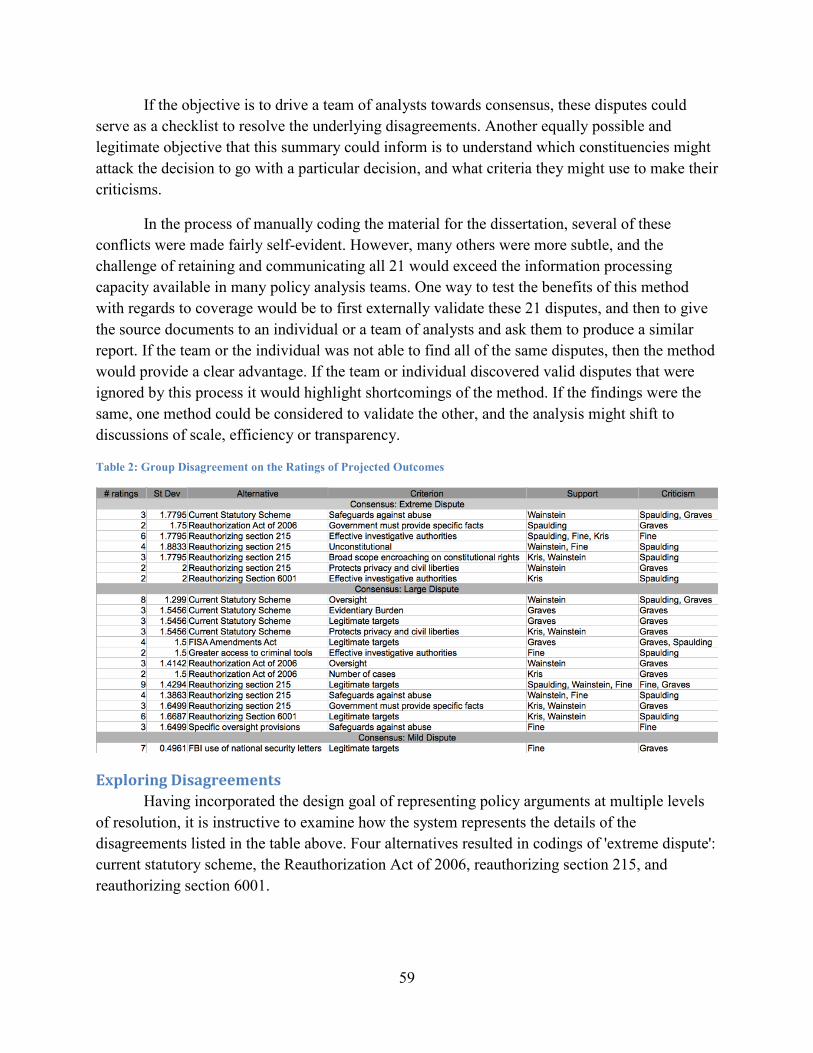
59
If the objective is to drive a team of analysts towards consensus, these disputes could serve as a checklist to resolve the underlying disagreements. Another equally possible and legitimate objective that this summary could inform is to understand which constituencies might attack the decision to go with a particular decision, and what criteria they might use to make their criticisms.
In the process of manually coding the material for the dissertation, several of these conflicts were made fairly self-evident. However, many others were more subtle, and the challenge of retaining and communicating all 21 would exceed the information processing capacity available in many policy analysis teams. One way to test the benefits of this method with regards to coverage would be to first externally validate these 21 disputes, and then to give the source documents to an individual or a team of analysts and ask them to produce a similar report. If the team or the individual was not able to find all of the same disputes, then the method would provide a clear advantage. If the team or individual discovered valid disputes that were ignored by this process it would highlight shortcomings of the method. If the findings were the same, one method could be considered to validate the other, and the analysis might shift to discussions of scale, efficiency or transparency.
Table 2: Group Disagreement on the Ratings of Projected Outcomes
Exploring Disagreements Having incorporated the design goal of representing policy arguments at multiple levels
of resolution, it is instructive to examine how the system represents the details of the disagreements listed in the table above. Four alternatives resulted in codings of 'extreme dispute': current statutory scheme, the Reauthorization Act of 2006, reauthorizing section 215, and reauthorizing section 6001.
60
Reauthorizing Section 6001 Section 6001 of the Intelligence Reform and Terrorism Prevention Act of 2004, often
referred to as the ‘lone wolf’ provision, extended FISA surveillance authorities by removing the previously required nexus to a foreign power, but subjected this authority to the PATRIOT Act sunset dates. Because this provision had, at the point of this hearing, never been used, the debate regarding whether it was effective was fairly limited. Spaulding's criticism focused on the lack of use as evidence that the authority was clearly not needed and not essential. Kris countered with two specific, albeit hypothetical, scenarios in which the authority would be the only avenue for effective surveillance. He goes on to add that these scenarios are not purely hypothetical and are instead backed by current trends observed in intelligence reporting. Furthermore, Kris argues that the reason that the authority had not yet been used was because of the restriction that it be applied to only to non-US persons, suggesting that if this limitation were broadened, then the rest of the fact pattern would match with more cases.
This dispute raises several dilemmas including whether the authority should be expanded to apply to more cases, and whether such extensive application would by definition qualify it as essential according to Spaulding's criterion. A third, more troubling question is whether the FBI has available surveillance authorities to cover the situations it has encountered in which a section 6001 order was necessary, but unavailable due to the US person status of the target. Such instances of purely home grown, self-radicalized terrorism present significant challenges in finding the optimal balance between security and civil liberties.
Current Statutory Scheme The three ratings resulting in dispute over whether the 'current statutory scheme'
alternative was consistent with 'safeguards against abuse' criterion came from Spaulding, Wainstein, and Graves, with Wainstein offering the minority review supporting existing safeguards. He references the safeguards that were present in the original act, as well as augmentation of these safeguards in subsequent legislation. As support for her negative rating, the coding of Spaulding's projection cites the desire not to jeopardize a criminal investigation as an example of a safeguard that deters inappropriate behavior in the use of criminal authorities but not in the context of an intelligence investigation. The rating coded from Graves' testimony challenges the integrity of the entire debate over the powers at issue as a result of the misleading nature of some of the facts that were presented.
Linking these comments together, so that disagreement can be identified and studied further does not lead to an answer to what the 'correct' rating should be regarding safeguards on the current statutory scheme. All three make valid points, but they do not lead to any resolution. Nevertheless, the juxtaposition does serve an important purpose. When any one of these points is made in the isolated context of an individual analysis, the absence of competing views might leave the reader with the impression that opposing views do not exist, even when that is plainly not the case. An analyst proceeding to evaluate the safeguards on the current statutory scheme after reviewing this cell of the matrix would be incentivized to address all of these points, or to
61
offer justification for selectively filtering them, based on the awareness that the enumeration of unaddressed points by others would be facilitated by the matrix.
Reauthorization Act of 2006 The next extreme dispute concerns the Reauthorization Act of 2006 and the burden on the
government to provide specific facts. Spaulding expresses support for the requirement that the government make a statement of facts which establishes reasonable belief that the records sought are relevant to an authorized investigation. Though she acknowledges this as an improvement over original PATRIOT Act language, she subsequently expresses concern that the statement of facts standard is actually a lower standard than the specific and articulable language that was required before the PATRIOT Act for such orders. Graves' criticism is unequivocal, omitting reference to any improvements, and citing the fact that the Reauthorization act allows government officials to certify the need to keep challenges to section 215 orders secret without providing any facts to the court.
This is an example of the linkage step revealing a subtle disagreement that might have otherwise gone unnoticed. Though both analysts are addressing the way that the Reauthorization Act affected the evidentiary burden for section 215 orders, they are actually referring to different provisions of the authority. Spaulding is addressing the link that must be established between the records sought and the investigation, while Graves focuses on the statutory mechanism to challenge such orders. This disagreement illustrates the complexities of sequencing and disentangling provisions of various policy alternatives required for evaluation against a single criterion. To understand Spaulding's comments one needs to sequence three points of reference: pre PATRIOT Act law establishing Section 215 orders in 1998, PATRIOT Act modifications to that language in 2001, and the Reauthorization act in 2006. Spaulding's compound rating simultaneously claims an improvement in 2006 over the 2001 language, but criticizes it compared to the 1998 language. To understand how Graves' comments relate to Spaulding's, one needs to separate the provision establishing relevance of the records sought, from the provision determining whether challenges to these orders can be gagged, while recognizing that the criterion of the evidentiary burden on the government is being attached to both.
Reauthorizing Section 215 The policy alternative of Reauthorization Section 215 led to disagreements being coded
for four criteria: effective investigative criteria; unconstitutionality; protection of privacy and civil liberties; and the broad scope encroaching on constitutional rights. Beginning with the coding of Fine's comments on the effectiveness of the authority, one finds a hedged position. Fine is critical of the legal, bureaucratic or other impediments to the FBI's use of the letters, and the lack of any major case developments resulting from their use, while at the same time acknowledging that the authority covered records that could not otherwise be obtained, and mentioning that FBI personnel reported it as essential to national security investigations. Kris adds to this divided evaluation with the statement that the authority has supported important and highly sensitive intelligence collections, and offers to provide more details in a classified setting.
62
The criterion of constitutionality is raised with regards to First, Fourth, and Fifth Amendment protections. Spaulding first challenges whether the 3rd party record rule, which suggests a reduced expectation of privacy for records held by a third party, is adequate in light of data mining and aggregation techniques that can combine many sources of 3rd party records. Even in absence of reconsideration of this rule, Spaulding claims that the Fourth amendment clearly applies to some of the records that might be sought in 215 orders. Spaulding also references the OIG report that implies First and Fifth Amendment protections. Wainstein suggests that section 215 orders are even more protective of the constitutional rights than grand jury subpoenas because the 215 orders explicitly disallow orders from being issued for conduct such as political speech or religious worship that are protected by the First amendment. Fine's report highlights that this protection was exercised by the FISA court which twice rejected 215 orders on First amendment grounds, even though the FBI subsequently circumvented these rejections by employing other authorities.
With respect to the general concern for privacy and civil liberties protections in the Section 215 orders, Wainstein again uses a comparison to grand jury subpoenas which can be issued by criminal prosecutors across the country without any court review whatsoever. By contrast, the 215 orders require FISA court approval. Graves' criticism, slightly less specific, is that Section 215 orders undermine the privacy of Americans' records which, although held by third parties, can nevertheless be very personal.
The extent to which the scope of section 215 orders encroaches on constitutional rights is related to other criteria previously discussed. In the context of the disagreement revealed in the matrix, however, it refers specifically to the question of whether the statutory mechanism to challenge these orders does enough to preserve those rights. Wainstein names the mechanism and concludes that the provisions of the 215 orders provide procedures to challenge and litigate the validity of the order. Kris points out that that in addition to their availability, the fact that no recipient has challenged such an order is evidence that constitutional rights are being protected. Only Spaulding makes the point that the availability of a statutory mechanism to challenge a 215 order to a 3rd party record holder in an ex parte hearing where the individual whose records are being sought is not present cannot claim to be fully representative of the interests of that individual. The very fact that no challenge has ever been brought, at least in Spaulding's view, is evidence of the shortcoming of this provision, not reason to support it.
Clearly Section 215 orders are viewed quite differently by the experts who were invited to testify at the congressional hearing. Of all of the disputes raised, perhaps the last issue regarding whether an ex parte hearing can protect the interests of the individual whose records are being sought leaves the analyst wondering what counter point might be offered, and whether the resolution of this challenge, once raised, will be addressed by the resulting decision and policy outcome. Other issues left dangling include whether the bureaucratic overhead associated with these orders caused the FBI to seek the path of least resistance and use other authorities such as exigent letters or NSLs, whether standards for intelligence investigations should use
63
criminal authorities as a baseline, and whether new protections are required for 3rd party records in the face of data mining and aggregation techniques. Having an explicit list of the issues that have caused experts to disagree is ostensibly one of the purposes of such hearings. Whether these disagreements are considered, and addressed by subsequent policy decisions, is another matter.
Analyst Clustering This list also highlights an area of analysis regarding clusters among the input documents
themselves. For example, Graves is almost always on the criticizing end of most of the disputed alternatives, while Kris and Wainstein are almost always offering support. Fine and Spaulding appear on both sides though Fine offers more support, and Spaulding offers more criticism. Communicating these patterns to those tasked with making decisions based on the content provided by these sources offers another dimension of information to make the analysis more robust.
Agreeing to Disagree The previous list of disagreements was generated by looking at opposing rankings coded
for overlapping ratings for a particular projected outcome cell. These disagreements occur when two analysts addressing the same policy alternative and criterion see things differently. Another, more subtle, form of disagreement occurs when analysts evaluating the same policy alternative use completely different criteria. Such disagreements are not revealed by default as each analyst effectively creates a consensus around the criteria they do use, while avoiding addressing the criteria others use. Figure 35 demonstrates an example case where there are no cells of disagreement within the group with regards to any of the criteria used to evaluate the reauthorization of section 206, but there is consensus both in support and opposition of this alternative according to different criteria. The alternative in the example, “Reauthorizing section 206” has received a great deal of uncontested support with regards to one set of criteria, while also receiving an uncontested, albeit lesser, amount of criticism centered on the legitimacy of the targets, and the safeguards against abuse.
Applications The system developed as part of this dissertation improves the capabilities of the analyst
to perform almost any policy relevant task by better organizing the source material, and providing useful interactions. Three specific applications based on this system include: 1) providing support to decision makers, 2) providing an audit trail for policy analysis, and 3) engaging public debate on policy matters. Policy analysts might engage in any or all of these specific applications. Demonstrating how the system can be used to improve these objectives illustrates how the capability to process information associated with policy arguments can be leveraged in different ways depending on the objectives of the user.
Decision Maker Support A policy outcome matrix can serve as a dynamic scorecard that quickly draws a decision
maker's attention to several important aspects of a policy debate such as disagreement, consensus
64
and dimensionality of the problem. These scorecards can also accommodate several decision making strategy scenarios. Policy outcome matrices are specifically tailored for strategies in which the decision maker wishes to methodically weigh the tradeoffs across all criteria used to evaluate an alternative. Other scenarios may involve a situation in which a decision maker has already made a decision, or is otherwise constrained to a particular choice, even though other alternatives exist. In such circumstances, the policy outcome matrix can be employed to anticipate what criteria will be used to level criticism, to identify the sources of criticism, and to prepare counter arguments. Finally, in situations where the decision maker is already inclined towards an alternative, but retains the flexibility to make modifications, the policy outcome matrix can be used to optimize adjustments that will mitigate criticism, or to develop additional criteria that reframe the way the tradeoffs are justified.
Auditing Policy Analysis The proposed methodology of generating policy outcome matrices creates many
significant artifacts from the policy analysis process. These artifacts result from the structured analytical techniques of ontology population, and the use of collaborative web based software, and can be used to perform more detailed studies of the policy analysis process itself. Decision makers are unlikely to engage in such an audit capacity, but entities tasked with oversight, or others seeking to improve or reform existing processes, will benefit from the finer granularity and greater transparency that this system imposes.
During the manual annotation phase, descriptive statistics can be used to communicate important quantitative characteristics such as the percentage of the source documents covered, the number of ontology instances populated, and the level of inter coder reliability. Furthermore, a link can be maintained between the text in the original source documents and the ontology instances so that their subsequent use in different contexts can be brought back into the natural language context where they originally occurred. This is an improvement over existing processes which often include an intermediate subjective step in which analysts create their own unstructured artifacts via subjective note taking or interpretation.
Once the ontology has been populated, the policy outcome matrix is filled out automatically, but the additional step of grouping alternatives and criteria must then be performed. Different guidelines can be used for the manual construction of these groupings by different analysts. Alternatively, automated algorithms or a hybrid, semi-supervised approach might be employed. A reasonable expectation would be that sound arguments could be made for very different approaches to this step, and that very different groupings would be produced. What seems like a proliferation of subjective judgments, however, is actually a step towards greater objectivity. By virtue of the fact that the original ungrouped inputs are enumerated, and the fact that the transformation must also be articulated clearly enough to make it repeatable, this method forces holders of different views regarding the salient grouping to agree that the various grouping functions are specified well enough to explain the transformation from a collection of ungrouped inputs to a collection of grouped outputs.
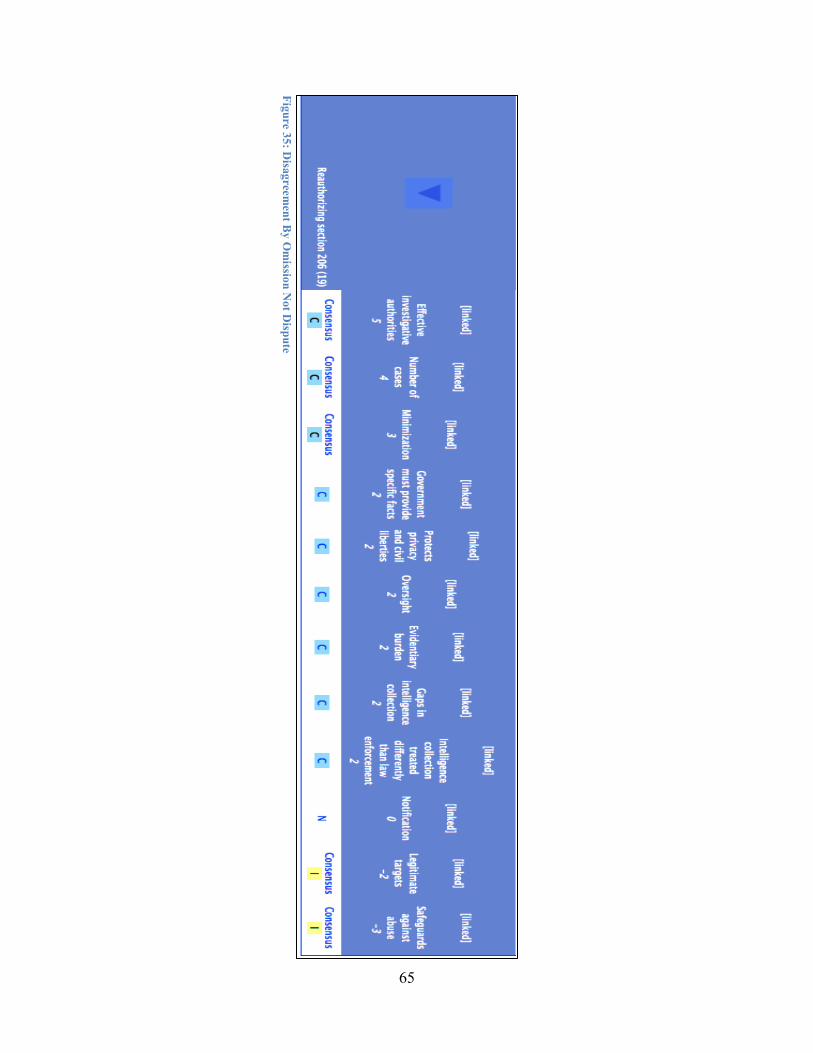
65
Figure 35: Disagreem
ent By O
mission N
ot Dispute
66
Ironically, the benefits that enable better auditing may be perceived as a threat by those who wish to conceal the details of their analyses and decision making. This audit process can be used to deconstruct the way a policy issue is framed or to create new frames. The flow of ideas between different clusters of analysts or documents may reveal patterns or relationships that had previously remained undetected, or undocumented. Manipulating frames, and making claims about relationships that have not been acknowledged, are somewhat contentious activities that policy analysts engage in already. Fortunately, the artifacts created in each step of the policy outcome matrix process, from manual coding and ontology population from source documents to the grouping of alternatives and criteria will provide a greater degree of objectivity and can themselves be audited.
Engaging Public Debate As a web based platform for collaboration, policy outcome matrices also have the ability
to scale to an extremely large base of users. The visualizations and interactive capabilities that improve the process for decision makers and analysts can, therefore, also be provided to the general public towards whom the actually policies are targeted. This audience can be segmented in many ways including degree of interest, political orientation, and issue awareness. These segments will interact with this system differently in different roles, such as producers and consumers of new analyses and critics of existing analyses.
Some of this engagement can be captured directly in the policy outcome matrix system framework. The system has built-in functionality for comment threads and chat communications. These additional artifacts can be mined for further insight into how the public reacts at a high level to a particular policy analysis, or more granularly to any component of the overall analysis matrix.
Embedding policy outcome matrices, links to the matrices, or snapshots of the matrices could enable engagement about these policy issues in any other web-based forum. Though these external representations will be more difficult, or impossible to track, they could, nevertheless, increase both the level of sophistication, and the overall level of engagement of the public with policy issues and the associated decision making and analysis processes.
This contribution represents an improvement, but not a replacement, for the current mediums by which the public engages with public policy making. For some, the endless supply of opinion and advocacy pieces masquerading as objective analysis will continue to suffice. For others, the inaccessibility of highly technical, rigorous, and thorough academic analysis will decrease the desire to participate. Policy outcome matrices are a step toward improving the public demand for the clear communication of objective analysis of policy issues, and could improve outcomes for the people whose best interest’s public policy is purported to serve.
67
Bibliography 111th Congress. (2009). Reauthorizing the USA PATRIOUT Act: Ensuring Liberty and Security
(testimony of The Honorable David Kris, The Honorable Glenn Fine, Suzanne Spaulding, Kenneth Wainstein, and Lisa Graves). Retrieved March 2, 2012, from http://www.judiciary.senate.gov/hearings/hearing.cfm?id=e655f9e2809e5476862f735da1501403
Bardach, E. (2005). A practical guide for policy analysis: The eightfold path to more effective problem solving. Washington, D.C.: CQ Press.
Burton, M. (2010). The Open Source Analysis of Competing Hypotheses Project. Retrieved March 12, 2012, from http://competinghypotheses.org/w/images/3/30/WHL-complete_personal.png
Burton, M. (2010). The Open Source Analysis of Competing Hypotheses Project. Retrieved March 12, 2012, from http://competinghypotheses.org/w/images/5/5b/WHL-group.png
Burton, M. (2010). The Open Source Analysis of Competing Hypotheses Project. Retrieved April 17, 2012, from http://competinghypotheses.org/
Department of Justice Office of Public Affairs. (2011). Assistant Attorney General David Kris Announces Departure from National Security Division. Retrieved March 12, 2012, from http://www.justice.gov/opa/pr/2011/January/11-nsd-041.html
Heuer, R. J. (1999). Psychology of intelligence analysis. Washington, D.C.: Center for the Study of Intelligence, Central Intelligence Agency. .
Kurzweil, R. (2011). Why IBM's Jeopardy Victory Matters. Retrieved April 17, 2012, from http://www.pcmag.com/article2/0,2817,2376027,00.asp
Mackinlay, J. (1986). Automating the design of graphical presentations of relational information. ACM Trans. Graph. 5, 2 , 110-141.
Markon, J. (2010, November 30). Glenn Fine to retire as inspector general. Retrieved March 2, 2012, from The Washington Post: http://www.washingtonpost.com/wp-dyn/content/article/2010/11/29/AR2010112905869.html
Toulmin, S. (2003). The uses of argument. Cambridge, U.K.: Cambridge University Press.