POLICE, OREGON STATE DEPARTMENT of€¦ · 10/01/2013 · Annual Performance Progress Report (APPR)...
60
POLICE, OREGON STATE DEPARTMENT of Annual Performance Progress Report (APPR) for Fiscal Year (2011-2012) Original Submission Date: 2012 Finalize Date: 1/10/2013
Transcript of POLICE, OREGON STATE DEPARTMENT of€¦ · 10/01/2013 · Annual Performance Progress Report (APPR)...

POLICE, OREGON STATE DEPARTMENT of
Annual Performance Progress Report (APPR) for Fiscal Year (2011-2012)
Original Submission Date: 2012
Finalize Date: 1/10/2013
2011-2012 Approved Key Performance Measures (KPMs)2011-2012
KPM #
Transportation Safety – Enhance transportation safety by reducing fatal, injury, and property damage crashes on state and interstate
highways where the Oregon State Police (OSP) have primary responsibility.
1
Coverage – Reduce the percentage of calls for service where a trooper is unavailable to respond. 2
Criminal Apprehension/Detection - Increase the percentage of traffic stops resulting in an arrest or criminal citation. 3
Angler Compliance - Percent of anglers contacted who are angling in compliance with rules and laws associated with salmon and steelhead
bag limits, licensing/tagging, means of take and species.
4
Angler Compliance - Percent of anglers contacted who are angling in compliance with rules and laws associated with all species. 5
Hunter Compliance – Percent of hunters contacted who are hunting in compliance with rules and laws associated with big game hunting
seasons.
6
Crime Reduction - Percent of major crime team call-outs resolved within 12 months from date of call-out. 7
Crime Reduction – Number of agency assists in narcotics investigations (including methamphetamine). 8
Forensic Analysis Turnaround Time - Average number of working days from when a request is received at the Forensics Laboratory, until a
completed analytical report is prepared.
9
Identification Services Turn Around Time - Average number of calendar days, from the date of receipt of criminal justice fingerprint cards by
the Identification Services Section, until the criminal justice data is posted into the Computerized Criminal History (CCH) Files.
10
RESIDENTIAL FIRE DEATH RATE: - Number of Oregonians per capita that die in a residential fire. 11
Hazards Materials Safety - Increase the number of regional Hazardous materials team members who meet or exceed competency requirements
set by the Oregon State Fire Marshal to 90% by 2011.
12
Fire Safety Training - Number of fire and life safety inspections conducted by local authorities who have been trained by the State Fire
Marshal (increases total number of inspections statewide).
13
Hazardous Substance Reporting - Percent of required reporting facilities that submit the Hazardous Substance Information Survey on time. 14

2011-2012 Approved Key Performance Measures (KPMs)2011-2012
KPM #
Customer Satisfaction – Percent of customers rating their satisfaction with the agency customer service as “good” or “excellent”: overall
customer service, timeliness, accuracy, helpfulness, expertise and availability of information.
15

Proposed Key Performance Measures (KPM's) for Biennium 2013-2015New
Delete
Title:
Rationale:


The mission of the Department of Oregon State Police to enhance livability and safety by protecting the people, property and natural resources
of the state.
POLICE, OREGON STATE DEPARTMENT of I. EXECUTIVE SUMMARY
Agency Mission:
503-934-0209Alternate Phone:Alternate: Larry West
Kailean KneelandContact: 503-934-0011Contact Phone:
Green
Red
Yellow
Green 66.7%
Red 20.0%
Yellow 13.3%
Total: 100.0%
Performance Summary
Green
= Target to -5%
Exception
Can not calculate status (zero
entered for either Actual or
Red
= Target > -15%
Yellow
= Target -6% to -15%
1. SCOPE OF REPORT
The Oregon State Police has 15 key performance measures that address services provided by the Patrol Services Division, Fish and Wildlife Division, Criminal
Investigation Division, Forensic Services Division, Identification Services, and Oregon State Fire Marshal. The services addressed by the performance measures
are: Transportation safety, Protection and preservation of the states natural resources, Criminal investigative services, Forensic services, Identification Services
(which includes Criminal History Automated Fingerprint Index System), and Fire and hazardous materials safety. Oregon State Police provides public safety
services beyond traditional highway enforcement. Many of the other public safety services provided by the agency do not have formal performance measures;
Page 6 of 601/10/2013
however, they play a critical support role for the entire criminal justice system in Oregon; such as State Medical Examiner, Law Enforcement Data System
(LEDS), Oregon Uniform Crime Reporting (OUCR), Arson and Explosives Services, Gaming Enforcement Division, Professional Standards, and
Administrative Services.
2. THE OREGON CONTEXT
Key Performance Measures 1 and 2 are directly related to deaths and injuries that occur on Oregon’s state and interstate highways due to motor vehicle
crashes. This has a direct impact on the livability of the state. These measures link to Oregon Benchmarks; OBM #41 Infant mortality rate per 1,000, OBM
#45 Premature Death: Years of life lost before age 70, OBM #62 Overall reported crimes per 1,000 Oregonians, OBM #63 Juvenile Arrests per 1,000
Oregonians, and OBM #68 Traffic Congestion: hours of travel delay per capita per year in urbanized areas. Crashes are also a cause of traffic delays and
stoppages on Oregon’s freight routes, causing a negative economic impact to Oregon’s businesses. By making progress on these performances measures, we
contribute to the progress of OBM #41, #45, #62, #63, and #68, to the states livability, and to positive economic development by keeping highways clear for
the movement of goods, services, and people. Key Performance Measures 3, 7, 8, 9, and 10 are related to the reduction of crime in Oregon. These measures
are linked to Oregon Benchmark #62: Overall reported crimes per 1,000 Oregonians. By reducing crime in Oregon, we increase the livability of the state by
making our communities safer. These measures have a component of reducing narcotics in our communities by working with our local law enforcement partners
on interagency narcotic drug teams. By making progress on these measures, we can reduce crime in Oregon, detect and interdict narcotic movement and
distribution and increase the livability by creating safer communities. Key Performance Measures 4, 5 and 6 are related to the protection of Oregon’s fish and
wildlife and natural resources. These measures are linked to Oregon Benchmark; OBM #86 Freshwater Species: Percentage of monitored freshwater species
not at risk, OBM #87 Marine Species: Percent of monitored marine species not at risk, and #88 - Terrestrial Species: Percent of monitored terrestrial species
not at risk: (state, fed listing): a. vertebrates, b. invertebrates, c. plants. The measure gauges how well the division is gaining compliance to rules, regulations and
laws that protect our environment, wildlife and natural resources. Through progress on this measure we will improve the livability of the state by maintaining
Oregon’s natural resources and habitat within the state. Key Performance Measures 11, 12, 13 and 14 relate to OMB #45 Premature Death: Years of life lost
before age 70, and reduction in the loss of property as a result of fire and hazardous materials and OMB #67 Emergency Preparedness: (a) percent of Oregon
communities with geologic hazard data and prevention activities in place (b) percent of Oregon counties with emergency operations plans meeting minimum
criteria. By reducing fires and hazardous materials incidents, we increase the livability of the state by making our communities safer. These measures track the
progress of program goals that have a direct impact on saving lives and protecting property and affect all Oregonians . Through progress on this measure we will
improve the livability of the state by reducing fires and incidents involving hazardous materials. Key Performance Measure 15 is related to customer satisfaction
with Oregon State Police. Customers were defined as the agency’s key stakeholders (Oregon District Attorneys, Sheriffs, and Police Chiefs). This performance
measure is a mechanism for the agency to measure how well we are performing and meeting the expectations of our customers. It is the goal of the agency to
make progress on all of the performance measures with the expected outcome of increasing the customer satisfaction of our key stakeholders and the general
public.
3. PERFORMANCE SUMMARY
Page 7 of 601/10/2013

The Department of State Police has 15 Key Performance Measures (KPMs) that were adopted by the Oregon Legislature. The 15 KPMs
are linked to five agency goals, the agency’s mission statement, and eight Oregon Benchmarks. The Department of State Police had ten
KPMs that either met target or were within 5% of target, two KPMs were within (6-15) % of target, and the remaining three KPMs were more
than 15% from target goal.
4. CHALLENGES
There are several primary areas of challenge that effect all the agency’s Keys Performance Measures (KPMs), internal performance measures, and the
day-to-day operations of the department. They are: Budget Uncertainty -- The most significant challenge to the Oregon State Police is, and has been, fiscal
uncertainty. In the early 1980s, Oregon’s Constitution was amended and the State Police patrol operations funding was shifted to the General Fund from the
State Highway Fund. Since then, the Department has experienced remarkable instability in funding, which has resulted in significant reductions in service delivery
across all programs that are funded from the General Fund. This has had a negative impact on the greater criminal justice system overall. Staffing -- As a result
of the historic shortage of staffing, personnel are routinely assigned to cover areas outside of their primary areas of responsibility. One example is officers
providing mandated training to meet minimal levels of required law enforcement training. This compounds the challenge to meet the KPM goals as personnel are
not available to perform their primary duties. Responding to Emerging Crime Trends -- Law enforcement must always be ready to adapt and respond to new
crime trends. Two areas that are seeing significant increases in criminal activity are prescription drugs and large drug cartel marijuana grows. These large
marijuana grows pose a serious threat to the safety of citizens and law enforcement. Many grows are in remote hard to reach areas protected by well-armed
individuals. Handling a large grow safely, requires special tactics and well equipped law enforcement officers.
5. RESOURCES AND EFFICIENCY
The 2011 legislature funded 1,220 positions, of which 663 were sworn and 557 were professional staff. The Oregon State Police received 67% of the
Departments funding from the state General Fund, 2% from Lottery Funds, 28% from Other Funds, and 3% from Federal Funds. The divisions that were
primarily funded from the state General Fund were the Patrol, Criminal, Forensics, Medical Examiner, Administrative, and Law Enforcement Data Systems
divisions. The Fish and Wildlife division also received funding from the General Fund, but the majority of the divisions funding was received from Other, Lottery,
and Federal Fund sources. Due to the unpredictability associated with the state General Fund, the programs within the Department that rely on the General
Fund have struggled to maintain service levels that meet demand. OREGON STATE POLICE BUDGET HIGHLIGHTS: The agency has delayed filling trooper
positions in order to balance our General Fund budget in 2011-13. It is anticipated that holding these positions vacant may negatively impact the Departments
ability to meet their KPMs. EFFICIENCY MEASURES: The agency does not have any performance measures that are efficiency measures.
Page 8 of 601/10/2013

POLICE, OREGON STATE DEPARTMENT of II. KEY MEASURE ANALYSIS
Transportation Safety – Enhance transportation safety by reducing fatal, injury, and property damage crashes on state and interstate
highways where the Oregon State Police (OSP) have primary responsibility.
KPM #1 2009
To reduce crashes statewide.Goal
Oregon Context OBM #45 PREVENTABLE DEATH Years of life lost before age 70 OBM #41 INFANT MORTALITY RATE Infant mortality rate per
1000 live births OBM #68 TRAFFIC CONGESTION Hours of travel delay per capita per year in urbanized areas
The Oregon Department of Transportation Crash Analysis Unit provides information for crash analysis on state and interstate highway
systems. In addition we use a newly established, real time, Problem Oriented Policing database at the Patrol, Region, and Headquarters
level.
Data Source
Captain Ted Phillips, Patrol Services Division, 503-934-0192 Owner
0
2000
4000
6000
8000
10000
2005 2006 2007 2008 2009 2010 2011 2012 2013
7637 7423 74846856 6947
76508467
Bar is actual, line is target
Number of crashes on highways where OSP has primary
enforcement responsibility.
Data is represented by number
Page 9 of 601/10/2013

POLICE, OREGON STATE DEPARTMENT of II. KEY MEASURE ANALYSIS
1. OUR STRATEGY
The mission of the Department of Oregon State Police (OSP) is to enhance livability and safety by protecting the people, property and natural resources of the
state. To realize the mission the Department objectives are to (1) Be There; (2) Prevent Harm; and (3) Support Oregon Communities. The Patrol Services
Division provides uniform police services throughout the state with primary responsibility for the protection of human life and property through crash reduction,
crime reduction, responding to emergency calls for police services and other transportation safety issues on Oregon’s rural state and interstate highways .The
goal of this performance measure is to enhance transportation safety by reducing traffic crashes that occur on state and interstate highways where the agency
has the primary responsibility of patrolling and responding to calls for service.These programs include Hazardous Violation Enforcement, Impaired Driver
Enforcement, Commercial Motor Vehicle Enforcement, Aggressive Driver Enforcement and Occupant Protection. These programs are closely tied to ODOT
Transportation Safety programs and often involve coordination with local law enforcement.The strategy includes implementation of an outcome based proactive
philosophy of Problem Orientated Policing (POP) which focuses on bringing OSP, citizens, and other stakeholders together to work as partners in addressing
public safety issues. Local OSP Area Commands evaluate crash data, driving complaints and other stakeholder input in their respective areas and identify those
areas requiring focused attention to reduce crashes. The plans to reduce crashes in an identified area include determining the prevalent causes of the crashes
and then addressing those causes through enhanced enforcement, roadway engineering changes and education efforts.
2. ABOUT THE TARGETS
The 2011 target goal for this performance measure is based upon a 5% crash reduction from the three year average of 2007-2009. The 2012 target goal is
based upon a 5% reduction from the three year average of 2008-2010. The 2013 target goal is based upon a 5% reduction from the three year average of
2009-2011.In preparation of this report it was learned that the reported crashes for calendar years prior to 2011 were not complete. The Oregon State Police
learned through the Oregon Department of Transportation Crash Analysis and Reporting Unit that the total number of crashes for each year has been under
reported for all Oregon highways. It was explained this was due to the method by which the Department of Motor Vehicles transferred crash reports to the
ODOT Crash Analysis reporting unit. ODOT has corrected the “under-reporting” problem, and from 2011 forward the crash data will reflect all reported
crashes. ODOT has informed OSP that corrections for the years prior to 2011 will not be made for administrative reasons.In addition to the under-reporting
problem corrected by ODOT, another error was discovered during an audit of the report* on highway segments that OSP is responsible for. It was
discovered that the prior years reports omitted any crashes occurring on the on/off ramps of the OSP highway segments. This error was corrected for 2010
data, but the actual data for the years prior to 2010 will not be corrected to include the on/off ramp crashes. Both of these under-reporting problems have
contributed to the crash reduction targets for 2010, 2011, 2012, and 2013 to be calculated lower than they should be; future targets will reflect more realistic
goals as they will be based on better data.* Data Source - ODOT transportation Development Division Transportation Data Section Crash Analysis and
Reporting Unit, Report # CDS160.
Page 10 of 601/10/2013

POLICE, OREGON STATE DEPARTMENT of II. KEY MEASURE ANALYSIS
3. HOW WE ARE DOING
The 2011 goal was to reduce the total number of crashes by 5% from the 3 year average of 2007-2009. The actual number of crashes in 2011 was 8,467,
missing the crash reduction target by 1,726 crashes or approximately 26%. Due to the under-reporting problems outlined earlier, no clear conclusions can be
drawn regarding the increase in the number of crashes from 2010 to 2011, or why the target was missed as the target would have been higher had the
under-reporting not occurred.
4. HOW WE COMPARE
The total number of fatal crashes on the total state highway system decreased from 180 in 2010 to 161 in 2011, equating to an 11% decrease in fatal crashes.
The total number of fatal crashes for all Oregon highways (city, county, state) increased from 292 in 2010 to 310 in 2011, equating to a 6% increase in fatal
crashes. The state highway system accounted for 19,428,689,916 vehicle miles traveled during 2011. This was a decrease of 2% from the 2010 total of
19,733,374,827. Source: ODOT 2011 State Highway Crash Rate Tables
5. FACTORS AFFECTING RESULTS
Each Area Command analyzes crash data provided by ODOT for their areas of responsibility. Driving behaviors are identified that are the leading causes of the
crashes for that particular highway segment. Enforcement plans are developed and implemented that focus on changing the driving behaviors in an effort to
reduce crashes. The Area Commands also work with ODOT and other partners on engineering and education efforts aimed at reducing crashes in those
areas.There are other variables that affect crash rates that are outside the control of our enforcement, education and engineering efforts. Some of these factors
include the economy, adverse weather events, number of licensed drivers, and the changes in annual vehicle miles traveled.In 2010 thirteen (13) trooper
positions and two (2) sergeant positions were eliminated due to the loss of MCSAP (truck enforcement) funding. Shortfalls to the Oregon’s General Fund have
resulted in the loss of another forty-nine (49) trooper positions. These reductions, coupled with normal attrition, will impact the Department’s ability to meet
our targets in the future.
6. WHAT NEEDS TO BE DONE
The identified highway segments the Oregon State Police is responsible for need to be continually evaluated to determine the primary causation factors for
crashes. Enforcement, education and engineering plans need to be continually evaluated with this information to further reduce crashes.The strategy for
reducing crashes on these sections of highways will include efforts to increase patrol staffing, continue the partnership with ODOT and continue the focus on
the Patrol Services Division Priority Enforcement Programs that are intended to improve transportation safety.
Page 11 of 601/10/2013
POLICE, OREGON STATE DEPARTMENT of II. KEY MEASURE ANALYSIS
7. ABOUT THE DATA
All highway segments have been identified where the Oregon State Police has primary responsibility. Crash data is collected, compiled and reported by the
Oregon Department of Transportation Crash Analysis Unit on a calendar year reporting cycle. The statewide crash numbers are summarized from these reports
and are the data used in evaluating this performance measure. The following statement was provided on ODOT’s crash analysis & reporting unit website: “A
higher number of crashes are reported for the 2011 data file compared to previous years. This does not reflect an increase in annual crashes. The higher
numbers result from a change to an internal departmental process that allows the Crash Analysis and Reporting Unit to add previously unavailable , non-fatal
crash reports to the annual data file. Please be aware of this change when comparing pre-2011 crash statistics.”
Page 12 of 601/10/2013
POLICE, OREGON STATE DEPARTMENT of II. KEY MEASURE ANALYSIS
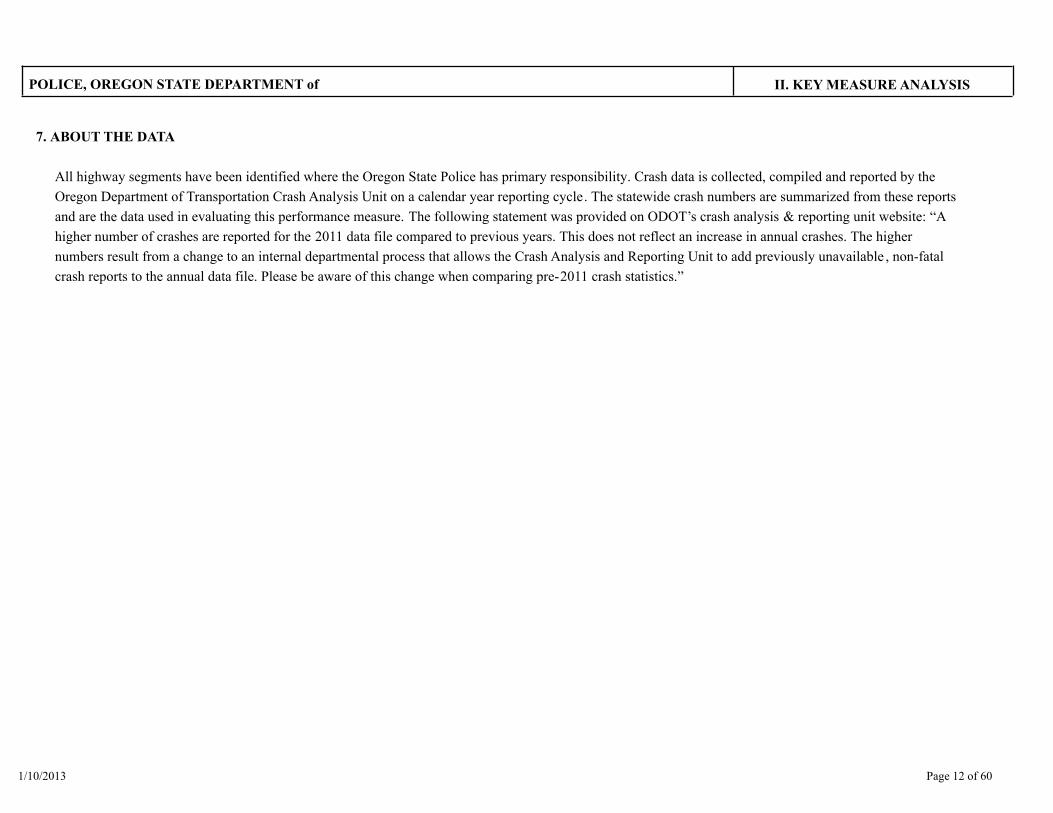
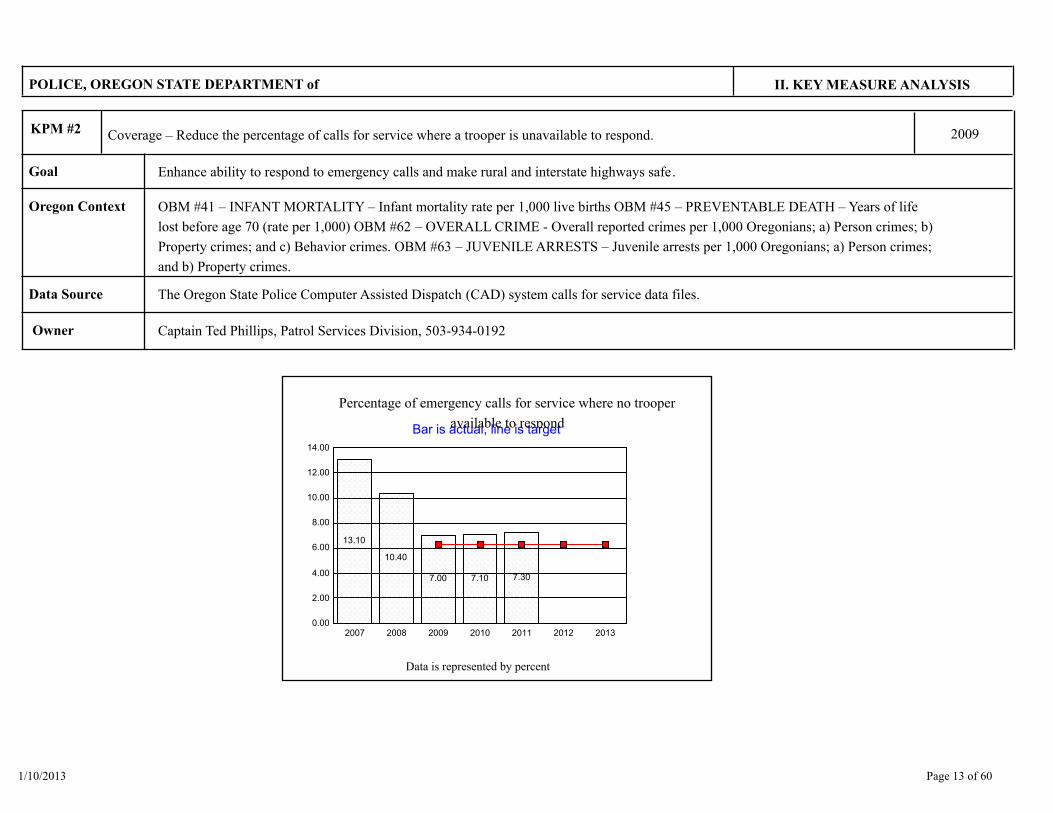
Coverage – Reduce the percentage of calls for service where a trooper is unavailable to respond.KPM #2 2009
Enhance ability to respond to emergency calls and make rural and interstate highways safe.Goal
Oregon Context OBM #41 – INFANT MORTALITY – Infant mortality rate per 1,000 live births OBM #45 – PREVENTABLE DEATH – Years of life
lost before age 70 (rate per 1,000) OBM #62 – OVERALL CRIME - Overall reported crimes per 1,000 Oregonians; a) Person crimes; b)
Property crimes; and c) Behavior crimes. OBM #63 – JUVENILE ARRESTS – Juvenile arrests per 1,000 Oregonians; a) Person crimes;
and b) Property crimes.
The Oregon State Police Computer Assisted Dispatch (CAD) system calls for service data files.Data Source
Captain Ted Phillips, Patrol Services Division, 503-934-0192 Owner
0.00
2.00
4.00
6.00
8.00
10.00
12.00
14.00
2007 2008 2009 2010 2011 2012 2013
13.10
10.40
7.00 7.10 7.30
Bar is actual, line is target
Percentage of emergency calls for service where no trooper
available to respond
Data is represented by percent
Page 13 of 601/10/2013

POLICE, OREGON STATE DEPARTMENT of II. KEY MEASURE ANALYSIS
1. OUR STRATEGY
The mission of the Department of Oregon State Police is to enhance livability and safety by protecting the people, property and natural resources of the state.
To realize the mission the Department objectives are to (1) Be There; (2) Prevent Harm; and (3) Support Oregon Communities. The Patrol Services Division
provides uniform police services throughout the state with primary responsibility for the protection of human life and property through crash reduction, crime
reduction, responding to emergency calls for police services and other transportation safety issues on Oregon’s rural state and interstate highways .The Oregon
State Police patrol staffing levels decreased significantly from 1980 up until the 2005-2007 biennium when the agency was authorized to hire an additional 139
troopers. This performance measure is in keeping with meeting the agency objectives of Be There, Prevent Harm and Support Local Communities by
measuring how well the Department is doing at reducing the number of calls for service where a trooper is not available to respond.A “call for service” is
defined as calls that require an immediate response that are coded by our dispatch centers as careless/reckless driving, hazardous driving complaints, driving
under the influence of intoxicants, crashes, crimes in progress and officers request for assistance (backup).The agency will continue to work towards obtaining
and allocating the number of sworn personnel necessary to provide the patrol coverage that will have a positive impact on this measure.
2. ABOUT THE TARGETS
During the 2007-2009 biennium the Department implemented a plan to hire an additional 139 troopers. This plan continued into the 2009-2011 biennium. In
anticipation of the additional troopers the Department set a goal of reducing the 2008 number of “No Trooper Available” calls for service by 40%, which
equates to a target percentage of 6.3%. Or more simply stated the Departments goal is to be able to respond to 93.7% of the calls for service, an
improvement from the 2008 percentage of being able to respond to 89.6% of the calls for service The percentage of calls where no trooper is available is
calculated by dividing the number of “No Trooper Available” calls by the total number of calls for service for that year .
3. HOW WE ARE DOING
Although the actual number of “No Trooper Available” calls decreased from 15,024 in 2010 to 14,691 in 2011, the percentage of calls where a trooper was
unavailable to respond increased from 7.1% in 2010 to 7.3% in 2011. This increase can be attributed to the cessation in hiring and having to maintain trooper
vacancies for budget savings.
4. HOW WE COMPARE
No comparisons available at time of report.
Page 14 of 601/10/2013

POLICE, OREGON STATE DEPARTMENT of II. KEY MEASURE ANALYSIS
5. FACTORS AFFECTING RESULTS
During the 2010 Special Session, 13 trooper positions were eliminated due to the loss of MCSAP (truck enforcement) funding. An additional 49 trooper
positions were eliminated for the 2011-2013 biennium. These reductions, coupled with normal attrition, will impact the Department’s ability to meet our targets
in the future.This is the primary cause for the increase in “No Trooper Available” calls. The agency expects this trend to continue until the Department is able to
fill trooper positions that are currently vacant.The performance measure outcomes are impacted by the staffing levels at offices, the hours of coverage the office
is able to provide, and the location of a trooper in proximity to a call for service.
6. WHAT NEEDS TO BE DONE
The Oregon State Police will continue to work towards identifying funding mechanisms that will allow the hiring of troopers needed to meet service delivery
expectations of the public.
7. ABOUT THE DATA
The data for this performance measure is collected and reported from the Computer Aided Dispatch Center within the agency Command Centers (dispatch)
that meet the definition for “calls for service” and “no patrol available.”Each call for service that is received by the State Police Command Centers is coded by
the “dispatcher” to identify the type of call. Each call also receives a code by the “dispatcher” indicating how the call was handled and the result. When a call
for service is received and a trooper is unavailable to respond, the dispatcher will clear the call as “No Patrol Available”, these are the calls for service that are
counted for purposes of this measure.
Page 15 of 601/10/2013

POLICE, OREGON STATE DEPARTMENT of II. KEY MEASURE ANALYSIS
Criminal Apprehension/Detection - Increase the percentage of traffic stops resulting in an arrest or criminal citation.KPM #3 2009
The 2009 objective is an increase of criminal arrests resulting from a traffic stop by 10 percent.Goal
Oregon Context OBM #62 – OVERALL CRIME - Overall reported crimes per 1,000 Oregonians; a) Person crimes; b) Property crimes; and c) Behavior
crimes.
Oregon State Police Computer Assisted Dispatch (CAD) dataData Source
Captain Ted Phillips, Patrol Services Division, 503-934-0192 Owner
0.00
0.40
0.80
1.20
1.60
2.00
2.40
2.80
3.20
2007 2008 2009 2010 2011 2012 2013
3.00
2.502.20
2.602.80
Bar is actual, line is target
Percentage of traffic stops resulting in an arrest or criminal
citation
Data is represented by percent
1. OUR STRATEGY
The mission of the Department of Oregon State Police is to enhance livability and safety by protecting the people, property and natural resources of the state.
To realize our mission, the Department’s objectives are to (1) Be There; (2) Prevent Harm; and (3) Support Oregon Communities. The Patrol Services
Page 16 of 601/10/2013

POLICE, OREGON STATE DEPARTMENT of II. KEY MEASURE ANALYSIS
Division provides uniform police services throughout the state with primary responsibility for the protection of human life and property through crash reduction,
crime reduction, responding to emergency calls for police services and other transportation safety issues on Oregon’s rural state and interstate highways . A
primary objective of the Patrol Services Division in support of the agency mission is to promote transportation safety on Oregon’s highways . This is
accomplished through high-frequency contacts which include violations of traffic offenses, assisting motorists, and any other law enforcement encounter. Crimes
of many types have a transportation component which may come to the attention of a trooper while engaged in patrol. The agency has promoted a philosophy
within the Patrol Services Division of disrupting and dismantling all forms of criminal activity occurring on Oregon’s state and interstate highways through patrol
enforcement. This includes but is not limited to; the apprehension of fugitives and felons, detection of weapons violations, recovery of stolen vehicles and
property, detection of identity theft crimes, the apprehension of narcotics traffickers, acts of terrorism, unlawful possession of explosive devices, counterfeit
merchandise, and the identification of proceeds and instrumentalities used to facilitate and/or further criminal activity. State troopers are expected to frustrate
criminal endeavors while protecting the civil rights of all citizens. The apprehension of criminal offenders through routine contacts further prevents other crimes
from being committed. State Police Criminal Division detectives often respond to these contacts to assist with furthering the investigation and identifying criminal
organizations. The goal of this performance measure is to increase the detection and apprehension of people that are engaged in criminal activity when utilizing
Oregon’s transportation system. The Oregon State Police has implemented an outcome based proactive philosophy of Problem Orientated Policing which
focuses on bringing the agency, citizens, and stakeholders together to solve public safety issues. This process is used to identify those highways and interstates
that are most susceptible to use by criminal offenders and/or where repeated incidents are occurring that have related characteristics (behavior, location,
people, and time) that concern a community and fall within the mission and jurisdiction of the agency.
2. ABOUT THE TARGETS
The 2011 goal was to increase the percentage of traffic stops resulting in an arrest or criminal citation to 2.7 percent of all traffic stops. The performance
measure targets report this increase as a ratio of arrests and criminal citations compared to the total number of routine contacts . The total number of arrests and
criminal citations for each year is divided by the total number of routine contacts for that year to determine the actual percentage. The target percentage was
calculated by increasing the 2008 arrests and criminal citations (5,892) by 10 percent (589) and dividing that result by the total number of routine contacts for
2008 (237,474). The resulting target percentage of traffic stops resulting in an arrest or criminal citation is 2.7 percent. The actual percentage for 2008 was 2.5
percent. The goal of increasing the number of arrests and criminal citations stemming from routine contacts was initially based on anticipated hiring of additional
troopers, the efforts the agency has placed on enhanced training to improve skills at detecting criminal activity during routine contacts , and providing supportive
resources such as narcotic canines.
3. HOW WE ARE DOING
There were 7,474 arrests or criminal citations issued out of 263,301 routine contacts in 2011. In comparison, there were 5892 arrests or criminal citations
Page 17 of 601/10/2013

POLICE, OREGON STATE DEPARTMENT of II. KEY MEASURE ANALYSIS
issued out of 237,474 routine contacts in 2008. The total number of arrests or criminal citations increased by 27% between 2008 and 2011. The percentage of
routine contacts resulting in an arrest or criminal citation in 2008 was 2.5 percent compared to 2.8 percent in 2011. The Department successfully met this
KPM in 2011 by exceeding the 2.7 percent target.
4. HOW WE COMPARE
No comparisons available at time of report.
5. FACTORS AFFECTING RESULTS
The actual number of troopers working for the previous four year period as of December of each year had steadily increased from 248 in 2007 to 307 in 2008
to 327 in 2009 back down to 307 in 2010 and then down to 287 in 2011. While actual trooper strength dropped to 307 by the end of 2010 it remained
around 322 troopers for most of the year and was as high as 331. Of the 322 troopers actually working the road for most of 2010, all but approximately 15
were on solo patrol for most of the year. Holding vacancies to stay within budget constraints has caused trooper strength to drop to 287 by the end of 2011,
with an average strength of 298 for the year. As was anticipated when this KPM was created, with the hiring of additional troopers the number of routine
contacts would increase as well as the number of routine contacts that result in criminal activity being detected. The above mentioned hiring of additional
troopers was reflected in the performance outcomes when 47,617 more motorists were contacted in 2010 than 2008 and 1479 more criminals were arrested.
In 2011 there were 21,790 fewer contacts, but 103 more criminals were arrested in 2011 than 2010. The reason trooper strength significantly impacts this
KPM can also be understood when examining calls for service. There were 201,597 calls for service in 2008 compared to 201,793 in 2011. With the amount
of calls for service remaining relatively stable between 2008 and 2011, additional troopers patrolling the highway give troopers the ability to focus on proactive
patrol time which is where most of the agencies criminal arrests occur. When troopers are responding to other calls for service their proactive patrol time is
significantly decreased as well as the amount of time a trooper can dedicate to conducting a thorough traffic stop where they uncover criminal activity .The hiring
of additional troopers and the development of the canine program enhanced the Patrol Division’s ability to conduct searches that can result in the apprehension
of criminals; which positively contribute to the Department’s progress towards meeting this KPM. As new troopers are hired and the number of routine
contacts increase, there are several factors that may impact a troopers ability to confirm or dismiss a “reasonable suspicion” that the person stopped is engaged
in criminal activity. The two main factors a trooper has to consider before requesting consent to search a vehicle is the availability of “cover” officers (an officer
should have another officer present to insure officer safety while searching) or the availability of a drug detection canine. Criminals often use very sophisticated
concealment devices to hide their contraband (i.e. drugs, weapons, explosives, forged documents). If a person refuses to allow a trooper to search their
vehicle, and a drug detection canine is readily available to respond, the dog is walked around the vehicle. If the canine “alerts” to the presence of a controlled
substance, a “probable cause” search of the vehicle can be conducted. This gives the agency the ability to apprehend criminals that otherwise would have been
released once the person denied the consent to search. If there are no “cover” officers or canine unit available the trooper would normally not request to search
Page 18 of 601/10/2013

POLICE, OREGON STATE DEPARTMENT of II. KEY MEASURE ANALYSIS
the vehicle and would allow the motorist to continue on their way.Another factor that contributes to the ability of troopers to detect criminal activity during
routine contacts is their tenure and experience level. The hiring of additional troopers between 2008 and 2011 and their subsequent development into well
rounded troopers on solo patrol was also reflected in the criminal apprehension statistics. In addition to routine contacts and total criminal arrests increasing,
the rate of how many criminals arrested per traffic stop also increased. This increase can be attributed to the younger tenured troopers developing, along with
the emphasis the Department placed on transforming the CAPE (Criminal Apprehension through Patrol Enforcement) philosphy into more of a formal program.
In 2008 the Department assigned a field Sergeant to oversee the CAPE activities of the Department. As part of the transformation, the field Sergeant worked
to develop formal training for supervisors, coordinate CAPE activities amongst state, local, tribal and federal agencies, and helped to develop standardized
criminal apprehension training that was delivered to field troopers during 2010. The CAPE training was given to all Patrol troopers and supervisors during the
biennial in-service. This training focused on a variety of topics including search and seizure, case law, trends, patrol strategies, and emphasized criminal
apprehension as a priority of the agency. Because the field of criminal apprehension is highly technical and ever changing, the training between 2008 and 2010
has allowed our troopers to become increasingly efficient in apprehending criminals by providing the most up to date information and skills necessary to
differentiate between criminals and the average motoring public. Detecting criminal activity during routine contacts is a skill that is developed through training
and experience. As a trooper gains more experience they are better able to differentiate what are normal behaviors and characteristics displayed by the general
motoring public compared to the behaviors and characteristics displayed by those people engaged in criminal activity.During the 2010 Special Session, 13
trooper positions were eliminated due to the loss of MCSAP (truck enforcement) funding. Additionally, continued shortfalls to Oregon’s General Fund have
required the agency to sustain significant cuts resulting in the loss of another 49 positions bringing the total positions lost in 2010 to 62.
6. WHAT NEEDS TO BE DONE
The agency will continue promoting the philosophy that every trooper be vigilant and observant of any characteristics or behaviors that may lead to the
detection of criminal conduct on every routine contact. The agency will need to continue providing criminal related training of all types to enhance those skills.
Providing this training may be difficult due to current budget reduction scenarios. In-service training where CAPE training is normally delivered has been
cancelled during the 2011-13 biennium due to budget reductions. Patrol staff will work to deliver needed criminal apprehension training to the field.
7. ABOUT THE DATA
The data for this performance measure is collected and reported by the Oregon State Police Command Centers (dispatch). Each time a trooper makes a
routine contact (i.e. traffic stop, motorist assist) the incident is cleared with a code in the Computer Aided Dispatch (CAD) system declaring the outcome of the
contact (i.e. warning, citation, arrest, cite & release). Any routine contact that is cleared with a “lodged in jail” or “cite & release – crime” code is counted for
purposes of this measure (Driving Under the Influence of Intoxicants not included).
Page 19 of 601/10/2013
POLICE, OREGON STATE DEPARTMENT of II. KEY MEASURE ANALYSIS
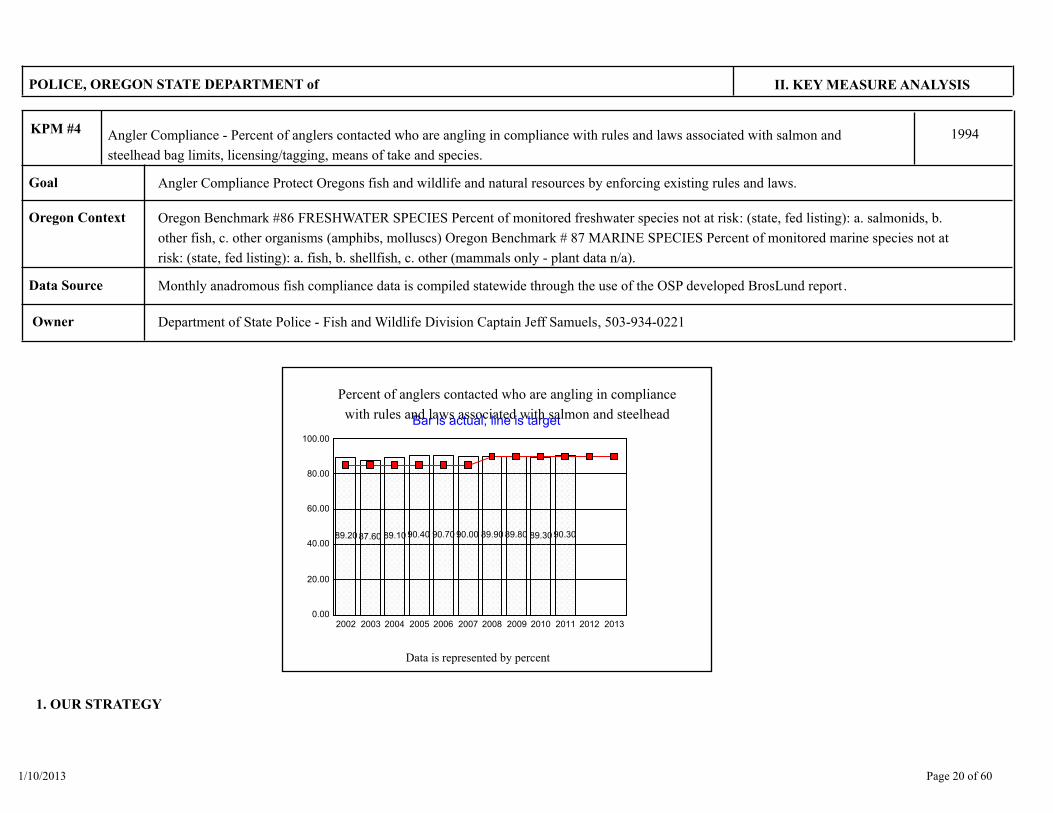
Angler Compliance - Percent of anglers contacted who are angling in compliance with rules and laws associated with salmon and
steelhead bag limits, licensing/tagging, means of take and species.
KPM #4 1994
Angler Compliance Protect Oregons fish and wildlife and natural resources by enforcing existing rules and laws.Goal
Oregon Context Oregon Benchmark #86 FRESHWATER SPECIES Percent of monitored freshwater species not at risk: (state, fed listing): a. salmonids, b.
other fish, c. other organisms (amphibs, molluscs) Oregon Benchmark # 87 MARINE SPECIES Percent of monitored marine species not at
risk: (state, fed listing): a. fish, b. shellfish, c. other (mammals only - plant data n/a).
Monthly anadromous fish compliance data is compiled statewide through the use of the OSP developed BrosLund report .Data Source
Department of State Police - Fish and Wildlife Division Captain Jeff Samuels, 503-934-0221 Owner
0.00
20.00
40.00
60.00
80.00
100.00
2002 2003 2004 2005 2006 2007 2008 2009 2010 2011 2012 2013
89.20 87.60 89.10 90.40 90.70 90.00 89.90 89.80 89.30 90.30
Bar is actual, line is target
Percent of anglers contacted who are angling in compliance
with rules and laws associated with salmon and steelhead
Data is represented by percent
1. OUR STRATEGY
Page 20 of 601/10/2013

POLICE, OREGON STATE DEPARTMENT of II. KEY MEASURE ANALYSIS
Increase voluntary compliance of rules and laws through high visibility enforcement. Key partners include both: Oregon Department of Fish and Wildlife and
Oregon Watershed Enhancement Board
2. ABOUT THE TARGETS
The target was established by working with Oregon Dept. of Fish and Wildlife to set a level of compliance to assure that illegal take would not be a limiting
factor of the resource. The higher the compliance, the less impact violations should have on the health of the resource. In addition, higher compliance can show
that the angling public has a good understanding of the laws and rules and support them.
3. HOW WE ARE DOING
The Fish and Wildlife Division exceeded the statewide target of 90% voluntary compliance by obtaining a rate of 90.3 in 2011.
4. HOW WE COMPARE
On a national level, the Oregon State Police has been asked to provide information to other states on how we measure our performance through documenting
voluntary compliance rates. Some states have used Oregon as a model to set their own method of measuring compliance rates. The state of Washington is very
similar to Oregon as it relates to wildlife issues and geography. The Washington Department of Fish and Wildlife used to track voluntary compliance rates much
like the Oregon State Police; however, they discontinued this practice and decided to just track raw numbers (hours, contacts, number of violations). This was
done as Washington Department of Fish and Wildlife was experiencing difficulty in determining true compliance when multiple charges went toward a single
violator.
5. FACTORS AFFECTING RESULTS
Angler compliance can be impacted by many factors. In evaluating compliance rates, several factors seem to have an effect. Regulation complexity: Can people
understand the rules? Opportunity: Are there a lot of fish available? In several cases, we have observed poor compliance when few fish were being caught;
conversely we have observed very high compliance when fishing was really good. A huge factor is whether people see the merits of the regulation. In some
rules, anglers do not feel the regulation is effective so they tend to ignore or violate the rules. The barbed hook rule in the ocean is a good example. This rule
has been in place for over 15 years and still makes up the majority of violations in the ocean fisheries. People do not seem to think this rule accomplishes
anything because they are allowed to use barbed hooks in other areas.
Page 21 of 601/10/2013

POLICE, OREGON STATE DEPARTMENT of II. KEY MEASURE ANALYSIS
6. WHAT NEEDS TO BE DONE
Regulations need to be clear and simple with a strong biological base. Highly visible patrols need to be conducted in areas where violations occur. Continued
collaboration with enforcement and biologists to identify stocks that may be impacted by low compliance rates, and identify areas and times where fish are
most vulnerable to human caused or natural dangers.
7. ABOUT THE DATA
The reporting cycle for this measure is on a calendar year. The data is collected daily and reported monthly in a database. The data is then compiled on a
monthly or annual basis. For the purposes of consistent tracking for the performance measure, the data is compiled on a calendar year. All data that is
submitted by an officer is checked and approved before entry into the data system. The information is only available from an Oregon State Police data system
and copies can be obtained upon request.
Page 22 of 601/10/2013
POLICE, OREGON STATE DEPARTMENT of II. KEY MEASURE ANALYSIS
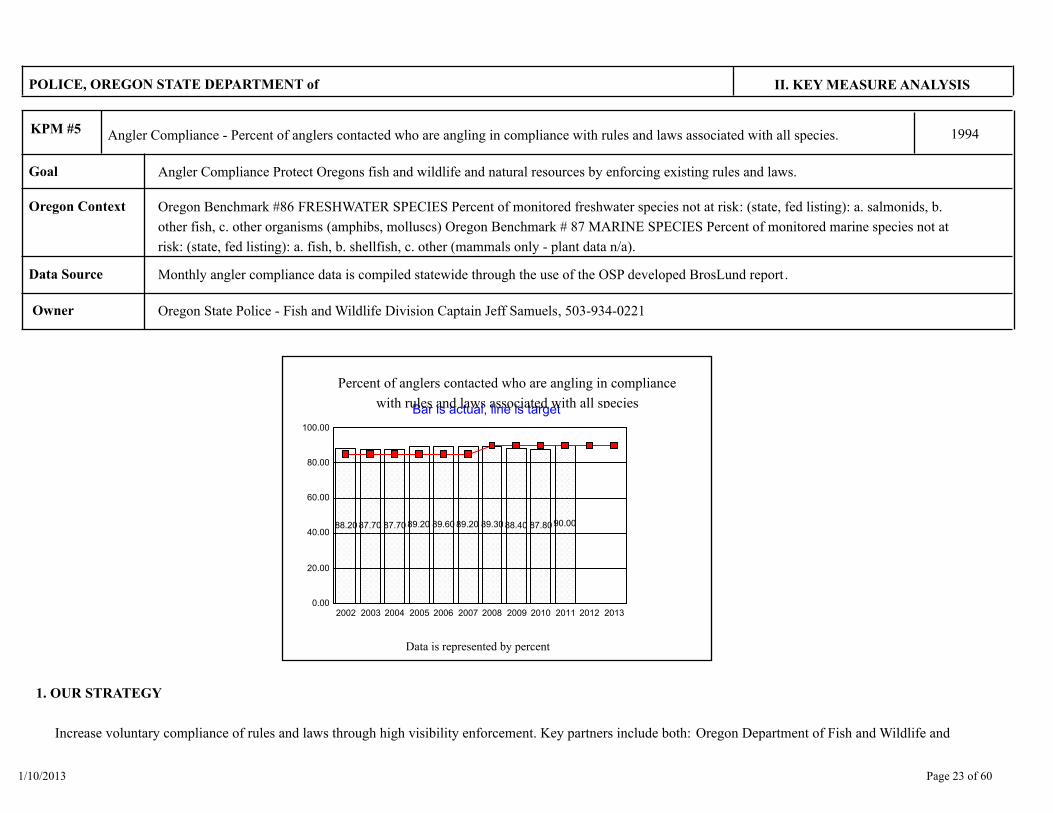
Angler Compliance - Percent of anglers contacted who are angling in compliance with rules and laws associated with all species.KPM #5 1994
Angler Compliance Protect Oregons fish and wildlife and natural resources by enforcing existing rules and laws.Goal
Oregon Context Oregon Benchmark #86 FRESHWATER SPECIES Percent of monitored freshwater species not at risk: (state, fed listing): a. salmonids, b.
other fish, c. other organisms (amphibs, molluscs) Oregon Benchmark # 87 MARINE SPECIES Percent of monitored marine species not at
risk: (state, fed listing): a. fish, b. shellfish, c. other (mammals only - plant data n/a).
Monthly angler compliance data is compiled statewide through the use of the OSP developed BrosLund report.Data Source
Oregon State Police - Fish and Wildlife Division Captain Jeff Samuels, 503-934-0221 Owner
0.00
20.00
40.00
60.00
80.00
100.00
2002 2003 2004 2005 2006 2007 2008 2009 2010 2011 2012 2013
88.20 87.70 87.70 89.20 89.60 89.20 89.30 88.40 87.80 90.00
Bar is actual, line is target
Percent of anglers contacted who are angling in compliance
with rules and laws associated with all species
Data is represented by percent
1. OUR STRATEGY
Increase voluntary compliance of rules and laws through high visibility enforcement. Key partners include both: Oregon Department of Fish and Wildlife and
Page 23 of 601/10/2013

POLICE, OREGON STATE DEPARTMENT of II. KEY MEASURE ANALYSIS
Oregon Watershed Enhancement Board
2. ABOUT THE TARGETS
The target was established by working with Oregon Dept. of Fish and Wildlife to set a level of compliance to assure that illegal take would not be a limiting
factor of the resource. The higher the compliance, the less impact violations should have on the health of the resource. In addition, higher compliance can show
that the angling public has a good understanding of the laws and rules and support them.
3. HOW WE ARE DOING
The Fish and Wildlife Division met the statewide target of 90% voluntary compliance by obtaining a rate of 90% in 2011.
4. HOW WE COMPARE
On a national level, the Oregon State Police provides information to other states on how we measure our performance through documenting voluntary
compliance rates. Some states use Oregon as a model to set their own method of measuring compliance rates. The state of Washington is very similar to
Oregon as it relates to wildlife issues and geography. The Washington Department of Fish and Wildlife used to track voluntary compliance rates much like the
Oregon State Police; however, they discontinued this practice and decided to just track raw numbers (hours, contacts, number of violations). The Washington
Department of Fish and Wildlife does not have a performance measure identical to Oregon's performance measure relating to a statewide compliance
associated with all fisheries.
5. FACTORS AFFECTING RESULTS
Angler compliance can be impacted by many factors. In evaluating compliance rates, several factors seem to have an effect. Regulation complexity: Can people
understand the rules? Opportunity: Are there a lot of fish available? In several cases, we have observed poor compliance when few fish were being caught;
conversely we have observed very high compliance when fishing was really good. A huge factor is whether people see the merits of the regulation. In some
rules, anglers do not feel the regulation is effective so they tend to ignore or violate the rules. The barbed hook rule in the ocean is a good example. This rule
has been in place for over 15 years and still makes up the majority of violations in the ocean fisheries. People do not seem to think this rule accomplishes
anything because they are allowed to use barbed hooks in other areas.
6. WHAT NEEDS TO BE DONE
Page 24 of 601/10/2013

POLICE, OREGON STATE DEPARTMENT of II. KEY MEASURE ANALYSIS
Regulations need to be clear and simple with a strong biological base. Highly visible patrols need to be conducted in areas where violations occur. Continued
collaboration with enforcement and biologists to identify stocks that may be impacted by low compliance rates, and identify areas and times where fish are
most vulnerable to human caused or natural dangers.
7. ABOUT THE DATA
The reporting cycle for this measure is on a calendar year. The data is collected daily and reported monthly in a database. The data is then compiled on a
monthly or annual basis. For the purposes of consistent tracking for the performance measure, the data is compiled on a calendar year. All data that is
submitted by an officer is checked and approved before entry into the data system. The information is only available from an Oregon State Police data system
and copies can be obtained upon request.
Page 25 of 601/10/2013

POLICE, OREGON STATE DEPARTMENT of II. KEY MEASURE ANALYSIS
Hunter Compliance – Percent of hunters contacted who are hunting in compliance with rules and laws associated with big game
hunting seasons.
KPM #6 1994
Hunter Compliance Protect Oregons wildlife and natural resources by enforcing existing rules and laws.Goal
Oregon Context Oregon Benchmark # 88 TERRESTRIAL SPECIES Percent of monitored terrestrial species not at risk: (state, fed listing): a. vertebrates, b.
invertebrates, c. plants
Monthly hunter compliance data is compiled statewide through the use of the OSP developed BrosLund report.Data Source
Oregon State Police - Fish and Wildlife Division Captain Jeff Samuels, 503-934-0221 Owner
0.00
20.00
40.00
60.00
80.00
100.00
2002 2003 2004 2005 2006 2007 2008 2009 2010 2011 2012 2013
87.40 83.80 87.50 87.00 86.90 86.50 86.30 86.60 87.20 87.00
Bar is actual, line is target
Percent of hunters contacted who are hunting in compliance
with rules and laws associated with big game hunting
Data is represented by percent
1. OUR STRATEGY
Increase voluntary compliance of rules and laws through high visibility enforcement. Key partners include the Oregon Department of Fish and Wildlife and
Page 26 of 601/10/2013

POLICE, OREGON STATE DEPARTMENT of II. KEY MEASURE ANALYSIS
Oregon Watershed Enhancement Board.
2. ABOUT THE TARGETS
The target was established by working with Oregon Department of Fish and Wildlife to set a level of compliance to assure that illegal take would not be a
limiting factor of the resource. The higher the compliance, the less impact violations should have on the health of the resource. In addition, higher compliance
can show that the hunting public has a good understanding of the laws and rules and support them. The Fish and Wildlife Division raised the target rate to 90%
in 2008.
3. HOW WE ARE DOING
The Fish and Wildlife Division nearly reached the statewide target of 90% compliance by obtaining a rate of 87% in 2011, this is down slightly from 2010. In
2007, we observed that the voluntary compliance rate in Central Oregon was below the statewide average. We contributed this lower compliance rate to the
population increase in Deschutes County, which caused an increased demand on the resource. The population in Deschutes County has increased 54% from
1990 to 2000 and has increased an additional 22.5% since the year 2000. This population increase has caused our troopers to respond to individual calls for
service rather than being available to dedicate their time to proactive enforcement efforts towards identified high-priority programs to gain voluntary
compliance. Troopers responding just to complaints tend to have lower compliance rates. We have assigned two additional troopers to the Central Oregon
area (Bend and Prineville) in an attempt to address these issues.
4. HOW WE COMPARE
On a national level, the Oregon State Police provides information to other states on how we measure our performance through documenting voluntary
compliance rates. Some states use Oregon as a model to set their own method of measuring compliance rates. The state of Washington is very similar to
Oregon as it relates to wildlife issues and geography. The Washington Department of Fish and Wildlife does not have a performance measure identical to
Oregon's performance measure relating to a statewide compliance associated with Big Game Hunting.
5. FACTORS AFFECTING RESULTS
Hunting compliance can be impacted by many factors. In evaluating compliance rates, several factors seem to have an effect. Regulation complexity: Can
people understand the rules? Opportunity: Can people draw or buy the tags they want? Can they hunt the areas they want or are familiar with? A primary
factor is whether people see the merits of the regulation. Some hunters may believe that as long as somebody in their party has a tag, it is okay to shoot their
Page 27 of 601/10/2013

POLICE, OREGON STATE DEPARTMENT of II. KEY MEASURE ANALYSIS
animal for them.
6. WHAT NEEDS TO BE DONE
Regulations need to be clear and simple with a strong biological base. Highly visible patrols need to be conducted in areas where violations occur. Continued
collaboration with enforcement and biologists to identify species and areas that may have low compliance rates, and identify areas and times when wildlife is
most vulnerable to human caused or natural dangers.
7. ABOUT THE DATA
The reporting cycle for this measure is on a calendar year. The data is collected daily and reported monthly in a data base. The data is then compiled on a
monthly or annual basis. For the purposes of consistent tracking for the performance measure, the data is compiled on a calendar year. All data that is
submitted by an officer is checked and approved before entry into the data system. The information is only available from the Oregon State Police data system
and copies can be obtained upon request.
Page 28 of 601/10/2013

POLICE, OREGON STATE DEPARTMENT of II. KEY MEASURE ANALYSIS
Crime Reduction - Percent of major crime team call-outs resolved within 12 months from date of call-out.KPM #7 1995
Crime Reduction Provide quality, comprehensive, cooperative investigative services.Goal
Oregon Context Oregon Benchmark #62 Overall reported crimes per 1,000 Oregonians
Monthly regional reports on Major Crime Team call-outs and closures.Data Source
Department of State Police - Criminal Investigation Division Captain Calvin Curths, 503-934-0230 Owner
0
20
40
60
80
100
2002 2003 2004 2005 2006 2007 2008 2009 2010 2011 2012 2013
8694 90 92 90 94
8494 94 91
Bar is actual, line is target
Percent of major crime team call-outs resolved within 12
months from date of call-out
Data is represented by percent
1. OUR STRATEGY
The 2005 Ways and Means Committee suggested an upward percentage revision of the targets to 75% for 2006-07 and 85% in continuing
years. The 2007 Oregon Legislature suggested an upward percentage revision of the targets to 92% in 2008 and 93% in 2009 given that
Page 29 of 601/10/2013
POLICE, OREGON STATE DEPARTMENT of II. KEY MEASURE ANALYSIS
the actual data for the three previous years has exceeded 90%. Actual levels are established by tracking major crime team callouts that
OSP detectives participate in across the state on a monthly basis.
2. ABOUT THE TARGETS
Between January and December of 2011, Major Crime Section detectives responded to 89 major crime team call-outs across the state. Of those, 81 were
resolved and 8 (9%) remain open. "Resolved" primarily means a case is closed by an arrest or indictment of the perpetrator. Cases are also closed and
considered resolved for other reasons, including: a death is determined to be accidental, natural, justifiable, or suicide; or the reported incident is otherwise
determined not to be a crime. Cases not closed within one year from the date of the callout are not considered "resolved" and remain open for the purposes of
this measure.
3. HOW WE ARE DOING
There was a 10 point increase in the actual resolved rate from 2008 to 2009. The 93% target rate established as a goal for the 2009 calendar year was
exceeded with an actual resolved rate of 94%. A resolution rate of 94% was achieved again in 2010, slightly exceeding the target of 93% for a second
consecutive year. In 2011 a resolution rate of 91% narrowly missed the 93% resolution target.
4. HOW WE COMPARE
Compared to the National resolution rate and the Pacific Region resolution rate, Oregon’s major crime teams are doing very well. The National resolution rate
in 2011 was 64.8% for murder and non-negligent manslaughter, and 47.7% for all violent crime*. The Pacific Region resolution rate was only 62.6% for
murder and non-negligent manslaughter, and 44.9% for all violent crime*. The average actual resolved rate for Major Crime Team call-outs during the last five
years is 91.4%. (*Source: FBI Uniform Crime Reporting (UCR) Program 2011).
5. FACTORS AFFECTING RESULTS
The Major Crimes Section assists local law enforcement agencies in investigating major crimes of violence. The goal is to quickly and efficiently investigate and
resolve crimes against people. This service is primarily provided by participation in major crime teams throughout the state. The complex nature of these
investigations, who the lead agency is at the time, and the geographical location of the team involved could all have a dramatic impact on the success of this
Key Performance Measure. Other contributing factors may be due to attrition causing our agency and others to have a less tenured workforce with less
experience. Keeping all of that in mind the Major Crimes Section is still exceeding the National and Regional averages considerably.
Page 30 of 601/10/2013

POLICE, OREGON STATE DEPARTMENT of II. KEY MEASURE ANALYSIS
6. WHAT NEEDS TO BE DONE
Continue participation in the major crime teams and maintain availability of other support functions to assist in investigations as needed. Continue training and
career development of Major Crime Section detectives to maintain a high level of competency due to the attrition of experienced detectives.
7. ABOUT THE DATA
The data for each calendar year regarding the closure rate of these call-outs demonstrates how effectively and efficiently major crimes are being investigated
and resolved throughout the state.
Page 31 of 601/10/2013
POLICE, OREGON STATE DEPARTMENT of II. KEY MEASURE ANALYSIS
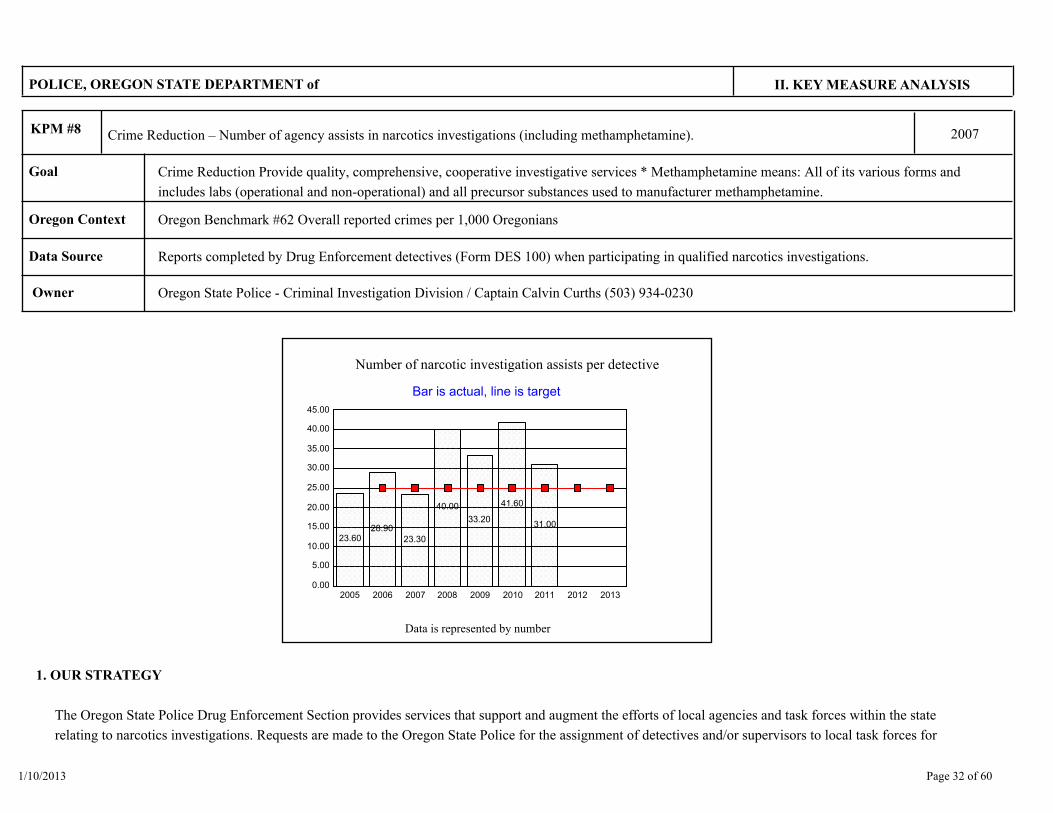
Crime Reduction – Number of agency assists in narcotics investigations (including methamphetamine).KPM #8 2007
Crime Reduction Provide quality, comprehensive, cooperative investigative services * Methamphetamine means: All of its various forms and
includes labs (operational and non-operational) and all precursor substances used to manufacturer methamphetamine.
Goal
Oregon Context Oregon Benchmark #62 Overall reported crimes per 1,000 Oregonians
Reports completed by Drug Enforcement detectives (Form DES 100) when participating in qualified narcotics investigations.Data Source
Oregon State Police - Criminal Investigation Division / Captain Calvin Curths (503) 934-0230 Owner
0.00
5.00
10.00
15.00
20.00
25.00
30.00
35.00
40.00
45.00
2005 2006 2007 2008 2009 2010 2011 2012 2013
23.6028.90
23.30
40.00
33.20
41.60
31.00
Bar is actual, line is target
Number of narcotic investigation assists per detective
Data is represented by number
1. OUR STRATEGY
The Oregon State Police Drug Enforcement Section provides services that support and augment the efforts of local agencies and task forces within the state
relating to narcotics investigations. Requests are made to the Oregon State Police for the assignment of detectives and/or supervisors to local task forces for
Page 32 of 601/10/2013

POLICE, OREGON STATE DEPARTMENT of II. KEY MEASURE ANALYSIS
the purpose of assisting those task forces with conducting narcotics investigations. The Oregon State Police participation in narcotics task forces enables the
task force to conduct investigations that would not otherwise be possible, particularly relating to methamphetamine. All investigations are considered agency
assists whether the Oregon State Police detective is the case agent, co-case agent or assisting a detective from another agency or task force.
2. ABOUT THE TARGETS
Historical data has been used to set the average number of investigations per detective at 25 per year. The Actual number of investigations in the chart is based
on the average number of cases worked per detective (FTE).
3. HOW WE ARE DOING
The average number of investigations per detective decreased in 2011 compared to 2010, the average over the last three years has been well above the target.
4. HOW WE COMPARE
Washington State Police does not have any comparable data because they do not track or monitor the equivalent data points used to calculate our KPM.
Idaho State Police do track comparable data points and their average investigations per detective for 2010 were 12.9. This is significantly lower than Oregon
State Police, but may be attributed to the nature of the investigations focused on by Idaho State Police investigators.
5. FACTORS AFFECTING RESULTS
Task forces vary in their mission to target street level, mid level or upper level drug trafficking organizations. Mid and upper level narcotic investigations tend to
be longer in duration while street level investigations tend to be short term. For example, long term investigations tend to take months while short term
investigations may only take one to several days. The types of investigations conducted will affect the length of time and thus the number of investigations an
individual detective or group of detectives can accomplish. Changes in narcotics trends also influence the type and length of investigations being conducted.
6. WHAT NEEDS TO BE DONE
Continue participation in multi-agency narcotics task forces in order to disrupt and dismantle drug trafficking organizations.
7. ABOUT THE DATA
Page 33 of 601/10/2013
POLICE, OREGON STATE DEPARTMENT of II. KEY MEASURE ANALYSIS
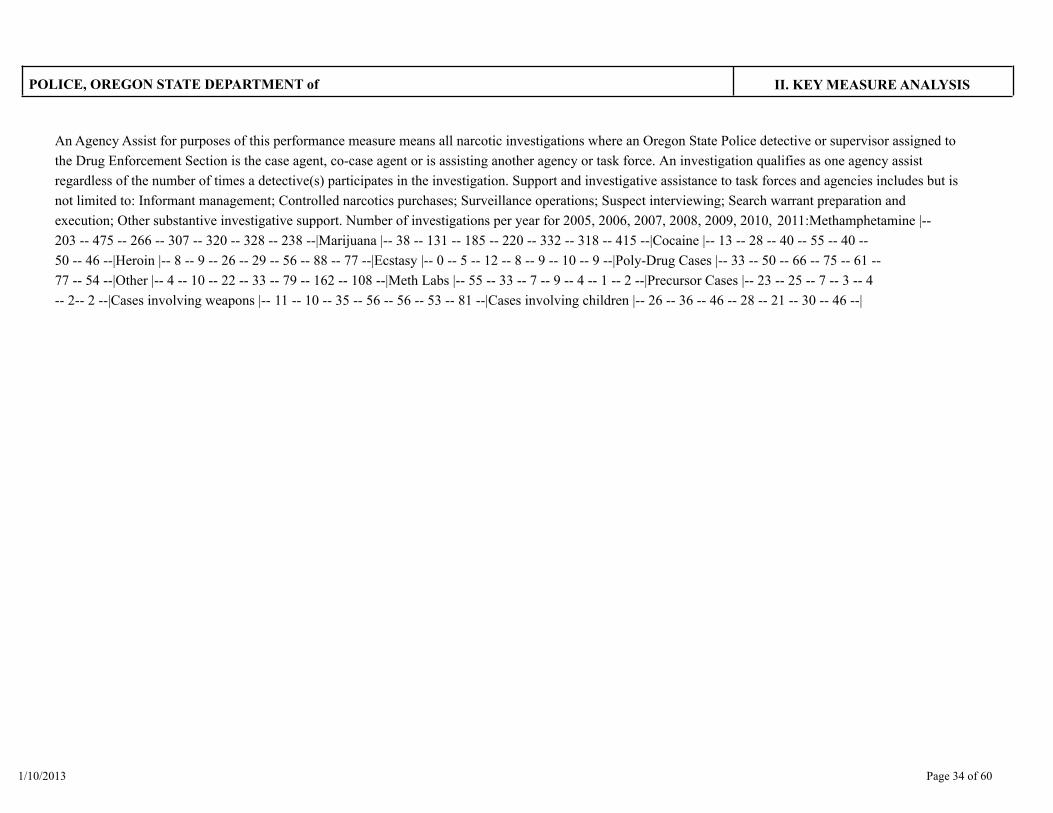
An Agency Assist for purposes of this performance measure means all narcotic investigations where an Oregon State Police detective or supervisor assigned to
the Drug Enforcement Section is the case agent, co-case agent or is assisting another agency or task force. An investigation qualifies as one agency assist
regardless of the number of times a detective(s) participates in the investigation. Support and investigative assistance to task forces and agencies includes but is
not limited to: Informant management; Controlled narcotics purchases; Surveillance operations; Suspect interviewing; Search warrant preparation and
execution; Other substantive investigative support. Number of investigations per year for 2005, 2006, 2007, 2008, 2009, 2010, 2011:Methamphetamine |--
203 -- 475 -- 266 -- 307 -- 320 -- 328 -- 238 --|Marijuana |-- 38 -- 131 -- 185 -- 220 -- 332 -- 318 -- 415 --|Cocaine |-- 13 -- 28 -- 40 -- 55 -- 40 --
50 -- 46 --|Heroin |-- 8 -- 9 -- 26 -- 29 -- 56 -- 88 -- 77 --|Ecstasy |-- 0 -- 5 -- 12 -- 8 -- 9 -- 10 -- 9 --|Poly-Drug Cases |-- 33 -- 50 -- 66 -- 75 -- 61 --
77 -- 54 --|Other |-- 4 -- 10 -- 22 -- 33 -- 79 -- 162 -- 108 --|Meth Labs |-- 55 -- 33 -- 7 -- 9 -- 4 -- 1 -- 2 --|Precursor Cases |-- 23 -- 25 -- 7 -- 3 -- 4
-- 2-- 2 --|Cases involving weapons |-- 11 -- 10 -- 35 -- 56 -- 56 -- 53 -- 81 --|Cases involving children |-- 26 -- 36 -- 46 -- 28 -- 21 -- 30 -- 46 --|
Page 34 of 601/10/2013

POLICE, OREGON STATE DEPARTMENT of II. KEY MEASURE ANALYSIS
Forensic Analysis Turnaround Time - Average number of working days from when a request is received at the Forensics Laboratory,
until a completed analytical report is prepared.
KPM #9 1994
Crime Reduction Provide quality, comprehensive, cooperative investigative servicesGoal
Oregon Context Oregon Benchmark #62 - Overall reported crimes per 1,000 Oregonians
Data is compiled quarterly from the Laboratory Information Management System (LIMS)Data Source
Department of State Police - Forensic Services Division / Captain Michael Dingeman, 503-934-0268 Owner
0.00
10.00
20.00
30.00
40.00
50.00
60.00
2002 2003 2004 2005 2006 2007 2008 2009 2010 2011 2012 2013
30.70 32.0038.70
54.50 53.5049.00
39.2045.10
57.90 60.00
Bar is actual, line is target
Average number of working days from when a request is
received at the Forensics Laboratory, until a completed
Data is represented by number
1. OUR STRATEGY
The Forensic Services Division is the only full service laboratory system in Oregon. The purpose of the Forensic Services Division is to provide timely and
accurate scientific, technical, and investigative support to the criminal justice system through forensic analysis.
Page 35 of 601/10/2013

POLICE, OREGON STATE DEPARTMENT of II. KEY MEASURE ANALYSIS
2. ABOUT THE TARGETS
The goal had been set, historically, at fifteen days for the Forensics Division KPM of Turnaround Time. This goal was documented as having been set due to
conversations with Forensics Division customers (e.g. OACP, OSSA, and ODAA) and their expectations and agency needs. Data over the last eight years
suggested that the goal of fifteen days was unrealistic for an overall goal. While specific disciplines, such as drug chemistry or toxicology, might realize a fifteen
day turnaround time, other disciplines, like DNA or latent fingerprint analysis, generally will have a substantially higher turnaround time. The number of requests
from the longer turnaround time disciplines will continue to keep the Forensics Division from realizing this goal. Based on this information a new goal of thirty
days has been established as the turnaround time for the Forensics Division KPM goal. This goal will take into account the high number of requests that the
Forensics Division receives in the more time consuming forensics disciplines but also takes in to account the historic data that has been compiled in the last few
years.
3. HOW WE ARE DOING
We estimate in past years, up to 30% of crimes needing evidence examined by the Forensic Services Division was not submitted, due to large backlogs in
casework analysis. Backlogs occurred in all areas of analysis to the degree that the turnaround times rose from approximately 30 days in 2002/early 2003 to
53 days in 2006. With the resources added over the 2007-09 biennium and the relaxing of submission restrictions we have started to see an increase in the
number of requests over the last few years. This is especially noticeable in requests for DNA analysis, for example, where we received approximately
1,500-1,600 requests annually in 2005 and 2006 and jumped to 1,900-2,000 requests per year from 2008 to 2011. While the overall turnaround time
demonstrates an increase from 2010 to 2011, the total number of requests completed by Forensics personnel increased from 22,516 in 2010 to 23,803 in
2011.
4. HOW WE COMPARE
There is no national standard performance measure that compares directly to our measures.
5. FACTORS AFFECTING RESULTS
Fifteen additional positions were allocated between July 1, 2007 & June 30, 2009. Due to rigorous and lengthy hiring practices, most of those positions were
not filled until 2008 through early 2009. Forensic personnel also require lengthy training programs (some up to 2 or more years) so the employees in these
positions were training in their respective disciplines during 2009 and through 2010. Those in training also required resources of senior employees as trainers,
Page 36 of 601/10/2013

POLICE, OREGON STATE DEPARTMENT of II. KEY MEASURE ANALYSIS
limiting their available time for casework duties. As the additional personnel complete their training and begin testing evidence, backlogged requests begin
entering the queue for analysis. These are generally requests that are lower priority and without the additional personnel, very few of the requests would have
been tested. Because those backlogged requests have been awaiting assignment for analysis, they create an increase in the measured turnaround time, due to
having been previously backlogged.
6. WHAT NEEDS TO BE DONE
The primary solution for alleviating backlogs within Forensics is the addition of resources. More forensic scientists would allow for additional and timelier
casework completion.
7. ABOUT THE DATA
The reporting cycle for this performance measure is calendar year. Data is compiled quarterly from the Laboratory Information Management System (LIMS)
and reported on an annual basis.
Page 37 of 601/10/2013
POLICE, OREGON STATE DEPARTMENT of II. KEY MEASURE ANALYSIS
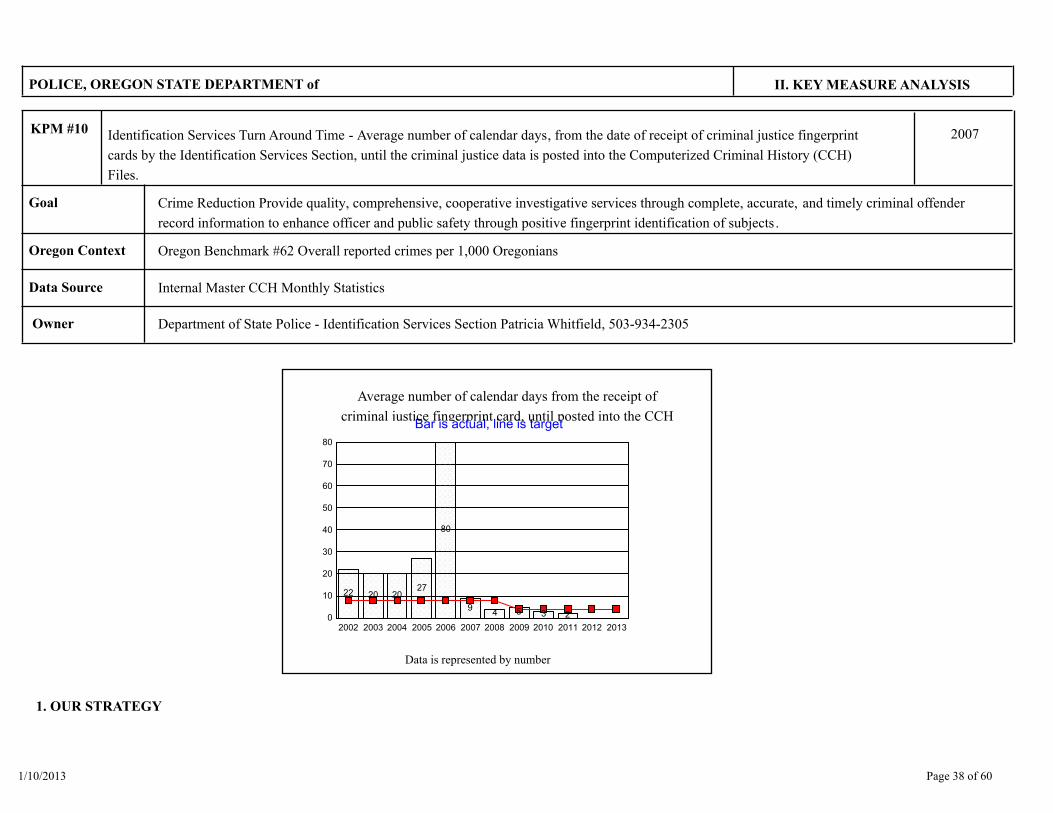
Identification Services Turn Around Time - Average number of calendar days, from the date of receipt of criminal justice fingerprint
cards by the Identification Services Section, until the criminal justice data is posted into the Computerized Criminal History (CCH)
Files.
KPM #10 2007
Crime Reduction Provide quality, comprehensive, cooperative investigative services through complete, accurate, and timely criminal offender
record information to enhance officer and public safety through positive fingerprint identification of subjects .
Goal
Oregon Context Oregon Benchmark #62 Overall reported crimes per 1,000 Oregonians
Internal Master CCH Monthly StatisticsData Source
Department of State Police - Identification Services Section Patricia Whitfield, 503-934-2305 Owner
0
10
20
30
40
50
60
70
80
2002 2003 2004 2005 2006 2007 2008 2009 2010 2011 2012 2013
22 20 2027
80
94 5 3 2
Bar is actual, line is target
Average number of calendar days from the receipt of
criminal justice fingerprint card, until posted into the CCH
Data is represented by number
1. OUR STRATEGY
Page 38 of 601/10/2013
POLICE, OREGON STATE DEPARTMENT of II. KEY MEASURE ANALYSIS
To provide positive identification of subjects in custody through accurate and complete computerized criminal history record information that is available when
criminal justice and non-criminal justice users need it. Timely records enhance officer and public safety, as well as provide data for jail release decisions,
sentencing, employment and licensing, etc.
2. ABOUT THE TARGETS
Turnaround times include the entire manual process workflow from point of receipt to point of posting for access by all users . Both the CCH and AFIS units
including the computer systems used by each are necessary to complete this process. Staffing levels must be steady and employees fully trained in order to
effect the most efficient processing. Our target continues to change as we transition into a new way of conducting work through automation. We maintain two
measured targets 1) mailed-in manual card processing turnaround time, and 2) fully automated card processing turnaround time.
3. HOW WE ARE DOING
The way we do business has been changing dramatically and continues to change from how things have been done in previous years. Historically our ability to
meet the performance measure objective solely depended on staffing level resources. As technology emerged, a smooth workflow also required that the
Identification Services Section maintain its computer infrastructure and critical systems along with keeping a minimum staffing level of all authorized FTE
positions filled each year. Beginning with a budget shortfall in 2003 followed by a combination of further budget and resource related issues, fee increases and
hiring freeze through late 2005, these factors contributed to our inability to continue to meet the then stated objective of 8 days. In 2006 we began a recovery
process with recruiting and training for 19 vacant positions. By the end of the first quarter of 2007 we began to meet our turnaround goal on a monthly basis.
Additionally in 2008 we implemented a new level of supervision through shift supervisors in support of staff and our 24/7 workflow. In 2008 we maintained the
KPM goal and began to exceed that goal for most months. The rollout of automated transmissions for all users created some operational spikes which were
smoothed out by the end of 2009. We anticipate continued improvement in services through further decreases in turnaround times for all services with the aid
of technology advances made in 2008 and 2009. In July 2010 all remaining livescan devices at booking facilities were transitioned to direct submit auto
processing.
4. HOW WE COMPARE
There is no current direct comparison due to the differences from state to state regarding processing of arrest fingerprint cards as a result of organizational
structure, funding and technical resources available, and state laws in some cases. However some states are providing total automated processing where no
human intervention takes place while others are in a mostly manual process status. Oregon has a combination of both automated and manual processing. We
continue to shift as much workflow as possible to automated processing in order to gain more efficiency.
Page 39 of 601/10/2013
POLICE, OREGON STATE DEPARTMENT of II. KEY MEASURE ANALYSIS
5. FACTORS AFFECTING RESULTS
Staffing levels and agency use of livescan technology both have a direct affect on our performance results as do our infrastructure systems availability . Agency
submissions through livescan significantly improve our ability to provide real-time results. 100% of Oregon’s county jail facilities use livescan technology to
submit their arrest fingerprint cards with a growing number of local Police Departments also acquiring livescan technology for contributing fingerprint
submissions. Our goal is to have 100% of those agencies submitting data directly into our AFIS/CCH Interface for 2 hour or less turnaround for criminal arrest
responses and 24 hour or less for applicant responses; we anticipate reaching this goal in 2011. For agencies without livescan, our goal is to also provide same
day turnaround; however the difference being same day once the submission is received at our office via US mail, shuttle, etc.
6. WHAT NEEDS TO BE DONE
Continue to work on standards based data transmission with agencies and vendors for the ability to connect directly to our interface as well as encourage
agencies to obtain livescan or livescan services to replace manual inked fingerprinting processes whenever possible. Work with agencies to assist them in
making their submissions as they occur via livescan and if mailed through US Mail or shuttle, ensure they are sent daily for an even workflow. The use of
technology has heightened our dependence on infrastructure. We must maintain, modify, and keep IT programs and systems current in order to meet the
demands for record keeping in general.
7. ABOUT THE DATA
The reporting cycle for this performance measure is calendar year. Statistics are compiled monthly from reports generated by our CCH interface system
“FOCUS” for work processed based on date of receipt and date of completion. Specifically this turnaround time is an average of all work processed during
the month. Submissions, completions, turnaround, and pending work are all tracked within this performance measure as a means to operationally monitor
progress and target bottleneck areas within the process where a shift in resources may be needed.
Page 40 of 601/10/2013

POLICE, OREGON STATE DEPARTMENT of II. KEY MEASURE ANALYSIS
RESIDENTIAL FIRE DEATH RATE: - Number of Oregonians per capita that die in a residential fire.KPM #11 2008
Fire Safety - Reduce loss of life and property as a result of fire and hazardous materials. Residential Fire Death Rate. Annually reduce
residential fire deaths by 5%.
Goal
Oregon Context OBM # 45 PREVENTABLE DEATH Years of life lost before age 70 (rate per 1000)
Information obtained from Fire Fatality Reports submitted to the Data Unit of the Office of State Fire Marshal.Data Source
State Fire Marshal Mark Wallace - 503-934-8216 Owner
0.00
2.00
4.00
6.00
8.00
10.00
2004 2005 2006 2007 2008 2009 2010 2011 2012 2013
9.50
5.50
7.30 7.207.90
5.204.20
5.20
Bar is actual, line is target
Number of fire fatalities per million (Numbers exclude
vehicle, homicides, suicides, and other nonresidential fire
Data is represented by number
1. OUR STRATEGY
Residential structure fires account for the vast majority (93%) of Oregon fire deaths. (It should be noted the terms “death” and “fatality” are used
interchangeably) The Office of State Fire Marshal (OSFM) strives to deliver comprehensive fire prevention and life safety programs and services including
Page 41 of 601/10/2013

POLICE, OREGON STATE DEPARTMENT of II. KEY MEASURE ANALYSIS
Community Education, Youth Fire Prevention & Intervention, Technical Fire Code Development, licensing programs for liquefied petroleum gas and fireworks,
and regulation of toylike lighters and self-extinguishing cigarettes. Education empowers all Oregonians to play their role in fire prevention, and increase the
likelihood of surviving a fire by reducing the risks and teaching behaviors and better safety choices. Advancing compliance with fire codes reduce risk and
increase the ability to survive a fire. Plan reviews and inspections identify and mitigate potential fire hazards. Combined, these programs reduce the number of
residential fires and fire casualties in Oregon by improving public awareness and knowledge about fire danger. The OSFM actively collaborates with Oregon’s
fire service to ensure a full spectrum of networks and resources reach and benefit Oregonians. The Oregon Fire Fatality Review Committee (OFFRC),
comprised of fire service and OSFM personnel, collectively reviews fire fatality data and makes strategic recommendations to reduce residential fire fatalities in
Oregon. The OFFRC meets quarterly to review Oregon fire fatalities and monitor follow-through of its recommendations in support of this performance
measure.
2. ABOUT THE TARGETS
The “Residential Fire Death Rate” is calculated by dividing the number of unintentional residential fire deaths by the Oregon population in millions. During
2004-2008, Oregon’s residential fire death rate averaged 8.0 and, in 2008, the residential fire death rate was 7.9. The targets set for 2009, 2010, 2011,
2012, and 2013 are a 5% reduction per year from Oregon’s 2008 residential fire death rate. This translates to a target rate of 7.5 in 2009, 7.1 in 2010, 6.7 in
2011, 6.4 in 2012, and 6.1 in 2013.
3. HOW WE ARE DOING
In 2011, Oregon’s residential fire death rate was 5.2, exceeding the 2011 target of 6.7 by 22%.
4. HOW WE COMPARE
The most recent national data available is for the year 2010. Oregon’s 2010 residential fire death rate compared to the national five year average from
2006-2010 was the 17th lowest in the nation. Oregon’s 2010 rate (compared with 2010 national data) places the state as the 5th lowest in the nation.
National data is not readily available and may lag nearly two years behind the current year.
5. FACTORS AFFECTING RESULTS
A complex set of variables influence whether a fire incident results in a fatality. The fatality data is contributed by responding fire departments from across the
state, all of which have varying protection capacities. The Office of State Fire Marshal efforts to provide resources to increase prevention enhance local
Page 42 of 601/10/2013

POLICE, OREGON STATE DEPARTMENT of II. KEY MEASURE ANALYSIS
responders. The OFFRC’s analysis of fatal fires considered fire cause, location, time, property characteristics, victim demographics and socioeconomics,
human factors, smoke alarm presence, and sprinkler presence. Fire prevention and life safety education are critical to reducing the number of fire deaths.
Socioeconomic, cultural, cognitive, and educational influences affect an individual’s ability to understand how to prevent fires in their residences. Cultural
differences prevent understanding of the life-saving capacity of smoke alarms and in-home fire prevention habits. Older and low-income housing is less likely to
have a sufficient number of working smoke alarms. The OSFM works to address these issues in its fire prevention and life safety education programs. In
addition, key regulations regarding smoke alarms (OAR 837.045), fire standard compliant cigarettes (OAR 837.035), and novelty/toylike lighters (OAR
837.046) were put in place with the intent of reducing fires, injuries, and fatalities. Still, the biggest factor affecting the results in this area is the awareness and
behavior of the individuals in and around a residence that catches on fire.
6. WHAT NEEDS TO BE DONE
The OFFRC’s eight recommendations, presented in an April 2010 report, are the basis of the OSFM’s strategy to meet this performance measure: (1) Expand
Older Adult Fire Prevention Program, (2) Improve Smoke Alarm Program, (3) Increase Home Fire Escape Planning Effort, (4) Promote Installation of Home
Fire Sprinklers, (5) Target Fire Prevention and Life Safety Education to At-Risk Population, (6) Increase Cigarette-Caused Fire Education, (7) Monitor
Legislative and Regulatory Processes, and (8) Improve Data Collection and Review. These recommendations are presented in detail in the committee’s report.
The tactics supporting these recommendations involve collaboration with Oregon’s entire fire service. The OFFRC and the OSFM’s Community Education
Section will monitor the success of the tactics. Where possible, the progress will be quantified. For example, progress in Recommendation #1 could be
evidenced by a decline in older adult fatalities, as a percentage of all fatalities. Progress in Recommendation #2 could be evidenced by an increase in the
number of working smoke alarms in fires that did not have fatalities. Success in each of the eight strategic recommendations will impact the ability of OSFM to
meet and exceed the overall target of this performance measure.
7. ABOUT THE DATA
Note: The terms “death” and “fatality” are used interchangeably.Fire Fatality Data. Fatality incident data is obtained from Oregon’s fire incident
database and medical examiner reports. The fire incident database includes incident and casualty data reported to the OSFM by Oregon fire agencies. Every
Fire Chief is required to provide OSFM with a full report of every fire occurring within his or her jurisdiction (ORS 476.210). When a fire is of undetermined
or suspicious origin, or involved a death or serious injury, the investigator must report to OSFM within seven days of the incident (ORS 476.220). When a
civilian fatality is reported by a fire agency, OSFM obtains a copy of the medical examiner report to confirm the cause of death as fire related. This
performance measure counts only fatalities from unintentional residential property fires where the victim is under 70 years old. The definition of ‘residential’
conforms to the residential property category in the National Fire Incident Reporting System, which includes houses, multi-family housing, dormitories, mobile
homes or travel trailers used as a fixed residence, nursing homes, assisted living facilities, and hotel/motels. Excluded from this performance measure are
Page 43 of 601/10/2013

POLICE, OREGON STATE DEPARTMENT of II. KEY MEASURE ANALYSIS
fatalities from intentional residential fires (i.e. suicides or homicides), non-residential property fires, vehicle fires, aircraft fires, and outdoor property fires.
Population counts are obtained from the “Annual Oregon Population Report”, produced by the Population Research Center at Portland State University.
Comparisons use national unintentional residential fire fatality data obtained from the Web-based Injury Statistics Query and Reporting System (WISQARS
™) http://www.cdc.gov/injury/wisqars/fatal_injury_reports.html.The mortality data reported in WISQARS™ comes from death certificate data reported to the
National Center for Health Statistics (NCHS), part of the Centers for Disease Control and Prevention. NCHS collects, compiles, verifies and prepares these
data for release to the public. The process takes approximately 18 months after the end of a given year. This KPM uses the 'Fatal Injury Reports 1999-2008,
for National, regional, and States (RESTRICTED)*' report, and use the following criteria: Unintentional - Fire/flame - United States - All races - Both sexes -
Years 2004 to 2008 - All origins - All age groups - 2000 Standardized year - by State as selected output group.Oregon’s Residential Fire Death Rates are
calculated by the Office of State Fire Marshal (OSFM); rates do not always match the Oregon rates calculated by WISQARS ™. Discrepancies are generally
small and attributed to differences in methodology and sources. The OSFM rates are considered the true rates and are the rates used by this performance
measure to compare to the target and national data.
Page 44 of 601/10/2013
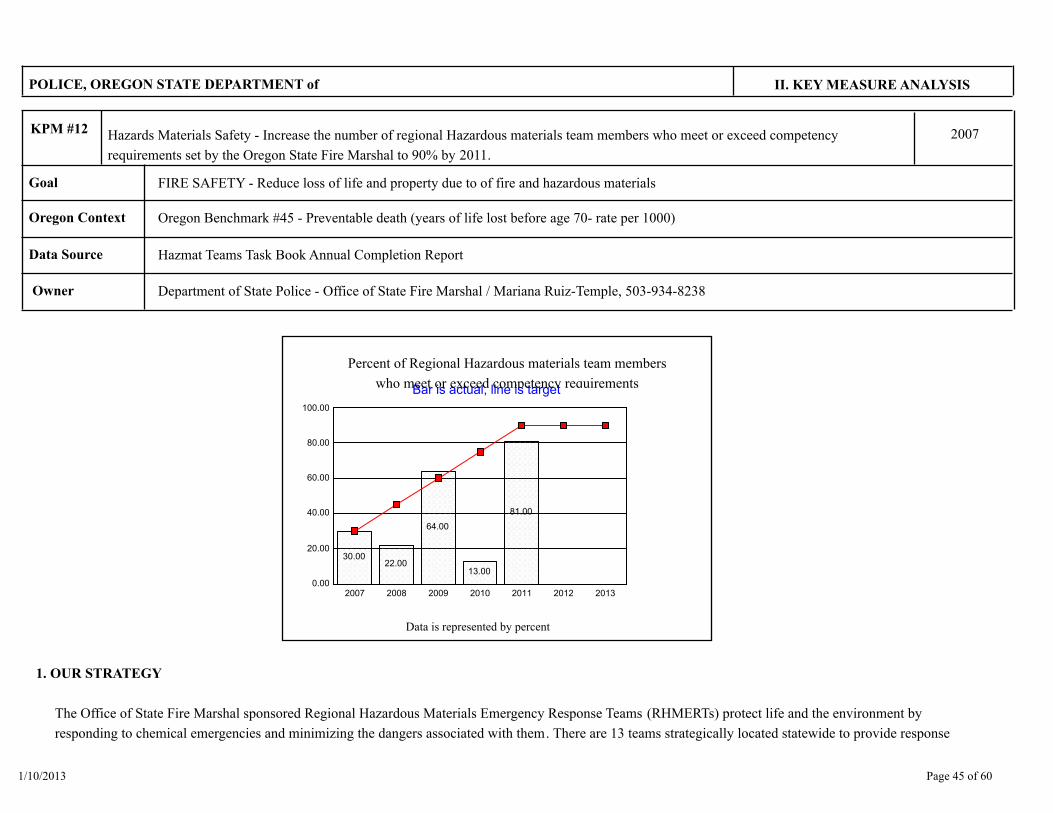
POLICE, OREGON STATE DEPARTMENT of II. KEY MEASURE ANALYSIS
Hazards Materials Safety - Increase the number of regional Hazardous materials team members who meet or exceed competency
requirements set by the Oregon State Fire Marshal to 90% by 2011.
KPM #12 2007
FIRE SAFETY - Reduce loss of life and property due to of fire and hazardous materialsGoal
Oregon Context Oregon Benchmark #45 - Preventable death (years of life lost before age 70- rate per 1000)
Hazmat Teams Task Book Annual Completion ReportData Source
Department of State Police - Office of State Fire Marshal / Mariana Ruiz-Temple, 503-934-8238 Owner
0.00
20.00
40.00
60.00
80.00
100.00
2007 2008 2009 2010 2011 2012 2013
30.0022.00
64.00
13.00
81.00
Bar is actual, line is target
Percent of Regional Hazardous materials team members
who meet or exceed competency requirements
Data is represented by percent
1. OUR STRATEGY
The Office of State Fire Marshal sponsored Regional Hazardous Materials Emergency Response Teams (RHMERTs) protect life and the environment by
responding to chemical emergencies and minimizing the dangers associated with them. There are 13 teams strategically located statewide to provide response
Page 45 of 601/10/2013

POLICE, OREGON STATE DEPARTMENT of II. KEY MEASURE ANALYSIS
to hazardous materials incidents, one fewer than previous reports. In 2010, RHMERT#12 (La Grande) ceased participated in the program and that area of
Oregon is now covered by RHMERT# 10 from Hermiston and RHMERT# 14 from Ontario. The teams consist primarily of volunteer and career firefighters,
with some law enforcement and public works employees. Team members attend a minimum of 160 hours of specialized training to become hazardous material
technicians.RHMERTs develop and monitor local contracts with the Office of State Fire Marshal (OSFM) to ensure public safety through the mitigation of
hazardous materials incidents occurring throughout Oregon. OSFM collaborates with the Regional RHMERTs to ensure proper training, equipment and
medical exams to meet national standards. RHMERTs work with and train local responders and industry to ensure local communities are prepared to respond
to a hazardous materials incident and create a safer community. Based on a partnership with local government, the OSFM, and industry pooled resources
create an economical model for successful response to hazardous materials incidents. The 13 RHMERTs are the key partners for this measure, while the
people of Oregon are the primary beneficiaries. The goal is to ensure RHMERT members are trained to provide an optimal hazardous materials response.
Each RHMERT is expected to provide an adequate number of trained personnel to operate within the safety levels specified in OR-OSHA OAR 437, Division
2. Each team limits activities to those specified safety and training levels. Each member of the 13 RHMERTs uses a “task book” to certify they meet the
standards created and approved by the Teams Training Advisory Group and OSFM. Task books must be completed on a two-year cycle to demonstrate that
they meet or exceed the competency standards. The teams provide this information once a year to the OSFM. It is on file so teams training needs may be
evaluated and training resources delivered. Team members are expected to document training and/or experience by completing the Hazardous Material
Technician Task Book within an established 24 month period.
2. ABOUT THE TARGETS
Because of the two-year task book completion standards, the statistical target will only be valid every other year and the lower-than-target statistics (13% for
2010, for example) are simply a status report. The OSFM and the Teams Training Advisory Group established competency standards to ensure consistent
training and response capabilities by all RHMERT members throughout the state. OSFM established the 90% completion target for the RHMERT members to
meet or exceed competency requirements by 2011.
3. HOW WE ARE DOING
In 2011, 13 RHMERTs submitted their annual training reports documenting their progress; 81% of the team members completed their task books within the
two year time frame from January 2010 to December 2011. This fell short of the 90% target by 9%. The next two year task book completion period starts
January 2012 and ends on December 31 2013. Those who did not complete the task book in the two-year cycle may continue to respond with a limited
response capacity, since team members may take actions that fall within their level of training.
4. HOW WE COMPARE
Page 46 of 601/10/2013

POLICE, OREGON STATE DEPARTMENT of II. KEY MEASURE ANALYSIS
Currently there is no federal standard to compare with the Teams Task Book Annual Completion Report. Most hazmat teams and emergency responders
throughout the United States complete task books one time to demonstrate competency. Because the OSFM program requires technicians to complete these
on a biannual basis we will be identifying better ways to compare our task book to other groups who report similar data.
5. FACTORS AFFECTING RESULTS
The last two year task book completion period started January 2010 and ended December 2011. Calendar year 2010 training documentation provided a mid
cycle look at team members progress and training needs. Because team members are given two years to complete the task book, the completion numbers
reported halfway through the reporting cycle will be lower the first year compared to the second year. Team members currently in the process of completing
their books that have completed a task book in the prior reporting cycle are considered to have met the competency requirements of OSFM.
6. WHAT NEEDS TO BE DONE
Maintain the ability for team members to attend seminars, conferences and courses nationwide for advanced training. Continue to assist teams in bringing
advanced training to their locations so the entire team can attend.
7. ABOUT THE DATA
The Teams Advisory Group and OSFM approved the task book created by the Teams Training Advisory Group. The tasks in the book are in compliance with
NFPA 472 and follow the curriculum provided by the International Association of Fire Fighters. Because the 2010 data is mid-cycle data, the reported actual
percentage for 2010 may seem low, i.e. only 13% are 100% completed. The target of 90% for 2011 is the goal for the two-year cycle from January 2010 to
December 2011.
Page 47 of 601/10/2013
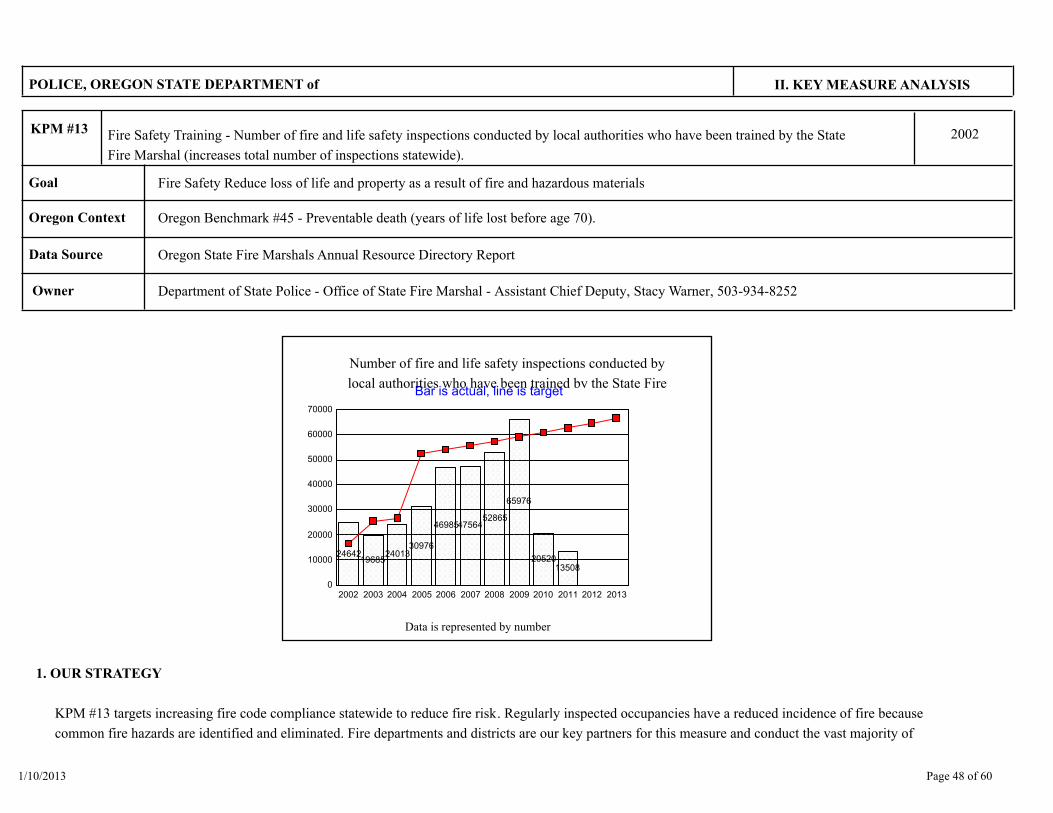
POLICE, OREGON STATE DEPARTMENT of II. KEY MEASURE ANALYSIS
Fire Safety Training - Number of fire and life safety inspections conducted by local authorities who have been trained by the State
Fire Marshal (increases total number of inspections statewide).
KPM #13 2002
Fire Safety Reduce loss of life and property as a result of fire and hazardous materialsGoal
Oregon Context Oregon Benchmark #45 - Preventable death (years of life lost before age 70).
Oregon State Fire Marshals Annual Resource Directory ReportData Source
Department of State Police - Office of State Fire Marshal - Assistant Chief Deputy, Stacy Warner, 503-934-8252 Owner
0
10000
20000
30000
40000
50000
60000
70000
2002 2003 2004 2005 2006 2007 2008 2009 2010 2011 2012 2013
2464219685
2401330976
469854756452865
65976
2052013508
Bar is actual, line is target
Number of fire and life safety inspections conducted by
local authorities who have been trained by the State Fire
Data is represented by number
1. OUR STRATEGY
KPM #13 targets increasing fire code compliance statewide to reduce fire risk. Regularly inspected occupancies have a reduced incidence of fire because
common fire hazards are identified and eliminated. Fire departments and districts are our key partners for this measure and conduct the vast majority of
Page 48 of 601/10/2013
POLICE, OREGON STATE DEPARTMENT of II. KEY MEASURE ANALYSIS
inspections statewide. Oregon OSFM fire safety inspections generally target places with vulnerable populations. These include places with significant
populations of the very old, the very young, and those not capable of saving themselves. Examples include hospitals, nursing homes, schools, daycare centers,
and prisons. Private dwellings are outside the inspection authority of the fire service. Fire and life safety risks may include (but are not limited to) blocked exits,
combustibles too close to ignition sources, and clearly marked signage for exits and fire suppression equipment. Prevention measures are intended to identify
violations of the State’s Fire Code and work with the owner/occupant to obtain compliance. Hazards and risks vary in differing occupancies, as well as by the
actions or practices of the occupants. The number of hazards abated through fire safety inspection results in a reduced risk of fire in those occupancies
inspected. Fewer fires results in increased safety for the occupants and visitors to these facilities throughout Oregon.
2. ABOUT THE TARGETS
OSFM launched the Fire and Life Safety Competency Recognition Program in 2004 and established the goal for a competency standard for code enforcement
and application consistency beginning in 2008. This triggered a significant increase in target data beginning in 2005 as expected. With the new program, the
number of inspectors trained by the OSFM was expected to increase; for this reason, the 2005 target was raised to account for the expected jump in
inspections by local inspectors completing the Recognition Program. After 2005, 3% more than the prior years target is a realistic target based on the number
of certification classes held annually. The actual number of fire and life safety inspections conducted and reported is determined by the number of local fire
departments providing the information and the priorities established within each department.
3. HOW WE ARE DOING
While the fire service exceeded the target by over 11% during 2009, the numbers for 2010 and 2011 tell an entirely different story. The figures submitted by
the fire service for 2010 and 2011 show a dramatic decrease in inspection activity by local fire authorities. Contributing factors include that fewer departments
reported inspection data to OSFM; there were 25 in 2011 vs. 90 in 2010 compared to 112 in 2009. Why fewer departments reported during this timeframe is
unknown at this time. Though reporting of fires is mandated, there are no similar requirements for reporting fire and life safety inspections. The Office of State
Fire Marshal is looking into why the number of inspections changed from 65,976 in 2009 to less than 14,000 in 2011. The basic premise of the measure has
not changed. As more fire service personnel are trained to consistently perform inspections in their communities, the numbers of hazards identified and
corrected are expected to increase and the risks of death, injury, and property loss from fire are reduced.
4. HOW WE COMPARE
As local fire jurisdictions reduce prevention staff or eliminate inspection programs, there is an expectation that OSFM will pick up that work load. OSFM
doesn’t have the resources to make up the difference. This, coupled with other local factors, has caused the number of inspections reported to go down. State
Page 49 of 601/10/2013

POLICE, OREGON STATE DEPARTMENT of II. KEY MEASURE ANALYSIS
Fire Marshal staff assists all but nine of the 324 fire agencies with prevention activities or fire code inspections. The state has proportionately fewer inspection
staff per capita than local prevention programs; based on 2010 Census data, there was one state staff employee for every 165,355 people in the areas the
state covers, while local fire agencies range from one to 10,328 in Portland to one to 31,131 in the Tualatin Valley Fire and Rescue service area. State Fire
Marshal deputies have targeted inspections only at the most critical facilities (schools, day care centers, special residential, corrections, flammable liquid storage
tanks, and community facilities) and are not always able to inspect those occupancies in a timely manner due to time and distance constraints. Further analysis
will be required to determine if the significant decrease in inspections conducted and reported was a factor in the annual fire fatality statistic (See KPM# 11).In
2011 the fire service reported 13,508 inspections conducted which is a decrease of 34% from 2010 which can be attributed to the current economic climate.
In 2009 the fire service conducted 65, 976 inspections, an increase of close to 25% from 2008. In 2008, the fire service reported 52,865 inspections to the
OSFM with 45,405 hazards identified and 77,660 hazards abated. The large number of hazards abated may be attributed to corrections that may have taken
years to correct and were carried over from previous years and were completed in 2009. This means the regulated community is catching up on previously
identified hazards and fixing them, and the fire service is documenting them. This is a significant improvement compared to the 2007 figures when the fire
service reported 47,564 inspections with 22,488 hazards identified and 19,886 hazards abated.
5. FACTORS AFFECTING RESULTS
In order to achieve the desired outcomes, local fire departments should continue sending their personnel to available certification classes in order to increase
the number of trained fire and life safety inspections across the state. The number of fire and life safety inspections conducted is determined by the priorities of
the local fire departments, except for those inspections conducted by OSFM personnel. If departments stop reporting or conduct fewer fire and life safety
inspections, the numbers will continue to go down.Limited fire service staffing at the community level; departments closing their prevention sections due to
budget reductions; increased competency expectations for those conducting inspections and giving plan review input to building officials limit the number of
inspections and the number of hazards abated. This means facilities potentially benefitting from inspections may not receive this service and this reduced level of
service is reflected in the statistics of this KPM.
6. WHAT NEEDS TO BE DONE
OSFM will continue to encourage the fire service to report inspection data via the Oregon Fire Bridge, OSFM’s online data reporting tool. This technology
allows real time reporting, reduces the burden of reporting all at once on an annual basis. OSFM provides free local fire official training at the regional or local
level to increase local fire code enforcement capacity. OSFM will continue to work with fire departments to improve the quality of the inspection data they
submit. To address the training needs of the fire service, staff created new curricula training for fire service personnel conducting fire code enforcement
activities. These curricula are critical to meeting the OAR 837-039 compliance deadlines.
Page 50 of 601/10/2013
POLICE, OREGON STATE DEPARTMENT of II. KEY MEASURE ANALYSIS
7. ABOUT THE DATA
Oregon fire departments are required to report all fire incidents to the Office of State Fire Marshal. Reporting fire inspections, however, is not mandated. Staff
turnover and inspection activities vary within departments and from year to year and not all fire departments report updated inspection data. OSFM is working
with the Oregon fire service to document prevention activities in order to accurately evaluate successful programs and identify needed strategies. The numbers
come from the information reported on the annual resource survey of fire departments.OSFM doesn’t track students after training or whether the trained
personnel are actually performing inspections in the field. Once trained, local fire inspectors maintain their required certifications with Oregon’s Department of
Public Standard Safety and Training (DPSST) and the International Code Council (ICC).
Page 51 of 601/10/2013

POLICE, OREGON STATE DEPARTMENT of II. KEY MEASURE ANALYSIS
Hazardous Substance Reporting - Percent of required reporting facilities that submit the Hazardous Substance Information Survey on
time.
KPM #14 2002
Fire Safety Reduce loss of life and property as a result of fire and hazardous materialsGoal
Oregon Context Oregon Benchmark # 67 - Emergency Preparedness:a. percent of Oregon communities with geologic hazard data and prevention activities in
place b. percent of Oregon counties with emergency operations plans meeting minimum criteria.
Oregon State Fire Marshals Annual Hazardous Substance Information SurveyData Source
Department of State Police - Office of State Fire Marshal / Mariana Ruiz-Temple, 503-934-8238 Owner
0
20
40
60
80
100
2002 2003 2004 2005 2006 2007 2008 2009 2010 2011 2012 2013
92 90 91 91 90 90 88 90 93 90
Bar is actual, line is target
Percent of required reporting facilities that submit the
Hazardous Substance Information Survey on time
Data is represented by percent
1. OUR STRATEGY
KPM #14 targets timely submittal of Oregon’s Hazardous Substance Information Surveys from industrial and commercial facilities.In 1985, the Oregon
Page 52 of 601/10/2013
POLICE, OREGON STATE DEPARTMENT of II. KEY MEASURE ANALYSIS
Legislature passed the Oregon Community Right to Know and Protection Act (CR2K). The purpose of this law is to provide first responders and the public
with information about hazardous substances stored and used in their response areas and neighborhoods. ORS 453.317 to 453.347 directs the OSFM to
survey business and government facilities for information about the presence of hazardous substances and to collect information about incidents involving
hazardous substances. It also provides for planning and training assistance to local jurisdictions concerning hazardous substance emergency response
preparedness.In 1986 the federal Emergency Planning and Community Right to Know Act (EPCRA) passed. Section 311/312 of EPCRA requires facilities to
report information about the kinds and amounts of hazard substances present on site to the State Emergency Response Commission (SERC), the Local
Emergency Planning Committee (LEPC) and local fire department. OSFM is designated at the SERC for Oregon. The Oregon CR2K program meets the
federal 311/312 EPCRA requirements.The Hazardous Substance Information Survey collects, validates and facilitates distribution of required information to
emergency responders and planners for pre-emergency planning and response. The information collected is also available to the general public. Upon a
citizen’s request, the CR2K Unit of OSFM discloses information about the chemical hazards or risks that exist in a community or area.The U.S. Chemical
Safety Board (CSB), an independent federal agency that investigates chemical accidents, has determined that meeting the community right know requirements
and having prepared first responders are basic requirements to avoid catastrophic hazardous substance incidents.To meet the target of this KPM and provide
accurate information when requested, OSFM’s focus is on increasing on-time submittal of the annual survey. To assist in compliance, the program developed
an electronic survey option, though the paper survey is still available for facilities that prefer a less technical option. Facility operators are key partners for this
key performance measure. Developing and maintaining Local Emergency Planning Committees in each of the State’s 13 emergency response districts is critical
to maintaining community involvement. Fire departments/districts, members of the 13 Regional Hazardous Materials Emergency Response Teams and the
public are the primary users of the information collected through the CR2K survey process.
2. ABOUT THE TARGETS
The target was lowered to 93% in 2009 creating a more realistic measurement within the scope of controllable factors. Increasing the number of facilities
submitting the survey on time provides emergency responders and planners with current and accurate hazardous substance information .
3. HOW WE ARE DOING
The 2011 on-time submission rate of 90% did not meet our 93% target. To account for facilities responding late or not at all, OSFM’s audit function works
with facilities to assist them in completing the survey. A slow recovery in the economy may impact the ability of facilities to respond in a timely manner.
Beginning in 2009, the program no longer sent surveys to facilities not meeting the threshold of reportable quantities of hazardous substances. This saves money
on printing, postage, data entry time, and overall handling of paperwork by compliance staff, allowing them to focus more attention on the facilities actually
reporting substances. This benefited facilities by relieving those without reportable quantities from having to complete the paperwork. This reduced the number
of facilities actively surveyed from about 55,000 to about 23,000. Companies that no longer receive the survey are required to notify OSFM if they possess a
Page 53 of 601/10/2013

POLICE, OREGON STATE DEPARTMENT of II. KEY MEASURE ANALYSIS
reportable quantity of a hazardous substance in order to comply with federal regulations under EPCRA. The CR2K program continues to identify new facilities
that have potential to use, produce, store, or dispose of hazardous substances and proactively sends them a survey to initiate reporting. The SERC [OSFM]
also must rely on the LEPCs and fire departments in Oregon to assist with identification of facilities in their area that are not reporting but should be. A
reduction in force in this program for FY2011-13 increases the reliance on local officials to identify those facilities in their area with reportable quantities of
hazardous substances.
4. HOW WE COMPARE
Our 2011 on-time submission rate of 90% is lower than the Department of Environmental Quality’s (DEQ) 2010 hazardous waste generators on-time
submission rate of 91.4% and less than EPA’s 2010 Toxic Release Inventory on-time submission rate of 98%. For the sake of comparing data, the
Department of Environmental Quality calculates how many hazardous waste generators filed their annual report by March 1 of 2011 and by April 1 of 2011 for
both Large Quantity Generators (LQG) (of hazardous waste) and Small Quantity Generators. It then averaged the four findings to determine it had an average
of 91.4 % compliance. Methodology differences must be taken into account when conducting comparative analysis of reporting successes .
5. FACTORS AFFECTING RESULTS
Many facilities, hampered by the slow economy, have lain off staff that previously fulfilled compliance functions. Non-responders are often no longer in
business but this remains unknown until an on-site audit inspection discovers this fact and the facility is taken off the list of those not reporting. In 2011,
compliance staff focused on handling appeals related to notices of noncompliance and penalty assessments . This reduced the number of field audits and
workshops accomplished, which have a direct correlation to timely survey response. Effective auditing of facilities and enforcement of reporting requirements
tends to improve the overall voluntary reporting surveys received on time in the future.
6. WHAT NEEDS TO BE DONE
To improve timely submittal of Oregon’s Hazardous Substance Information Survey, an automated notice of non-compliance program was implemented in
2010 for facilities that fail to submit surveys on time. We believe this effort will provide the most cost-effective impact on our ability to receive surveys in a
timely manner. We anticipate continuing this action on a consistent basis in future years and feel we will realize greater compliance in the future. Onsite
compliance audits and workshops on how to fill out the surveys, increase awareness of the importance timely survey submittal. The more OSFM raises
reporting requirement awareness, the better facilities will respond in a timely manner. The number of compliance audits completed is limited by the number of
staff auditors, the complexity of the audited facilities, and the relative location of the facilities to be audited.Efforts to develop additional Local Emergency
Planning Committees (LEPCs) are continuing. Federal mandates indicate that an LEPC should exist in each of the State’s 13 Emergency Response Districts as
Page 54 of 601/10/2013
POLICE, OREGON STATE DEPARTMENT of II. KEY MEASURE ANALYSIS
a minimum and in each county of the State as a “best practice”. Ten LEPCs currently exist and three more are in development. OSFM personnel will continue
to work with local elected officials, reporting facilities, fire departments, RHMERT members, and emergency management personnel in each of the districts to
work toward this goal. Although the SERC (OSFM) can encourage, facilitate and assist in the development and establishment of Local Emergency Planning
Committees, it is ultimately the responsibility of local officials (city and county), business leaders and community members to volunteer, participate and maintain
the functions of a Local Emergency Planning Committee. OSFM stands ready to assist and will continue its efforts in the establishment of additional LEPCs
across Oregon.
7. ABOUT THE DATA
Facilities possessing threshold quantities of specific hazardous substances must report those quantities to the Office of State Fire Marshal (OSFM), as the
State Emergency Response Commission (SERC). These reports must also be made available to their LEPC and their local fire department. The reporting
cycle is annual and facilities report at different times, based on the county they are located in. They must complete and submit the survey within 60 days of the
due date within the county the facility is located in. This staggered schedule allows surveys to be received at OSFM in a steady rate throughout the year, rather
than one large influx of surveys. Fees are issued to all facilities on November 15th of each year and are based on the most recent survey received.Without
voluntary compliance by a facility or the local identification of a new facility within a community that meets or exceeds the reporting requirements for one or
more of the hazardous substances on the list of substances that must be reported, the OSFM/SERC is challenged to learn about new businesses or facilities
that should be completing the State’s annual Hazardous Substance Information Survey.
Page 55 of 601/10/2013
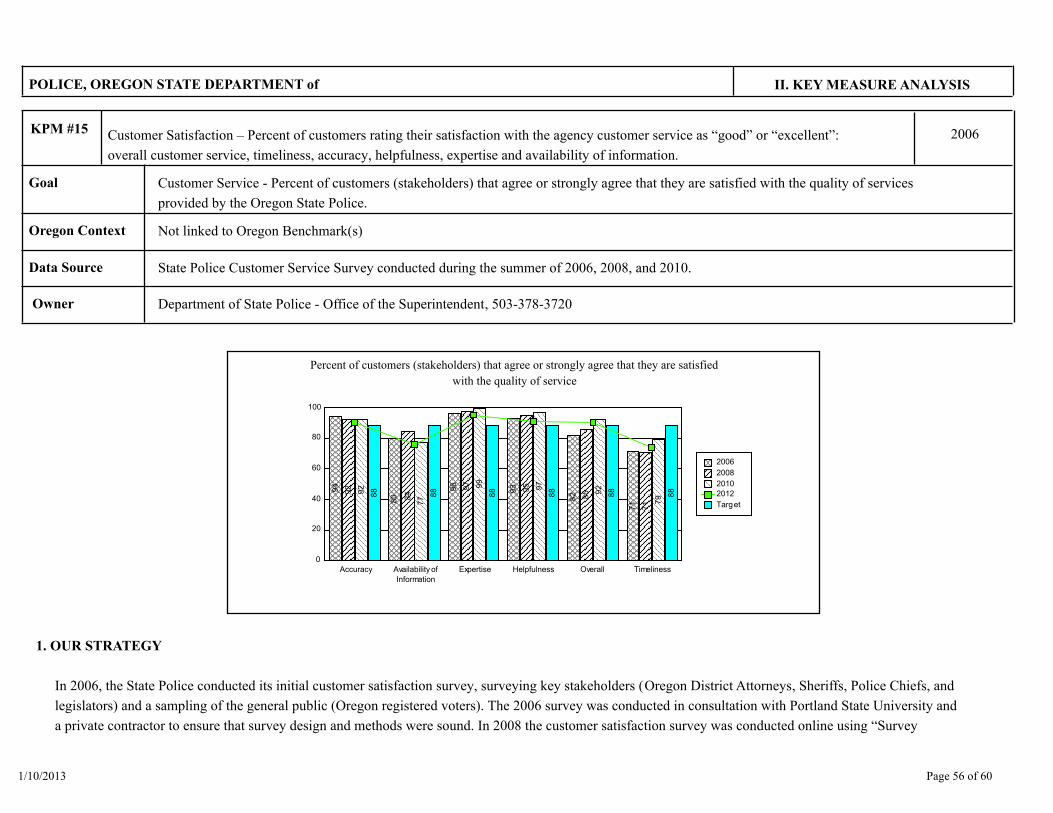
POLICE, OREGON STATE DEPARTMENT of II. KEY MEASURE ANALYSIS
Customer Satisfaction – Percent of customers rating their satisfaction with the agency customer service as “good” or “excellent”:
overall customer service, timeliness, accuracy, helpfulness, expertise and availability of information.
KPM #15 2006
Customer Service - Percent of customers (stakeholders) that agree or strongly agree that they are satisfied with the quality of services
provided by the Oregon State Police.
Goal
Oregon Context Not linked to Oregon Benchmark(s)
State Police Customer Service Survey conducted during the summer of 2006, 2008, and 2010.Data Source
Department of State Police - Office of the Superintendent, 503-378-3720 Owner
0
20
40
60
80
100
Accuracy Availability ofInformation
Expertise Helpfulness Overall Timeliness
94
80
96
93
82
71
92
84
97
95
85
71
92
77
99
97
92
798
8
88
88
88
88
88
2006
2008
20102012
Target
Percent of customers (stakeholders) that agree or strongly agree that they are satisfied
with the quality of service
1. OUR STRATEGY
In 2006, the State Police conducted its initial customer satisfaction survey, surveying key stakeholders (Oregon District Attorneys, Sheriffs, Police Chiefs, and
legislators) and a sampling of the general public (Oregon registered voters). The 2006 survey was conducted in consultation with Portland State University and
a private contractor to ensure that survey design and methods were sound. In 2008 the customer satisfaction survey was conducted online using “Survey
Page 56 of 601/10/2013

POLICE, OREGON STATE DEPARTMENT of II. KEY MEASURE ANALYSIS
Monkey” instead of mailed surveys. The agency’s key stakeholders were once again surveyed, but the general public was not. The decision to not include the
general public in subsequent surveys weighed several factors from results of the 2006 survey. The general public response rate was very low, only 12% (536
surveys returned out of 4,500 sent in the mail). Of those that responded many indicated they had “no basis” for answering several of the survey questions.
While this may infer that the general public has a limited understanding of the many divisions, programs, and functions of the State Police; it does make sense
that the average law abiding citizen would not interact on a regular basis with our agency. In contrast, our key stakeholders interact with our agency daily and
have many opportunities to rate our customer service. The 2010 and 2012 customer satisfaction surveys were conducted online using “Survey Monkey” and
surveyed the same key stakeholders.
2. ABOUT THE TARGETS
The agency used the 2006 survey results for customer satisfaction to establish a preliminary baseline target of 88% (percent of customers that agree or strongly
agree that they are satisfied with the quality of service).
3. HOW WE ARE DOING
The 2012 survey results show a decline in all six of the criteria used to gauge customer satisfaction, although four of the six criteria still exceed the target goal of
88%. Our key stakeholders are satisfied with our overall performance and greatly value our expertise, helpfulness, and accuracy. The two criteria that fell short
of the target and need improvement are “availability of information” and “timeliness”. The success or failure of both of these criteria can be directly related to
adequate infrastructure; such as updated technology for timely tracking and compiling of law enforcement, fiscal, and budget information; technical staff to
support the timely tracking and compiling of the information; fiscal and budget staff to analyze and report on the information.
4. HOW WE COMPARE
Currently, there is no known comparison information from neighboring jurisdictions and no industry standard available on a state police level.
5. FACTORS AFFECTING RESULTS
The main reason for the overall positive customer satisfaction shown in the results of the 2012 survey was the leadership’s decision, in light of current budget
reductions, to prioritize what services we can deliver with the funds available and provide those services to the best of our ability. Our agency will strive to have
exceptionally trained and equipped staff to protect and serve the people of Oregon. It is a credit to our dedicated staff that does more with less and provides
exceptional service in a professional and helpful manner. Many of the comments received from the 2012 survey said the agency did a great job with what we
Page 57 of 601/10/2013

POLICE, OREGON STATE DEPARTMENT of II. KEY MEASURE ANALYSIS
have to work with, but we need more resources.
6. WHAT NEEDS TO BE DONE
Survey results and comments are shared with divisions so they can identify what they are doing well and what areas need improvement. The two areas
identified in the 2012 survey that need improvement are “availability of information” and “timeliness”. The agency continues to emphasize the importance of
adequate infrastructure to support troopers, detectives, and forensic scientists. The agency has been taking steps to improve several areas such as facility
management, budget execution and development, asset tracking, fleet management, and information management. Adding resources to these areas will allow
management to proactively use timely information to set priorities and develop business strategies to better serve our key stakeholders and citizens of Oregon.
7. ABOUT THE DATA
The 2012 survey targeted key stakeholders that utilize State Police services. The key stakeholders consisted of Oregon District Attorneys, Sheriffs, and Police
Chiefs. A total of 553 invitations to complete the Survey Monkey customer satisfaction questionnaire were sent by email; 144 stakeholders responded which
resulted in a response rate of 21%. In addition to the required customer satisfaction questions included on the chart, the 2006, 2008, 2010, and 2012 surveys
also included sections to rate satisfaction by division, function, and allowed for additional comments. Copies of survey results may be obtained through a
request to the Oregon State Police, Superintendent’s Office.
Page 58 of 601/10/2013

III. USING PERFORMANCE DATA
Agency Mission: The mission of the Department of Oregon State Police to enhance livability and safety by protecting the people, property and natural resources
of the state.
POLICE, OREGON STATE DEPARTMENT of
503-934-0209Alternate Phone:Alternate: Larry West
Kailean KneelandContact: 503-934-0011Contact Phone:
The following questions indicate how performance measures and data are used for management and accountability purposes.
* Staff : Performance measures were developed with the assistance of the Division Directors within the agency.
Division Directors worked with staff to develop the measures. The agency’s performance measures are based on the
core mission of each division and the agency’s mission statement.
1. INCLUSIVITY
* Elected Officials: The Oregon Legislature has reviewed the agency’s performance measures and has made
recommendations that the agency has adopted. The Agency has also amended, added and/or deleted performance
measures as directed by Legislature. The Oregon State Police has worked with local elected officials in the production
and implementation of local cooperative policing agreements which directly affect the State Police's ability to assist
local communities and to meet the objectives identified in the agencies performance measures.
* Stakeholders: The Oregon State Police stakeholders were surveyed in 2006, 2008, 2010, and 2012 on Oregon
State Police performance. Stakeholders were defined as every District Attorney, Sheriff, Police Chief and legislator.
The survey included the below listed topics: A: Timeliness B: Accuracy C: Helpfulness D: Expertise E: Availability of
Information See results in KPM #15
* Citizens: The Oregon State Police Annual Performance Progress Report is posted on the agency’s website for
citizen review and comment/suggestions. Oregon citizens were included in the 2006 customer satisfaction survey
which included the below listed topics: A: Timeliness B: Accuracy C: Helpfulness D: Expertise E: Availability of
Information. See results in KPM #15
2 MANAGING FOR RESULTS Each performance measure was developed to assist divisions in meeting their primary mission. The activities that are
being measured within each performance measure are not new activities to the agency. The performance measures
now give each division manager a tool to measure the successes or shortfalls of their activities in meeting the desired
outcome listed in each measure. The agency monitors the progress of its divisions in meeting the agency goals set in
each performance measure.
Page 59 of 601/10/2013

3 STAFF TRAINING Division staff received training on the development of the performance measures, the performance measurement and
maintaining the data needed to monitor the progress of the performance measures shortly after agencies received the
2003-05 Budget and Legislative Concept Instructions. A review of the performance measure process, the new
components of the process and annual report were discussed with each Division Director that is measuring
performance measures to ensure a clear understanding of the performance measure process and its components.
4 COMMUNICATING RESULTS * Staff : Division Command Staff are given a copy of each annual report and may provide input for future changes,
additions and deletions.
* Elected Officials: Communication on agency performance results was and will be done through the legislative
process during Ways and Means budget testimony.
* Stakeholders: All State Police stakeholders can view the agency’s Annual Performance Progress Report online or
they can request a copy of the report and one will be provided for their review.
* Citizens: Public communication will take place when the measures and the Annual Performance Progress Report is
posted on the web site as instructed in section 1 of a memorandum by Director Gary Weeks, dated October 6, 2003.
The agency will post the Annual Performance Progress Reports on the agency's web page for public review. Agency
URL is: http://www.oregon.gov/OSP/index.shtml
Page 60 of 601/10/2013