Point centromeres contain more than a single centromere...
14
The Rockefeller University Press $30.00 J. Cell Biol. Vol. 195 No. 4 573–582 www.jcb.org/cgi/doi/10.1083/jcb.201106036 JCB 573 JCB: Report Correspondence to Ted Salmon: [email protected] Abbreviations used in this paper: BG, background; kMT, kinetochore microtubule. Introduction Protein copy number is critical in understanding the architecture and function of the proteins that link centromeric DNA to the plus ends of kinetochore microtubules (kMTs) to achieve the four essential functions of kinetochores: robust attachment to kMT plus ends, force generation, attachment error correction, and control of the spindle assembly checkpoint (Santaguida and Musacchio, 2009; Joglekar et al., 2010; Maresca and Salmon, 2010; Gregan et al., 2011). We have previously measured ki- netochore protein copy numbers in budding yeast, fission yeast, and chicken DT40 tissue culture cells using a fluorescence ratio method and GFP fusion proteins expressed from their endog- enous promoters (Joglekar et al., 2006, 2008; Johnston et al., 2010). The reference standard for our ratio method was the fluores- cence of Cse4-GFP from a cluster of 16 metaphase or anaphase kinetochores in budding yeast that each attach to a single MT plus end (Winey et al., 1995). Cse4-GFP was initially chosen as our standard because the fluorescence from a cluster of 16 kinetochores forms a near-diffraction limited spot at best focus and because molecular and biochemical evidence indicated that there was a single nucleosome containing Cse4 at the CEN DNA (Bloom and Carbon, 1982; Meluh et al., 1998; Furuyama and Biggins, 2007). However, there have been reports using other biochemical methods for more than a single Cse4 nucleosome or CBF3 complex proximal to the budding yeast centromere (Espelin et al., 2003; Riedel et al., 2006). In this paper we use three different fluorescent standards, including individual EGFP molecules in vitro, to measure the mean number Cse4-GFPs, as well as representative proteins for inner and outer kinetochore protein complexes within the budding yeast kinetochore. Surprisingly, we measured a mean of approximately five Cse4-GFPs rather than two as expected. We used computer simulations to show how previ- ous biochemical assays (Furuyama and Biggins, 2007) would be unable to detect an additional approximately three Cse4 proteins on average per kinetochore if they are located at random nucleosome sites flanking the CEN that differ in position be- tween different chromosomes. Results and discussion Comparison of fluorescence intensity in recorded images Our primary standards were the fluorescence from individual EGFP molecules and the rotavirus-like particle, GFP-VLP2/6, which contains 120 EGFPs as determined by electron tomography C se4 is the budding yeast homologue of CENP-A, a modified histone H3 that specifies the base of kinetochores in all eukaryotes. Budding yeast is unique in having only one kinetochore microtubule attachment site per centromere. The centromere is speci- fied by CEN DNA, a sequence-specific binding complex (CBF3), and a Cse4-containing nucleosome. Here we compare the ratio of kinetochore proximal Cse4-GFP fluorescence at anaphase to several standards including purified EGFP molecules in vitro to generate a calibra- tion curve for the copy number of GFP-fusion proteins. Our results yield a mean of 5 Cse4s, 3 inner kineto- chore CBF3 complexes, and 20 outer kinetochore Ndc80 complexes. Our calibrated measurements in- crease 2.5–3-fold protein copy numbers at eukaryotic kinetochores based on previous ratio measurements assuming two Cse4s per budding yeast kinetochore. All approximately five Cse4s may be associated with the CEN nucleosome, but we show that a mean of three Cse4s could be located within flanking nucleosomes at random sites that differ between chromosomes. Point centromeres contain more than a single centromere-specific Cse4 (CENP-A) nucleosome Josh Lawrimore, Kerry S. Bloom, and E.D. Salmon Department of Biology, University of North Carolina, Chapel Hill, NC 27599 © 2011 Lawrimore et al. This article is distributed under the terms of an Attribution– Noncommercial–Share Alike–No Mirror Sites license for the first six months after the pub- lication date (see http://www.rupress.org/terms). After six months it is available under a Creative Commons License (Attribution–Noncommercial–Share Alike 3.0 Unported license, as described at http://creativecommons.org/licenses/by-nc-sa/3.0/). THE JOURNAL OF CELL BIOLOGY on January 6, 2016 jcb.rupress.org Downloaded from Published November 14, 2011 http://jcb.rupress.org/content/suppl/2011/11/10/jcb.201106036.DC1.html Supplemental Material can be found at: on January 6, 2016 jcb.rupress.org Downloaded from Published November 14, 2011 on January 6, 2016 jcb.rupress.org Downloaded from Published November 14, 2011 on January 6, 2016 jcb.rupress.org Downloaded from Published November 14, 2011 on January 6, 2016 jcb.rupress.org Downloaded from Published November 14, 2011 on January 6, 2016 jcb.rupress.org Downloaded from Published November 14, 2011
Transcript of Point centromeres contain more than a single centromere...

The Rockefeller University Press $30.00J. Cell Biol. Vol. 195 No. 4 573–582www.jcb.org/cgi/doi/10.1083/jcb.201106036 JCB 573
JCB: Report
Correspondence to Ted Salmon: [email protected] used in this paper: BG, background; kMT, kinetochore microtubule.
IntroductionProtein copy number is critical in understanding the architecture and function of the proteins that link centromeric DNA to the plus ends of kinetochore microtubules (kMTs) to achieve the four essential functions of kinetochores: robust attachment to kMT plus ends, force generation, attachment error correction, and control of the spindle assembly checkpoint (Santaguida and Musacchio, 2009; Joglekar et al., 2010; Maresca and Salmon, 2010; Gregan et al., 2011). We have previously measured ki-netochore protein copy numbers in budding yeast, fission yeast, and chicken DT40 tissue culture cells using a fluorescence ratio method and GFP fusion proteins expressed from their endog-enous promoters (Joglekar et al., 2006, 2008; Johnston et al., 2010). The reference standard for our ratio method was the fluores-cence of Cse4-GFP from a cluster of 16 metaphase or anaphase kinetochores in budding yeast that each attach to a single MT plus end (Winey et al., 1995). Cse4-GFP was initially chosen as our standard because the fluorescence from a cluster of 16 kinetochores forms a near-diffraction limited spot at best focus and because molecular and biochemical evidence indicated that there was a single nucleosome containing Cse4 at the CEN DNA (Bloom and Carbon, 1982; Meluh et al., 1998; Furuyama and Biggins, 2007). However, there have been reports using other biochemical methods for more than a single Cse4 nucleosome
or CBF3 complex proximal to the budding yeast centromere (Espelin et al., 2003; Riedel et al., 2006).
In this paper we use three different fluorescent standards, including individual EGFP molecules in vitro, to measure the mean number Cse4-GFPs, as well as representative proteins for inner and outer kinetochore protein complexes within the budding yeast kinetochore. Surprisingly, we measured a mean of approximately five Cse4-GFPs rather than two as expected. We used computer simulations to show how previ-ous biochemical assays (Furuyama and Biggins, 2007) would be unable to detect an additional approximately three Cse4 proteins on average per kinetochore if they are located at random nucleosome sites flanking the CEN that differ in position be-tween different chromosomes.
Results and discussionComparison of fluorescence intensity in recorded imagesOur primary standards were the fluorescence from individual EGFP molecules and the rotavirus-like particle, GFP-VLP2/6, which contains 120 EGFPs as determined by electron tomography
Cse4 is the budding yeast homologue of CENP-A, a modified histone H3 that specifies the base of kinetochores in all eukaryotes. Budding yeast
is unique in having only one kinetochore microtubule attachment site per centromere. The centromere is speci-fied by CEN DNA, a sequence-specific binding complex (CBF3), and a Cse4-containing nucleosome. Here we compare the ratio of kinetochore proximal Cse4-GFP fluorescence at anaphase to several standards including purified EGFP molecules in vitro to generate a calibra-tion curve for the copy number of GFP-fusion proteins.
Our results yield a mean of 5 Cse4s, 3 inner kineto-chore CBF3 complexes, and 20 outer kinetochore Ndc80 complexes. Our calibrated measurements in-crease 2.5–3-fold protein copy numbers at eukaryotic kinetochores based on previous ratio measurements assuming two Cse4s per budding yeast kinetochore. All approximately five Cse4s may be associated with the CEN nucleosome, but we show that a mean of three Cse4s could be located within flanking nucleosomes at random sites that differ between chromosomes.
Point centromeres contain more than a single centromere-specific Cse4 (CENP-A) nucleosome
Josh Lawrimore, Kerry S. Bloom, and E.D. Salmon
Department of Biology, University of North Carolina, Chapel Hill, NC 27599
© 2011 Lawrimore et al. This article is distributed under the terms of an Attribution–Noncommercial–Share Alike–No Mirror Sites license for the first six months after the pub-lication date (see http://www.rupress.org/terms). After six months it is available under a Creative Commons License (Attribution–Noncommercial–Share Alike 3.0 Unported license, as described at http://creativecommons.org/licenses/by-nc-sa/3.0/).
TH
EJ
OU
RN
AL
OF
CE
LL
BIO
LO
GY
on January 6, 2016jcb.rupress.org
Dow
nloaded from
Published November 14, 2011
http://jcb.rupress.org/content/suppl/2011/11/10/jcb.201106036.DC1.html Supplemental Material can be found at:
on January 6, 2016jcb.rupress.org
Dow
nloaded from
Published November 14, 2011 on January 6, 2016
jcb.rupress.orgD
ownloaded from
Published November 14, 2011
on January 6, 2016jcb.rupress.org
Dow
nloaded from
Published November 14, 2011 on January 6, 2016
jcb.rupress.orgD
ownloaded from
Published November 14, 2011
on January 6, 2016jcb.rupress.org
Dow
nloaded from
Published November 14, 2011

JCB • VOLUME 195 • NUMBER 4 • 2011 574
Figure 1. Fluorescence intensity of Cse4-GFP within a cluster of kinetochores at anaphase compared with the standards and potential standards, and Ndc80-GFP used in our experiments. (A) Images are sorted by increasing brightness. Bar, 3 µm. (B–M) Mean values ± SD obtained from Gaussian curve fits to histograms of measured values of integrated fluorescent intensity minus BG after correction for false positives from BG noise for the EGFP measurements (Fig. S1) or for the other cellular samples, fluorescence loss from photobleaching, and depth beneath the coverslip (Materials and methods and Fig. S1). Measured values for EGFP were acquired by 1,500-ms exposures, means were determined, and scaled by 600/1,500 to be compatible with the 600-ms exposure times for the other specimens. n is the number of fluorescent kinetochore clusters or spots measured. BG is sample BG obtained from the integrated BG measurement minus camera offset scaled to the 5 × 5 pixel region of the specimen measurement.
on January 6, 2016jcb.rupress.org
Dow
nloaded from
Published November 14, 2011

575Kinetochore protein copy numbers • Lawrimore et al.
and an extinction coefficient predicted for 120 EGFPs per virus capsid (Charpilienne et al., 2001; Dundr et al., 2002). Our sec-ondary standards were GFP-MotB protein within the rotary motor of the bacteria Escherichia coli that is reported to contain 22 ± 6 GFP-MotBs counted by a photobleaching assay (Leake et al., 2006), and a 4-kb LacO array within the flanking chroma-tin of chromosome III in budding yeast that contains 102 poten-tial binding sites for LacI-GFP dimers, or potentially 204 GFPs (Belmont and Straight, 1998). The images in Fig. 1 A indicate that fluorescence from Cse4-GFPs within an anaphase cluster of 16 kinetochores appears to be much brighter compared with the GFP-MotBs within the bacterial rotary motor of E. coli, but less intense than the fluorescence within the protein capsid of GFP-VLP2/6 and within the LacI-GFP spots.
Protein copy numbers based on two primary GFP fluorescent standardsWe quantified integrated fluorescence intensity minus back-ground (BG) for the specimens in Fig. 1 and several inner kinetochore proteins (Ndc10, Mif2, and Cep3; for images see Joglekar et al., 2006). The measurements were corrected for fluorescence loss from photobleaching and depth beneath the coverslip for cellular specimens (Materials and methods; Fig. S1 and Fig. 2). Mean values were obtained from histograms of cor-rected data by obtaining the monomer mean value from Gaussian curve fitting (Fig. 1, B–M; Materials and methods).
For our two primary standards, the mean slope of inte-grated fluorescence per GFP was obtained from their mean values in Fig. 1 (B–D) and their mean number of GFPs per par-ticle or complex. This yielded slopes of 13 ± 3.7 for EGFP and 10.7 ± 1 for GFP-VLP2/6 and a mean of 11.85 ± 1.9 (Fig. 2 A). It is likely that the 13 ± 3.7 counts per individual EGFP mol-ecule in vitro is higher than what occurs in the viral capsids or in vivo because of fluorescence quenching by neighboring proteins or nearby GFPs (e.g., the dimer peak in Fig. 1 B is 22, not 26 as expected for two adjacent EGFPs). A mean of 11.85 ± 1.9 counts/GFP used for our calibrated measurements appears to be a reasonable representation of the in vivo situa-tion. Dividing the measurement for Mot-B-GFP within a single bacterial rotary motor (259 ± 89) by this standard yields 21.9 ± 8.3, very close to the value of 22 ± 6 GFP-MotBs counted by a photobleaching assay (Fig. 2 B, i; Leake et al., 2006). Similarly, the measured value of LacI-GFPs at the 4-kb LacO spot was 177 ± 44 with azide-deoxyglucose treatment, 10% less than the 204 potential sites (Fig. 2 B, i). The LacI-GFP fluorescence was stable at the LacO spots based on little FRAP (Fig. 2 B, ii; Materials and methods). This result indicates that the 4-kb LacO-LacI-GFP spot provides a useful fluorescence reference standard for counting the number of GFPs at other sites.
The mean values of Cse4-GFP per 16 kinetochore clusters from four yeast strains (Fig. 2 C) were 56 ± 11 for Cse4-GFP A, 97 ± 19 for Cse4-GFP B, 79 ± 14 for Cse4-GFP Cir+, and 84 ± 15 for Cse4-GFP Cir0 based on their mean values for integrated fluorescence intensity minus BG divided by the standard value of 11.85 ± 1.92 counts/GFP (Fig. 2 A). The corresponding val-ues per kinetochore were 3.5 ± 0.7, 6.0 ± 1.2, 4.9 ± 0.9, and 5.2 ± 0.9 Cse4-GFPs (Fig. 2 D). Plasmids do not contribute
Figure 2. Protein copy numbers based on two GFP fluorescent stan-dards. (A) Calculation of the mean slope (S) for the number of integrated fluorescence counts minus BG per GFP from the mean values measured for individual EGFP molecules and the 120 EGFPs within rotovirus-like capsid GFP-VLP2/6. (B, i; and C) Mean numbers for GFP-MotB within the bacterial rotor of E. coli, LacI-GFP bound to the 4-kb LacO DNA array inserted into chromosome III in ATP-depleted cells and for GFP fu-sion proteins within clusters of 16 budding yeast kinetochores at ana-phase. Mean numbers were calculated from the corresponding peak values in Fig. 1 (B–M) divided by the slope S. (B, ii) The lack of a FRAP a 4-kb LacO-LacI-GFP spot in an azide-deoxyglucose–treated cell. (D) Pro-tein copy numbers per kMT obtained from the data in C divided by 16. Error bars indicate SD.
on January 6, 2016jcb.rupress.org
Dow
nloaded from
Published November 14, 2011

JCB • VOLUME 195 • NUMBER 4 • 2011 576
significantly to the amount of Cse4-GFP at the yeast centro-mere, as suggested previously (Hajra et al., 2006), because the mean values were nearly the same (4.9, 5.2) for the same strain with and without 2 µm plasmids.
The mean of the four yeast strains was 4.9 or 5 Cse4s per kinetochore, which is 2.5 times larger than predicted by the previous assumption of two Cse4s at the kinetochore. If the mean value of Cse4 per kinetochore was two, then the measured value for our fluorescent standard would need to be 31 to pro-duce an integrated fluorescence of 993, the mean for the Cse4 measurements for a cluster of 16 kinetochores. This value is far above the mean value of 13 ± 3.7 that we measured for EGFP monomer or the mean of 15 ± 6 for the mixtures of EGFP mono-mers and dimers (Fig. 1 B). The Cse4-GFP fusion in the Cse4-GFP B strain has a measurable but inconsequential effect on the fidelity of chromosome segregation (Fig. S1 F), which indicates that our number measurements are representative of a func-tional endogenous Cse4.
At CEN DNA, Cse4 is mainly thought to replace his-tone H3 in a canonical nucleosome (2@Cse4:H4:H2A:H2B; Cho and Harrison, 2011; Dechassa et al., 2011; Kingston et al., 2011), but other complexes are proposed (for review
see Verdaasdonk and Bloom, 2011). Scm3 is a chaperone re-quired for Cse4 incorporation at the CEN in Saccharomyces cerevisiae (Stoler et al., 2007; Camahort et al., 2007; Mizuguchi et al., 2007) and Schizosaccharomyces pombe (Pidoux et al., 2009; Williams et al., 2009). For Cse4-GFP B, we found Smc3 to be <20% of Cse4 in normal anaphase cells and undetect-able above BG in azide-deoxyglucose treated cells (Table I). In contrast, Cse4 was stable in azide-deoxyglucose–treated cells (Table I).
Calibrated values for kinetochore protein copy numbers in budding yeast, fission yeast, and chicken tissue cellsIn previous studies (Joglekar et al., 2006, 2009; Johnston et al., 2010), we measured kinetochore protein numbers with the fluor-escence ratio method based on the assumption of two Cse4-GFP per kinetochore in the Cse4-GFP B yeast strain. Using our new fluorescent standards, we measured inner and outer kinetochore proteins in the Cse4-GFP-B yeast strain (Fig. 1, F and G). The values for the CBF3 complex members, Ndc10 and Cep3, and the CENP-C homologue, Mif2, were 119, 55, and 58 per cluster and 7.4, 3.4, and 3.6 per kinetochore (Fig. 2, C and D). The value for the outer kinetochore protein Ndc80-GFP yielded a mean value of 306 or 19 per kinetochore (Fig. 2, C and D). These measurements are higher than previous measurements by approximately three, the ratio of our calibrated measurement of six Cse4-GFP per kinetochore in Cse4-GFP B strain divided by the previous value of two.
The measured ratios in the current study were nearly iden-tical to the original ratios (Joglekar et al., 2006, 2009), which indicates that the ratio measurements in these and the Johnston et al. (2010) study in DT40 tissue cells were accurate. Tables I–III provides new values for protein copy numbers based on our calibrated measurements of 6 Cse4-GFPs and 19 Ndc80-GFPs per anaphase kinetochore.
Table I. Newly measured values and previously reported ratio mea-surement values of kinetochore protein copy numbers in S. cerevisiae during anaphase based on our measurements for ScCse4-GFP B
Protein name Reported anaphase ratio
Average number per kinetochore
Cse4p-Aa NA 3.5 ± 0.7Cse4p-Ba NA 6.0 ± 1.2Cse4p Cir+ a NA 4.9 ± 0.9Cse4p Cir0 a NA 5.2 ± 0.9Mif2pa,b 0.6 ± 0.1 3.6 ± 0.8Ctf3p 0.5 ± 0.01 3.0 ± 0.6Ndc10pa 1.2 ± 0.2 7.4 ± 1.6Cep3pa 0.6 ± 0.1 3.4 ± 0.8Ctf19pb 3.4 ± 0.2 6.4 ± 1.3Chl4p 0.3 ± 0.01 1.6 ± 0.3Nkp2pb 6.1 ± 0.1 3.6 ± 0.7Mtw1p 2.4 ± 0.1 14.5 ± 2.9Spc105p 2.4 ± 0.01 14.5 ± 2.8Nuf2p 3.6 ± 0.2 21.7 ± 4.4Ndc80pa 3.2 ± 0.5 19.1 ± 3.9Ask1p 5.3 ± 0.3 32.0 ± 6.5Scm3pa 0.23 ± 0.05 1.3 ± 0.3Scm3pa,c NA BG
For the kinetochore proteins not measured in this study, we assumed the same ratio of fluorescence relative to Cse4-GFP fluorescence in the yeast Cse4-GFP B used as the standard in previous studies (Joglekar et al., 2006, 2008; Johnston et al., 2010). Average protein copy numbers per kinetochore for S. cerevisiae were obtained by multiplying the average number of ScCse4-GFP B per kine-tochore, 6.0 ± 1.2, by the fluorescence ratio of ScCse4-GFP B to each GFP-fusion protein (Joglekar et al., 2006). Ratios and average number per kinetochore values indicated by the footnotes were calculated using our own measurements. Ratios reported in Joglekar et al. (2006) as ratios to ScNuf2 signal were con-verted to ScCse4 B ratios before the multiplication of the average number of ScCse4-GFP B per kinetochore, 6.0 ± 1.2.aOur measured value.bReported ratio is calculated as (Nuf2 signal):(protein signal) as it is presented in Joglekar et al. (2006).cAzide deoxyglucose treatment used.
Table II. Ratio measurement values of kinetochore protein copy numbers in S. pombe during G2/M based on our measurements for ScCse4-GFP B
Protein name Average number per kinetochore
Average number per kMT
cnp1 15.1 ± 3.4 5.0 ± 1.1mif2 11.1 ± 3.1 3.7 ± 1.0mal2 32.3 ± 6.3 10.8 ± 2.1sim4 36.2 ± 8.5 12.1 ± 2.8fta1 11.1 3.7fta2 29 9.7fta3 36.8 ± 7.2 12.3 ± 2.4mis12 46.7 ± 9.9 15.6 ± 3.3spc7 34.8 ± 7.0 11.6 ± 2.3ndc80 66.1 ± 14.0 22.0 ± 4.7dad1 10 3.3
S. pombe copy numbers per kinetochore were obtained by multiplying the fluor-escence ratio of ScCse4-GFP B to each S. pombe GFP fusion protein (Joglekar et al., 2008) by the number of ScCse4-GFP B molecules in an anaphase cluster, 97 ± 19, and dividing by 6, the number of chromosomes in S. pombe. The average copy number per kinetochore was divided by the mean number of microtubule attachments per kinetochore to obtain the average protein copy numbers per kMT in S. pombe (3; Joglekar et al., 2008).
on January 6, 2016jcb.rupress.org
Dow
nloaded from
Published November 14, 2011
577Kinetochore protein copy numbers • Lawrimore et al.
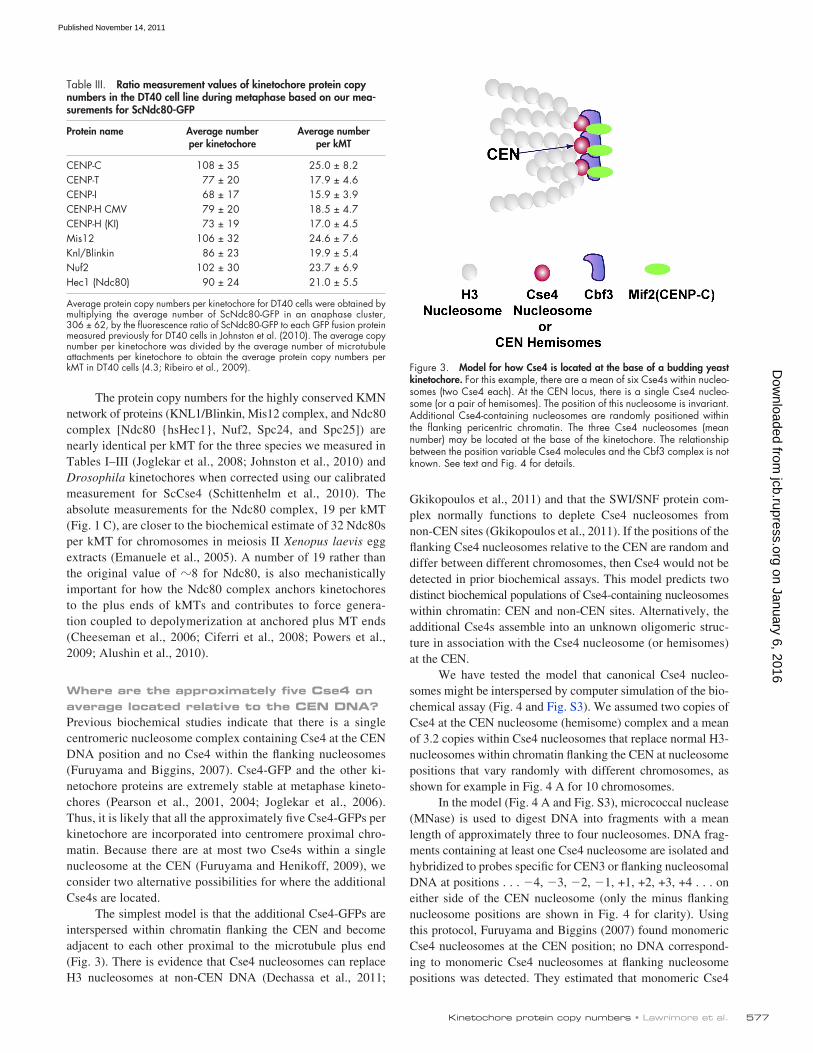
Gkikopoulos et al., 2011) and that the SWI/SNF protein com-plex normally functions to deplete Cse4 nucleosomes from non-CEN sites (Gkikopoulos et al., 2011). If the positions of the flanking Cse4 nucleosomes relative to the CEN are random and differ between different chromosomes, then Cse4 would not be detected in prior biochemical assays. This model predicts two distinct biochemical populations of Cse4-containing nucleosomes within chromatin: CEN and non-CEN sites. Alternatively, the additional Cse4s assemble into an unknown oligomeric struc-ture in association with the Cse4 nucleosome (or hemisomes) at the CEN.
We have tested the model that canonical Cse4 nucleo-somes might be interspersed by computer simulation of the bio-chemical assay (Fig. 4 and Fig. S3). We assumed two copies of Cse4 at the CEN nucleosome (hemisome) complex and a mean of 3.2 copies within Cse4 nucleosomes that replace normal H3-nucleosomes within chromatin flanking the CEN at nucleosome positions that vary randomly with different chromosomes, as shown for example in Fig. 4 A for 10 chromosomes.
In the model (Fig. 4 A and Fig. S3), micrococcal nuclease (MNase) is used to digest DNA into fragments with a mean length of approximately three to four nucleosomes. DNA frag-ments containing at least one Cse4 nucleosome are isolated and hybridized to probes specific for CEN3 or flanking nucleosomal DNA at positions . . . 4, 3, 2, 1, +1, +2, +3, +4 . . . on either side of the CEN nucleosome (only the minus flanking nucleosome positions are shown in Fig. 4 for clarity). Using this protocol, Furuyama and Biggins (2007) found monomeric Cse4 nucleosomes at the CEN position; no DNA correspond-ing to monomeric Cse4 nucleosomes at flanking nucleosome positions was detected. They estimated that monomeric Cse4
The protein copy numbers for the highly conserved KMN network of proteins (KNL1/Blinkin, Mis12 complex, and Ndc80 complex [Ndc80 {hsHec1}, Nuf2, Spc24, and Spc25]) are nearly identical per kMT for the three species we measured in Tables I–III (Joglekar et al., 2008; Johnston et al., 2010) and Drosophila kinetochores when corrected using our calibrated measurement for ScCse4 (Schittenhelm et al., 2010). The absolute measurements for the Ndc80 complex, 19 per kMT (Fig. 1 C), are closer to the biochemical estimate of 32 Ndc80s per kMT for chromosomes in meiosis II Xenopus laevis egg extracts (Emanuele et al., 2005). A number of 19 rather than the original value of 8 for Ndc80, is also mechanistically important for how the Ndc80 complex anchors kinetochores to the plus ends of kMTs and contributes to force genera-tion coupled to depolymerization at anchored plus MT ends (Cheeseman et al., 2006; Ciferri et al., 2008; Powers et al., 2009; Alushin et al., 2010).
Where are the approximately five Cse4 on average located relative to the CEN DNA?Previous biochemical studies indicate that there is a single centromeric nucleosome complex containing Cse4 at the CEN DNA position and no Cse4 within the flanking nucleosomes (Furuyama and Biggins, 2007). Cse4-GFP and the other ki-netochore proteins are extremely stable at metaphase kineto-chores (Pearson et al., 2001, 2004; Joglekar et al., 2006). Thus, it is likely that all the approximately five Cse4-GFPs per kinetochore are incorporated into centromere proximal chro-matin. Because there are at most two Cse4s within a single nucleosome at the CEN (Furuyama and Henikoff, 2009), we consider two alternative possibilities for where the additional Cse4s are located.
The simplest model is that the additional Cse4-GFPs are interspersed within chromatin flanking the CEN and become adjacent to each other proximal to the microtubule plus end (Fig. 3). There is evidence that Cse4 nucleosomes can replace H3 nucleosomes at non-CEN DNA (Dechassa et al., 2011;
Table III. Ratio measurement values of kinetochore protein copy numbers in the DT40 cell line during metaphase based on our mea-surements for ScNdc80-GFP
Protein name Average number per kinetochore
Average number per kMT
CENP-C 108 ± 35 25.0 ± 8.2CENP-T 77 ± 20 17.9 ± 4.6CENP-I 68 ± 17 15.9 ± 3.9CENP-H CMV 79 ± 20 18.5 ± 4.7CENP-H (KI) 73 ± 19 17.0 ± 4.5Mis12 106 ± 32 24.6 ± 7.6Knl/Blinkin 86 ± 23 19.9 ± 5.4Nuf2 102 ± 30 23.7 ± 6.9Hec1 (Ndc80) 90 ± 24 21.0 ± 5.5
Average protein copy numbers per kinetochore for DT40 cells were obtained by multiplying the average number of ScNdc80-GFP in an anaphase cluster, 306 ± 62, by the fluorescence ratio of ScNdc80-GFP to each GFP fusion protein measured previously for DT40 cells in Johnston et al. (2010). The average copy number per kinetochore was divided by the average number of microtubule attachments per kinetochore to obtain the average protein copy numbers per kMT in DT40 cells (4.3; Ribeiro et al., 2009). Figure 3. Model for how Cse4 is located at the base of a budding yeast
kinetochore. For this example, there are a mean of six Cse4s within nucleo-somes (two Cse4 each). At the CEN locus, there is a single Cse4 nucleo-some (or a pair of hemisomes). The position of this nucleosome is invariant. Additional Cse4-containing nucleosomes are randomly positioned within the flanking pericentric chromatin. The three Cse4 nucleosomes (mean number) may be located at the base of the kinetochore. The relationship between the position variable Cse4 molecules and the Cbf3 complex is not known. See text and Fig. 4 for details.
on January 6, 2016jcb.rupress.org
Dow
nloaded from
Published November 14, 2011

JCB • VOLUME 195 • NUMBER 4 • 2011 578
One is an enhanced preference for MNase used to cleave the linker DNA in between the CEN Cse4 nucleosome and adjacent nucleosomes compared to the frequency for cutting linker DNA between flanking H3 nucleosomes (2.5-fold; Bloom and
nucleosomes flanking the CEN were <3% the concentration measured at the CEN (limit of detection).
In addition to the randomness of Cse4 nucleosome posi-tion within flanking DNA, there are two important parameters:
Figure 4. Simulation of the Furuyama and Biggins (2007) experiment with the simplifying assumptions that there are two Cse4 at the CEN nucleosome and a mean of 1.6 Cse4 nucleosomes randomly replacing H3 nucleosomes at positions that flank the CEN at 160-bp DNA intervals (±1, ±2, ±3 . . .). The positions of the flanking Cse4 nucleosomes are random and differ for different chromosomes. (A) Diagram of simulation for flanking positions up to a maxi-mum number (Nf) of ±15, a probability of cutting DNA links by RNase between adjacent flanking nucleosomes of 0.33 per link, and a 2.5-fold enhanced probability (EP) of cutting the links on either side of the CEN. (B) Results of computer simulation of the mean of over 10,000 chromosomes for parameters in A for the percent of Cse4-containing monomers, dimer, trimers and tetramers relative to the Cse4-containing CEN monomer (set at 100%). (C) Percent Cse4 monomer at the ±1 position as a function of Nf for values of EP from 1 to 3. (D) Nf and EP values required for the percent Cse4 monomer at position ±1 to be less than the limit of detection (2.7%) in the biochemical assays of Furuyama and Biggins (2007). See Fig. S3 for simulation details.
on January 6, 2016jcb.rupress.org
Dow
nloaded from
Published November 14, 2011

579Kinetochore protein copy numbers • Lawrimore et al.
A previous ratio fluorescence study (Joglekar et al., 2008) found that constitutive overexpression of the Cse4 homologue in S. pombe resulted in a four- to fivefold increase in the number of Cse4 homologue molecules at the kinetochore, but the copy numbers of structural kinetochore proteins remained compa-rable to wild-type protein numbers.
An interesting aspect of the model is that it makes the structure of the budding yeast kinetochore similar to kineto-chores of other eukaryotes. With multiple Cse4 (CENP-A) nu-cleosomes at the base of the kinetochore, the budding yeast centromere may resemble the “regional centromere” organiza-tion of the base of the kinetochore in other eukaryotes. Our measurement of a mean of approximately five Cse4s per bud-ding yeast kinetochore should both constrain and stimulate new ideas for how the structure of the budding yeast inner kinetochore is organized.
Materials and methodsSpecimens and specimen slide–coverslip preparations:Yeast were grown overnight to mid-log phase at 24°C in YPD media. Most yeast strains were washed with SD-methionine and resuspended in SD-methionine. 4-kb LacO-LacI-GFP and Scm3-GFP yeast strains were washed with double-distilled H2O and resuspended in YC complete media containing 1 µM deoxyglucose and 0.02% azide, then incubated at 24°C for 10 min just before making the slide–coverslip preparation. A 6-µl sample of these yeast preparations was placed on a Concanavalin A–treated acid-washed coverslip and sealed with VALAP (1:1:1 vaseline/lanolin/paraffin). Purified GFP-VLP2/6 virus-like particles (provided by A. Charpilienne and D. Poncet, Virologie Moléculaire et Structurale, Unité Propre de Recherche du Centre National de la Recherche Scien-tifique, Gif sur Yvette, France; Charpilienne et al., 2001) were stored at 5°C at a concentration of 1.55 mg/ml in a solution of 20 mM Pipes, 10 M Ca2+ + 0.5 M CsCl, pH 6.84. They were diluted 1:1,200 using 60 mM Pipes, 27.3 mM Hepes, and 10 mM CaCl2 at a pH of 7.0 (PHM). The dilution was vortexed for 30 s, and 30 µl was perfused into a double-sided scotch tape perfusion chamber made with an acid-washed coverslip. After 10 min, the perfusion chamber was washed with 30 µl PHM four times. The chamber was sealed with VALAP and imaged immediately. EGFP (catalog no. 4999-100; BioVision) protein was stored at 80°C at a con-centration of 1 mg/ml in PBS. EGFP was diluted 1:32,000 or 1:50,000 with PBS, pH 7, and vortexed for 30 s; a perfusion chamber prepara-tion was made as described for GFP-VLP2/6, except that PBS, pH 7, was used as the wash and perfusion buffer (Sugiyama et al., 2005). GFP-MotB E. coli (provided by J.P. Armitage and N. Delalez, University of Oxford, Oxford, England, UK; Leake et al., 2006) was grown overnight in lysogeny broth (LB) media at 37°C. 40 µl of overnight culture was added to 5 ml of LB media and grown at 24°C for 2.5 h. A 1-ml sample was washed with 10 mM potassium phosphate, 0.1 mM EDTA, pH 7.0 (MB), resuspended in MB, and incubated at 24°C for 20 min. Immediately before imaging, 6 µl of suspension was placed on a poly-lysine–coated acid-washed coverslip and sealed with VALAP.
ImagingAll confocal images were recorded with 0.5 mW of laser illumination at 488 nm (Model 35 LTL 835-220; CVI Melles Griot) into the back aperture of a 100×/1.4 NA objective lens (Nikon) mounted on a TE300 stand (Nikon), and images were acquired using a spinning disk confocal head (Yokogawa CSU10; PerkinElmer), a camera (Orca; Hamamatsu) with 2 × 2 binning that makes the effective pixel size 130 nm in speci-men images, and MetaMorph 6.1 Software (Molecular Devices; Maddox et al., 2003). To find the z axis position of best focus for analysis, a through-focus series of image exposures at 200-nm steps was acquired starting just beneath the coverslip/media surface. Best focus occurred for the highest integrated intensity for a 5 × 5 region surrounding the fluorescent spot of interest. Through-focus exposures were 600 ms for all specimens except EGFP molecules, where we used 1,500 ms exposures. For EGFP preparations, we also recorded 100 successive images at best focus. At the room temperature used to image GFP(S65T) fusion
Carbon, 1982). This 2.5-fold preferential cleavage enhances the concentration of monomeric nucleosome fragments at the CEN relative to monomer concentration at positions within the flanking DNA. The second parameter is the maximum flanking nucleosome position (±15 kb in Fig. 4 A) away from the CEN, where H3 nucleosomes can be replaced by Cse4 nucleosomes.
Fig. 4 A diagrams the simulation result for cutting sites. Fig. 4 B shows the percentage, relative to the CEN Cse4 mono-mer, of mono-, di-, tri-, and tetrameric DNA fragments that contain at least one Cse4 nucleosome for 10,000 chromosomes in the computer simulation (Fig. S3). Note that the amount of monomeric Cse4 nucleosome is highest within the flanking nu-cleosomes at the ±1 position. This is because of the enhanced probability of cutting the linker to the CEN Cse4 nucleosome. At the ±1 position, the concentration of Cse4 monomer is 2.4% relative to the concentration at the CEN position. This percent-age is below the 3% limit of detectability in the experiments of Furuyama and Biggins (2007).
Our computer simulations show that a higher probabil-ity of cutting linkages to the CEN Cse4 nucleosome relative to the linkages between the flanking nucleosomes (Bloom and Carbon, 1982) reduces the length of the flanking nucleosomes needed to reduce the relative concentration of monomeric Cse4 nucleosomes to below the 3% limit of detection in the flank-ing region (Fig. 4, C and D; Furuyama and Biggins, 2007). For no difference in probability of cutting between CEN and flanking nucleosome linkages, the flanking region incorporat-ing Cse4 nucleosomes must be 35 nucleosomes in length. For a threefold enhancement, only a 12 nucleosome flanking length is needed.
Will Cse4-GFP nucleosomes replacing H3 nucleosomes at flanking positions of ±35 or less be within the diffraction-limited spot measured for the cluster of sister kinetochores at anaphase? Nucleosomes occur at intervals of 160 bp along DNA, and the length of an unstretched 10-nm diameter chroma-tin fiber is 5 nm per nucleosome. The length of unstretched chromatin flanking the CEN will be 206 nm for 35 nucleosomes and 75 nm for the 15 nucleosome length in Fig. 4 A. These lengths are beneath the 220 nm diffraction limit of resolution for GFP fluorescence.
The structural diagram of the model in Fig. 3 is for a chromosome with two Cse4 nucleosomes positioned within the flanking chromatin on either side of a CEN Cse4 nucleosome at the base of the kinetochore. Biochemical evidence indicates that the CBF3 complex contains one CEP3 protein and two to three Ndc10 proteins (Espelin et al., 2003). CBF3 does oligo-merize in solution (Espelin et al., 2003). Perhaps the clustering shown in Fig. 3 is caused by oligomerization of adjacent Ndc10 complexes in between adjacent CBF3 complexes, other un-known proteins that cross-link adjacent kMT attachment sites together near the base of the kinetochore (Gregan et al., 2011), or the binding of the Ndc80 complexes extending from the three Cse4 nucleosomes all to the same plus end of a kMT. However, an important question is whether kinetochore structural proteins assemble directly onto the “extra” non-CEN flanking Cse4 nu-cleosomes, or whether kinetochore assembly is restricted to only the Cse4 complex that is bound at the CEN DNA sequence.
on January 6, 2016jcb.rupress.org
Dow
nloaded from
Published November 14, 2011

JCB • VOLUME 195 • NUMBER 4 • 2011 580
For cellular specimens, the measured data were also corrected for loss of fluorescence intensity as a function of specimen depth beneath the coverslip surface as described by Johnston et al. (2010) and by the legend for Fig. S2. Fluorescence intensity at best focus decreased with depth be-cause of the spherical aberration produced by the difference in refractive index of the coverslip (n = 1.52) and the cell (n = 1.38; Joglekar et al., 2006; Johnston et al., 2010). We verified the accuracy of our correc-tion procedure using the 100-nm diameter fluorescent beads (no. 17150; Polysciences Inc.) embedded in 25% gelatin in yeast media (Fig. S2 I; Yeh et al., 1995).
For both depth-corrected and photobleach-corrected data, a MatLab program (MathWorks) was used to obtain the least squares fit to histo-grams using Gaussian functions for both monomer and dimer populations; the monomer mean values were used in our calculations (Fig. 1). The his-tograms of the measurement data for all the specimens except EGFP and GFP-MotB were well fit by a single Gaussian function (Fig. 1, D–M). The best fit for EGFP and GFP-MotB required a function containing two Gaussians, one for the majority of monomers and a second for a minority of dimers (two EGFPs or two rotary motors) within the same diffraction limited spot (Fig. 1, B and C). Photobleaching verified the presence of dimers in some EGFP spots (Fig. S1 A). As seen in Fig. 1 B for EGFP, the monomer–dimer Gaussian function yields a much better fit to the measured data than the single Gaussian function. The value for the monomer fraction of EGFP was used as a primary standard. Note that the data in Fig. 1 B for EGFP has been corrected for false positives produced by BG noise (Fig. S1C), which had a standard deviation of 2.9 compared with the mean value of the EGFP monomer of 13 ± 3.7.
We feel confident that the procedures we have used to measure the variance of specimen data about the mean value (Fig. S2 and Fig. 1, B–M) is not underestimating error, except from contributions from data far beneath the coverslip surface. We calculated the mean and stan-dard deviation for the intercept for a Least Squares Fit (Taylor, 1982, pp. 151–159) to the integrated fluorescence intensity minus BG data in Fig. S2 for all our test specimens. The means in our Gaussian fit to the normalized data (Fig. 1, B–M) were identical to the means for the inter-cept of the least squares fits, whereas the standard deviations from the mean in the Gaussian fits were 2–5 times larger than the standard devia-tion of the intercept values. We conclude that it is the variance of the data measurements from the mean value at each depth that is the major factor in the uncertainty of the measurements, not the errors in the uncertainty of the least squares fitting procedure. Our normalization method that makes the mean value at all depths equal to the intercept value allowed us to make a histogram of the data as shown in Fig. 1 (B–M) and Fig. S2 I to see if one or more Gaussians were needed to fit the data; this is an important feature of our method.
In our calculations of the mean number counts/GFP and mean number of GFP fusion proteins per spot, per kinetochore cluster, or per ki-netochore from measurements of integrated fluorescence intensity minus BG, we calculated standard deviation uncertainties from the measured means and standard deviations as described by Taylor (1982), pp. 40–57 and 151–159.
Computer simulationsThe basic concepts for the MatLab computer simulation of the Furuyama and Biggins (2007) biochemical experiment are described within the text and illustrated in Fig. 4. See Fig. S3 for an annotated listing of the Mat-Lab program.
Online supplemental materialFigs. S1 and 2 contain data supporting results contained in Figs. 1 and 2 and Tables I–III. Fig. S3 contains a listing of the MatLab program used to simulate the data presented in Fig. 4. Online supplemental material is avail-able at http://www.jcb.org/cgi/content/full/jcb.201106036/DC1.
We are grateful to Dr. Ann Charpilienne and Dr. Didier Poncet for provid-ing purified rotovirus-like GFP-VLP2/6 particles and Drs. Nick Delalez and J.P. Armitage for supplying E. coli with GFP-MotB. We thank Jian-Qiu Wu for sharing results before publication. We appreciate the stimulating discussions about kinetochore protein architecture by the members of the Salmon and Bloom laboratories, particularly Dr. Ajit Joglekar.
This paper was funded by GM 24364 (E.D. Salmon) and GM 32238 (K.S. Bloom) from the National Institutes of Health.
Submitted: 6 June 2011Accepted: 11 October 2011
proteins in budding yeast, GFP(EGFP)-MotB E. coli, GFP(EGFP)-VLP2/6, and EGFP molecules, we expect equivalent fluorescence intensity from GFP(S65T) within cells and EGFP for the same excitation light intensity at room temperature. This is because at the room temperature of our studies (24°C), both GFP(S65T) and EGFP(S65T, F64L; Yang et al., 1996) exhibit nearly identical excitation and emission spectra, extinc-tion coefficient, quantum yield, fluorescence stability to pH changes >7.0, and photobleaching stability (Patterson et al., 1997). The extinc-tion coefficient for EGFP purified from bacterially expressed protein (Bio-Vision) and for EGFP-VLP2/6 viral protein capsids purified from SF9 cells (Charpilienne et al., 2001) were both the value expected for the properly folded fluorophore, 55,000 M/cm at a 488-nm wavelength. Patterson et al. (1997) show that the efficiency of GFP chromophore formation for S65T and EGFP are both greater than 95% at 28°C and greater than 90% for EGFP at 37°C.
FRAPThe FRAP techniques performed have been described previously (Pearson et al., 2004). In our study, the microscope was an Eclipse TE2000E stand (Nikon) with a 100× Plan-Apochromat NA 1.4 objective lens with a cam-era (Orca ER; Hamamatsu). The microscope back port was fitted with a beam expander (Point Source) fiber optically coupled to a 50-mW argon ion laser (SpectraPhysics) to bring the photobleaching light into the back aperture of the objective. The laser exposure was 25 ms. Fluorescent images were acquired at intervals between 2 s and 2 min, depending on the experiment. Specimen preparation is described in the first section of Materials and methods. MetaMorph 6.1 software (Molecular Devices) was used to operate the laser and microscope.
Image analysisIntegrated fluorescence intensity (minus BG) measurements were ob-tained using the Hoffman et al. (2001) method as described in Joglekar et al. (2006) and Johnston et al. (2010). A 5 × 5 pixel region was centered on the fluorescent cluster or spot to obtain integrated fluores-cence, whereas a 7 × 7 region centered on the 5 × 5 region was used to obtain surrounding BG intensity. We only measured kinetochore clus-ters that did not obviously move. Measured values were calculated by: integrated fluorescence intensity (minus BG) = integrated counts for 5 × 5 region – (integrated counts for the 7 × 7 region integrated counts for 5 × 5 region) × pixel area of the 5 × 5 region/(pixel area of the 7 × 7 region pixel area of a 5 × 5 region). BG measurements were obtained from the 7 × 7 pixel region minus the value for the 5 × 5 pixel region and scaled to the same area as the specimen after subtracting the value for a camera image without laser illumination (mostly readout offset and noise). Note that each count (gray value in the 12 bit image) corresponds to approximately five photoelectrons. Measurements for most specimens were made with MetaMorph 6.1 Software (Molecular Devices) using region measurements.
For EGFP, integrated fluorescence (minus BG) values were obtained as follows. A mean of the initial eight exposures of the time-lapse series was used for analysis of EGFP fluorescence. The 1,500-ms exposure and eight-frame mean enhanced the signal-to-noise for individual EGFP mol-ecules compared with a single 600-ms exposure, which was satisfactory for the other specimens that had many GFPs per complex. We only ana-lyzed EGFPs that did not bleach during the first eight frames. Their x,y coordinates were identified by measuring the kinetics of photobleaching in the time-lapse recordings using a 2 × 2 region centered on the coordi-nate position. We obtained integrated fluorescence intensity data for BG positions in-between the coordinates for the EGFP molecules and for clean coverslips in chamber containing only media and no EGFP molecules; these measurements were nearly identical. The corrected measurements for EGFP were scaled by dividing by 2.5, the ratio of integrated intensity be-tween 1,500-ms and 600-ms exposures measured using 40-nm fluorescent beads (no. 24053-10; Polysciences, Inc.) attached to the coverslip surface (Fig. S1 B). This normalized the EFGP measurements to the 600 ms expo-sures used for all the other specimens in our experiments. We also removed from the EGFP data false positives produced by BG noise (Fig. S1 C). This procedure was not needed for the other specimens where the measure-ments from many GFPs per cluster or particle were far greater than the BG noise for 600 ms exposures.
For the virus and cellular specimens, the measured data were cor-rected for photobleaching that occurred during the through focus series to find best focus (Fig. S1, D and E). Photobleaching was typically 5% for the 5-µm diameter budding yeast specimens and the E. coli and 2% for the virus (Fig. S1 E).
on January 6, 2016jcb.rupress.org
Dow
nloaded from
Published November 14, 2011

581Kinetochore protein copy numbers • Lawrimore et al.
centromeres. J. Cell Biol. 181:587–594. http://dx.doi.org/10.1083/ jcb.200803027
Joglekar, A.P., K. Bloom, and E.D. Salmon. 2009. In vivo protein architecture of the eukaryotic kinetochore with nanometer scale accuracy. Curr. Biol. 19:694–699. http://dx.doi.org/10.1016/j.cub.2009.02.056
Joglekar, A.P., K.S. Bloom, and E.D. Salmon. 2010. Mechanisms of force gen-eration by end-on kinetochore-microtubule attachments. Curr. Opin. Cell Biol. 22:57–67. http://dx.doi.org/10.1016/j.ceb.2009.12.010
Johnston, K., A. Joglekar, T. Hori, A. Suzuki, T. Fukagawa, and E.D. Salmon. 2010. Vertebrate kinetochore protein architecture: protein copy number. J. Cell Biol. 189:937–943. http://dx.doi.org/10.1083/jcb.200912022
Kingston, I.J., J.S. Yung, and M.R. Singleton. 2011. Biophysical characteriza-tion of the centromere-specific nucleosome from budding yeast. J. Biol. Chem. 286:4021–4026. http://dx.doi.org/10.1074/jbc.M110.189340
Leake, M.C., J.H. Chandler, G.H. Wadhams, F. Bai, R.M. Berry, and J.P. Armitage. 2006. Stoichiometry and turnover in single, functioning membrane protein complexes. Nature. 443:355–358. http://dx.doi.org/ 10.1038/nature05135
Maddox, P.S., B. Moree, J.C. Canman, and E.D. Salmon. 2003. Spinning disk confocal microscope system for rapid high-resolution, multimode, fluo-rescence speckle microscopy and green fluorescent protein imaging in living cells. Methods Enzymol. 360:597–617. http://dx.doi.org/10.1016/ S0076-6879(03)60130-8
Maresca, T.J., and E.D. Salmon. 2010. Welcome to a new kind of tension: trans-lating kinetochore mechanics into a wait-anaphase signal. J. Cell Sci. 123:825–835. http://dx.doi.org/10.1242/jcs.064790
Meluh, P.B., P. Yang, L. Glowczewski, D. Koshland, and M.M. Smith. 1998. Cse4p is a component of the core centromere of Saccharomyces cerevisiae. Cell. 94:607–613. http://dx.doi.org/10.1016/S0092-8674(00)81602-5
Mizuguchi, G., H. Xiao, J. Wisniewski, M.M. Smith, and C. Wu. 2007. Nonhistone Scm3 and histones CenH3-H4 assemble the core of centromere- specific nucleosomes. Cell. 129:1153–1164. http://dx.doi.org/10.1016/ j.cell.2007.04.026
Patterson, G.H., S.M. Knobel, W.D. Sharif, S.R. Kain, and D.W. Piston. 1997. Use of the green fluorescent protein and its mutants in quantitative fluorescence microscopy. Biophys. J. 73:2782–2790. http://dx.doi.org/ 10.1016/S0006-3495(97)78307-3
Pearson, C.G., P.S. Maddox, E.D. Salmon, and K. Bloom. 2001. Budding yeast chromosome structure and dynamics during mitosis. J. Cell Biol. 152:1255–1266. http://dx.doi.org/10.1083/jcb.152.6.1255
Pearson, C.G., E. Yeh, M. Gardner, D. Odde, E.D. Salmon, and K. Bloom. 2004. Stable kinetochore-microtubule attachment constrains centromere positioning in metaphase. Curr. Biol. 14:1962–1967. http://dx.doi.org/ 10.1016/j.cub.2004.09.086
Pidoux, A.L., E.S. Choi, J.K. Abbott, X. Liu, A. Kagansky, A.G. Castillo, G.L. Hamilton, W. Richardson, J. Rappsilber, X. He, and R.C. Allshire. 2009. Fission yeast Scm3: A CENP-A receptor required for integrity of subkinetochore chromatin. Mol. Cell. 33:299–311. http://dx.doi.org/ 10.1016/j.molcel.2009.01.019
Powers, A.F., A.D. Franck, D.R. Gestaut, J. Cooper, B. Gracyzk, R.R. Wei, L. Wordeman, T.N. Davis, and C.L. Asbury. 2009. The Ndc80 kineto-chore complex forms load-bearing attachments to dynamic micro-tubule tips via biased diffusion. Cell. 136:865–875. http://dx.doi.org/ 10.1016/j.cell.2008.12.045
Ribeiro, S.A., J.C. Gatlin, Y. Dong, A. Joglekar, L. Cameron, D.F. Hudson, C.J. Farr, B.F. McEwen, E.D. Salmon, W.C. Earnshaw, and P. Vagnarelli. 2009. Condensin regulates the stiffness of vertebrate cen-tromeres. Mol. Biol. Cell. 20:2371–2380. http://dx.doi.org/10.1091/mbc .E08-11-1127
Riedel, C.G., V.L. Katis, Y. Katou, S. Mori, T. Itoh, W. Helmhart, M. Gálová, M. Petronczki, J. Gregan, B. Cetin, et al. 2006. Protein phosphatase 2A protects centromeric sister chromatid cohesion during meiosis I. Nature. 441:53–61. http://dx.doi.org/10.1038/nature04664
Santaguida, S., and A. Musacchio. 2009. The life and miracles of kinetochores. EMBO J. 28:2511–2531. http://dx.doi.org/10.1038/emboj.2009.173
Schittenhelm, R.B., F. Althoff, S. Heidmann, and C.F. Lehner. 2010. Detrimental incorporation of excess Cenp-A/Cid and Cenp-C into Drosophila cen-tromeres is prevented by limiting amounts of the bridging factor Cal1. J. Cell Sci. 123:3768–3779. http://dx.doi.org/10.1242/jcs.067934
Stoler, S., K. Rogers, S. Weitze, L. Morey, M. Fitzgerald-Hayes, and R.E. Baker. 2007. Scm3, an essential Saccharomyces cerevisiae cen-tromere protein required for G2/M progression and Cse4 localization. Proc. Natl. Acad. Sci. USA. 104:10571–10576. http://dx.doi.org/10.1073/ pnas.0703178104
Sugiyama, Y., I. Kawabata, K. Sobue, and S. Okabe. 2005. Determination of absolute protein numbers in single synapses by a GFP-based calibration technique. Nat. Methods. 2:677–684. http://dx.doi.org/10.1038/nmeth783
ReferencesAlushin, G.M., V.H. Ramey, S. Pasqualato, D.A. Ball, N. Grigorieff, A.
Musacchio, and E. Nogales. 2010. The Ndc80 kinetochore complex forms oligomeric arrays along microtubules. Nature. 467:805–810. http://dx.doi.org/10.1038/nature09423
Belmont, A.S., and A.F. Straight. 1998. In vivo visualization of chromosomes using lac operator-repressor binding. Trends Cell Biol. 8:121–124. http://dx.doi.org/10.1016/S0962-8924(97)01211-7
Bloom, K.S., and J. Carbon. 1982. Yeast centromere DNA is in a unique and highly ordered structure in chromosomes and small circular minichromosomes. Cell. 29:305–317. http://dx.doi.org/10.1016/0092-8674(82)90147-7
Camahort, R., B. Li, L. Florens, S.K. Swanson, M.P. Washburn, and J.L. Gerton. 2007. Scm3 is essential to recruit the histone h3 variant cse4 to centro-meres and to maintain a functional kinetochore. Mol. Cell. 26:853–865. http://dx.doi.org/10.1016/j.molcel.2007.05.013
Charpilienne, A., M. Nejmeddine, M. Berois, N. Parez, E. Neumann, E. Hewat, G. Trugnan, and J. Cohen. 2001. Individual rotavirus-like particles containing 120 molecules of fluorescent protein are visible in living cells. J. Biol. Chem. 276:29361–29367. http://dx.doi.org/10.1074/jbc .M101935200
Cheeseman, I.M., J.S. Chappie, E.M. Wilson-Kubalek, and A. Desai. 2006. The conserved KMN network constitutes the core microtubule-binding site of the kinetochore. Cell. 127:983–997. http://dx.doi.org/10.1016/ j.cell.2006.09.039
Cho, U.S., and S.C. Harrison. 2011. Recognition of the centromere-specific his-tone Cse4 by the chaperone Scm3. Proc. Natl. Acad. Sci. USA. 108:9367–9371. http://dx.doi.org/10.1073/pnas.1106389108
Ciferri, C., S. Pasqualato, E. Screpanti, G. Varetti, S. Santaguida, G. Dos Reis, A. Maiolica, J. Polka, J.G. De Luca, P. De Wulf, et al. 2008. Implications for kinetochore-microtubule attachment from the structure of an engineered Ndc80 complex. Cell. 133:427–439. http://dx.doi.org/ 10.1016/j.cell.2008.03.020
Dechassa, M.L., K. Wyns, M. Li, M.A. Hall, M.D. Wang, and K. Luger. 2011. Structure and Scm3-mediated assembly of budding yeast cen-tromeric nucleosomes. Nat Commun. 2:313. http://dx.doi.org/10.1038/ ncomms1320
Dundr, M., J.G. McNally, J. Cohen, and T. Misteli. 2002. Quantitation of GFP-fusion proteins in single living cells. J. Struct. Biol. 140:92–99. http://dx.doi.org/10.1016/S1047-8477(02)00521-X
Emanuele, M.J., M.L. McCleland, D.L. Satinover, and P.T. Stukenberg. 2005. Measuring the stoichiometry and physical interactions between compo-nents elucidates the architecture of the vertebrate kinetochore. Mol. Biol. Cell. 16:4882–4892. http://dx.doi.org/10.1091/mbc.E05-03-0239
Espelin, C.W., K.T. Simons, S.C. Harrison, and P.K. Sorger. 2003. Binding of the essential Saccharomyces cerevisiae kinetochore protein Ndc10p to CDEII. Mol. Biol. Cell. 14:4557–4568. http://dx.doi.org/10.1091/mbc.E02- 08-0533
Furuyama, S., and S. Biggins. 2007. Centromere identity is specified by a single centromeric nucleosome in budding yeast. Proc. Natl. Acad. Sci. USA. 104:14706–14711. http://dx.doi.org/10.1073/pnas.0706985104
Furuyama, T., and S. Henikoff. 2009. Centromeric nucleosomes induce posi-tive DNA supercoils. Cell. 138:104–113. http://dx.doi.org/10.1016/j.cell .2009.04.049
Gkikopoulos, T., V. Singh, K. Tsui, S. Awad, M.J. Renshaw, P. Scholfield, G.J. Barton, C. Nislow, T.U. Tanaka, and T. Owen-Hughes. 2011. The SWI/SNF complex acts to constrain distribution of the centro-meric histone variant Cse4. EMBO J. 30:1919–1927. http://dx.doi.org/ 10.1038/emboj.2011.112
Gregan, J., S. Polakova, L. Zhang, I.M. Tolić-Nørrelykke, and D. Cimini. 2011. Merotelic kinetochore attachment: causes and effects. Trends Cell Biol. 21:374–381. http://dx.doi.org/10.1016/j.tcb.2011.01.003
Hajra, S., S.K. Ghosh, and M.J. Jayaram. 2006. The centromere-specific his-tone variant Cse4p (CENP-A) is essential for functional chromatin ar-chitecture at the yeast 2-microm circle partitioning locus and promotes equal plasmid segregation. J. Cell Biol. 174:779–790. http://dx.doi.org/ 10.1083/jcb.200603042
Hoffman, D.B., C.G. Pearson, T.J. Yen, B.J. Howell, and E.D. Salmon. 2001. Microtubule-dependent changes in assembly of microtubule motor pro-teins and mitotic spindle checkpoint proteins at PtK1 kinetochores. Mol. Biol. Cell. 12:1995–2009.
Joglekar, A.P., D.C. Bouck, J.N. Molk, K.S. Bloom, and E.D. Salmon. 2006. Molecular architecture of a kinetochore-microtubule attachment site. Nat. Cell Biol. 8:581–585. http://dx.doi.org/10.1038/ncb1414
Joglekar, A.P., D. Bouck, K. Finley, X. Liu, Y. Wan, J. Berman, X. He, E.D. Salmon, and K.S. Bloom. 2008. Molecular architecture of the kinetochore- microtubule attachment site is conserved between point and regional
on January 6, 2016jcb.rupress.org
Dow
nloaded from
Published November 14, 2011

JCB • VOLUME 195 • NUMBER 4 • 2011 582
Taylor, J.R. 1982. An introduction to error analysis: the study of uncertainties in physical measurements. University Science Books, Mill Valley, CA. 270 pp.
Verdaasdonk, J.S., and K. Bloom. 2011. Centromeres: unique chromatin struc-tures that drive chromosome segregation. Nat. Rev. Mol. Cell Biol. 12:320–332. http://dx.doi.org/10.1038/nrm3107
Williams, J.S., T. Hayashi, M. Yanagida, and P. Russell. 2009. Fission yeast Scm3 mediates stable assembly of Cnp1/CENP-A into centromeric chromatin. Mol. Cell. 33:287–298. http://dx.doi.org/10.1016/j.molcel.2009.01.017
Winey, M., C.L. Mamay, E.T. O’Toole, D.N. Mastronarde, T.H. Giddings Jr., K.L. McDonald, and J.R. McIntosh. 1995. Three-dimensional ultrastruc-tural analysis of the Saccharomyces cerevisiae mitotic spindle. J. Cell Biol. 129:1601–1615. http://dx.doi.org/10.1083/jcb.129.6.1601
Yang, T.T., L. Cheng, and S.R. Kain. 1996. Optimized codon usage and chromo-phore mutations provide enhanced sensitivity with the green fluorescent protein. Nucleic Acids Res. 24:4592–4593. http://dx.doi.org/10.1093/ nar/24.22.4592
Yeh, E., R.V. Skibbens, J.W. Cheng, E.D. Salmon, and K. Bloom. 1995. Spindle dynamics and cell cycle regulation of dynein in the budding yeast, Saccharomyces cerevisiae. J. Cell Biol. 130:687–700. http://dx.doi.org/ 10.1083/jcb.130.3.687
on January 6, 2016jcb.rupress.org
Dow
nloaded from
Published November 14, 2011

Kinetochore protein copy numbers • Lawrimore et al.
S1
JCB
TH
E J
OU
RN
AL
OF
CE
LL
BIO
LO
GY
Supplemental material
Lawrimore et al., http://www.jcb.org/cgi/content/full/jcb.201106036/DC1
Figure S1. Data supporting the procedures used in our calibrated fluorescence measurements. (A) Example of EGFP dimer and monomer photobleaching as measured by integrating fluorescence counts within a 2 × 2 pixel region centered on EGFP in images recorded with 1,500-ms exposures at 2-s intervals. The camera dark image has not been subtracted. (B) Comparison of integrated fluorescence counts minus BG for 40-nm fluorescent beads for images recorded for 1,500 ms and 600 ms at increasing levels of laser excitation intensity measured by a proportional voltage output. Error bars indicate SD. (C) Histogram of the integrated fluorescence minus BG from 240 individual EGFP monomers or dimers in vitro that did not bleach during the first eight frames of recording that produced an eight-frame mean image for analysis. Plotted on the same axis is a histogram of similar measurements for an eight-frame mean of 240 BG regions without EFGP molecules. The overlap of the two histograms was used to subtract false positives produced from the BG noise from the EGFP data for the plot in Fig. 1 B. (D) Example of relative photobleaching ( fluorescence/previous fluorescence at plane of focus) as a function of the number of sequential focal planes in successive through-focal series. (E) Table showing the fraction of initial fluorescence lost for each specimen before best focus was achieved in the initial through-focus series. This fraction is used to correct data for the histograms in Fig. 1 (C–M). (F) A quantitative mating assay that measured chromosome III loss, gene conversion, or mutation. By comparing the increase over baseline mating of a wild-type cell, we were able to estimate the degree to which the Cse4-GFP construct decreases the fidelity of chromosome segregation. As shown in the figure, diploid cells with both GFP fusion proteins show a 31-fold increase in chromosome loss. The fidelity of chromosome segregation is exceedingly high in cells with all their Cse4 present as a fusion construct. Thus the GFP fusion has a measurable but inconsequential effect on the fidelity of chromosome segregation. (G) Table of cell strains used in our experiments.

S2
Figure S2. Primary and corrected measurements of integrated intensity minus background. Plots of measurements from kinetochore clusters (A–H) and 100-nm fluorescent bead calibration (I) as a function of focal plane depth beneath the coverslip surface, along with the corresponding data corrected for loss of intensity with depth. As described by Johnston et al. (2010), a straight line was fit to the original data by a least-squares function that yielded an intercept value at the coverslip surface (depth set = 0) and a negative slope as a function of the number of frames beneath the coverslip (N). Corrected values equaled the measured value at n depth + (|slope| × N). In I, 100 nm fluorescent beads (that did not bleach) were embedded in yeast media plus 25% gelatin to mimic refractive index of cells and to immobilize the beads. Measurements were acquired for the beads at the coverslip surface and at vari-ous focal planes inside the coverslip surface. The intercept value at the coverslip surface (7,785) calculated from the intercept of the least-squares fit to the data were nearly identical to the mean value measured for the beads at the coverslip surface (7,883). The standard deviation calculated by our Gaussian fit procedure to the normalized data (see Materials and methods) in the lower plot in Fig. S2 I was 1,340, 30% less than the 2,119 measured for the beads at the cell surface. This reduction may be caused by the reduced variance in the data from the mean large coverslip depths. This reduction was not apparent in many of the cellular examples in Fig. S2.

Kinetochore protein copy numbers • Lawrimore et al. S3
Figure S3. MatLab program for simulation of the Furuyama and Biggins (2007) experiment as described in the text and Fig. 4. Variables are set at values for the experiment described in Fig. 4. This program is also available for download as a text file.

JCB S4
Figure S3 is available for download as a text file.
ReferencesFuruyama, S., and S. Biggins. 2007. Centromere identity is specified by a single centromeric nucleosome in budding yeast. Proc. Natl. Acad. Sci. USA. 104:14706–
14711. http://dx.doi.org/10.1073/pnas.0706985104
Johnston, K., A. Joglekar, T. Hori, A. Suzuki, T. Fukagawa, and E.D. Salmon. 2010. Vertebrate kinetochore protein architecture: protein copy number. J. Cell Biol. 189:937–943. http://dx.doi.org/10.1083/jcb.200912022


![Genetic and morphological analysis amaize-teosinte population: … · (Adkl, Jdh2, Prx3, Sad], and Tpi3) are shown. Solid circles indicate the approximate positions ofthe centromeres](https://static.fdocuments.net/doc/165x107/6125e6f24d397658444c4b32/genetic-and-morphological-analysis-amaize-teosinte-population-adkl-jdh2-prx3.jpg)