PNG LNG Project LNG Facilities Environmental Noise Impact … · 2016-09-15 · PNG LNG Project LNG...
65
HEGGIES PTY LTD ABN 29 001 584 612 Incorporating New Environment Graeme E. Harding & Associates Eric Taylor Acoustics REPORT 40-1530-R1 Revision 1 PNG LNG Project LNG Facilities Environmental Noise Impact Assessment PREPARED FOR Coffey Natural Systems 126 Trenerry Crescent, Abbotsford, VIC 3067 15 JANUARY 2009
Transcript of PNG LNG Project LNG Facilities Environmental Noise Impact … · 2016-09-15 · PNG LNG Project LNG...

HEGGIES PTY LTD ABN 29 001 584 612
Incorporating New Environment Graeme E. Harding & Associates Eric Taylor Acoustics
REPORT 40-1530-R1
Revision 1
PNG LNG Project
LNG Facilities
Environmental Noise Impact Assessment
PREPARED FOR
Coffey Natural Systems 126 Trenerry Crescent, Abbotsford, VIC 3067
15 JANUARY 2009

PNG LNG Project LNG Facilities Environmental Noise Impact Assessment Coffey Natural Systems
Heggies Pty Ltd Report Number 40-1530-R1 Revision 1
(40-1530 R1R1.doc) 15 January 2009 Page 2
PNG LNG Project
LNG Facilities
Environmental Noise Impact Assessment
PREPARED BY:
Heggies Pty Ltd Suite 6, 131 Bulleen Road Balwyn North VIC 3104 Australia Telephone 61 3 9249 9400 Facsimile 61 3 9249 9499 Email [email protected] Web www.heggies.com
DISCLAIMER
Reports produced by Heggies Pty Ltd are prepared for a particular Client’s objective and are based on a specific scope, conditions and limitations, as agreed between Heggies and the Client. Information and/or report(s) prepared by Heggies may not be suitable for uses other than the original intended objective. No parties other than the Client should use any information and/or report(s) without first conferring with Heggies.
The information and/or report(s) prepared by Heggies should not be reproduced, presented or reviewed except in full. Before passing on to a third party any information and/or report(s) prepared by Heggies, the Client is to fully inform the third party of the objective and scope and any limitations and conditions, including any other relevant information which applies to the material prepared by Heggies. It is the responsibility of any third party to confirm whether information and/or report(s) prepared for others by Heggies are suitable for their specific objectives.
Heggies Pty Ltd is a Member Firm of the Association of Australian Acoustical Consultants.
Heggies Pty Ltd operates under a Quality System which has been certified by SAI Global Pty Limited to comply with all the requirements of ISO 9001:2000 "Quality management systems - Requirements" (Licence No 3236).
This document has been prepared in accordance with the requirements of that System.
DOCUMENT CONTROL
Reference Status Date Prepared Checked Authorised
40-1530-R1 Revision 1 15 January 2009 Gustaf Reutersward Jim Antonopoulos Gustaf Reutersward
40-1530-R1 Revision 0 4 December 2008 Gustaf Reutersward Jim Antonopoulos Gustaf Reutersward

EXECUTIVE SUMMARY
PNG LNG Project LNG Facilities Environmental Noise Impact Assessment Coffey Natural Systems
Heggies Pty Ltd Report Number 40-1530-R1 Revision 1
(40-1530 R1R1.doc) 15 January 2009 Page 3
The Papua New Guinea Liquefied Natural Gas (PNG LNG) Project involves the development of a number of gas fields and facilities in a series of development phases to produce liquefied natural gas (LNG) for export.
This report presents the results and findings of the noise assessment including noise impacts associated with construction and with operation of the proposed LNG Facilities located within Portion 152, approximately 20 km northwest of Port Moresby on Caution Bay.
The nearest potentially affected noise sensitive receptors are houses in the villages of Papa, Metago Bible College and Boera, which are approximately 2 to 5 km from the proposed LNG Facilities. The houses are generally of lightweight construction and made of fibro-cement sheet, timber weatherboard or tin and are often elevated on poles approximately 2 to 3 m high and are typically surrounded by garden-style agricultural plots.
Noise monitoring was conducted at a total of three locations close to the proposed LNG project site during April and May 2008 to determine and characterise existing ambient noise levels. The noise environment at all monitoring locations was generally similar in character, with the main noise sources being natural sources such as wind noise in foliage, insects, birds, periods of heavy rain and domesticated animals, together with typical village activities.
The results at all monitoring sites indicate that evening and night-time background noise levels are higher than during the day time. Recordings taken during the night period indicated that insect noise dominates the ambient noise environment which is a common feature of the ambient environment all year round.
The prevailing meteorological conditions were evaluated and it was concluded that winds and temperature inversions with the ability to enhance noise propagation are a feature of the region during certain times of the year.
Project operational and construction noise criteria were developed with consideration to the WHO Guidelines for Community Noise and the International Finance Corporation (IFC) (World Bank) Noise Management Guidelines. Appropriate criteria for blasting, traffic and site boundary were also developed.
Computer noise modelling was utilised to predict noise levels at receptors for a number of construction and operational scenarios.
Predicted construction noise levels show that project noise limits will be complied with under all conditions during the day and night period. Furthermore, construction noise is likely to be inaudible against the existing ambient noise level, particularly during the night period.
Blasting impacts are not anticipated to exceed recommended limits. A Blasting Management Plan for both terrestrial and marine environments is to be prepared with consideration of the ANZECC guideline and AS 2187.2-1993 and in consultation with local communities.
Road traffic generated during construction may result in noise increases of approximately 1 to 2 dBA, resulting in levels that are generally acceptable at most communities. However, some receptors in the village of Baruni currently have minimal road setback and relatively high levels of existing traffic, such that any significant increase in traffic has the potential to cause disturbance. Consideration of project imposed speed limits, increased dwelling set-back distances or alternative road alignments could be effective means of mitigating traffic noise impacts.
Predicted noise levels of the operation of LNG Facilities were found to comply with noise limits at all time periods and in all meteorological conditions. Furthermore, operational noise is likely to be inaudible against the existing ambient noise level, particularly during the night period.
TABLE OF CONTENTS
PNG LNG Project LNG Facilities Environmental Noise Impact Assessment Coffey Natural Systems
Heggies Pty Ltd Report Number 40-1530-R1 Revision 1
(40-1530 R1R1.doc) 15 January 2009 Page 4
1 INTRODUCTION 1
2 PROJECT DESCRIPTION 2 2.1 LNG Facilities 2 2.2 LNG Storage and Loading 2 2.3 LNG Offplot and LNG Offsite Facilities 3
3 SITE DETAILS & OVERVIEW 5 3.1 Site Location 5 3.2 Affected Receptors 5
3.2.1 Papa 5 3.2.2 Metago Bible College 6 3.2.3 Boera 6
4 NOISE FUNDAMENTALS 7 4.1 Noise 7 4.2 A-weighting and ‘dBA’ 7 4.3 Statistical Noise Level Descriptors 8 4.4 Character 9
5 EXISTING NOISE AND METEOROLOGICAL ENVIRONMENT 10 5.1 Noise Environment 10 5.2 Noise Monitoring Results 13 5.3 Meteorological Environment 15
5.3.1 Prevailing Wind 15 5.3.2 Temperature Inversions 15 5.3.3 Noise Modelling Meteorology - CONCAWE 16
6 ENVIRONMENTAL NOISE STANDARDS 17 6.1 WHO Guidelines for Community Noise 17
6.1.1 Night Period - Sleep Disturbance 17 6.1.2 Day Period 18 6.1.3 Impulsive Noise Sources 18
6.2 IFC / World Bank Noise Management Guidelines 18 6.3 Australian Criteria 19 6.4 Construction Noise 19 6.5 Blasting 20 6.6 Transportation Noise 20 6.7 Boundary Noise Target 21 6.8 Other Considerations 21 6.9 Recommended Project Noise Criteria 22

TABLE OF CONTENTS
PNG LNG Project LNG Facilities Environmental Noise Impact Assessment Coffey Natural Systems
Heggies Pty Ltd Report Number 40-1530-R1 Revision 1
(40-1530 R1R1.doc) 15 January 2009 Page 5
7 NOISE MODELLING METHOD 23 7.1 Introduction 23 7.2 Construction Noise 23
7.2.1 Site Preparation and Civil Works 23 7.2.2 Construction of the LNG Processing Facilities, Plant Utilities and Offsites 25
7.3 Operational Noise 26 7.3.1 LNG Processing and Utilities 26 7.3.2 Shipping 28 7.3.3 Flare 29
8 MODEL PREDICTIONS AND ASSESSMENT 30 8.1 Construction Noise Assessment 30 8.2 Blasting 30 8.3 Operational Noise Assessment 32
8.3.1 LNG Processing and Utilities 33 8.3.2 Shipping 35 8.3.3 Flare 36 8.3.4 Traffic Noise 37
9 CONCLUSIONS 40 9.1 Construction 40 9.2 Operation 40
10 REFERENCES 41
Appendix A1 Baseline Noise Monitoring – Statistical Noise Levels – Location BG1 Appendix A2 Baseline Noise Monitoring – Statistical Noise Levels – Location BG2 Appendix A3 Baseline Noise Monitoring -– Statistical Noise Levels – Location BG3 Appendix B Seasonal Wind Analysis

PNG LNG Project LNG Facilities Environmental Noise Impact Assessment Coffey Natural Systems
Heggies Pty Ltd Report Number 40-1530-R1 Revision 1
(40-1530 R1R1.doc) 15 January 2009 Page 1
1 INTRODUCTION
Heggies Pty Ltd has been commissioned by Coffey Natural Systems, on behalf of ExxonMobil, to conduct an environmental noise impact assessment for the proposed LNG and marine facilities and support infrastructure components of the Papua New Guinea Liquified Natural Gas Project (PNG LNG).
This report presents the results and findings of the noise assessment including noise impacts associated with construction and with operation of the proposed LNG Facilities.
The report presents:
A brief description of the overall project, in particular, the LNG Facilities; including site location and closest affected residential areas.
Some introductory information about the nature of noise.
A review of the existing ambient noise environment.
A review of meteorological data and its influence on noise propagation.
A review of relevant benchmarks for noise levels to determine appropriate standards during construction and operation of the project.
A comparison of preliminary predictions of noise levels against project noise standards.

PNG LNG Project LNG Facilities Environmental Noise Impact Assessment Coffey Natural Systems
Heggies Pty Ltd Report Number 40-1530-R1 Revision 1
(40-1530 R1R1.doc) 15 January 2009 Page 2
2 PROJECT DESCRIPTION
The Papua New Guinea Liquefied Natural Gas (PNG LNG) Project involves the development of a number of gas fields and facilities in a series of development phases to produce liquefied natural gas (LNG) for export. The development will also produce condensate. The development of the Hides, Angore, and Juha gas fields and blowdown of the gas caps at the existing Kutubu, Agogo and Gobe oil fields will supply the gas resources. An extensive onshore and offshore pipeline network will enable transportation of the gas to a new LNG Plant near Port Moresby and stabilised condensate to the existing oil processing and storage, and offloading facilities at the Kutubu Central Processing Facility and Kumul Marine Terminal respectively. Small amounts of condensate are also produced at the LNG Facilities site.
Esso Highlands Limited (Esso), a Papua New Guinea subsidiary of the Exxon Mobil Corporation (ExxonMobil), is the operator of the PNG LNG Project. The PNG LNG Project will be developed in five phases over a period of 10 years to ensure reliability and consistent quality of supply of LNG for over the 30 year life of the project.
This report addresses the LNG Facilities section of the project located at Portion 152 near Port Moresby. These include:
The receival of inlet feed gas (~1,000 MCFD) from a 34" offshore pipeline.
An LNG Plant which will process and liquefy approximately 6.3 Mtpa LNG using two 50% LNG trains.
LNG storage tanks.
An operations camp for the operating and maintenance personnel (approximately 500 people).
A deep–water jetty and loading platform to facilitate LNG export via tankers.
2.1 LNG Plant
The processes undertaken at the LNG Plant are contained process ‘trains’ and include:
Acid-gas removal (removal of CO2) and disposal.
Gas dehydration (water removal) and mercury removal.
Gas liquefaction and refrigeration using gas turbine compressors and air coolers.
Associated utilities at the LNG plant will include:
Power generation.
Fuel gas systems.
Heating and cooling systems.
Nitrogen production systems.
Fresh water and potable water systems.
Air system.
2.2 LNG Storage and Loading
LNG will be stored in two single containment tanks of 125,000 m3 with a loading rate of approximately 12,000 m3 /hour.

PNG LNG Project LNG Facilities Environmental Noise Impact Assessment Coffey Natural Systems
Heggies Pty Ltd Report Number 40-1530-R1 Revision 1
(40-1530 R1R1.doc) 15 January 2009 Page 3
The LNG Jetty will be a conventional piled access trestle offshore and earthen causeway out to approximately 8 m water depth with a total length of approximately 2.5 km. The trestle and causeway will support a range of facilities that could include an access way for vehicles, LNG and vapour return lines, condensate and all related utilities to the product loading platforms.
The LNG export berths will be sited at the end of the trestle in 14 to 15 m of water. The loading platform will consist of LNG loading and return vapour arms and LNG berthing facilities. A condensate export berth will be situated perpendicular to the trestle to the north. These are shown in Figure 1.
The jetty will incorporate a Materials Offloading Facility to facilitate construction of the LNG Facilities. The preliminary design of the materials offloading facility dock is an earthen causeway (approximately 500 m long) with a sheet-piled dock in 8 m of water capable of receiving 5,000 tonne barges.
2.3 LNG Offplot and LNG Offsite Facilities
LNG Offplot components of the LNG Facilities include:
Refrigerant storage and make-up system.
Wet and dry process flares and liquid blowdown.
LNG storage flare.
Firewater supply wells, reserve storage, and distribution systems.
Diesel fuel system.
LNG Offsite components of the LNG Facilities include:
A temporary camp for construction and contract personnel (approximately 7,500 people).
An operations camp for operating and maintenance personnel (approximately 500 people).
Waste and effluent collection/treatment system.
Administration and maintenance buildings associated with the LNG.
Helipad.
Upgrade of the existing road between the site and Port Moresby and a realignment of the existing Lea Lea road around the LNG Facility site.
A general layout of the LNG Facilities is presented in Figure 1.

PNG LNG Project LNG Facilities Environmental Noise Impact Assessment Coffey Natural Systems
Heggies Pty Ltd Report Number 40-1530-R1 Revision 1
(40-1530 R1R1.doc) 15 January 2009 Page 4
Figure 1 LNG Facilities- General Layout

PNG LNG Project LNG Facilities Environmental Noise Impact Assessment Coffey Natural Systems
Heggies Pty Ltd Report Number 40-1530-R1 Revision 1
(40-1530 R1R1.doc) 15 January 2009 Page 5
3 SITE DETAILS & OVERVIEW
3.1 Site Location
The LNG Facilities will be located within Portion 152, approximately 20 km northwest of Port Moresby on Caution Bay. The site is part of a gently undulating grassy coastal plain and is approximately 2.5km south of the village of Papa.
The coastal strip that contains the site is bordered approximately 7 km inland to the east by a small range of 200-300 m elevation.
Figure 2 shows the location of the site in relation to Port Moresby and nearby villages.
Figure 2 Location of LNG Facilities Site
3.2 Affected Receptors
3.2.1 Papa
The nearest potentially affected noise sensitive receptors are houses located on the southern outskirts of the village of Papa approximately 2.5 km to the north of the LNG Facilities. These houses are generally isolated with garden-style agricultural plots. The houses are generally of lightweight construction and made of fibro-cement sheet, timber weatherboard or tin and are often elevated on poles approximately 2 to 3 m high.
The centre of Papa is located close to the shore and includes a large and distinctive church. The population of Papa is approximately 1,000.

PNG LNG Project LNG Facilities Environmental Noise Impact Assessment Coffey Natural Systems
Heggies Pty Ltd Report Number 40-1530-R1 Revision 1
(40-1530 R1R1.doc) 15 January 2009 Page 6
3.2.2 Metago Bible College
The Metago Bible College community is located approximately 2 km to the west of Papa. The community consists of a dozen or more houses, a classroom, an open-air chapel and agricultural gardens. It has a population of approximately 100.
3.2.3 Boera
Approximately 5 km to the south of the LNG Facilities is the village of Boera. The village centre is on the beach, with a number of houses built out over the reef. The village has a school and isolated houses and garden-style agricultural plots extend to its north. The population of Boera is approximately 1,300.
The nearest potentially affected noise sensitive receptors are shown in Figure 3. The villages of Porebada and Lea Lea are at even greater distances from the LNG facility and will therefore receive lower noise levels than Boera and Papa respectively.
Figure 3 Proposed LNG Facilities and Surrounding Residential Communities

PNG LNG Project LNG Facilities Environmental Noise Impact Assessment Coffey Natural Systems
Heggies Pty Ltd Report Number 40-1530-R1 Revision 1
(40-1530 R1R1.doc) 15 January 2009 Page 7
4 NOISE FUNDAMENTALS
4.1 Noise
Hearing is a fundamental human sense and is used constantly for communication and awareness of the environment.
Noise is generally described as being ‘unwanted’ or ‘unfavourable’ sound and, to some extent, is an individual or subjective response as what may be sound to one person, may be regarded as noise by another.
The measurement and assessment of sound has been developed steadily over the last century, taking into account human response measures such as hearing damage and other potential health affects such as stress. Complex sound measurement and analytical devices have also been developed.
4.2 A-weighting and ‘dBA’
The overall level of a sound is usually expressed in terms of dBA, which is measured using the ‘A-weighting’ filter incorporated in sound level meters. These filters have a frequency response corresponding approximately to that of human hearing. People’s hearing is most sensitive to sounds at mid frequencies (typically 500 Hz to 4,000 Hz) and less sensitive at lower and higher frequencies. The level of a sound in dBA is a considered a good measure of the loudness of that sound. Different sources having the same dBA level generally sound about equally as loud, although the perceived loudness can also be affected by the character of the sound (e.g. the loudness of human speech and a distant motorbike may be perceived differently, although they can be of the same dBA level).
A change of up to 3 dBA in the level of a sound is difficult for most people to detect, whilst a 3 dBA to 5 dBA change corresponds to a small but noticeable change in loudness. A 10 dBA change corresponds to an approximate doubling or halving in loudness.
Table 1 presents examples of typical noise levels.
Table 1 Typical Noise Levels
Sound Pressure Level (dBA) Typical Source Subjective Evaluation
130 120 110
Threshold of pain Heavy rock concert Grinding on steel
Intolerable Extremely noisy
100 90
Loud car horn at 3 m Construction site with pneumatic hammering
Very noisy
80 70
Kerbside of busy street Loud radio or television
Loud
60 50
Department store General Office
Moderate to quiet
40 30
Inside private office Inside bedroom
Quiet to very quiet
20 Unoccupied recording studio Almost silent

PNG LNG Project LNG Facilities Environmental Noise Impact Assessment Coffey Natural Systems
Heggies Pty Ltd Report Number 40-1530-R1 Revision 1
(40-1530 R1R1.doc) 15 January 2009 Page 8
4.3 Statistical Noise Level Descriptors
As environmental noise usually varies in level over time, it is common to present the results of environmental noise testing in the form of statistical descriptors.
An explanation of noise level descriptors typically used for assessing the noise environment are illustrated in Figure 4 and described below.
LAmax The maximum A-weighted noise level associated with a noise measurement interval.
LA1 The noise level exceeded for 1% of a given measurement period. This parameter is often used to represent the typical maximum noise level in a given interval.
LA10 The A-weighted sound pressure level exceeded 10% of a given measurement interval and is utilised normally to characterise average maximum noise levels.
LAeq The A-weighted equivalent continuous sound level. It is defined as the steady sound level that contains the same amount of acoustical energy as a given time-varying sound over the same measurement interval. Can be loosely thought of as the ‘average’.
LA90 The A-weighted sound pressure level exceeded 90% of a given measurement interval and is representative of the average minimum sound level. Often used to describe the ‘background’ level.
Figure 4 Graphical Display of Typical Noise Indices

PNG LNG Project LNG Facilities Environmental Noise Impact Assessment Coffey Natural Systems
Heggies Pty Ltd Report Number 40-1530-R1 Revision 1
(40-1530 R1R1.doc) 15 January 2009 Page 9
4.4 Character
The A-weighted noise level alone is a simplistic parameter and may not be sufficient in providing a thorough assessment of noise. The subjective character of a sound is also a significant parameter that needs to be considered.
Some basic characteristics of sound which can make a sound more or less intrusive include:
The frequency content of a sound – i.e. low frequency sound such as exhaust noise or high frequency sound such as birds or insects,
the ‘tonality’ of a sound – i.e. sound contains one or more prominent tones such as a horn or a whistle,
the ‘impulsiveness’ of a sound – i.e. hammering, dog barking or a intermittently operating power saw.
The above parameters can usually be indicatively subjectively assessed, but more thorough assessment can be made with advanced sound measuring devices (i.e. narrow band or one-third octave analysis). Many noise policies provide an assessment method which applies penalties to sounds that exhibit particular characteristics such as the above.

PNG LNG Project LNG Facilities Environmental Noise Impact Assessment Coffey Natural Systems
Heggies Pty Ltd Report Number 40-1530-R1 Revision 1
(40-1530 R1R1.doc) 15 January 2009 Page 10
5 EXISTING NOISE AND METEOROLOGICAL ENVIRONMENT
5.1 Noise Environment
Fundamental to the noise assessment is determining the existing noise climate in the survey area.
Noise monitoring was conducted at a total of three locations close to the proposed LNG project site during April and May 2008 to determine and characterise existing ambient noise levels.
The selected monitoring sites were;
Metago Bible College - approximately 2.4 km north-northeast of the proposed LNG Facilities Site
Papa Village, approximately 2.6 km north-northwest of the proposed LNG Facilities Site
Boera Village, approximately 4.5 km south of the proposed LNG Facilities Site
These locations give a good representation of the village areas nearest the proposed LNG Facilities. Photographs taken at each of the monitoring sites are depicted in Figure 5 to 7. All measurements were conducted with Acoustic Research Laboratories ARL Type 316 noise loggers which were set to log 15 minute statistical intervals, including L1, L10, L90 and Leq noise level descriptors.
All acoustic instrumentation employed throughout the monitoring programme complied with the requirements of Australian Standard 1259.2:1990 – Sound Level Meters and carried current NATA or manufacturer calibration certificates. Instrument calibration was checked before and after each measurement survey, with the variation in calibrated levels not exceeding ±0.5 dBA.
Details regarding the location and equipment details for each receiver are provided in Table 2.

PNG LNG Project LNG Facilities Environmental Noise Impact Assessment Coffey Natural Systems
Heggies Pty Ltd Report Number 40-1530-R1 Revision 1
(40-1530 R1R1.doc) 15 January 2009 Page 11
Table 2 Noise Monitoring Locations
Location Description of Location and
GPS Coordinates
Measurement Period Logger Details
BG1 Metago Bible College
20 m east of open air chapel in village
GPS 0503095, 8970522
1230 h 30 April 2008 to 1430 h 1 May 2008.
S/N 16-306-040
BG2 – Papa Base of pole house on northeast corner
GPS 0500786, 8970378
1300 h 30 April 2008 to 1600 h 5 May 2008.
S/N 16-306-044
BG3 – Boera Base of pole house on southeast corner
GPS 0502286, 8962724
1430 h 30 April 2008 to 0730 h 3 May 2008.
S/N 16-306-042
Figure 5 Noise monitoring at Location BG 1 Metago Bible College

PNG LNG Project LNG Facilities Environmental Noise Impact Assessment Coffey Natural Systems
Heggies Pty Ltd Report Number 40-1530-R1 Revision 1
(40-1530 R1R1.doc) 15 January 2009 Page 12
Figure 6 Noise monitoring at Location BG 2 – Papa Village
Figure 7 Noise monitoring at Location BG 3 – Boera Village

PNG LNG Project LNG Facilities Environmental Noise Impact Assessment Coffey Natural Systems
Heggies Pty Ltd Report Number 40-1530-R1 Revision 1
(40-1530 R1R1.doc) 15 January 2009 Page 13
5.2 Noise Monitoring Results
The results of all noise monitoring are provided in Appendix A.
Table 3 presents a general summary of the average LA90 background noise levels for day, evening and night periods together with the associated average LA10 and LAeq noise levels.
Table 3 Summary of Ambient and Background Noise Levels
Ambient Noise Level, dBA
Day (07:00h to 18:00h)
Evening (18:00h to 22:00h)
Night (18:00h to 22:00h)
Location
L901 L101 Leq2 L901 L101 Leq2 L901 L101 Leq2
BG1, Papa 30 42 53 45 49 63 46 50 52
BG2, Papa 32 43 50 41 46 50 43 48 48
BG3, Boera 42 52 62 49 56 53 46 49 48
1. L10 & L90 levels are the arithmetic average of the 15 minute data for each day / evening / night. 2. Leq levels are Leq of selected period, logarithmically averaged over all days measured.
The results at all monitoring sites indicate that evening and night-time background noise levels are higher than during the day time.
In order to supplement the unattended logger measurements and to assist in identifying the source and character of ambient noise sources, operator-attended daytime surveys were also conducted at all background noise monitoring sites. The operator-attended surveys and results are summarised in Table 4.
The noise environment at all monitoring locations was generally similar in character, with the main noise sources being natural sources such as wind noise in foliage, insects, birds, periods of heavy rain and domesticated animals, together with typical village activities. Infrequent aircraft flyovers were also observed.
Night-time attended noise surveys were not possible so, in order to characterise the night period noise environment at locations BG2 and BG3, a digital audio recorder was deployed alongside the noise logger. This enabled us to identify particular sources of noise and assist with post-measurement analysis.
Playback of the recordings taken during the night period indicated that insect noise dominates the ambient noise environment.
We surmise that high insect noise levels are a common feature of the ambient environment all year round as the tropical nature of the climate results in little variation in temperature from season to season. Discussions with the project biodiversity specialist (Francis Crome) confirm that whilst the prevalence and activity of individual insect species may vary slightly throughout the year, there is generally a consistently high level of insect activity all year round.

PNG LNG Project LNG Facilities Environmental Noise Impact Assessment Coffey Natural Systems
Heggies Pty Ltd Report Number 40-1530-R1 Revision 1
(40-1530 R1R1.doc) 15 January 2009 Page 14
Table 4 Operator-Attended Ambient Noise Environment (dBA re 20 µPa)
Primary Noise Descriptor
(dBA re 20 µPa) Location Date Start Time Weather
Measurement Description
LAmax LA10 LA90 LAeq
Description of Noise Emission and Typical Maximum Levels LAmax – dBA
BG1
30/04/08 11:50 a.m. partly cloudy W= 1m/s SE Temp=32oC
Ambient 60 45 36 39
Breeze in grass & trees + birds & insects + distant talking = 36 to 40
Occasional plane at altitude 50 to 60
BG2
30/04/08 12:50 p.m. partly cloudy W= 1m/s SE Temp=32oC
Ambient 50 38 30 35
Breeze in trees+ bird calls & insects+ some distant talking = 30 to 39
Rattling tins on fence
BG3
30/04/08 2:30 p.m.
partly cloudy W=2-3m/s SSE Temp=31oC
Ambient 55 47 44 46
Breeze in trees+ bird calls & insects+ some talking+ = 43 to 45
Occasional distant village (singing, hammering)

PNG LNG Project LNG Facilities Environmental Noise Impact Assessment Coffey Natural Systems
Heggies Pty Ltd Report Number 40-1530-R1 Revision 1
(40-1530 R1R1.doc) 15 January 2009 Page 15
5.3 Meteorological Environment
5.3.1 Prevailing Wind
Wind that is light, stable and blowing towards the receiver from the source of noise has the potential to increase noise levels. For this reason, the effect of wind should be considered when it features in the project region.
As the strength of the wind increases, noise produced by wind will obscure noise from most industrial and transport sources. Winds are therefore generally only considered to be noise-enhancing up to 3 m/s.
A commonly implemented method for assessing meteorological effects and prevailing conditions is presented by the NSW EPA Industrial Noise Policy (2000), as used during the PNG Gas Project, which states:
Wind effects need to be assessed where wind is a feature of the area. Wind is considered to be a feature where source to receiver wind speeds (at 10 m height) of 3 m/s or below occur for 30 percent of the time or more in any assessment period in any season.
An assessment of existing wind conditions has been prepared from meteorological data produced by Holmes Air Sciences using the CSIRO’s TAPM model using data for 2006. The dominant seasonal wind speeds and directions are presented in Appendix B for day (7.00 a.m. to 6.00 p.m.), evening (6.00 p.m. to 10.00 p.m.) and night (10.00 p.m. to 7.00 a.m.) periods.
The prevailing winds with velocities less than or equal to 3 m/s with a frequency greater than or equal to 30% are considered relevant to the site in accordance with the NSW industrial noise policy and are shown in Table 5.
Table 5 Project Prevailing Wind Conditions in Accordance with the NSW Industrial Noise Policy
Winds ± 45o ≤3 m/s with a Frequency of Occurrence ≥30% Season
Daytime Evening Night-time
Annual Nil Nil Nil
Summer Nil Nil NE, ENE
Autumn Nil Nil NE, ENE, ESE
Winter Nil Nil Nil
Spring Nil Nil Nil
The analysis shows that wind conditions in the region with the ability to enhance noise propagation are a prevailing feature of the area during the night period of summer and autumn.
Enhancement due to wind has been included as a part of this comprehensive assessment as a ‘worst-case’ situation which assumes a steady 3 m/s wind blows in the direction of the receiver from each source. This simulates downwind propagation for all receivers.
5.3.2 Temperature Inversions
Temperature inversions, when they occur, have the ability to increase noise levels by focusing sound waves. Temperature inversions occur predominantly at night during the winter months.
The NSW Industrial Noise Policy (2000) Section 5.2, Temperature Inversions, states:
PNG LNG Project LNG Facilities Environmental Noise Impact Assessment Coffey Natural Systems
Heggies Pty Ltd Report Number 40-1530-R1 Revision 1
(40-1530 R1R1.doc) 15 January 2009 Page 16
Assessment of impacts is confined to the night noise assessment period (10.00 pm to 7.00 am), as this is the time likely to have the greatest impact – that is, when temperature inversions usually occur and disturbance to sleep is possible.
Where inversion conditions are predicted for at least 30% (or approximately two nights per week) of total night-time in winter, then inversion effects are considered to be significant and should be taken into account in the noise assessment.
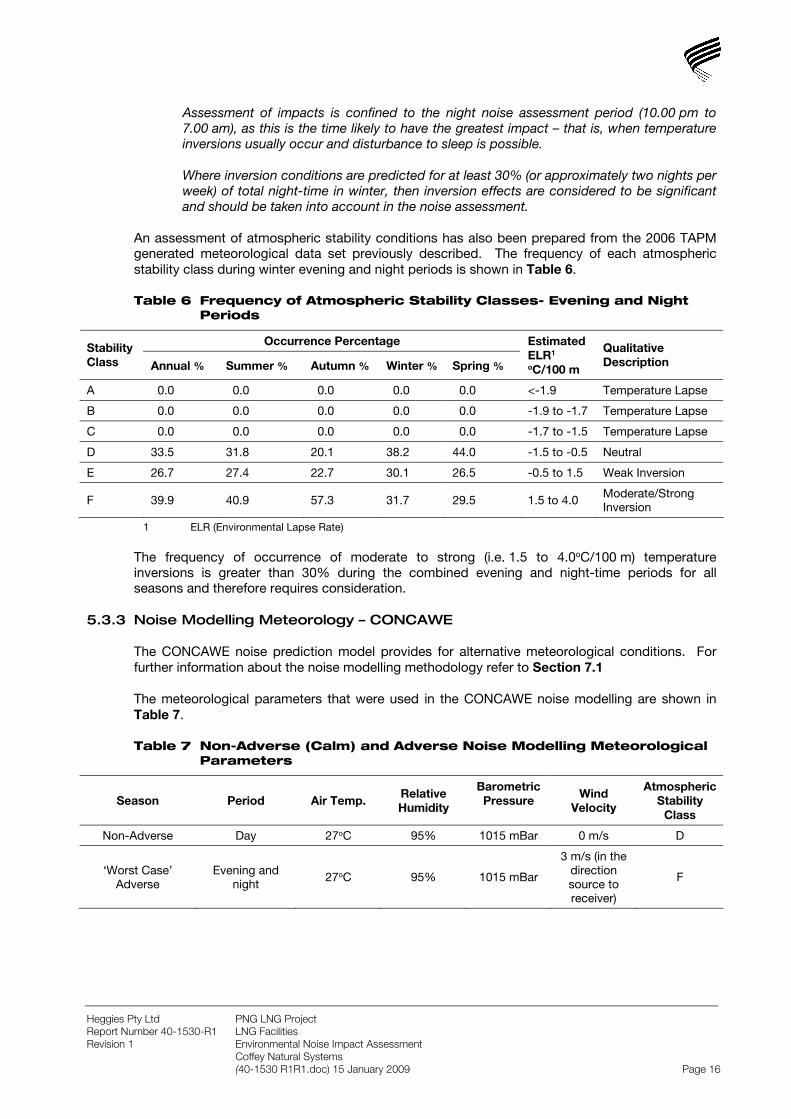
An assessment of atmospheric stability conditions has also been prepared from the 2006 TAPM generated meteorological data set previously described. The frequency of each atmospheric stability class during winter evening and night periods is shown in Table 6.
Table 6 Frequency of Atmospheric Stability Classes- Evening and Night Periods
Occurrence Percentage Stability Class Annual % Summer % Autumn % Winter % Spring %
Estimated ELR1 oC/100 m
Qualitative Description
A 0.0 0.0 0.0 0.0 0.0 <-1.9 Temperature Lapse
B 0.0 0.0 0.0 0.0 0.0 -1.9 to -1.7 Temperature Lapse
C 0.0 0.0 0.0 0.0 0.0 -1.7 to -1.5 Temperature Lapse
D 33.5 31.8 20.1 38.2 44.0 -1.5 to -0.5 Neutral
E 26.7 27.4 22.7 30.1 26.5 -0.5 to 1.5 Weak Inversion
F 39.9 40.9 57.3 31.7 29.5 1.5 to 4.0 Moderate/Strong Inversion
1 ELR (Environmental Lapse Rate)
The frequency of occurrence of moderate to strong (i.e. 1.5 to 4.0oC/100 m) temperature inversions is greater than 30% during the combined evening and night-time periods for all seasons and therefore requires consideration.
5.3.3 Noise Modelling Meteorology – CONCAWE
The CONCAWE noise prediction model provides for alternative meteorological conditions. For further information about the noise modelling methodology refer to Section 7.1
The meteorological parameters that were used in the CONCAWE noise modelling are shown in Table 7.
Table 7 Non-Adverse (Calm) and Adverse Noise Modelling Meteorological Parameters
Season Period Air Temp. Relative Humidity
Barometric Pressure Wind
Velocity
Atmospheric Stability
Class
Non-Adverse Day 27oC 95% 1015 mBar 0 m/s D
‘Worst Case’ Adverse
Evening and night
27oC 95% 1015 mBar
3 m/s (in the direction source to receiver)
F

PNG LNG Project LNG Facilities Environmental Noise Impact Assessment Coffey Natural Systems
Heggies Pty Ltd Report Number 40-1530-R1 Revision 1
(40-1530 R1R1.doc) 15 January 2009 Page 17
6 ENVIRONMENTAL NOISE STANDARDS
There are currently no known government policies or guidelines for environmental noise in Papua New Guinea.
The primary objective of any environmental noise assessment or policy is to protect people from the adverse affects of noise. Excessive noise has the ability to cause nuisance, including sleep deprivation, stress and increased blood pressure, as well as other physical, physiological and psychological affects.
In addition, any noise policy also has to allow for businesses and industries to be able to operate without having to comply with unnecessarily stringent requirements.
Many countries around the world have developed their own noise policies to protect residents and to provide some protection for industries (by, for example, nominating land use zonings or buffer zones which allow higher noise levels in particular areas). The policies are typically developed based on previous studies and experience within those countries (and are often based on statistical analysis of community reaction to various levels of noise), or by reference to studies undertaken elsewhere around the world.
There are two international documents that provide indicative noise assessment criteria and which provide some guidance for this assessment, being the World Health Organisation (WHO) Guidelines for Community Noise and the International Finance Corporation (IFC) (World Bank) Noise Management Guidelines. The criteria presented in these documents are based on numerous historical studies and, ultimately, are similar to many criteria developed in Australia and other developed countries.
6.1 WHO Guidelines for Community Noise
The WHO Guidelines for Community Noise provide detailed background information and cover various noise related issues such as hearing impairment (occupational noise), sleep disturbance, cardiovascular and physiological affects.
Recommendations from the WHO Guidelines relevant to the PNG LNG Project are provided below.
6.1.1 Night Period – Sleep Disturbance
The WHO Guidelines generally prescribe two noise levels at residential locations to ensure that sleep is not adversely affected, being;-
Up to 30 dBA for continuous noise.
Up to 45 dBA for single events (maximums).
These levels are at the person’s ear (i.e. typically within the residential building) and the Guidelines suggest that a building insertion loss correction of 15 dBA is applied to determine the equivalent external criteria for a typical house with the windows slightly open. Given the general lightweight construction of houses around the project area and considerable number of openings in most façades, a more appropriate building insertion loss correction for PNG is considered to be 10 dBA. Consequently, an appropriate external noise limit for continuous noise is 40 dBA.
The Guidelines also note that special attention should be given to the following considerations when investigating sleep disturbance:
a. Noise sources in an environment with a low background noise level. For example, night traffic in suburban residential areas.

PNG LNG Project LNG Facilities Environmental Noise Impact Assessment Coffey Natural Systems
Heggies Pty Ltd Report Number 40-1530-R1 Revision 1
(40-1530 R1R1.doc) 15 January 2009 Page 18
b. Environments where a combination of noise and vibrations are produced. For example, railway noise or heavy duty road vehicles.
c. Sources with low-frequency components. Disturbances may occur even though the sound pressure level during exposure is below 30 dBA.
6.1.2 Day Period
The WHO Guidelines recommend day period noise levels as follows:
55 dBA Leq to ‘protect the majority of people from being seriously annoyed’;
50 dBA Leq to ‘protect the majority of people from being moderately annoyed’.
In addition, the Guidelines nominate an internal noise level inside dwellings of 35 dBA Leq for the purpose of allowing good speech communications.
6.1.3 Impulsive Noise Sources
Blasting can cause high instantaneous sound levels.
The primary concern regarding blasting is that it should not cause damage to hearing. Studies presented in the WHO Guidelines prescribe the following limits for sources such as blasts:
140 dB peak for adults.
120 dB peak for children.
The above levels are those recommended to ensure that the potential for hearing damage is minimised.
Similarly, in Australia, the most common criteria for blasting is a peak level no greater than 115 dB, but with allowance for a small percentage to be up to 120 dB at the receptor.
6.2 IFC / World Bank Noise Management Guidelines
These guidelines prescribe noise levels for the day and night periods. The following is an extract:
Noise impacts should not exceed the levels presented in Table 1.7.1, or result in a maximum increase in background levels of 3 dB at the nearest receptor location off-site.
Table 1.7.1 Noise Level Guidelines
One Hour LAeq (dBA) Receptor
Day (0700-2200) Night (2200-0700) Residential / Institutional /educational 55 45
Industrial / Commercial 70 70
Highly intrusive noises, such as noise from aircraft flyovers and passing trains, should not be included when establishing background noise level.
The noise levels presented in the Table above are referenced as coming from the WHO Guidelines detailed in Section 6.1.

PNG LNG Project LNG Facilities Environmental Noise Impact Assessment Coffey Natural Systems
Heggies Pty Ltd Report Number 40-1530-R1 Revision 1
(40-1530 R1R1.doc) 15 January 2009 Page 19
We note that for a generally quiet rural area, the ‘background + 3 dBA’ limit would be the limiting criteria. The intent of this criterion is somewhat open to interpretation and the IFC document refers to the use of a trained specialist for determining appropriate measurement parameters.
It is considered that a reasonable interpretation of the IFC Guidelines’ requirement of ‘should not result in a maximum increase in background levels of 3 dB’ is that future plant noise LAeq
imissions1 should not be more than 3 dB greater than the existing background noise level, determined as an arithmetic average of the LA90 statistics for the night period.
This interpretation:
Facilitates assessment for predicted LAeq levels. LA90 imissions3 from plant would not be able to be predicted; however, we anticipate that, over the propagation distances involved for this project, they would be at least 3 to 5 dBA lower than LAeq imission3 levels.
Would result in compliance with the original IFC Guideline objective. If plant noise LAeq
imissions3 are limited to up to 3 dB greater than the existing background LA90 noise level then we would anticipate that LA90 imissions3 from plant would be of approximately the same magnitude or less than existing background LA90 levels. This would generally result in the combined ambient level measured LA90 (plant + background) being no more than 3 dB greater than the pre-existing (no plant) level.
Will protect the acoustic amenity in the critical night period, where ambient background levels are low.
6.3 Australian Criteria
Most states of Australia have thorough guidelines and policies in place for the assessment of environmental noise. A thorough review of them is not appropriate in this report; although, generally speaking, they all adopt a ‘background +’ criterion in most circumstances to determine if noise is intrusive. The measurement intervals and statistical analysis methods slightly differ between states and there is some consideration of land use zoning, but typically, for the critical night period, the noise limits are in the order of ‘background + 3 to 5 dBA’, and are based on averaging of background noise levels for the specific period being investigated (night period from 10.00 p.m. to 7.00 a.m., day from 7.00 a.m. to 6.00 p.m., evening 6.00 p.m. to 10.00 p.m.).
In addition, some policies nominate a ‘minimum’ noise limit for extremely quiet rural areas, when background noise levels are found to be particularly low. Two such criteria for night period operations are:
32 dBA in Victoria.
35 dBA in New South Wales.
The above criteria are external to buildings.
Day period criteria are typically in the order of 10 to 15 dBA higher than the night period, as there is less potential for disturbance during the day, and generally higher levels of local activity (and higher background noise levels).
6.4 Construction Noise
Construction noise is generally dealt with separately from operational noise. Regulatory authorities in Australia provide guidelines that provide provisions for:
Adopting ‘good industry practice’ to avoid unnecessary impacts by ensuring all reasonable and practicable measures are taken to minimise noise resulting from the activity
1 immission level is noise level from plant at the receiver

PNG LNG Project LNG Facilities Environmental Noise Impact Assessment Coffey Natural Systems
Heggies Pty Ltd Report Number 40-1530-R1 Revision 1
(40-1530 R1R1.doc) 15 January 2009 Page 20
Limiting the hours of construction to standard daytime hours
Practical noise limits for construction activities occurring during the day period. For construction projects that are short in duration (i.e. less than 1 month, less than 6 months) it is generally acceptable to have elevated noise limits. For extended construction periods (i.e. greater than 6 months) the appropriate noise limit would be consistent with standard operational noise limits.
For construction outside standard ‘daytime’ hours, such as night works, noise should be generally inaudible at residential locations or comply with standard operational noise limits.
6.5 Blasting
The ground vibration and airblast levels that cause concern or discomfort to residents are generally lower than the relevant building damage limits. Australian state EPAs advocate the use of the Australian and New Zealand Environment Conservation Council’s (ANZECC) Technical basis for guidelines to minimise annoyance due to blasting overpressure and ground vibration, (ANZECC guidelines).
The ANZECC guidelines for control of blasting impact at residences are as follows:
The recommended maximum level for airblast is 115 dB Linear. The level of 115 dB Linear may be exceeded on up to 5% of the total number of blasts over a period of 12 months. The level should not exceed 120 dB Linear at any time.
The recommended maximum for ground vibration is 5 mm/s, Peak Vector Sum (PVS) vibration velocity. It is recommended, however, that 2 mm/s (PVS) be considered as the long-term regulatory goal for the control of ground vibration. The PVS level of 5 mm/s may be exceeded on up to 5% of the total number of blasts over a period of 12 months. The level should not exceed 10 mm/s at any time.
Blasting should generally only be permitted between the hours of 9.00 a.m. to 5.00 p.m. Monday to Saturday. Blasting should not take place on Sundays and public holidays.
Blasting should generally take place no more than once per day.
The Australian Standard 2187.2:1993 Explosives --- Storage, Transport and Use. Part 2: Use of Explosives does not present human comfort criteria for ground vibration from blasting. It does, however, make mention of human comfort level for airblast in saying ‘a limit of 120 dB for human comfort is commonly used’. This is consistent with the ANZECC guidelines. AS 2187.2:1993 nominates building damage assessment criteria as presented in Table 8.
Table 8 Blast Emission Building Damage Assessment Criteria (AS 2187)
Building type Vibration level Airblast level
Sensitive (and heritage) PVS 5 mm/s 133 dB(Linear) Peak
Residential PVS 10 mm/s 133 dB(Linear) Peak
Commercial/industrial PVS 25 mm/s 133 dB(Linear) Peak
6.6 Transportation Noise
The Port Moresby to Lea Lea road is likely to carry increased traffic during both construction and operation of the project.
Road traffic generated by the project during construction and operation will lead to increased noise and has the potential to impact residential communities along the transportation route. It can be the cause of discomfort, sleep disorders, disruption to normal activities and communication. Essentially, noise becomes a problem when residential communities are exposed to levels that exceed acceptable limits over extended periods of time.

PNG LNG Project LNG Facilities Environmental Noise Impact Assessment Coffey Natural Systems
Heggies Pty Ltd Report Number 40-1530-R1 Revision 1
(40-1530 R1R1.doc) 15 January 2009 Page 21
Based on the NSW Department of Environment and Climate Change (formerly NSW EPA) Environmental Criteria for Road Traffic Noise policy (NSW DECC 1999), the Port Moresby to Lea Lea road would be classified as a ‘collector road’, which connects the sub-arterial roads to the local road system in developed areas. The applicable noise criteria are presented in Table 9.
Table 9 NSW EPA Environmental Criteria for Road Traffic Noise
Road Policy Descriptor Traffic Noise Goal
Daytime LAeq(1hr) 60 dBA Port Moresby to Lea Lea Road
Land use developments with the potential to create additional traffic on existing collector roads. Night-time LAeq(1hr) 55 dBA
Note: in all cases (where the nominated criteria are already exceeded), traffic associated with the development should not lead to an increase in the existing noise traffic levels of more than 2 dBA.
6.7 Boundary Noise Target
ExxonMobil has produced a noise philosophy document for the project which has the purpose of guiding design and detailed engineering to ensure suitable noise outcomes for the project with respect to;
In-plant sound levels and occupational noise management and hearing protection.
Designing appropriate sound levels for noise sensitive spaces within the facility such as control rooms, workshops, muster areas and accommodation areas.
Developing noise performance specifications for equipment.
Limiting noise impacts to potential community areas outside the facility. The approach proposed is to consider the proximity of any dwellings to the facility, with consideration of the potential for local communities to build new residences at the project fence lines.
With respect to this last objective it is appropriate to consider the IFC guideline noise limits of 55 dBA during the day and 45 dBA at night.
Consideration of the pre-existing background noise level in this circumstance is not deemed necessary as currently the area adjacent to the proposed onshore lease boundary fence is uninhabited and should people choose to move closer to the facility the background noise of the area would already be dominated by the facility. The IFC guideline limits at the boundary would ensure a reasonable level of amenity for any newly developed community close to the facility and protect them against adverse impacts.
The boundary noise target would provide a similar acoustic environment to that of the worker accommodation area.
6.8 Other Considerations
There are additional social and economic considerations which are relevant to setting noise criteria and assessment methods.
The nuisance caused by noise is also dependent on a community’s relationship with the noise source. For example, an industry that provides some form of social or economic benefit to a community may not be considered a nuisance by locals even when compared to most standards it can be shown that the noise level is considered high.
While it is very difficult to provide a measure or ‘adjustment’ to a noise limit based on the above, some consideration needs to be given to this.

PNG LNG Project LNG Facilities Environmental Noise Impact Assessment Coffey Natural Systems
Heggies Pty Ltd Report Number 40-1530-R1 Revision 1
(40-1530 R1R1.doc) 15 January 2009 Page 22
6.9 Recommended Project Noise Criteria
With reference to the guidelines and consideration presented in Sections 6.1to 6.8, a summary of possible criteria for various activities associated with the LNG Facilities’ operations is presented in Table 10.
Table 10 Recommended Project Noise Criteria
Activity / Operation Recommended Noise Criteria (external) Comment
Day / Evening
(7.00 a.m. to 10.00 p.m.)
Night
(10.00 p.m to 7.00 a.m.)
General Operational Noise 50 dBA Leq1 Lower of
Average night background level (L90) + 3 dBA2
or
40 dBA Leq3
The night limit will be defined as 40 dBA after consideration of existing background levels (see Section 5.2).
Construction Noise
50 dBA Leq 40 dBA Leq The length of construction period is significant and accordingly construction noise limits are equivalent to operational noise limits.
Blasting Typically 115 dB but up to 120 dB Peak if small percentage
Inaudible Generally not considered appropriate to allow any night period blasting.
Single Events (traffic pass-bys on roads etc.)
No criteria suggested but 60 dBA Lmax would be reasonable design goal
45 dBA Lmax Primarily concerned with sleep disturbance for night period.
Boundary Noise Target 55 dBA Leq4 45 dBA Leq4 Pre-existing background noise limit on boundary not relevant (see discussion in Section 6.7).
1 50 dBA based on the WHO Guidelines recommended day period to ‘protect the majority of people from being moderately annoyed’. Whilst this criteria is 5 dBA more conservative than limit presented in Table 1.7.1. of the IFC requirements it is deemed a more appropriate long-term limit.
2 Based on IFC requirement to not ‘result in a maximum increase in background levels of 3 dB at the nearest receptor location off-site’.
3 40 dBA based on WHO sleep disturbance criteria of 30 dBA for continuous noise with 10 dBA allowance for building insertion loss correction.
4 Based on IFC guidelines.

PNG LNG Project LNG Facilities Environmental Noise Impact Assessment Coffey Natural Systems
Heggies Pty Ltd Report Number 40-1530-R1 Revision 1
(40-1530 R1R1.doc) 15 January 2009 Page 23
7 NOISE MODELLING METHOD
7.1 Introduction
Noise modelling of construction activities and operations of the LNG facility was completed using the CONCAWE (Conservation of Clean Air and Water Europe) noise prediction method incorporated in the ‘SoundPLAN’ noise modelling program.
The CONCAWE method is a research paper especially designed and originally developed for the requirements of large facilities, specifically petrochemical complexes, in Europe. It was published in 1981 under the title, The propagation of noise from petroleum and petrochemical complexes to neighbouring communities. This method was selected due to the capability of modelling meteorological effects on noise propagation over large distances.
The SoundPLAN noise modelling program uses the following information to predict noise levels at nearby receivers:
Three-dimensional digital terrain map of site and surrounding area.
Frequency-based sound power level noise data for plant and equipment operating at the site.
Intervening ground cover.
Shielding by barriers, intervening buildings or topography.
Atmospheric conditions.
7.2 Construction Noise
Construction activities at the LNG Facilities will consist of two primary components: the LNG Jetty/MOF and LNG Plant and, associated utilities, offsites and accommodation facilities.
Construction will include the following stages:
Site preparation and civil works (marine facilities).
Construction of the earth causeway and Materials Offloading Facility.
Site preparation and civil works (LNG Plant).
Construction of the LNG processing facilities.
Construction of LNG Plant and LNG Offsites.
Construction of the earth causeway and LNG Jetty.
Commissioning.
It is anticipated that this construction of the LNG Facilities will take approximately four years.
7.2.1 Site Preparation and Civil Works
Site preparation includes significant noise-producing activities such as:
Vegetation clearance and timber removal using equipment such as chainsaws and bulldozers.
Topsoil removal using equipment such as bulldozers and scrapers.
Earthworks using equipment such as front-end loaders, backhoes, graders, rollers, dump trucks and water carts.
PNG LNG Project LNG Facilities Environmental Noise Impact Assessment Coffey Natural Systems
Heggies Pty Ltd Report Number 40-1530-R1 Revision 1
(40-1530 R1R1.doc) 15 January 2009 Page 24
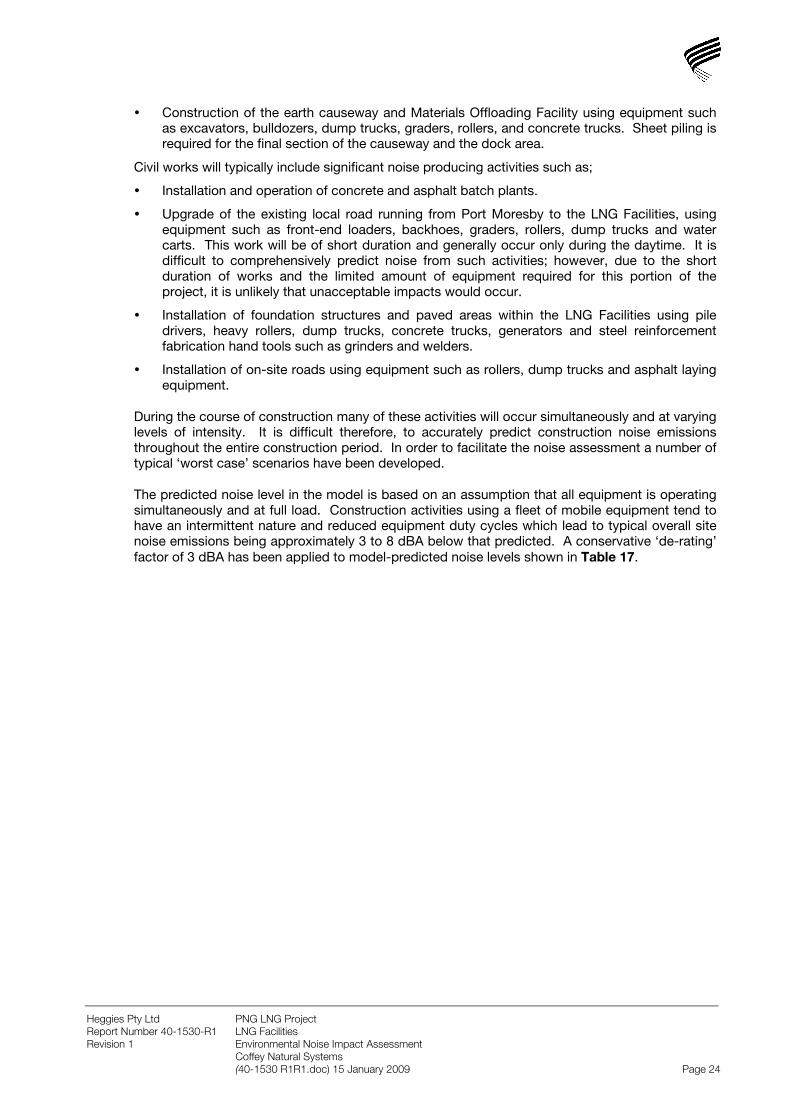
Construction of the earth causeway and Materials Offloading Facility using equipment such as excavators, bulldozers, dump trucks, graders, rollers, and concrete trucks. Sheet piling is required for the final section of the causeway and the dock area.
Civil works will typically include significant noise producing activities such as;
Installation and operation of concrete and asphalt batch plants.
Upgrade of the existing local road running from Port Moresby to the LNG Facilities, using equipment such as front-end loaders, backhoes, graders, rollers, dump trucks and water carts. This work will be of short duration and generally occur only during the daytime. It is difficult to comprehensively predict noise from such activities; however, due to the short duration of works and the limited amount of equipment required for this portion of the project, it is unlikely that unacceptable impacts would occur.
Installation of foundation structures and paved areas within the LNG Facilities using pile drivers, heavy rollers, dump trucks, concrete trucks, generators and steel reinforcement fabrication hand tools such as grinders and welders.
Installation of on-site roads using equipment such as rollers, dump trucks and asphalt laying equipment.
During the course of construction many of these activities will occur simultaneously and at varying levels of intensity. It is difficult therefore, to accurately predict construction noise emissions throughout the entire construction period. In order to facilitate the noise assessment a number of typical ‘worst case’ scenarios have been developed.
The predicted noise level in the model is based on an assumption that all equipment is operating simultaneously and at full load. Construction activities using a fleet of mobile equipment tend to have an intermittent nature and reduced equipment duty cycles which lead to typical overall site noise emissions being approximately 3 to 8 dBA below that predicted. A conservative ‘de-rating’ factor of 3 dBA has been applied to model-predicted noise levels shown in Table 17.

PNG LNG Project LNG Facilities Environmental Noise Impact Assessment Coffey Natural Systems
Heggies Pty Ltd Report Number 40-1530-R1 Revision 1
(40-1530 R1R1.doc) 15 January 2009 Page 25
A site preparation scenario assumes the activities of topsoil removal and earthworks with the equipment shown in Table 11 operating simultaneously.
Table 11 Site Preparation Scenario – Equipment List
Equipment Sound Power Level
dBA re: 10-12 W
Number of items
Approximate location
Chainsaws 114 1 LNG Facilities area
Bulldozer small 114 1 LNG Facilities area
Bulldozer large 116 1 LNG Facilities area
Scraper 113 1 LNG Facilities area
Grader 110 1 LNG Facilities area
Front-end loader / Backhoe 108 2 LNG Facilities area
Roller 106 1 LNG Facilities area
Dump truck 115 3 LNG Facilities area
Water cart 100 1 LNG Facilities area
General 4WD vehicles 80 3 LNG Facilities area
Dump trucks 115 2 Materials Offloading Facility
Excavator large 110 2 Materials Offloading Facility
Bulldozer small 114 1 Materials Offloading Facility
roller 112 1 Materials Offloading Facility
Sheet pile driver 122 1 Materials Offloading Facility
General 4WD vehicles 80 2 Materials Offloading Facility
The civil works scenario assumes that the equipment shown in Table 12 will be operating simultaneously.
Table 12 Civil Works Scenario – Equipment List
Equipment Sound Power Level
dBA re: 10-12 W
Number of items Approximate location
Pile driver 122 1 LNG storage tank area
Roller 106 2 LNG Facilities area
Concrete batch plant 111 1 LNG Facilities area
Asphalt batch plant 111 1 LNG Facilities area
Concrete mixer truck 110 3 LNG Facilities area
Concrete pump and vibrator 112 2 LNG Facilities area
Grinders 111 3 LNG Facilities area
Generator and welder 105 3 LNG Facilities area
General 4WD vehicles 80 5 LNG Facilities area
7.2.2 Construction of the LNG Processing Facilities, Plant Utilities and Offsites
Construction of the LNG processing facilities and utilities will include noise-producing activities such as:
Receipt and transportation of large plant items from Materials Offloading Facility to the LNG Facilities site using equipment such as tugs and barges, offloading crawler cranes and heavy transport equipment.

PNG LNG Project LNG Facilities Environmental Noise Impact Assessment Coffey Natural Systems
Heggies Pty Ltd Report Number 40-1530-R1 Revision 1
(40-1530 R1R1.doc) 15 January 2009 Page 26
Onsite steel fabrication and pipe erection using equipment such as tower cranes, grinders, welders, generators, air compressors and tools.
Erection and assembly of plant items using equipment such as tower cranes, forklifts, gensets, air compressors and tools.
Construction of the permanent accommodation village.
Construction of the trestle construction LNG Jetty which would typically require equipment such as pile driving and crawler cranes. Initial piling, using a modified crane, will occur from the earthen causeway then move to a jack-up barge.
The LNG Facilities construction scenario assumes activities including the Material Offloading Facility equipment receipt, on-site steel fabrication, plant assembly and erection, together with village construction, occurs with the equipment shown in Table 13 operating simultaneously.
Table 13 Construction of the LNG Facilities and LNG Jetty Scenario – Equipment List
Equipment Sound Power Level
dBA re: 10-12 W
Number of items Approximate location
Crawler crane 111 1 MOF
Heavy transport 105 1 MOF
Tower crane 110 1 LNG Facilities area
Welder and generator 105 3 LNG Facilities area
Grinder 110 3 LNG Facilities area
Air compressor 106 3 LNG Facilities area
Forklift 95 2 LNG Facilities area
Hammering 107 10 Accommodation village
Flat bed truck 114 2 LNG Facilities area
General 4WD vehicles 80 5 LNG Facilities area
Piling from barge 118 1 LNG Jetty
Crawler crane from barge 113 1 LNG Jetty
7.3 Operational Noise
LNG Facilities operations comprise a large number of processes, activities and equipment which produce noise. Significant noise sources are located within the LNG processing and utilities areas, the LNG Jetty and harbour area and the flare area.
The operational duty cycles of each item of equipment are wide-ranging and difficult to approximate at this early stage. Accordingly, a ‘typical’ worst-case approach has been adopted. Scenarios of significant noise-producing operations at each of the relevant areas have been modelled.
7.3.1 LNG Processing and Utilities
Noise modelling of the LNG processing operations was undertaken by engineering and construction services company KBR, in Houston, Texas. KBR have extensive experience in the design of LNG facilities and have taken noise measurements of similar existing facilities.

PNG LNG Project LNG Facilities Environmental Noise Impact Assessment Coffey Natural Systems
Heggies Pty Ltd Report Number 40-1530-R1 Revision 1
(40-1530 R1R1.doc) 15 January 2009 Page 27
Their noise model incorporates a general two-train layout with sound power level information obtained from a combination of measured levels from similar facilities, manufacturer supplied data and contract specification OH&S performance requirements.
The following input assumptions have been provided by KBR;
Class D Acoustic insulation for compressor suction and discharge piping consists of a porous layer 50 mm thick with 0.8 mm thick aluminized steel jacketing (7 kg/m2) and a second porous layer 50 mm thick with 1.3 mm aluminized steel jacketing (11.3 kg/m2).
No in-line silencers for compressor suction or discharge lines.
85 dBA @ 1m for all enclosures.
85 dBA @ 1m for all ducting and intake silencers.
85 dBA @ 3m from top of gas turbine exhaust stack.
90 dBA sound power limit per fan for air coolers.
80 dBA @ 1m for all other rotating equipment and control valves.
Typical LNG Plant buildings included for shielding.
The breakdown of total sound power level data assumed in the noise model is included in Table 14.
Table 14 LNG Processing and Utilities
Plant items Sound Power Level
dBA ref. 10-12 W
LNG Train 124
Generator 116
Figure 8 Example of LNG processing facility

PNG LNG Project LNG Facilities Environmental Noise Impact Assessment Coffey Natural Systems
Heggies Pty Ltd Report Number 40-1530-R1 Revision 1
(40-1530 R1R1.doc) 15 January 2009 Page 28
7.3.2 Shipping
It is estimated that LNG tankers will make 95 port calls per annum, while the condensate carriers will make 17 port calls per annum. After arrival at the Gulf of Papua, tankers will lay at anchor approximately 2 km offshore. When entering the LNG Port they will be under the control of the harbour pilot and assisted by tugs as they traverse the channel to the LNG Jetty.
LNG loading will take approximately 8 to 10 hours, during which only minimal noise-emitting equipment will be operating, such as pumps and tanker auxiliary power generators.
For the purposes of predicting noise emissions from shipping operations, a maximum activity case was assumed. The scenario includes a single LNG tanker under way shortly after departing the LNG jetty assisted by up to four tugs. A further vessel docked at the condensate berth was also included.
The breakdown of total Sound Power Level data assumed in the noise model is included in Table 15.
Table 15 Shipping Significant Noise Sources
Equipment Number Sound Power Level
dBA ref. 10-12 W
LNG tanker (under way) 1 111
Tugs (under load) 4 111
Condensate tanker (auxiliary power only) 1 101
Condensate pumping 1 105
Figure 9 Typical LNG Tanker and Tugs
PNG LNG Project LNG Facilities Environmental Noise Impact Assessment Coffey Natural Systems
Heggies Pty Ltd Report Number 40-1530-R1 Revision 1
(40-1530 R1R1.doc) 15 January 2009 Page 29
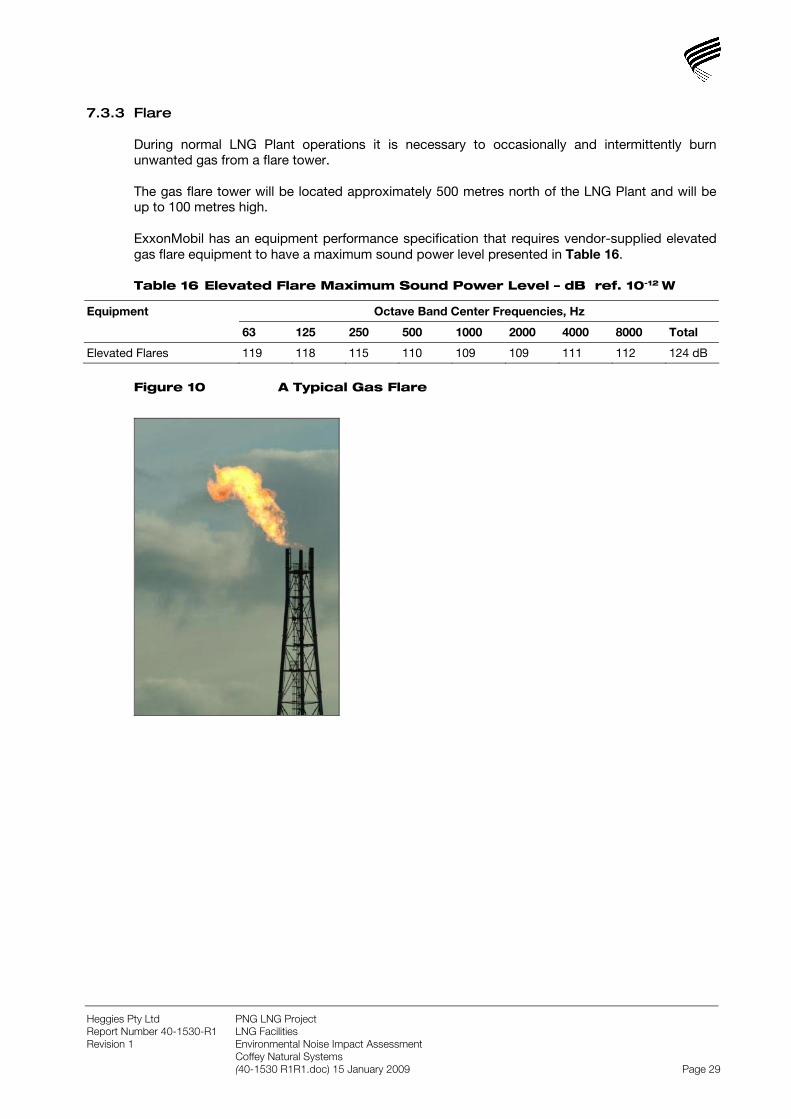
7.3.3 Flare
During normal LNG Plant operations it is necessary to occasionally and intermittently burn unwanted gas from a flare tower.
The gas flare tower will be located approximately 500 metres north of the LNG Plant and will be up to 100 metres high.
ExxonMobil has an equipment performance specification that requires vendor-supplied elevated gas flare equipment to have a maximum sound power level presented in Table 16.
Table 16 Elevated Flare Maximum Sound Power Level – dB ref. 10-12 W
Octave Band Center Frequencies, Hz Equipment
63 125 250 500 1000 2000 4000 8000 Total
Elevated Flares 119 118 115 110 109 109 111 112 124 dB
Figure 10 A Typical Gas Flare

PNG LNG Project LNG Facilities Environmental Noise Impact Assessment Coffey Natural Systems
Heggies Pty Ltd Report Number 40-1530-R1 Revision 1
(40-1530 R1R1.doc) 15 January 2009 Page 30
8 MODEL PREDICTIONS AND ASSESSMENT
8.1 Construction Noise Assessment
Construction noise levels have been predicted for the three scenarios detailed in Section 7.2. Each scenario represents a ‘typical’ maximum activity with all equipment operating. The predicted LAeq noise level has been predicted for non-adverse and adverse meteorological enhancement conditions.
Table 17 Predicted Construction Noise Levels in dBA ref. 20 µPa
Location of most affected receptor
Noise limit Site preparation Civil works Construction of LNG facilities & utilities & LNG Jetty
Day Night Non adverse
Adverse Non adverse
Adverse Non adverse
Adverse
Papa 50 40 27 33 26 32 21 27
Metago Bible College 50 40 26 33 24 30 21 27
Boera 50 40 19 25 12 18 16 21
Lea Lea 50 40 18 24 11 16 13 18
The predicted construction noise levels will comply with the project’s noise criteria under all conditions during the day and night periods. Furthermore, construction noise is likely to be inaudible against the existing ambient background noise level, particularly during the night period.
Noise contours for neutral propagation conditions are shown for the site preparation scenario in Figure 11, for the civil works scenario in Figure 12 and for the construction of LNG Facilities in Figure 13.
8.2 Blasting
It is not anticipated that blasting will be required as part of the construction of the onshore LNG Facilities.
Explosive charges may be required to break up larger coral reef structures in the LNG Jetty and navigational channel. Sufficient details of the locations and size of blasts required are not available to predict airblast and vibration levels, however, as blasts will be underwater it is anticipated that the requirements will be satisfied and accordingly blasting will be unlikely to cause significant impacts to receptor locations.
Notwithstanding the above, a blasting management plan for both the terrestrial and marine environments will be established with consideration of the ANZECC guideline and AS 2187.2-1993 as detailed in Section 6.5 and in consultation with local communities.

PNG LNG Project LNG Facilities Environmental Noise Impact Assessment Coffey Natural Systems
Heggies Pty Ltd Report Number 40-1530-R1 Revision 1
(40-1530 R1R1.doc) 15 January 2009 Page 31
Figure 11 Predicted Site Preparation Scenario Noise Contours
Figure 12 Predicted Civil Works Scenario Noise Contours

PNG LNG Project LNG Facilities Environmental Noise Impact Assessment Coffey Natural Systems
Heggies Pty Ltd Report Number 40-1530-R1 Revision 1
(40-1530 R1R1.doc) 15 January 2009 Page 32
Figure 13 Predicted Construction of LNG Facilities Scenario Noise Contours
8.3 Operational Noise Assessment
Construction noise levels have been predicted for the three scenarios detailed in Section 7.3. Each scenario represents a ‘typical’ maximum activity with all equipment operating. The predicted LAeq noise level has been predicted for non-adverse and adverse meteorological enhancement conditions.
Table 18 Operational Noise Levels in dBA ref. 20 µPa
Location of Most Affected Receptor
Noise limit LNG Processing and Utilities
Shipping Flare Cumulative
Day Night Neutral Adverse Neutral Adverse Neutral Adverse Neutral Adverse
Papa 50 40 29 33 28 34 35 35 37 39
Metago Bible College
50 40 29 33 18 23 33 34 35 37
Boera 50 40 25 30 21 25 10 13 27 31
Lea Lea 50 40 ~25 ~30 22 26 11 13 27 32

PNG LNG Project LNG Facilities Environmental Noise Impact Assessment Coffey Natural Systems
Heggies Pty Ltd Report Number 40-1530-R1 Revision 1
(40-1530 R1R1.doc) 15 January 2009 Page 33
8.3.1 LNG Processing and Utilities
Predicted noise levels shown in Table 18 indicate that they will be compliant during all periods of the day under all meteorological conditions. Noise contours for neutral propagation conditions are shown in Figure 15.
A typical received frequency spectrum is shown in Figure 14 and illustrates that the noise at receptor locations is unlikely to have dominant low frequencies and when plotted on a Balanced Noise Criterion Curve (NCB Curve) appears to achieve a good spectral balance. Whilst a number of individual noise sources within the LNG Plant are tonal in character the large number of total noise sources will result in overall received noise being more broadband in nature.
It is anticipated that noise character that would be considered more prominent or annoying such as tonality or low frequency content are unlikely to be dominant and accordingly the predicted receptor’s noise levels presented in Table 18 have not been adjusted.
Figure 14 Typical received frequency spectrum
0.0
5.0
10.0
15.0
20.0
25.0
63 Hz 125 Hz 250 Hz 500 Hz 1 kHz 2 kHz
Frequency
dBA

PNG LNG Project LNG Facilities Environmental Noise Impact Assessment Coffey Natural Systems
Heggies Pty Ltd Report Number 40-1530-R1 Revision 1
(40-1530 R1R1.doc) 15 January 2009 Page 34
Figure 15 Predicted LNG Processing and Utilities Noise Contours

PNG LNG Project LNG Facilities Environmental Noise Impact Assessment Coffey Natural Systems
Heggies Pty Ltd Report Number 40-1530-R1 Revision 1
(40-1530 R1R1.doc) 15 January 2009 Page 35
8.3.2 Shipping
Predicted noise levels shown in Table 18 indicate that they will be compliant during all periods of the day under all meteorological conditions. Noise contours for neutral propagation conditions are shown in Figure 16.
It should be noted that the most significant noise sources for the scenario evaluated are from the LNG tanker and tugs. These sources will be moving along the channel and may on occasions traverse closer to sensitive receptors than modelled and hence result in higher noise levels than predicted. However, the closer locations are unlikely to produce noise levels in excess of the project noise limits. Furthermore, the elevated noise levels from these sources are only going to be short in duration and infrequent.
Figure 16 Predicted Shipping Noise Contours

PNG LNG Project LNG Facilities Environmental Noise Impact Assessment Coffey Natural Systems
Heggies Pty Ltd Report Number 40-1530-R1 Revision 1
(40-1530 R1R1.doc) 15 January 2009 Page 36
8.3.3 Flare
Predicted noise levels shown in Table 18 indicate that these will be compliant during all periods of the day under all meteorological conditions. Noise contours for neutral propagation conditions are shown in Figure 17.
Figure 17 Predicted Shipping Noise Contours

PNG LNG Project LNG Facilities Environmental Noise Impact Assessment Coffey Natural Systems
Heggies Pty Ltd Report Number 40-1530-R1 Revision 1
(40-1530 R1R1.doc) 15 January 2009 Page 37
8.3.4 Traffic Noise
The Port Moresby to Lea Lea road will be the sole road to the LNG Facilities site and will carry increased traffic during both construction and operation of the project.
The route is sufficiently far from the villages of Boera (~2.5 km) and Porebada (~2.7 km) to mitigate road noise. The Napa Napa Road section of the route passes through residential communities closer to Port Moresby, where communities are located on the road.
A traffic count survey was conducted in May–June 2008 at a total of five sites across the project area. For the purposes of estimating the number of heavy vehicles, it was assumed that half the total registered as ute/trucks would be classified as heavy vehicles and all buses and Public Motor Vehicles (PMV) were heavy vehicles.
It has been assumed that the peak hour during the day period would carry 6% of daily traffic, whereas during the night period the peak hour would carry 0.08% of daily traffic.
Table 19 summarises the potentially affected communities along the transport route.
Table 19 Description of Potentially Affected communities on the Lea Lea to Port Moresby Road
Community / Receptor
Description Approximate setback distance to closest affected dwellings
Approximate number of affected dwellings
Approximate existing daily traffic movements / % heavy vehicles
Konebada Petroleum Park
Lea Lea Road – Porebada Road intersection
200m 6 930 / 67%
Koukou-Ranu Hedadi
Napa Napa Rd approximately 700 m northwest of the Baruni intersection
50m 5 930 / 67%
Baruni Napa Napa Rd approximately 700 m south of the Baruni intersection
15-20m 30 3300 / 75%
Kanudi Possible residences associated with oil facility on Napa Napa Road
60 2 > 3300 / 55%
Idubada / Port Moresby Technical College
Napa Napa Road dwellings and classrooms nearest to road
50m 5 > 3300 / 55%
Idubada Possible residences associated with oil facility on Napa Napa Road
20-30 3 > 3300 / 55%
Hagara Primary School
Napa Napa Road classrooms nearest to road
25m 4 >> 3300 / 75%
Poreporena Villages
Includes villages of Gabi, Hanuabada and Hohodae, dwellings nearest to road
40m 30 >> 3300 / 55%
Construction
During construction, considerable traffic will be generated by the project. This will be for the purposes of moving staff, equipment and supplies. Approximately 7500 staff will be employed by the project during construction and a temporary construction camp providing accommodation, services and messing facilities for them will be built, thereby reducing potential traffic movement.

PNG LNG Project LNG Facilities Environmental Noise Impact Assessment Coffey Natural Systems
Heggies Pty Ltd Report Number 40-1530-R1 Revision 1
(40-1530 R1R1.doc) 15 January 2009 Page 38
The construction of the Materials Offloading Facility will provide a means of receiving large-scale deliveries of materials and equipment by sea. Materials and equipment sourced domestically or, prior to the completion of the Material Offloading Facility, will be delivered by road. This will typically include:
Contractor’s earthmoving equipment fleet.
Materials and prefabricated modules required for the construction camp.
Delivery of fuel and supplies.
The estimated peak traffic volume during construction is 500 vehicles per day, of which a high proportion (70%, 350 vehicles) are heavy vehicles.
Operations
Traffic generated during operations will be more limited. Operational staff will be housed in the permanent camp, with all LNG product exported via the LNG jetty. Traffic generated during operations will include movement of staff during roster changeover, delivery of general supplies of food and other consumables, and waste removal.
The estimated peak traffic volume during operations is 50 vehicles per day, of which a high proportion (50%) are heavy vehicles.
Predictions
Predicted peak hourly noise levels from traffic at the most affected receptor in each community studied were calculated based on the assumptions for vehicle mix and the approximate setback distance. It was assumed that traffic travelled at approximately 45 km/h and that no shielding or reflections would affect noise propagation. The results are presented in Table 20.
Table 20 Estimated Peak Hourly Road Traffic Noise Levels
Estimated road traffic noise level dBA Community / Receptor
Existing During Construction During Operation
Day Night Day Night Day Night
Konebada Petroleum Park 46 37 48 39 46 37
Koukou-Ranu Hedadi 53 44 55 46 53 44
Baruni 64 55 65 56 63 54
Kanudi ~ 57 ~ 48 ~ 58 ~ 49 ~ 57 ~ 48
Idubada / Port Moresby Technical College ~ 58 ~ 49 ~ 59 ~ 50 ~ 58 ~ 49
Idubada ~ 61 ~ 52 ~ 63 ~ 54 ~ 61 ~ 52
Hagara Primary School > 61 > 53 > 62 > 53 > 61 > 53
Poreporena Villages > 59 > 50 > 60 > 51 > 59 > 50
Based upon the above estimations it is evident that some dwellings located on the Napa Napa Road in the village of Baruni are already exposed to potentially high traffic noise levels as a result of their proximity and the considerable traffic through the village. As a consequence of project construction noise levels are estimated to increase by up to a further 1 dBA.

PNG LNG Project LNG Facilities Environmental Noise Impact Assessment Coffey Natural Systems
Heggies Pty Ltd Report Number 40-1530-R1 Revision 1
(40-1530 R1R1.doc) 15 January 2009 Page 39
Given the minimal setback distance in Baruni it may be necessary to relocate some dwellings to enable access for wide loads which would effectively increase set-back distances and reduce traffic noise levels. Furthermore, alternative route alignments to reduce noise and traffic impacts in Baruni could be effective.

PNG LNG Project LNG Facilities Environmental Noise Impact Assessment Coffey Natural Systems
Heggies Pty Ltd Report Number 40-1530-R1 Revision 1
(40-1530 R1R1.doc) 15 January 2009 Page 40
9 CONCLUSIONS
9.1 Construction
The predicted construction noise levels show that project noise limits will be complied with under all conditions during the day and night period. Furthermore, construction noise is likely to be inaudible against the existing ambient noise level, particularly during the night period. Nonetheless, all construction vehicles and equipment should be maintained in good working order to limit emissions.
Blasting impacts are not anticipated to exceed recommended limits. A Blasting Management Plan for both terrestrial and marine environments is to be prepared with consideration of the ANZECC guideline and AS 2187.2-1993 as detailed in Section 6.5 and in consultation with local communities.
Road traffic generated during construction may result in noise increases of approximately 1 to 2 dBA, resulting in levels that are generally acceptable at most communities. However, in the village of Baruni, the minimal setback (15 to 20 metres) and the relatively high level of existing traffic results in noise levels that may already be considered high. Additional traffic through Baruni has the potential to cause disturbance at the nearest receptors. Consideration toward project imposed speed limits, increased dwelling set-back distances or alternative road alignments could be effective means of mitigating traffic noise impacts.
9.2 Operation
Predicted operational noise levels for the LNG Plant and utilities, LNG shipping movement and flare indicate that noise levels will comply with all project noise criteria at all time periods and in all meteorological conditions. Furthermore, operational noise is likely to be inaudible against the existing ambient noise level, particularly during the night period.
Evaluation of the cumulative level of noise from all three noise scenarios has shown that, should all occur simultaneously, the noise limit will still be met.
Detailed design of plant and equipment through specifications to meet boundary noise targets will ensure noise in surrounding communities is acceptable. The boundary noise target will also provide a more reliable means of monitoring ongoing compliance.
Additional noise mitigation beyond that required for OH&S considerations as assumed for the LNG Facilities (such as pipe lagging, acoustic enclosures and silencers as outlined in Section 8.3.1) will generally not be required.

PNG LNG Project LNG Facilities Environmental Noise Impact Assessment Coffey Natural Systems
Heggies Pty Ltd Report Number 40-1530-R1 Revision 1
(40-1530 R1R1.doc) 15 January 2009 Page 41
10 REFERENCES
NSW DECC (1999) Environmental criteria for road traffic noise. Published by Environment Protection Authority, 799 Pacific Highway Chatswood NSW 2057, ISBN 0713 0203 6
NSW DECC (2000) New South Wales Industrial Noise Policy. Published by Environment Protection Authority, 59-61 Goulburn Street Sydney South NSW 1232. ISBN 0 7313 27152
Berglund, Linvall, Schwela for World Health Organisation (1995) Guidelines for Community Noise. Published by the Stockholm University and Karolinska Institute
Holmes, N.E. (2005) Noise Impact Assessment: PNG Gas Project. Published by Holmes Air Sciences, Suite 2B, 14 Glen Street, Eastwood NSW
International Finance Corporation, World Bank Group (2007) Environmental Health and Safety (EHS) Guidelines - General EHS Guidelines: Environmental Noise Management. General EHS Guidelines [Complete version] at www.ifc.org/ifcext/enviro.nsf/Content/EnvironmentalGuidelines
Standards Association of Australia), Australian Standard 1259.2:1990 – Sound Level Meters Part 2: Integrating–averaging. Published by Standards Australia 1 the Crescent, Homebush, NSW 2140 ISBN 0 7262 6153 x
Manning C.J (1981) The propagation of noise from petroleum and petrochemical complexes to neighbouring communities 4/81. CONCAWE’s Special Task Force on Noise propagation Den Haag, NL,
Australian and New Zealand Environment Conservation Council (Sep 1990) Technical basis for guidelines to minimise annoyance due to blasting overpressure and ground vibration.

Appendix A Report 40-1530
40-1530 R1 Heggies Pty Ltd
BASELINE NOISE MONITORING
STATISTICAL NOISE LEVELS

Appendix A1 - Page 1Statistical Noise Levels
Heggies Report 40-1530
Statistical Ambient Noise LevelsBG1 - Metago Bible College - Papa Village - Wednesday 30 April 2008
20
25
30
35
40
45
50
55
60
65
70
75
80
00:00 02:00 04:00 06:00 08:00 10:00 12:00 14:00 16:00 18:00 20:00 22:00 00:00Time of Day (End of 15 Minute Sample Interval)
Soun
d Pr
essu
re L
evel
(dB
A)
L1 L10 L90 Leq

Appendix A1 - Page 2Statistical Noise Levels
Heggies Report 40-1530
Statistical Ambient Noise LevelsBG1 - Metago Bible College - Papa Village - Thursday 1 May 2008
20
25
30
35
40
45
50
55
60
65
70
75
80
00:00 02:00 04:00 06:00 08:00 10:00 12:00 14:00 16:00 18:00 20:00 22:00 00:00Time of Day (End of 15 Minute Sample Interval)
Soun
d Pr
essu
re L
evel
(dB
A)
L1 L10 L90 Leq

Appendix A2 - Page 1Statistical Noise Levels
Heggies Report 40-1530
Statistical Ambient Noise LevelsBG2 - Papa Village - Wednesday 30 April 2008
20
25
30
35
40
45
50
55
60
65
70
75
80
00:00 02:00 04:00 06:00 08:00 10:00 12:00 14:00 16:00 18:00 20:00 22:00 00:00Time of Day (End of 15 Minute Sample Interval)
Soun
d Pr
essu
re L
evel
(dB
A)
L1 L10 L90 Leq

Appendix A2 - Page 2Statistical Noise Levels
Heggies Report 40-1530
Statistical Ambient Noise LevelsBG2 - Papa Village - Thursday 1 May 2008
20
25
30
35
40
45
50
55
60
65
70
75
80
00:00 02:00 04:00 06:00 08:00 10:00 12:00 14:00 16:00 18:00 20:00 22:00 00:00Time of Day (End of 15 Minute Sample Interval)
Soun
d Pr
essu
re L
evel
(dB
A)
L1 L10 L90 Leq

Appendix A2 - Page 3Statistical Noise Levels
Heggies Report 40-1530
Statistical Ambient Noise LevelsBG2 - Papa Village - Friday 2 May 2008
20
25
30
35
40
45
50
55
60
65
70
75
80
00:00 02:00 04:00 06:00 08:00 10:00 12:00 14:00 16:00 18:00 20:00 22:00 00:00Time of Day (End of 15 Minute Sample Interval)
Soun
d Pr
essu
re L
evel
(dB
A)
L1 L10 L90 Leq

Appendix A2 - Page 4Statistical Noise Levels
Heggies Report 40-1530
Statistical Ambient Noise LevelsBG2 - Papa Village - Saturday 3 May 2008
20
25
30
35
40
45
50
55
60
65
70
75
80
00:00 02:00 04:00 06:00 08:00 10:00 12:00 14:00 16:00 18:00 20:00 22:00 00:00Time of Day (End of 15 Minute Sample Interval)
Soun
d Pr
essu
re L
evel
(dB
A)
L1 L10 L90 Leq

Appendix A2 - Page 5Statistical Noise Levels
Heggies Report 40-1530
Statistical Ambient Noise LevelsBG2 - Papa Village - Sunday 4 May 2008
20
25
30
35
40
45
50
55
60
65
70
75
80
00:00 02:00 04:00 06:00 08:00 10:00 12:00 14:00 16:00 18:00 20:00 22:00 00:00Time of Day (End of 15 Minute Sample Interval)
Soun
d Pr
essu
re L
evel
(dB
A)
L1 L10 L90 Leq

Appendix A2 - Page 6Statistical Noise Levels
Heggies Report 40-1530
Statistical Ambient Noise LevelsBG2 - Papa Village - Monday 5 May 2008
20
25
30
35
40
45
50
55
60
65
70
75
80
00:00 02:00 04:00 06:00 08:00 10:00 12:00 14:00 16:00 18:00 20:00 22:00 00:00Time of Day (End of 15 Minute Sample Interval)
Soun
d Pr
essu
re L
evel
(dB
A)
L1 L10 L90 Leq

Appendix A3 - Page 1Statistical Noise Levels
Heggies Report 40-1530
Statistical Ambient Noise LevelsBG3 - Boera Village - Wednesday 30 April 2008
20
25
30
35
40
45
50
55
60
65
70
75
80
00:00 02:00 04:00 06:00 08:00 10:00 12:00 14:00 16:00 18:00 20:00 22:00 00:00Time of Day (End of 15 Minute Sample Interval)
Soun
d Pr
essu
re L
evel
(dB
A)
L1 L10 L90 Leq

Appendix A3 - Page 2Statistical Noise Levels
Heggies Report 40-1530
Statistical Ambient Noise LevelsBG3 - Boera Village - Thursday 1 May 2008
20
25
30
35
40
45
50
55
60
65
70
75
80
00:00 02:00 04:00 06:00 08:00 10:00 12:00 14:00 16:00 18:00 20:00 22:00 00:00Time of Day (End of 15 Minute Sample Interval)
Soun
d Pr
essu
re L
evel
(dB
A)
L1 L10 L90 Leq

Appendix A3 - Page 3Statistical Noise Levels
Heggies Report 40-1530
Statistical Ambient Noise LevelsBG3 - Boera Village - Friday 2 May 2008
20
25
30
35
40
45
50
55
60
65
70
75
80
00:00 02:00 04:00 06:00 08:00 10:00 12:00 14:00 16:00 18:00 20:00 22:00 00:00Time of Day (End of 15 Minute Sample Interval)
Soun
d Pr
essu
re L
evel
(dB
A)
L1 L10 L90 Leq

Appendix A3 - Page 4Statistical Noise Levels
Heggies Report 40-1530
Statistical Ambient Noise LevelsBG3 - Boera Village - Saturday 3 May 2008
20
25
30
35
40
45
50
55
60
65
70
75
80
00:00 02:00 04:00 06:00 08:00 10:00 12:00 14:00 16:00 18:00 20:00 22:00 00:00Time of Day (End of 15 Minute Sample Interval)
Soun
d Pr
essu
re L
evel
(dB
A)
L1 L10 L90 Leq
Appendix B Report 40-1530
40-1530 R1 Heggies Pty Ltd
SEASONAL WIND ANALYSIS

Annual Wind Speed and Direction PercentageDay
Direction Calm - <=0.5m/s 0.5m/s - <=2m/s 2m/s - <=3.0m/s 0.5m/s - <=3.0m/s 3.0m/s - <=5.0m/s > 5.0m/sN 0% 2% 2% 4% 1% 0%
NNE 0% 2% 3% 5% 1% 0%NE 0% 3% 3% 5% 1% 0%
ENE 0% 3% 4% 7% 1% 0%E 0% 3% 5% 8% 4% 6%
ESE 0% 2% 5% 8% 9% 25%SE 0% 2% 5% 7% 13% 41%
SSE 0% 2% 5% 7% 16% 45%S 0% 2% 3% 5% 16% 40%
SSW 0% 2% 3% 5% 14% 22%SW 0% 2% 3% 5% 12% 6%
WSW 0% 1% 3% 5% 10% 2%W 0% 1% 3% 4% 8% 2%
WNW 0% 1% 2% 3% 6% 1%NW 0% 1% 2% 3% 4% 1%
NNW 0% 1% 2% 3% 2% 1%Total 1% 7% 13% 21% 30% 48%
Evening
N 0% 1% 1% 3% 1% 0%NNE 0% 2% 2% 4% 0% 0%NE 0% 2% 4% 7% 1% 0%
ENE 0% 3% 6% 9% 7% 0%E 0% 3% 8% 11% 24% 9%
ESE 0% 3% 8% 11% 40% 19%SE 0% 3% 7% 10% 42% 22%
SSE 0% 3% 6% 9% 38% 22%S 0% 4% 6% 10% 20% 13%
SSW 0% 4% 6% 10% 5% 2%SW 0% 4% 6% 10% 2% 0%
WSW 0% 3% 5% 8% 1% 0%W 0% 3% 4% 7% 2% 0%
WNW 0% 2% 3% 6% 2% 0%NW 0% 2% 3% 4% 2% 0%
NNW 0% 1% 2% 3% 2% 0%Total 1% 11% 19% 30% 47% 22%
Night
N 0% 2% 5% 6% 7% 0%NNE 0% 2% 10% 12% 12% 0%NE 0% 3% 16% 19% 15% 0%
ENE 0% 3% 22% 25% 26% 0%E 0% 3% 24% 28% 42% 2%
ESE 0% 2% 20% 23% 48% 3%SE 0% 2% 13% 14% 44% 3%
SSE 0% 1% 5% 6% 32% 3%S 0% 0% 1% 1% 11% 1%
SSW 0% 0% 0% 0% 0% 0%SW 0% 0% 0% 0% 0% 0%
WSW 0% 0% 0% 0% 0% 0%W 0% 0% 0% 0% 0% 0%
WNW 0% 0% 1% 1% 1% 0%NW 0% 1% 2% 3% 2% 0%
NNW 0% 1% 3% 4% 3% 0%Total 0% 5% 30% 36% 61% 4%
Appendix BHeggies Report 40-1530
Page 1 of 5Satistical Analysis of Seasonal Winds

Summer Wind Speed and Direction PercentageDay
Direction Calm - <=0.5m/s 0.5m/s - <=2m/s 2m/s - <=3.0m/s 0.5m/s - <=3.0m/s 3.0m/s - <=5.0m/s > 5.0m/sN 0% 4% 4% 8% 3% 0%
NNE 0% 5% 4% 10% 2% 0%NE 0% 5% 5% 10% 1% 0%
ENE 0% 5% 5% 10% 1% 0%E 0% 3% 5% 8% 2% 1%
ESE 0% 2% 4% 7% 4% 7%SE 0% 2% 4% 6% 7% 15%
SSE 0% 2% 3% 5% 11% 19%S 0% 3% 4% 6% 15% 20%
SSW 0% 3% 6% 9% 18% 15%SW 0% 3% 8% 11% 18% 7%
WSW 0% 3% 9% 12% 20% 5%W 0% 3% 8% 11% 18% 5%
WNW 0% 3% 6% 9% 14% 5%NW 0% 3% 5% 7% 11% 5%
NNW 0% 3% 3% 7% 6% 3%Total 1% 13% 21% 34% 38% 27%
Evening
N 0% 3% 3% 6% 3% 0%NNE 0% 3% 3% 6% 0% 0%NE 0% 4% 5% 9% 1% 0%
ENE 0% 5% 7% 12% 7% 0%E 0% 6% 8% 14% 17% 1%
ESE 0% 7% 8% 15% 25% 3%SE 0% 7% 8% 14% 27% 3%
SSE 0% 8% 9% 17% 23% 3%S 0% 9% 12% 22% 13% 2%
SSW 0% 10% 13% 23% 6% 0%SW 0% 10% 12% 22% 3% 0%
WSW 0% 8% 10% 19% 3% 0%W 0% 6% 8% 15% 5% 0%
WNW 0% 5% 8% 13% 7% 0%NW 0% 4% 7% 11% 7% 0%
NNW 0% 3% 5% 8% 5% 0%Total 3% 24% 32% 56% 38% 3%
Night
N 0% 4% 14% 18% 13% 0%NNE 0% 6% 24% 30% 19% 0%NE 0% 7% 31% 37% 21% 0%
ENE 0% 7% 32% 39% 28% 0%E 0% 6% 29% 35% 29% 0%
ESE 0% 4% 17% 21% 22% 0%SE 0% 2% 7% 9% 18% 0%
SSE 0% 1% 2% 3% 10% 0%S 0% 0% 0% 0% 2% 0%
SSW 0% 0% 0% 0% 0% 0%SW 0% 0% 0% 0% 0% 0%
WSW 0% 0% 0% 0% 0% 0%W 0% 0% 0% 1% 1% 0%
WNW 0% 1% 2% 3% 4% 1%NW 0% 3% 5% 8% 6% 1%
NNW 0% 4% 8% 12% 7% 1%Total 0% 11% 43% 54% 45% 1%
Appendix BHeggies Report 40-1530
Page 2 of 5Satistical Analysis of Seasonal Winds

Autumn Wind Speed and Direction PercentageDay
Direction Calm - <=0.5m/s 0.5m/s - <=2m/s 2m/s - <=3.0m/s 0.5m/s - <=3.0m/s 3.0m/s - <=5.0m/s > 5.0m/sN 0% 2% 4% 6% 3% 0%
NNE 0% 3% 5% 8% 3% 0%NE 0% 4% 6% 10% 3% 0%
ENE 0% 5% 6% 11% 3% 0%E 0% 6% 6% 12% 3% 2%
ESE 0% 6% 6% 12% 5% 6%SE 0% 5% 6% 11% 9% 12%
SSE 0% 4% 6% 11% 17% 17%S 0% 4% 6% 10% 22% 19%
SSW 0% 3% 5% 9% 24% 15%SW 0% 3% 5% 8% 24% 9%
WSW 0% 2% 4% 6% 20% 4%W 0% 1% 4% 5% 15% 1%
WNW 0% 1% 3% 5% 11% 1%NW 0% 2% 3% 4% 7% 0%
NNW 0% 2% 3% 5% 3% 0%Total 2% 13% 20% 33% 43% 22%
Evening
N 0% 3% 2% 5% 1% 0%NNE 0% 4% 5% 8% 1% 0%NE 0% 5% 11% 16% 3% 0%
ENE 0% 5% 17% 22% 11% 0%E 0% 5% 19% 25% 23% 0%
ESE 0% 6% 19% 25% 31% 0%SE 0% 5% 15% 20% 33% 1%
SSE 0% 5% 13% 17% 27% 1%S 0% 4% 11% 15% 15% 0%
SSW 0% 4% 10% 15% 7% 0%SW 0% 5% 10% 15% 3% 0%
WSW 0% 5% 9% 13% 2% 0%W 0% 4% 7% 12% 2% 0%
WNW 0% 4% 6% 9% 3% 0%NW 0% 3% 3% 6% 3% 0%
NNW 0% 3% 2% 5% 2% 0%Total 1% 17% 40% 57% 42% 1%
Night
N 0% 2% 5% 7% 13% 0%NNE 0% 2% 13% 16% 27% 0%NE 0% 3% 26% 29% 33% 0%
ENE 0% 5% 34% 39% 36% 0%E 0% 5% 36% 42% 33% 0%
ESE 0% 5% 29% 34% 21% 0%SE 0% 3% 16% 19% 15% 0%
SSE 0% 1% 6% 7% 9% 0%S 0% 0% 1% 2% 3% 0%
SSW 0% 0% 0% 0% 0% 0%SW 0% 0% 0% 0% 0% 0%
WSW 0% 0% 0% 1% 0% 0%W 0% 0% 1% 1% 0% 0%
WNW 0% 1% 1% 1% 1% 0%NW 0% 1% 2% 3% 2% 0%
NNW 0% 1% 3% 4% 4% 0%Total 0% 8% 43% 51% 49% 0%
Appendix BHeggies Report 40-1530
Page 3 of 5Satistical Analysis of Seasonal Winds

Winter Wind Speed and Direction PercentageDay
Direction Calm - <=0.5m/s 0.5m/s - <=2m/s 2m/s - <=3.0m/s 0.5m/s - <=3.0m/s 3.0m/s - <=5.0m/s > 5.0m/sN 0% 0% 0% 0% 0% 0%
NNE 0% 0% 0% 0% 0% 0%NE 0% 0% 0% 0% 0% 0%
ENE 0% 0% 2% 2% 0% 0%E 0% 1% 4% 4% 5% 16%
ESE 0% 1% 5% 6% 13% 50%SE 0% 1% 6% 6% 17% 72%
SSE 0% 1% 4% 5% 18% 74%S 0% 0% 2% 3% 13% 59%
SSW 0% 0% 0% 1% 5% 24%SW 0% 0% 0% 0% 1% 3%
WSW 0% 0% 0% 0% 0% 0%W 0% 0% 0% 0% 0% 0%
WNW 0% 0% 0% 0% 0% 0%NW 0% 0% 0% 0% 0% 0%
NNW 0% 0% 0% 0% 0% 0%Total 0% 1% 6% 7% 18% 75%
Evening
N 0% 0% 0% 0% 0% 0%NNE 0% 0% 0% 0% 0% 0%NE 0% 0% 0% 0% 0% 0%
ENE 0% 0% 1% 1% 3% 0%E 0% 0% 2% 2% 28% 18%
ESE 0% 0% 2% 2% 54% 38%SE 0% 0% 2% 2% 56% 42%
SSE 0% 0% 1% 1% 53% 42%S 0% 0% 0% 0% 27% 24%
SSW 0% 0% 0% 0% 2% 4%SW 0% 0% 0% 0% 0% 0%
WSW 0% 0% 0% 0% 0% 0%W 0% 0% 0% 0% 0% 0%
WNW 0% 0% 0% 0% 0% 0%NW 0% 0% 0% 0% 0% 0%
NNW 0% 0% 0% 0% 0% 0%Total 0% 0% 2% 2% 56% 42%
Night
N 0% 0% 0% 0% 0% 0%NNE 0% 0% 0% 0% 0% 0%NE 0% 0% 3% 3% 1% 0%
ENE 0% 0% 9% 9% 10% 1%E 0% 1% 15% 15% 46% 6%
ESE 0% 1% 16% 17% 73% 9%SE 0% 1% 14% 15% 73% 9%
SSE 0% 1% 8% 8% 63% 8%S 0% 0% 2% 2% 27% 4%
SSW 0% 0% 0% 0% 0% 0%SW 0% 0% 0% 0% 0% 0%
WSW 0% 0% 0% 0% 0% 0%W 0% 0% 0% 0% 0% 0%
WNW 0% 0% 0% 0% 0% 0%NW 0% 0% 0% 0% 0% 0%
NNW 0% 0% 0% 0% 0% 0%Total 0% 1% 17% 17% 74% 9%
Appendix BHeggies Report 40-1530
Page 4 of 5Satistical Analysis of Seasonal Winds

Spring Wind Speed and Direction PercentageDay
Direction Calm - <=0.5m/s 0.5m/s - <=2m/s 2m/s - <=3.0m/s 0.5m/s - <=3.0m/s 3.0m/s - <=5.0m/s > 5.0m/sN 0% 0% 0% 1% 0% 0%
NNE 0% 1% 0% 1% 0% 0%NE 0% 1% 1% 1% 0% 0%
ENE 0% 1% 2% 3% 1% 0%E 0% 1% 4% 5% 6% 6%
ESE 0% 1% 6% 7% 13% 36%SE 0% 1% 6% 6% 17% 65%
SSE 0% 1% 4% 5% 18% 69%S 0% 1% 2% 3% 14% 63%
SSW 0% 0% 1% 1% 7% 33%SW 0% 0% 1% 1% 4% 5%
WSW 0% 0% 1% 1% 2% 0%W 0% 0% 0% 1% 1% 0%
WNW 0% 0% 0% 0% 0% 0%NW 0% 0% 0% 0% 0% 0%
NNW 0% 0% 0% 0% 0% 0%Total 0% 2% 7% 9% 21% 70%
Evening
N 0% 0% 0% 0% 0% 0%NNE 0% 0% 0% 1% 0% 0%NE 0% 1% 0% 1% 0% 0%
ENE 0% 1% 1% 2% 5% 0%E 0% 1% 2% 3% 28% 16%
ESE 0% 1% 2% 2% 49% 36%SE 0% 1% 1% 2% 52% 41%
SSE 0% 1% 1% 2% 48% 41%S 0% 1% 1% 2% 25% 25%
SSW 0% 2% 1% 3% 4% 5%SW 0% 1% 1% 2% 1% 0%
WSW 0% 1% 1% 2% 0% 0%W 0% 0% 0% 1% 0% 0%
WNW 0% 0% 0% 0% 0% 0%NW 0% 0% 0% 0% 0% 0%
NNW 0% 0% 0% 0% 0% 0%Total 0% 3% 3% 5% 53% 41%
Night
N 0% 0% 0% 1% 1% 0%NNE 0% 1% 2% 3% 2% 0%NE 0% 1% 5% 7% 3% 0%
ENE 0% 2% 13% 15% 27% 0%E 0% 1% 18% 19% 61% 2%
ESE 0% 1% 18% 18% 73% 4%SE 0% 0% 14% 14% 71% 4%
SSE 0% 0% 6% 6% 47% 4%S 0% 0% 1% 1% 12% 2%
SSW 0% 0% 0% 0% 0% 0%SW 0% 0% 0% 0% 0% 0%
WSW 0% 0% 0% 0% 0% 0%W 0% 0% 0% 0% 0% 0%
WNW 0% 0% 0% 0% 0% 0%NW 0% 0% 0% 0% 0% 0%
NNW 0% 0% 0% 0% 0% 0%Total 0% 2% 19% 21% 75% 4%
Appendix BHeggies Report 40-1530
Page 5 of 5Satistical Analysis of Seasonal Winds