PMHP Subgroup Analysis Activity for the Seven Day Follow-up Collaborative PIP ACCESS BEHAVIORAL...
68
PMHP Subgroup Analysis Activity for the Seven Day Follow-up Collaborative PIP ACCESS BEHAVIORAL HEALTH January 11, 2012
-
Upload
justin-wheeler -
Category
Documents
-
view
214 -
download
0
Transcript of PMHP Subgroup Analysis Activity for the Seven Day Follow-up Collaborative PIP ACCESS BEHAVIORAL...

PMHP Subgroup Analysis Activityfor the Seven Day Follow-up
Collaborative PIP
ACCESS BEHAVIORAL HEALTH
January 11, 2012
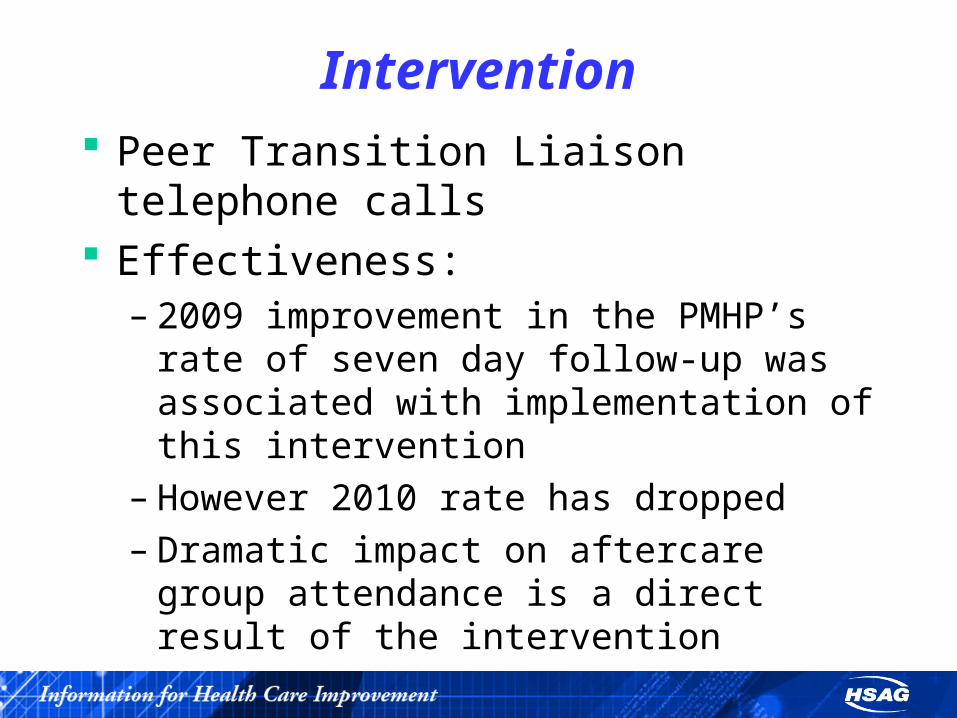
Intervention Peer Transition Liaison telephone calls Effectiveness:
– 2009 improvement in the PMHP’s rate of seven day follow-up was associated with implementation of this intervention
– However 2010 rate has dropped– Dramatic impact on aftercare group attendance
is a direct result of the intervention

Barriers
Barriers identified on the peer transition liaison call logs:– Transportation issues– Member needs to reschedule appointment– Member refuses to keep appointment– Follow-up appointment not clear on form– Follow-up appointment not within 7 days

Barriers
Other barriers identified in the overall population for the seven day follow-up collaborative PIP include:– Homeless– No telephone– Members whom we do not reach by phone

Subgroups
Subgroups identified in the overall population for the seven day follow-up collaborative PIP are:– Children vs Adults– Inpatient Facilities

Subgroups
Subgroups identified in the overall population for the seven day follow-up collaborative PIP are:– Children vs Adults
• Follow-up within 7 days– 38% of adult members
– 42% of child members

Subgroups
Subgroups identified in the overall population for the seven day follow-up collaborative PIP are:– Inpatient Facility
• 37% of Baptist Hospital discharges
• 68% of Bridgeway CSU discharges
• 35% of Emerald Coast Behavioral discharges
• 41% of Lakeview CSU discharges
• 16% of West Florida Hospital discharges

Availability of Data
Were the data for the identified subgroups available, complete, and accurate? – Encounter data– Peer Transition Liaison Activity Log data– ABH PTL Follow-up Form us being used only
by the two CSUs (Bridgeway & Lakeview). – Hospitals are using other formats.
Availability of Data
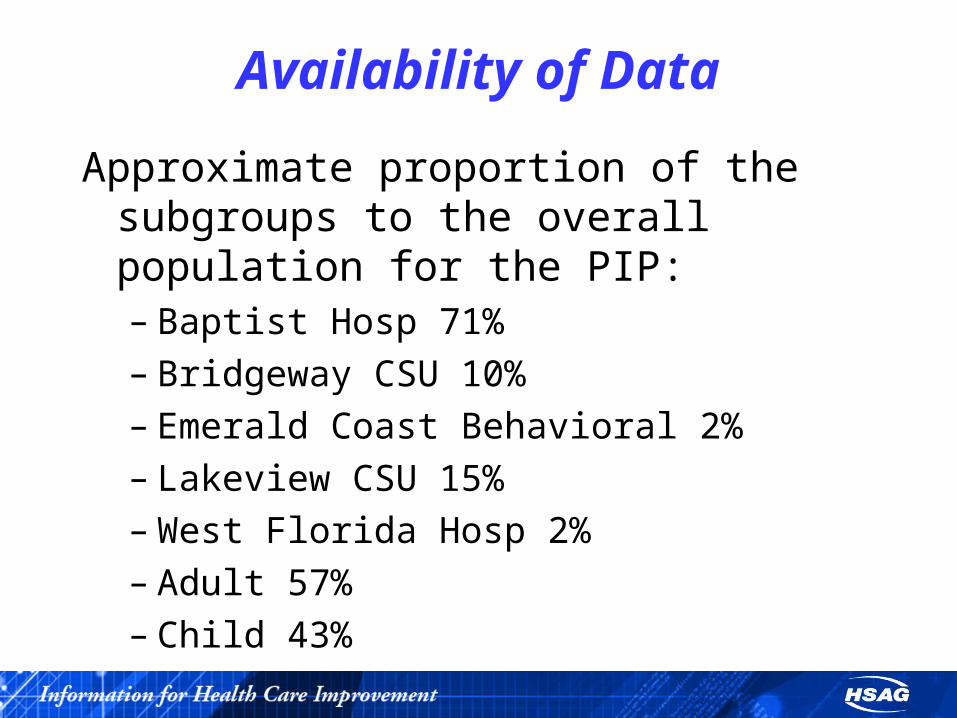
Approximate proportion of the subgroups to the overall population for the PIP:– Baptist Hosp 71%– Bridgeway CSU 10%– Emerald Coast Behavioral 2%– Lakeview CSU 15%– West Florida Hosp 2%– Adult 57%– Child 43%
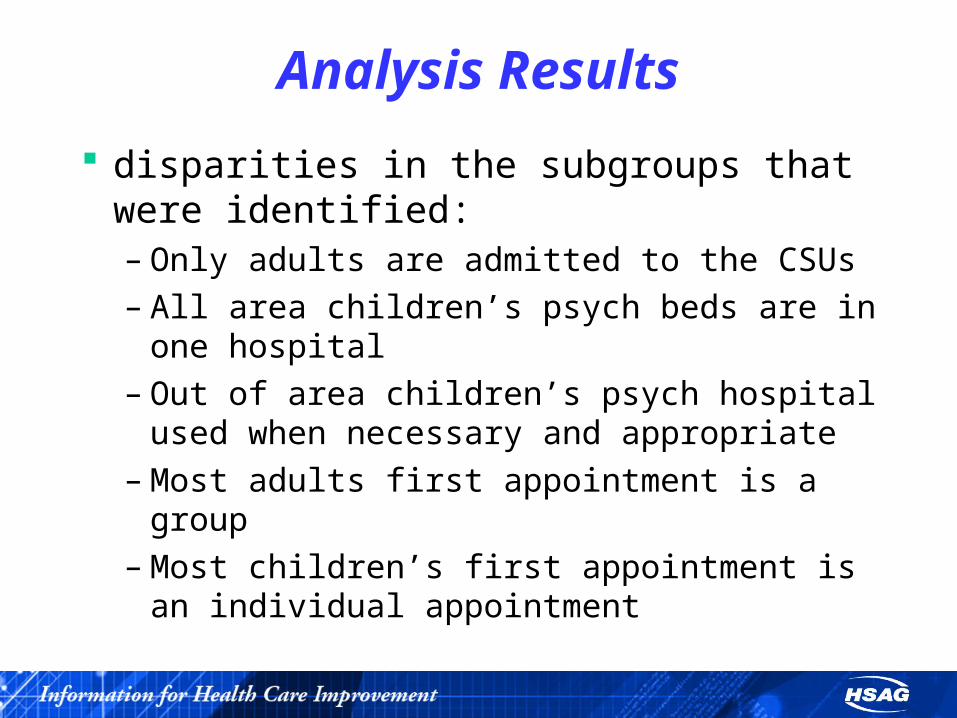
Analysis Results
disparities in the subgroups that were identified:– Only adults are admitted to the CSUs– All area children’s psych beds are in one
hospital– Out of area children’s psych hospital used when
necessary and appropriate– Most adults first appointment is a group– Most children’s first appointment is an
individual appointment

Improvement Strategies
Do your identified subgroups have unique causes/barriers?– Children vs. Adults
• More adults were given appointment within 7 days
• PTL higher success rate reaching parents of children
Interventions that could be implemented to address the causes/barriers:– Bridgeway’s Psychiatric Aftercare day model– Impact children’s first appointment date

PMHP Subgroup Analysis Activityfor the Seven Day Follow-up
Collaborative PIP
Jackson Public Health Trust / University of Miami Behavioral
HealthJanuary 11, 2012

Subgroups
The subgroups identified in the overall population for the seven day follow-up collaborative PIP were:– Facilities with 50+ discharges– Length of Stay– Gender and Age Range

Availability of Data
Were the data for the identified subgroups available, complete, and accurate? – Yes
What was the approximate proportion of the subgroups to the overall population for the PIP?– Facilities with 50+ d/c: 92.4%– Age/Sex: 100%– Length of Stay: 100%
Was it adequate for analysis?– Yes

Analysis Results
Why did the subgroups make sense for your plan?
– High SSI membership (longer LOS)
– High number of contracted facilities
– Representation of all age groups Did the subgroups you originally selected require
additional grouping?
– Yes, original subgroups did not show disparities (i.e. DSM diagnostic categories)
Summarize the disparities in the subgroups that were identified.– See next 3 slides for charts
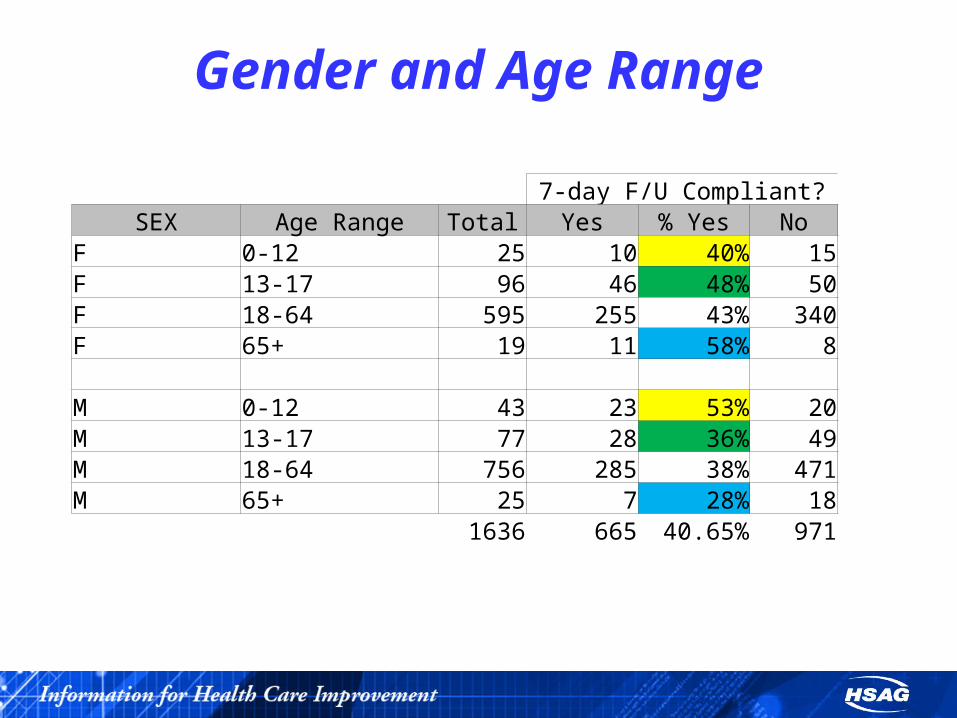
Gender and Age Range
7-day F/U Compliant?SEX Age Range Total Yes % Yes No
F 0-12 25 10 40% 15F 13-17 96 46 48% 50F 18-64 595 255 43% 340F 65+ 19 11 58% 8 M 0-12 43 23 53% 20M 13-17 77 28 36% 49M 18-64 756 285 38% 471M 65+ 25 7 28% 18
1636 665 40.65% 971

Length of Stay
7-day F/U Compliant?
Length of Stay Total Yes %Yes No
3 or less days 485 158 33% 327
4-6 days 846 375 44% 471
7 or more days 305 132 43% 173
1636 665 40.65% 971

Facilities7-day F/U Compliant?
Facility (only those with 50+
discharges) Total Yes % Yes NoC 119 28 24% 91J 54 23 43% 31L 191 71 37% 120MC 106 51 48% 55MS 72 10 14% 62N 64 18 28% 46PA 105 37 35% 68PU 316 248 78% 68S 158 60 38% 98U 221 57 26% 164W 106 35 33% 71
1512 638 42.20% 874
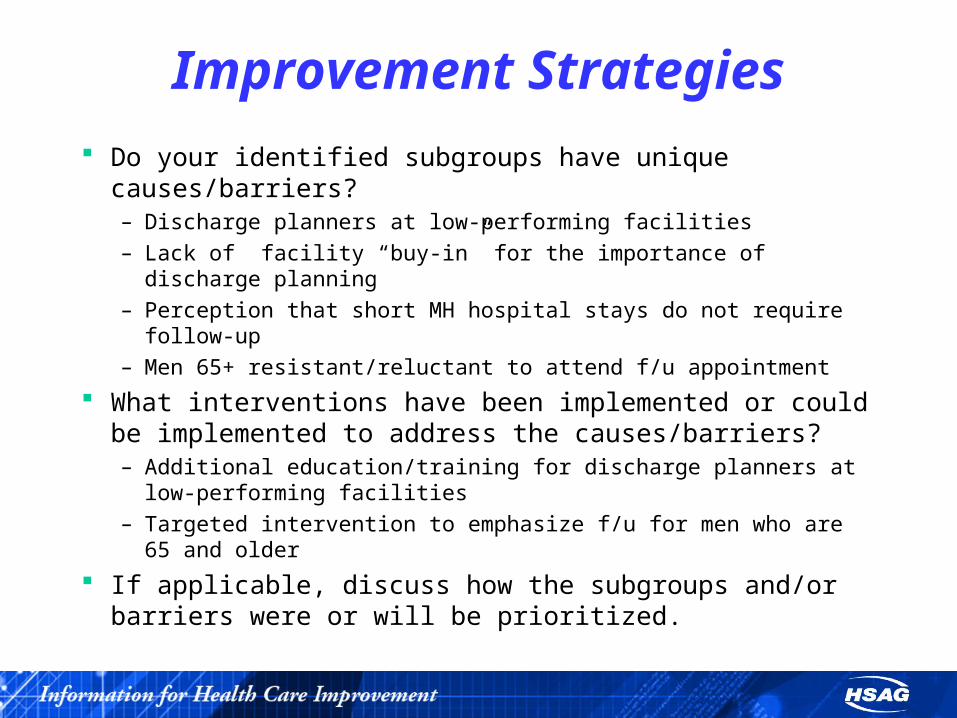
Improvement Strategies
Do your identified subgroups have unique causes/barriers?– Discharge planners at low-performing facilities
– Lack of facility “buy-in” for the importance of discharge planning
– Perception that short MH hospital stays do not require follow-up
– Men 65+ resistant/reluctant to attend f/u appointment
What interventions have been implemented or could be implemented to address the causes/barriers?– Additional education/training for discharge planners at low-
performing facilities
– Targeted intervention to emphasize f/u for men who are 65 and older
If applicable, discuss how the subgroups and/or barriers were or will be prioritized.

Lessons Learned
Has this exercise provided insight into your plan’s seven day follow-up PIP rates? Why or why not?– Yes
Future plans– Further drill-down to low-performing facilities
and issues with discharge planning– Interviewing non-compliant men over 65 to
determine specific reasons for non-compliance

PMHP Subgroup Analysis Activityfor the Seven Day Follow-up
Collaborative PIP
Magellan Behavioral Services
January 11, 2012

Subgroups The subgroups identified in the overall population for
the seven day follow-up collaborative PIP were:
We identified subgroups for the PIP using the top five axis 1 diagnosis codes found in follow-up detail for the time period of 1/1/2011 to 9/30/2011 by quarter. We decided on this time period to see if there was a correlation between a change in medical necessity criteria that was implemented over the summer and follow-up rates.

The report is a combination of PMHP areas 2, 4, 9, & 11.
The five diagnoses used were 295.34295.70296.90311, and 314.01.

Availability of Data
Were the data for the identified subgroups available, complete, and accurate?
Yes, the data is accurate and complete according to HEDIS requirements
Was it adequate for analysis?
Yes

What was the approximate proportion of the subgroups to the overall population for the PIP?
• The total % of the combined subgroups from the total population is 42%.
• The 5 subgroup percentages are detailed in the results table.

• The total population denominator was considered anyone who was discharged from inpatient that fit the HEDIS requirements.
• The total population numerator was anyone who had a follow-up appointment within 7 days of discharge that fit the HEDIS requirement.

• To determine the subgroup % of the population, the number of enrollees discharged with each diagnosis code was divided by the overall number of enrollees discharged (total population denominator).

Analysis Results
Why did the subgroups make sense for your plan?
The Subgroups identified are plausible for this plan as there is a sufficient sample is each diagnosis subgroup.
• Did the subgroups you originally selected require additional grouping?
We do not currently believe the subgroups require additional grouping. However, further research into the highest and lowest scoring subgroups may be needed as determined by the clinical team.
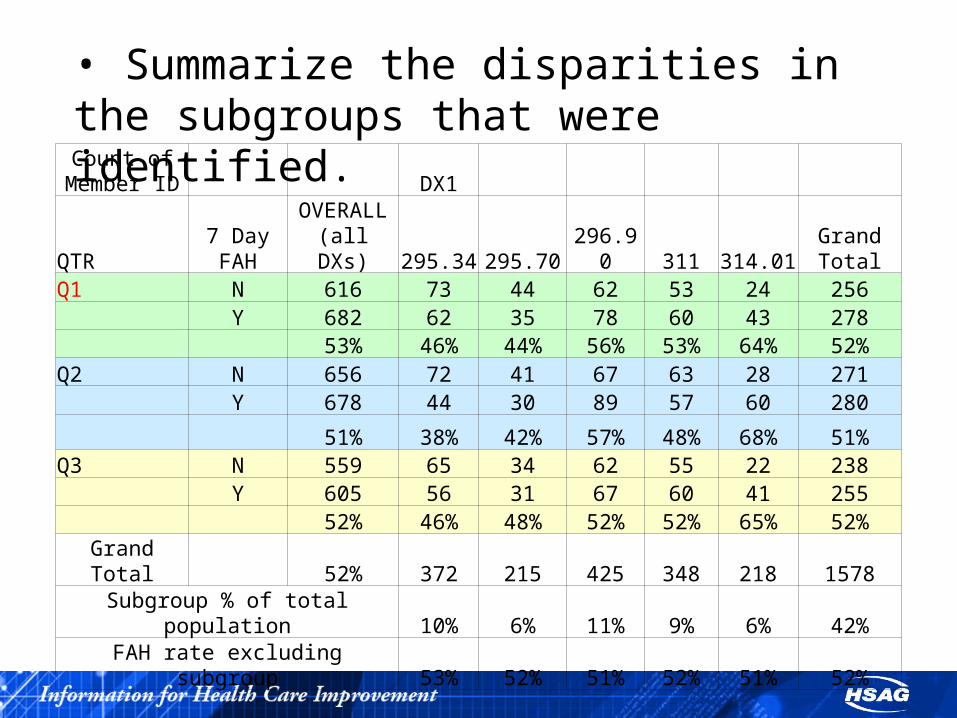
• Summarize the disparities in the subgroups that were identified.Count of
Member ID DX1
QTR7 Day FAH
OVERALL (all DXs)
295.34 295.70 296.90 311 314.01Grand Total
Q1 N 616 73 44 62 53 24 256 Y 682 62 35 78 60 43 278 53% 46% 44% 56% 53% 64% 52%Q2 N 656 72 41 67 63 28 271 Y 678 44 30 89 57 60 280
51% 38% 42% 57% 48% 68% 51%Q3 N 559 65 34 62 55 22 238 Y 605 56 31 67 60 41 255 52% 46% 48% 52% 52% 65% 52%Grand Total 52% 372 215 425 348 218 1578
Subgroup % of total population 10% 6% 11% 9% 6% 42%FAH rate excluding subgroup 53% 52% 51% 52% 51% 52%
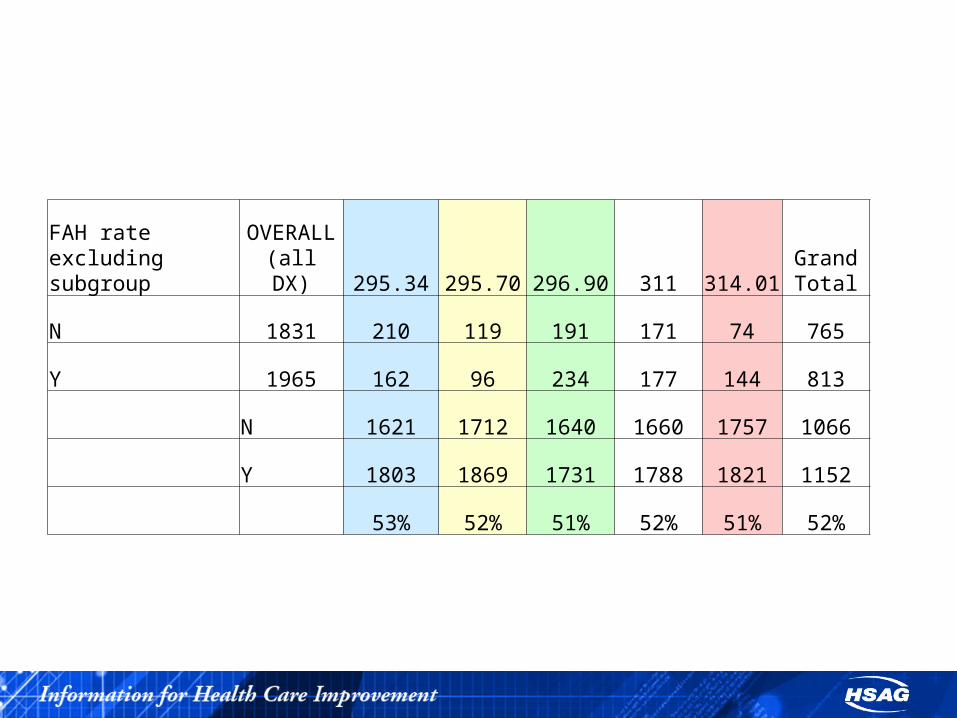
FAH rate excluding subgroup
OVERALL (all DX) 295.34 295.70 296.90 311 314.01
Grand Total
N 1831 210 119 191 171 74 765
Y 1965 162 96 234 177 144 813
N 1621 1712 1640 1660 1757 1066
Y 1803 1869 1731 1788 1821 1152
53% 52% 51% 52% 51% 52%

Improvement Strategies Do your identified subgroups have unique
causes/barriers? What interventions have been implemented or
could be implemented to address the causes/barriers?
Members with thought disorders (295.34 and 295.70) have lower follow up rates. This is most likely due to the nature of these disorders. These members tend to be more disorganized in their thinking, have a lack of insight into their illness and therefore not acknowledging that follow up treatment is needed, and have less stable or no natural support systems.
Causes/Barriers and Interventions by Diagnosis
Interventions for these subgroups (295.34 and 295.70) would be to involve any and all support systems in the discharge planning process, prior the member being discharged from the inpatient facility to better assist the member in complying with the discharge plan. Additionally, Magellan staff could provide added follow up assistance by care management staff, follow up specialists in the form of welcome home calls and appointment reminder calls. In some areas of the State of Florida, a field care worker or peer specialist may be available to assist in helping the member in reinforcing the discharge plan and linking with an outpatient provider.
Causes/Barriers and Interventions by Diagnosis
Members with mood disorders (296.9 and 311) had higher follow up rates than those with thought disorders. These members tend to have more insight into their illness, may have a support system in place, though may have apathy toward complying with follow up treatment.

Interventions for this subgroup (296.9 and 311) would entail more outreach efforts by care management staff with training in motivational interviewing to engage the member and encourage/support compliance with the discharge plan. Additionally, in areas of the State, a field care worker or peer specialist is available to provider added support and encouragement to comply with the discharge plan.

Members with diagnosis code 314.01 had the highest follow up rate of the subgroups. This may be attributed to the fact that members with this diagnosis are mostly children and have a legal guardian/caretaker who can assist them in complying with the discharge plan. These support systems also have a vested interest in treatment.
Causes/Barriers and Interventions by Diagnosis

Interventions for this subgroup, 314.01, would entail assistance in complying with the outpatient appointment. Reminder calls and assistance in rescheduling the follow up appointment due to schedule conflicts would yield the best results.

• If applicable, discuss how the subgroups and/or barriers were or will be prioritized.
The subgroups are ranked in order of priority in #8 as are barriers for each subgroup.
Improvement Strategies
Lessons Learned Has this exercise provided insight into your
plan’s seven day follow-up PIP rates? Why or why not? As expected, thought disorders have the lowest follow up rates. This exercise has allowed Magellan to focus on this (and other subgroups) upon admission to ensure discharge planning incorporates extra outreach attempts.
Future plans: Increase outreach and reminder calls to these populations.

Interventions (Optional) Provide information on an intervention that
your PMHP has implemented for the seven day follow-up collaborative PIP.
Why do you think that this intervention has been effective?
Has the effectiveness of this intervention been tested?
Was improvement in the PMHP’s rate of seven day follow-up attributed to this intervention?
Provide information on an intervention that your PMHP has implemented for the seven day follow-up collaborative PIP.
During the years there has been many interventions to improve the follow up appointment rates in all areas. One of the most effective at the moment is the implementation of Bridge appointments which we started to work on in February 2011. We started to receive authorizations requests in March with the majority of them from Jackson Memorial Hospital.
Has the effectiveness of this intervention been tested?
In July 2011 Emerald Coast, from PMHP Area 2, agreed to participate in the Bridge Program and by August it has facilitated 29 appointments. This is more than all other providers year to date.
Area 2 increased the follow up rate from 43% in 2010 46% by June 30th, 2011 73% in August 70% in September
and 84% in October.
Area 2 has the biggest increase in rates

One of our biggest barriers is the lack of follow up from discharging providers. By implementing the Bridge program we have been able to increase the follow up rates in the areas where providers are participating by improving coordination of follow up appointments.
Why do you think that this intervention has been effective?

Was improvement in the PMHP’s rate of seven day follow-up attributed to this intervention?
It is clear that for PMHP Area 2 the Bridge Program has contributed to the increase in follow up rates. We are working to increase providers “enrollment" in this program in all areas, and to encourage providers that have agreed to participate to increase their activities.
Other Interventions In 2011 we have instituted other
interventions that have directly contributed to the increase in follow up rates by 14%: - - Welcome Calls to each discharged patient to ensure they have a follow up appointment and to encourage attendance to the appointment.
- Outreach to transportation services in the areas of highest utilization of inpatient and crisis unit services.

- Follow up specialists are calling the CBC points of contacts regarding every child welfare admission to improve coordination of care and follow through with appointments.

PMHP Subgroup Analysis Activityfor the Seven Day Follow-up
Collaborative PIP
NFBHP & FHPJanuary 11, 2012

Subgroups
The subgroups identified in the overall population for the seven day follow-up collaborative PIP were: The five (5) distinct Contract Areas that make up NFBHP (A3)
and FHP (A5, A6, A7, A8)
Adult vs. Children
Length of Stay (LOS) - <3 vs. >8
Diagnosis (Dx) – the top three most common diagnoses associated with the discharge (Depressive Disorder NOS, Mood Disorder NOS and Schizoaffective Disorder)
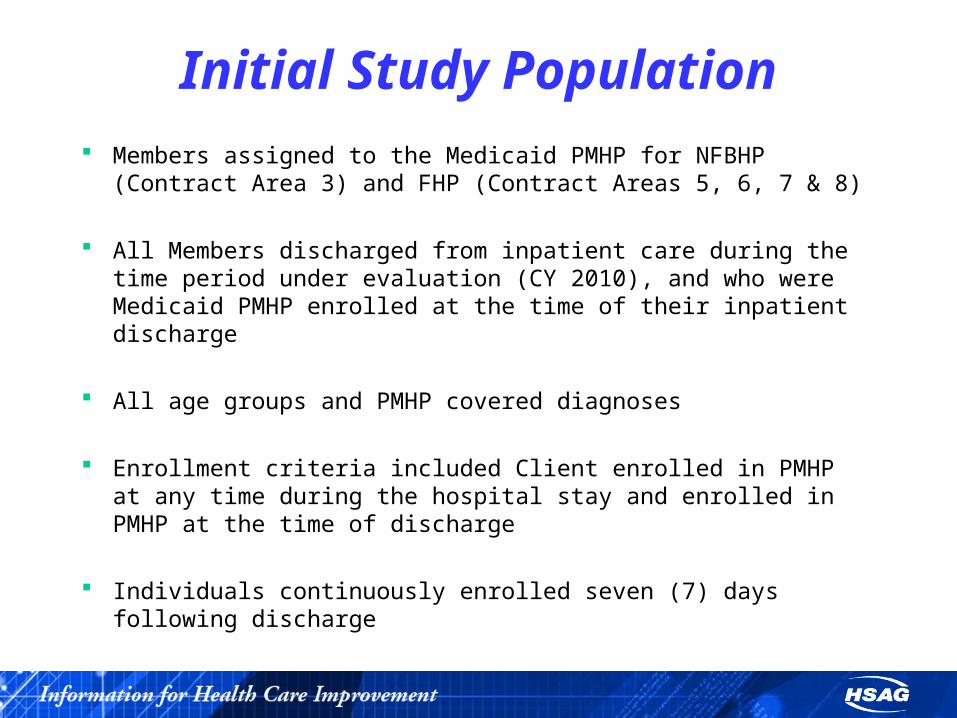
Initial Study Population Members assigned to the Medicaid PMHP for NFBHP (Contract Area
3) and FHP (Contract Areas 5, 6, 7 & 8)
All Members discharged from inpatient care during the time period under evaluation (CY 2010), and who were Medicaid PMHP enrolled at the time of their inpatient discharge
All age groups and PMHP covered diagnoses
Enrollment criteria included Client enrolled in PMHP at any time during the hospital stay and enrolled in PMHP at the time of discharge
Individuals continuously enrolled seven (7) days following discharge

Decision for Subgroups
Opportunity to present data across ValueOptions five (5) Contract Areas and complete a comparison as sub-groups
To identify if Children played a role in the outcome of 7-day followup as they make up the majority of ValueOptions current PMHP Membership
To identify if length of stay plays a role in compliance with outpatient follow-up (Average Length of Stay for discharges during the timeframe evaluated was 4.4)
To determine if the most common diagnoses identified with discharge affects Member follow-up

Availability of Data Data pulled for the timeframe of Jan-Dec 2010 from claims data for paid
inpatient treatment with a d/c date that fell within the timeframe analyzed
Examination of encounter and claims data to determine if a qualified follow-up service occurred within seven (7) days.
Data was available as it was pulled and analyzed well after the 90 days claims run to ensure appropriate claims lag.
ValueOptions monitors encounter data reported by Network Providers using Monthly Provider Reports that confirms the number of encounters/records received.
Providers are required to submit Encounter data within specific timeframes. Two performance standards are established for timely submission: 76% of Encounters submitted within 14 days from date of services and/or
90% of Encounters submitted within 30 days from date of services

Availability of Data Network Providers submit Encounter data to ValueOptions Connects
platform, FileConnect.
Once Encounters hit ValueOptions system, encounters are examined with a variety of VEDS edits for completeness and accuracy.
One of the many VEDS process checks includes ensuring the Dx and procedure codes submitted meet Medicaid contract specifications.
For those Encounters that ‘fail’ the examination process, a detailed error report is generated and sent to the Network Provider for correction and resubmission.
Analysis of encounter data submissions reveals that encounter data on average is 97.5% complete.

Proportion of Subgroup to overall population
Contract Areas 30% of the total number of
D/C’s is Contract Area 3
29% of the total # of 7-day F/U’s was in Contract Area 3
Area 7 made up 22% of the total discharges in the initial population with 19% of those total discharges following up within 7 days

Proportion of Subgroup to overall population
Adult vs. Child 61% of the total # of
discharges were Adults
39% of the total # of discharges were Children with 55% of them following up within 7-days
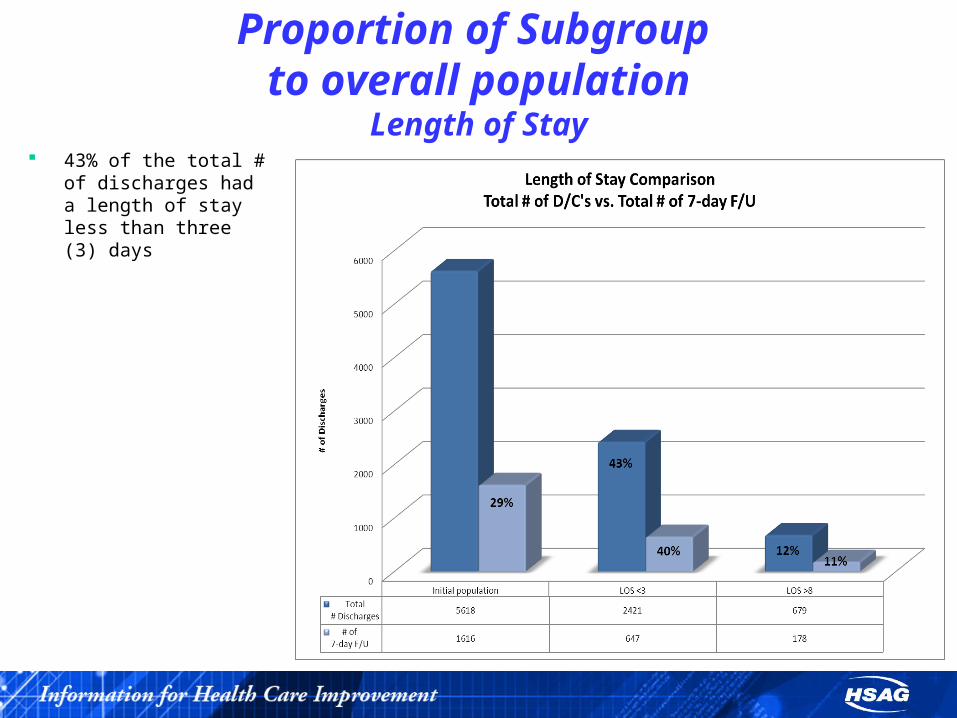
Proportion of Subgroup to overall population
Length of Stay 43% of the total # of
discharges had a length of stay less than three (3) days

Proportion of Subgroup to overall population
Diagnoses The top three most common
diagnoses associated with the total # of discharges were:
Depressive Disorder NOS Mood Disorder NOS Schizoaffective Disorder
Depressive and Mood D/O NOS each made up 14% of the total # of discharges
Mood D/O NOS had 18% of the total # of 7-day follow up
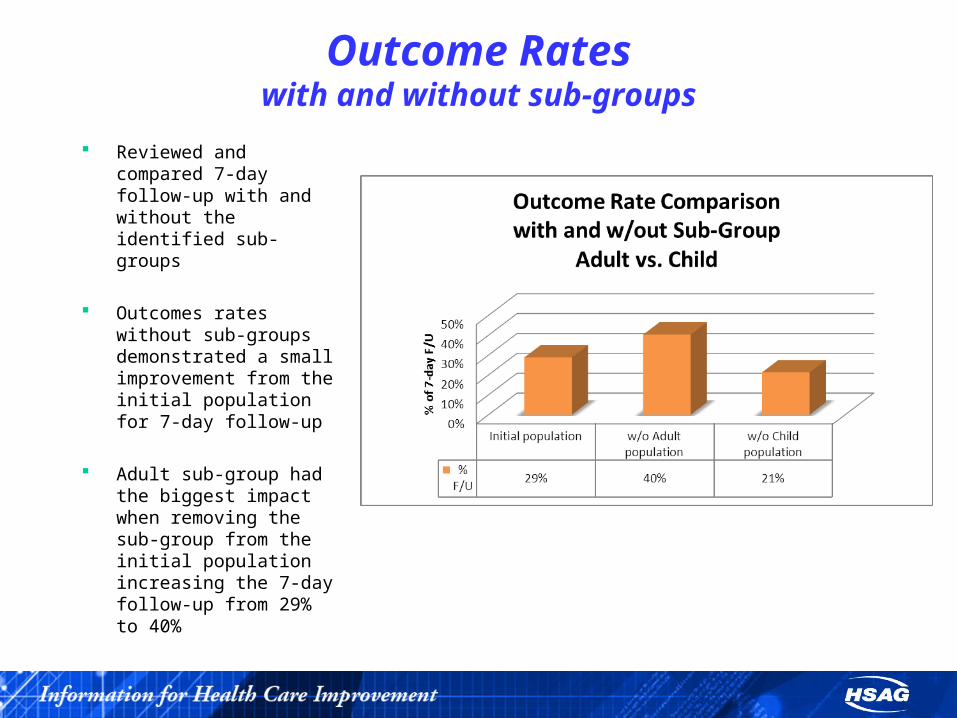
Outcome Rateswith and without sub-groups
Reviewed and compared 7-day follow-up with and without the identified sub-groups
Outcomes rates without sub-groups demonstrated a small improvement from the initial population for 7-day follow-up
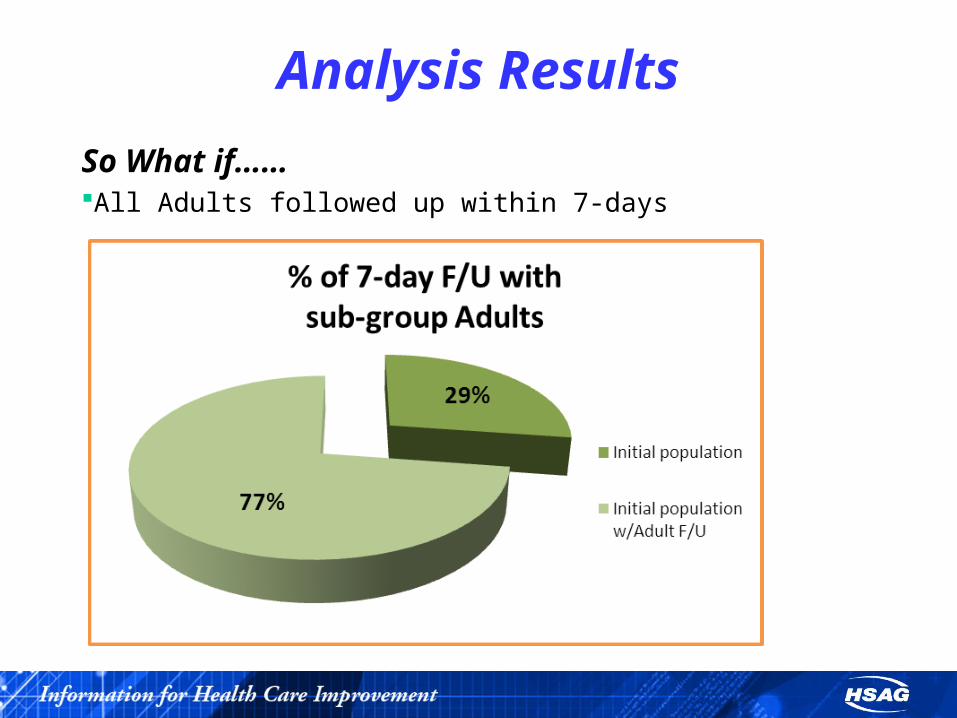
Adult sub-group had the biggest impact when removing the sub-group from the initial population increasing the 7-day follow-up from 29% to 40%
Analysis Results
Why this makes sense to ValueOptions
VO covers 34 counties across Florida
Wanted to consider Contract Areas as a ‘sub-group’ to identify potential discrepancies
VO monitors and manages the five distinct Contract Areas the same
Majority of VO’s population served is children
Medical Management Program that encompasses outlier management

Analysis Results
Disparities
In comparing sub-groups, we identified the greatest disparity in Adults with a discharge that did not have a 7-day follow-up compared to the other sub-groups analyzed.
Contract Area 7 showed a significant disparity in comparison to the other Contract Areas as they had the second highest number of total discharges with a disproportionate amount of discharges that did not have a 7-day follow-up.

Analysis Results
Additional GroupingArea 7 had the most statistically significant impact among the five contract areas on the overall percentage for 7-day follow upSub-grouped Area 7 to identify other potential patterns/trends
Adult vs. Child Length of Stay Diagnosis Provider
910 Area 7 individuals did not follow through with 7-day follow upOf those that did not follow through with 7-day follow-up
40 Unique Hospitals discharged Area 7 individuals where there was no 7-day follow-up;
One specific Network Provider had 435 or 48% out of the 910 discharges where there was no follow-up within 7-days;
And of those 435, 75% or 325 were Adults; 40% or 176 had a length of stay of less than three (3) days and 83 or 19% had a diagnosis of Mood Disorder NOS

Analysis Results
Additional Grouping con’tAdults (vs. Children) were identified as being the majority of discharges but also the majority who did not follow-up within 7 daysOf the 3412 total Adult Discharges, 2685 or 67% did not have a 7-day follow-upSub-grouped the Adult population to look at possible causes
Contract Area Provider Diagnosis
Area 3 had the most discharges at 840 (31%) where there was no 7-day follow upOne specific Network Provider had the majority of discharges with no 7-day follow up (431or 51% out of the 840)Most common diagnosis Depressive Disorder NOS

Analysis Results
So What if………All of Contract Area 7 Members followed up within 7-days
Analysis Results
So What if……All Adults followed up within 7-days
Improvement Strategies
Unique causes/barriers?Appears that similarities were found in each of the sub-group analysesAlthough Area 3 had the most discharges with 7-day follow-up out of the five Contract Areas, it was also identified as having a significant impact with Adult discharges with no 7-day follow-upThis is likely due to the fact that Contract Area 3 has the largest Membership out of all Contract Areas for VOAdults, LOS and Diagnosis all kept trending out in the sub-group analysisDifficult to effectively analyze or determine unique causes/barriers as the primary source of information is administrative data (claims or encounter data)Clinical Record Reviews may be able to provide more insight to unique causes or barriers

Improvement StrategiesPossible InterventionsMember Outreach to those identified sub-groupsEducational Opportunities for Clinical Care Managers (CCMs) in VO’s Call Center about sub-groups identified for care management purposesProviding Outlier Reports to CCMs for ongoing monitoringRe-educating Network Providers about their monthly Discharge Detail and Outlier ReportsIndividual Network Provider education about sub-group analysis resultsDevelop sampling group from 2010 discharges for Provider Outreach to determine which discharges might have been result of Baker Act or substance abuse componentTargeted Clinical Record Reviews on sub-groups

Lessons Learned Still requires a more in-depth look outside of administrative data to
determine a possible root-cause
Insightful in that often times you are aware of many of the identified sub-groups and their potential issues but not always able to put the ‘pieces of the puzzle’ together
Identified a need to bring these ‘pieces of the puzzle’ together to obtain a more accurate picture
Recognize that sub-group analysis helps you to identify over ‘avenues’ or possible interventions to improve the outcome for 7-day follow up

Lessons Learned
Plans……Review and discussion of Sub-group Analysis in Senior Quality Committee (SQC) for possible recommendations
Inform Network Providers of Sub-Group Analysis