Integration of High Reliability Distribution System in Microgrid Operation

Maintenance scheduling and planning:
City of Tshwane Experience
PM Tlabela
Director: Distribution Operation South
28th October 2008
12h00

Acknowledgement
Paper has been co-authored by Mr.
Frans Manganye: Deputy Director –
Rosslyn Distribution Operations in the
City of Tshwane

Purpose
• To share the City of Tshwane’s
experience with regard to Maintenance
Planning and Scheduling in the
distribution of electricity

Table of Contents
• Background
• Distribution Depots
• Types of Maintenance
– Models in Maintenance
• System Reliability
• Maintainability
• Availability
– SAIDI
– ASAI
• Maintenance philosophy, standards and procedures
• Technological tools used in Planning and Scheduling
• Budgeting and resource allocation
• Maintenance Management Plan
• Lessons learned

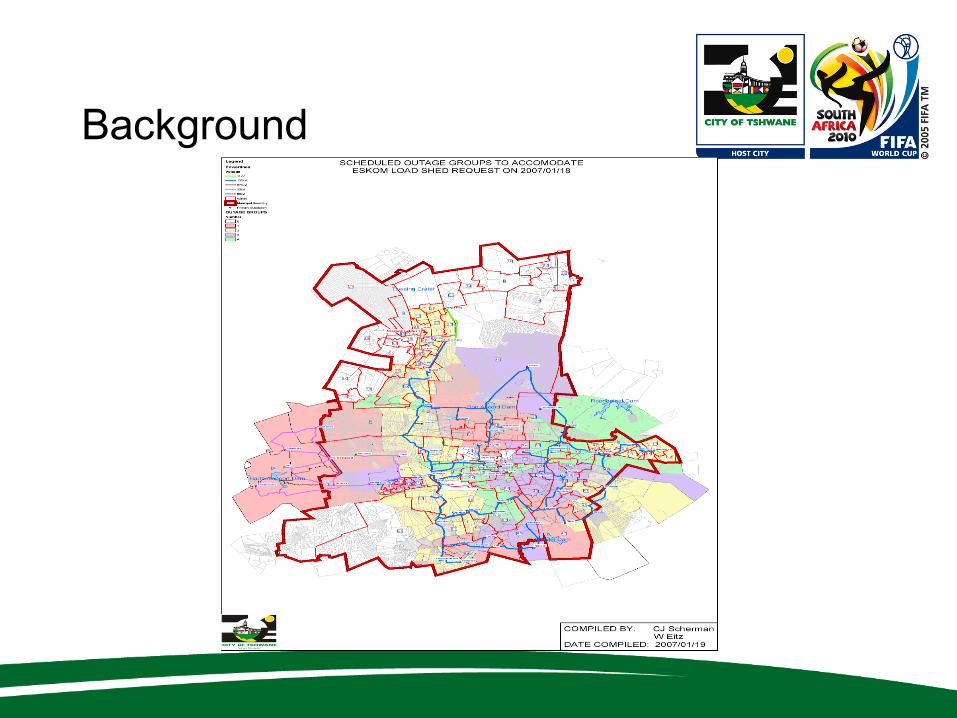
Background
• The City of Tshwane Metropolitan Municipality was formed in 2000 by the amalgamation of 13 councils incorporating:
• Greater Pretoria Metropolitan Council,
• City Council of Pretoria,
• Town Council of Centurion,
• Northern Pretoria Metropolitan Substructure,
• Hammanskraal Local Area Committee,
• Transitional Representative Councils of :
– Mabopane,
– Ga-Rankuwa,
– Winterveldt,
– Temba,
– Pienaarsrivier
– Crocodile River,
• Portions of the Eastern and Western Gauteng Services Councils and,
• Portions of the Eastern District Council
Background
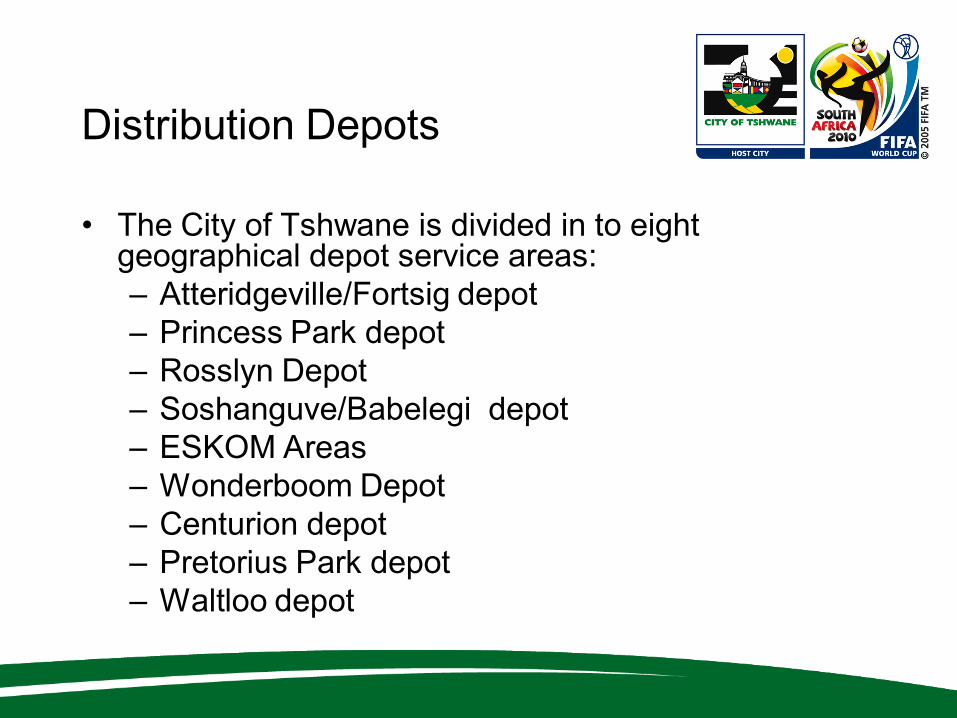
Distribution Depots
• The City of Tshwane is divided in to eight geographical depot service areas:
– Atteridgeville/Fortsig depot
– Princess Park depot
– Rosslyn Depot
– Soshanguve/Babelegi depot
– ESKOM Areas
– Wonderboom Depot
– Centurion depot
– Pretorius Park depot
– Waltloo depot

Depot Functions
• Safety
• Breakdowns,
– System failure
– Theft
• Repairs and maintenance
• Depot Management
– Personnel
– Funds
– Materials

Types of maintenance
• There are three types of maintenance i.e. corrective, preventative and refurbishment maintenance.
• The preventative maintenance is divided in to two which is either time-based or condition based.
• All these are being considered when one generates a tactical maintenance planning based on short or long term strategy.
• Among the main strategic decisions that used to be taken in maintenance is the level of maintenance that is required to achieve the maintenance objectives within the budget constraints of any organisation.

Types of maintenance

Models in maintenance
• What maintenance type or strategy should be used for an equipment or item?
• How frequently should preventative maintenance be performed?
• When should an asset be discarded or replaced?
• What spares and how many of each type should be kept in the store?

System Reliability
Function Symbol Unit
Failure density -
Reliability -
Cumulative Distribution
Function for failure (CDF)-
Failure of hazard rate
Mean Time To Failure MTTF time
)(t
)(tf
)(tR
)(tf
1time

System Reliability
• Example of Reliability calculation for the Weibull distribution:
• The failure characteristics of a switch in an electrical distribution
board have a Weibull distribution. The value of the shape
parameter, , is 3.5 and the characteristics life, , is 60 days.
Calculate the reliability of the switch after 40 days and after 80
days;
• Solution
– Reliability after 40 days:
– Reliability after 80 days:
m
785.060
40exp)40(R
5,3
065.060
80exp)80(R
5,3

System Availability
• The availability of an item can be defined as the probability that
an item will, when used under specified conditions, operate
satisfactorily and effectively.
• Availability is an extremely important attribute of any system and
comprises the reliability and maintainability of the system.
• The SAIDI of a network indicates the duration of a sustained
interruption the average customer would experience per annum.
– SAIDI=
• The ASAI represents the fraction of time (often expressed as a
percentage) that a customer has received supply during one
year.
– ASAI=
servedcustomersofnumberTotal
.a.pdurationserruptionintcustomer
.a.pdemandservicehourscustomer
.a.ptyavailabiliservicehoursCustomer

Maintainability
Function Symbol Unit
Repair density -
Maintainability -
Cumulative Distribution
Function (CDF) for repair
-
Repair rate
Mean Time To Repair MTTR
)(tm
)(tM
)(tG
)(tv1time
time

This is the industry’s current mind-set
CURRENT
PREDICAMENTTURN-AROUND
THRUST
SUSTAINABLE
GROWTH
Logistical Business
System ControlCircumstantial
Management
“Fix-it” Mentality
Planned & Predictable
“Fire Fighting
Maintenance”
Preventive
Maintenance
Ad hoc
Maintenance
Maintenance
Logistics
Systems
Maintenance
Integration
Continuous
Improvement
Availability
Life Cycle
Profit
Depot Operations
Asset Condition
Monitoring
Asset Condition
Management
ISO (9000+14000)
MAINTENANCE MANAGEMENT

Maintenance Philosophy, Standards
and Procedures of City of Tshwane
• For the distribution network i.e. 11kV to 220v the
following categories are applied as far as
maintenance is concerned:
• Public lighting
– Streetlights
– High mast lights
• Substations
• Overheads
• Cables

Technological tools used in Planning
and Scheduling
• SAP PM
• PowerMap
– Abnormals Management
– Log sheets
– Resource allocation
• Standby
• Overtime
– Safety management
– Record management

Budgeting and Resources
Allocation
• This is model used by the depots to
allocate resources like funds, artisans,
vehicles to specific tasks over a period.

Maintenance Management Plan
• Every year the distribution section reviews its
Management Maintenance Plan to be in line with the
budgeted requirements and compatible with all the
programs such as SAP PM, etc.
• However, some distortion is been encountered due to
escalation in theft of copper conductors which runs in
the region of R22 million.

2007
Month Incidents Value
January 206 R2,894,405.00
February 177 R2,001,988.00
March 273 R2,461,640.00
April 199 R1,608,277.00
May 206 R1,145,352.00
June 155 R1,113,366.00
July 184 R883,572.00
August 164 R749,900.00
September 143 R777,365.00
October 152 R682,297.00
November 165 R649,100.00
December 47 R451000.00
Total 2071 R15,438,212.00

2008
January 127 R 712,445.00
February 194 R 945,964.00
March 209 R 955,162.00
April 215 R 720,001.00
May 183 R 978,981.00
June 184 R 758,095.00
Total 1112 R 5,070,648.00
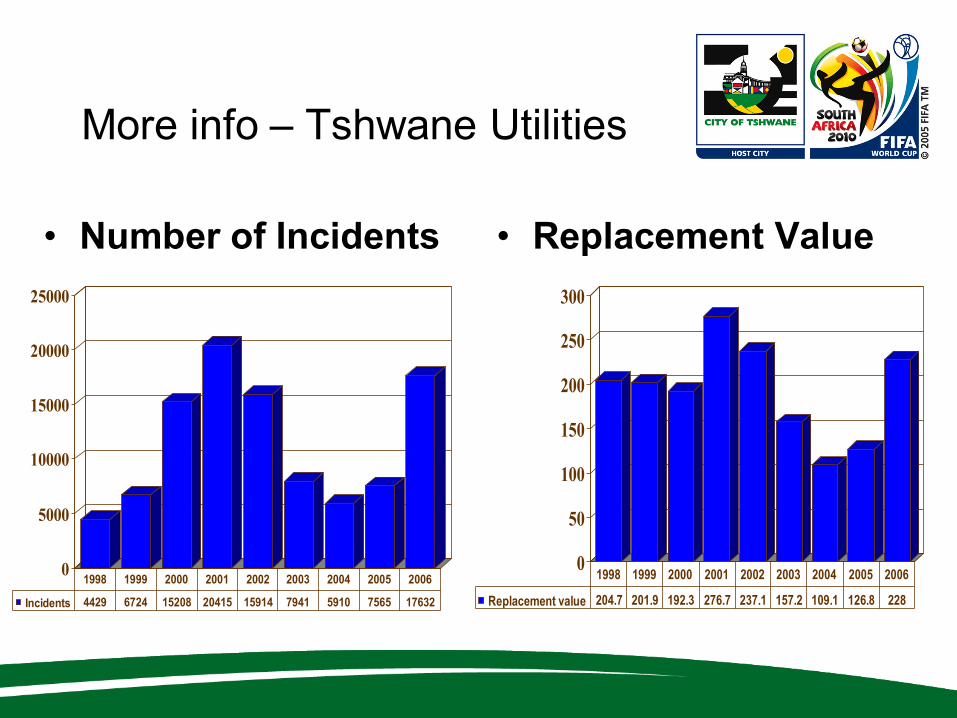
More info – Tshwane Utilities
• Number of Incidents • Replacement Value
0
5000
10000
15000
20000
25000
Incidents 4429 6724 15208 20415 15914 7941 5910 7565 17632
1998 1999 2000 2001 2002 2003 2004 2005 20060
50
100
150
200
250
300
Replacement value 204.7 201.9 192.3 276.7 237.1 157.2 109.1 126.8 228
1998 1999 2000 2001 2002 2003 2004 2005 2006

Lessons Learned
• System availability index of over 95%.
• Good abnormal situation management e.g. repairs any 11Kv fault with 24hours of fault and put to service.
• Ensure that the MMP is interactive and is modified in line with new assets being added to the network.
• A 50% asset replacement value be used as a benchmark for maintenance budget.
• Refurbishment program to be catered for e.g. a 3,5% - 4% budget for the program.
• Routine checks under preventative maintenance should be done despite all other challenges
• A certain percentage should be collected from the tariffs for maintenance purpose. This will help and prevent National blackouts.
• The construction division should at all time communicate and work together with the maintenance division in order to ensure the Maintainability of the system not be compromised.

Thank You
Questions ! ?

The maintenance systemThe maintenance system DoMaintenance
Work
ActivateMaintenance
Work
DevelopMaintenance
Strategy
DetermineEquipmentImportance
DevelopMedium-term
Plan
DevelopBusiness
Plan
DevelopProduction
Plan
MaintainInfrastructure
PlanInfrastructure
MeasureWork &Improve
ImprovementAdministration
Work management cycle
MeasureInfrastructure
& Improve
Infrastructure management cycle
ProvideResources
MeasurePerformance
& Improve
Asset management cycle
DevelopPeople
MaintainOrganisation
Structure
MeasureOrganisation
HUM & improve
Organisation management cycle
ProduceProduce
Measure
Safety &
Improve
Maintain Safety
Awareness
Methodology (SAM)
Do Safety
Awareness Field
Education (SAFE)
Safety management cycle
Asset Management in process flow