PLOTCON NYC: The Future of Business Intelligence: Data Visualization
Upload
plotlyCategory
view
111download
0
Data Visualization at the Office of Financial Research (OFR)
Warren ReedNovember 15th, 2016
Views expressed in this presentation are those of the speaker(s) and not necessarily of the Office of Financial Research.

Views expressed in this presentation are those of the speaker(s) and not necessarily of the Office of Financial Research.2
Agenda
• About Me• About OFR & Monitors Program• Data Visualization at OFR• OFR Product Demo• Q&A

Views expressed in this presentation are those of the speaker(s) and not necessarily of the Office of Financial Research.3
About Me
• Warren Reed–Data Scientist; U.S. Treasury’s Office of Financial Research–Monitors Program Lead–Background in Engineering, Finance, and Data Science
• Contact Me–Email: [email protected]

Views expressed in this presentation are those of the speaker(s) and not necessarily of the Office of Financial Research.4
About OFR
•Mission–The OFR helps to promote financial stability by looking across the financial system to measure and analyze risks, perform essential research, and collect and standardize financial data.
•Dodd-Frank Act–The 2010 Dodd-Frank Act established the OFR to support the Financial Stability Oversight Council, the Council’s member organizations, and the public.
Views expressed in this presentation are those of the speaker(s) and not necessarily of the Office of Financial Research.5
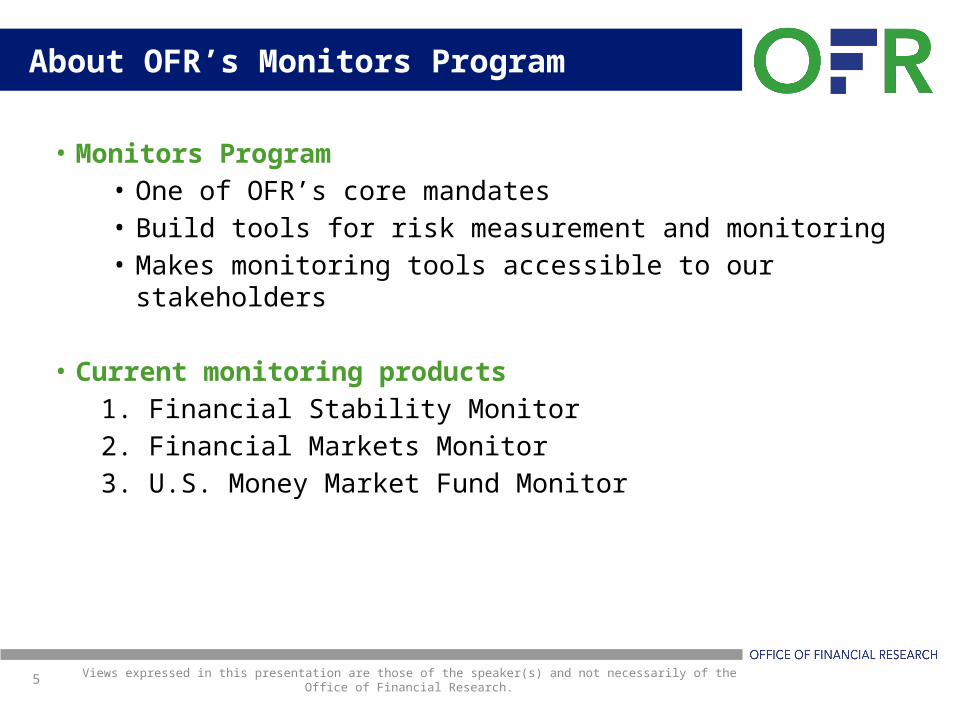
About OFR’s Monitors Program
• Monitors Program • One of OFR’s core mandates • Build tools for risk measurement and monitoring• Makes monitoring tools accessible to our stakeholders
• Current monitoring products1. Financial Stability Monitor2. Financial Markets Monitor3. U.S. Money Market Fund Monitor

Views expressed in this presentation are those of the speaker(s) and not necessarily of the Office of Financial Research.6
Financial Stability Monitor
Key financial stability risk indicators heat map
Source: financialresearch.gov
Views expressed in this presentation are those of the speaker(s) and not necessarily of the Office of Financial Research.7
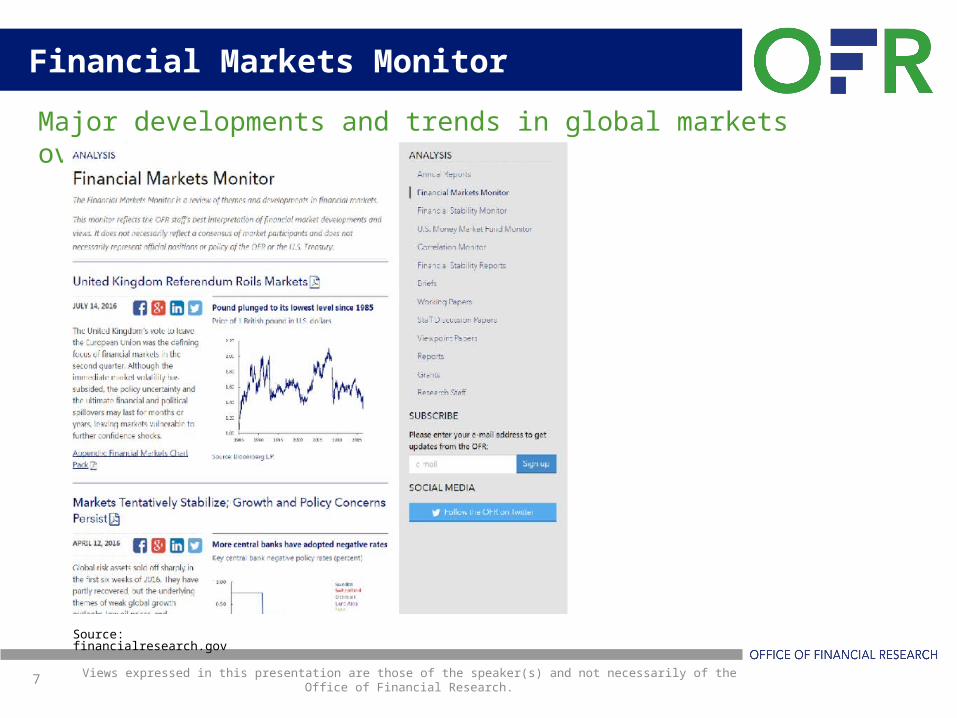
Financial Markets Monitor
Major developments and trends in global markets overview
Source: financialresearch.gov

Views expressed in this presentation are those of the speaker(s) and not necessarily of the Office of Financial Research.8
U.S. Money Market Fund MonitorExamine various dimensions of U.S. money market funds with interactive visualizations
Source: financialresearch.gov

Views expressed in this presentation are those of the speaker(s) and not necessarily of the Office of Financial Research.9
Leveraging Data Visualization
Use Case: U.S. Money Market Fund Monitor

Views expressed in this presentation are those of the speaker(s) and not necessarily of the Office of Financial Research.10
Understand the Problem Domain
• Runs on U.S. Money Market Funds (MMFs) were a contributing factor to the global financial crisis
• 2010 U.S. Money Market Reform mandated new data reporting (Form NMF-P) for all U.S. MMFs
• The form contains data elements with lots of attribution-level detail on each U.S. Money Market Fund
• OFR built a monitoring tool to unlock insights into this industry by using this dataset

Views expressed in this presentation are those of the speaker(s) and not necessarily of the Office of Financial Research.11
Understand the Problem Domain
Source: SEC Source: TibcoSource: OFR
Raw Data XML Datamart

Views expressed in this presentation are those of the speaker(s) and not necessarily of the Office of Financial Research.12
Understand what questions to ask
Understand perspectives on U.S. Money Market Funds:
1. How can we better understand the risks in the U.S. MMF industry?
2. How can we track individual funds and the market as a whole?
3. How can we present this data to our stakeholders?

Views expressed in this presentation are those of the speaker(s) and not necessarily of the Office of Financial Research.13
Understand what questions to ask
Source: financialresearch.gov

Views expressed in this presentation are those of the speaker(s) and not necessarily of the Office of Financial Research.14
Designing and developing with constraints
Technology Stack

Views expressed in this presentation are those of the speaker(s) and not necessarily of the Office of Financial Research.15
Designing and developing with constraints
• Show data• Avoid distorting data• Present many numbers in a small space• Make a large dataset coherent• Reveal data at several levels of detail
Design Principles
Source: financialresearch.gov

Views expressed in this presentation are those of the speaker(s) and not necessarily of the Office of Financial Research.16
Demo
OFR Product Demo

Views expressed in this presentation are those of the speaker(s) and not necessarily of the Office of Financial Research.17
Q&A
Q&A