Plos One 2009 Song
15
Modeling and Analysis of the Molecular Basis of Pain in Sensory Neurons Sang Ok Song, Jeffrey Varner* School of Chemical and Biomolecular Engineering, Cornell University, Ithaca, New York, United States of America Abstract Intracellular calcium dynamics are critical to cellular functions like pain transmission. Extracellular ATP plays an important role in modulating intracellular calcium levels by interacting with the P2 family of surface receptors. In this study, we developed a mechanistic mathematical model of ATP-induced P2 mediated calcium signaling in archetype sensory neurons. The model archit ecture, which described 90 specie s connec ted by 162 interactions, was formula ted by aggreg ating disparate molecular modules from literature. Unlike previous models, only mass action kinetics were used to describe the rate of molecul ar interaction s. Thus , the majority of the 252 unknown model parame ter s wer e either associ ati on, dissociation or catalytic rate constants. Model parameters were estimated from nine independent data sets taken from multiple laboratories. The training data consisted of both dynamic and steady-state measurements. However, because of the complexity of the calcium network, we were unable to estimate unique model parameters. Instead, we estimated a family or ensemble of probable parameter sets using a multi-objective thermal ensemble method. Each member of the ensemble met an error criterion and was located along or near the optimal trade-off surface between the individual training data sets. The model quantitat ively reproduc ed experimental measurements from dorsal root gangli on neurons as a function of extracellular ATP forcing. Hypothesized architecture linking phosphoinositide regulation with P2X receptor activity explained the inhibition of P2X-mediated current flow by activated metabotropic P2Y receptors. Sensitivity analysis using individual and the whole system outputs suggested which molecular subsystems were most importa nt following P2 activation. Taken together, modeling and analysis of ATP-induced P2 mediated calcium signaling generated qualitative insight into the critical interactions controlling ATP induced calcium dynamics. Understanding these critical interactions may prove useful for the design of the next generation of molecular pain management strategies. Citation: Song SO, Varne r J (2009) Modeling and Anal ysis of the Molecular Basis of Pain in Senso ry Neur ons. PLoS ONE 4(9): e6758. doi:10 .137 1/ journal.pone.0006758 Editor: Jean Peccoud, Virginia Tech, United States of America Received May 20, 2009; Accepted July 23, 2009; Published September 11, 2009 Copyright: ß 2009 Song, Varner. This is an open-access article distributed under the terms of the Creative Commons Attribution License, which permits unrestricted use, distribution, and reproduction in any medium, provided the original author and source are credited. Funding: The authors acknowledge the gracious financial support of the Office of Naval Research (ONR) Grant #N00014-06-1-0293 to J.D.V for the support of S.O.S. This work was also partially supported by the Korea Research Foundation Grant funded by the Korean Government (MOEHRD) (KRF-2005-214-D00249). The Office of Naval Research and the Korea Research Foundation had no role in study design, data collection and analysis, decision to publish, or preparation of the manuscript. Competing Interests: The authors have declared that no competing interests exist. * E-mail: [email protected] Introduction Milli ons worldwid e suffer daily from acute and chronic pain. Extracellular ATP plays an important role in pain transduction in both the periphery and central nervous systems. ATP released from damag ed tissu e can acti vate senso ry recep tors (nocicept ors) and contribute to increased pain sensitivity [1]. Subcutaneous admin- is tr at ion of ATP or it s anal og a,b{ methylene ATP ( a,b{ meATP) has been lin ked with pai n in ani mal s and humans [2– 5]. ATP initiates pain by interacting with the P2 family of surface receptors. P2 receptors can be divided into ionotropic P2X receptors (ligand- gated ion chann els) and metab otrop ic P2Y Gq-pr otei n couple d receptors. This classification is based on molecular structure and signal transduction mechanism [6,7]. Activated P2 receptors are either directly (P2X) or indirectly (P2Y) responsible for the transport of cal ciu m int o the cyt osol. Int rac ell ula r cal ciu m lev els are impor tant in sever al neuro nal funct ions like trans mitt er rele ase, membrane excitability and protein/gene regulation [8–13]. Calci- um leve ls are also i mpor tant in cell proli ferat ion, diffe renti ation , and death programs [14]. P2 receptors have been implicated in pain transmission in the perip heral and centr al nervo us syste ms. Diff erent P2X recep tor subtype s e.g., P2X3 and P2X2/ 3 are localiz ed on capsicaic in- sensi tive , isol ecti n B 4 (IB 4 ) bindin g, sma ll- siz ed Dor sal Roo t Ganglion (DRG) neurons [15,16]. These receptors are involved in severa l pain states inclu ding migr aine headache s [17– 22]. ATP activates P2X receptors by binding, leading to slowly (P2X2/3) and rapidly (P2X3) desensitizing transmembrane currents [23]. Con- verse ly, P2Y recep tors transduce signals through a Gq-co upled protein cascade leading to IP3-IP3R channel activation [7]. P2Y2 receptors are equipotently activated by both ATP and UTP in a vari ety of cell types [7,24 –26] . Eigh t diffe rent P2Y recep tors have been identified in humans [7]. P2Y1 and P2Y2 receptors are highly expressed in small DRG sensory neurons [27], medium and large- size sensory neurons [24,28,29] and linked with action potential in afferent nerve fibers [30,31]. However, their role in P2X regulation or the transmission of pain signals remains unclear. Results In this study, we developed a mechanistic mathematical model of P2 driven calcium signaling in archetype sensory neurons. The model architecture, which described 90 species connected by 162 interactions, was formulated by aggregating disparate molecular PLoS ONE | www.plosone.org 1 September 2009 | Volume 4 | Issue 9 | e6758
-
Upload
sang-ok-song -
Category
Documents
-
view
241 -
download
0
Transcript of Plos One 2009 Song

8/9/2019 Plos One 2009 Song
http://slidepdf.com/reader/full/plos-one-2009-song 1/15
Modeling and Analysis of the Molecular Basis of Pain inSensory Neurons
Sang Ok Song, Jeffrey Varner*
School of Chemical and Biomolecular Engineering, Cornell University, Ithaca, New York, United States of America
Abstract
Intracellular calcium dynamics are critical to cellular functions like pain transmission. Extracellular ATP plays an importantrole in modulating intracellular calcium levels by interacting with the P2 family of surface receptors. In this study, wedeveloped a mechanistic mathematical model of ATP-induced P2 mediated calcium signaling in archetype sensory neurons.The model architecture, which described 90 species connected by 162 interactions, was formulated by aggregatingdisparate molecular modules from literature. Unlike previous models, only mass action kinetics were used to describe therate of molecular interactions. Thus, the majority of the 252 unknown model parameters were either association,dissociation or catalytic rate constants. Model parameters were estimated from nine independent data sets taken frommultiple laboratories. The training data consisted of both dynamic and steady-state measurements. However, because of the complexity of the calcium network, we were unable to estimate unique model parameters. Instead, we estimated afamily or ensemble of probable parameter sets using a multi-objective thermal ensemble method. Each member of theensemble met an error criterion and was located along or near the optimal trade-off surface between the individual trainingdata sets. The model quantitatively reproduced experimental measurements from dorsal root ganglion neurons as afunction of extracellular ATP forcing. Hypothesized architecture linking phosphoinositide regulation with P2X receptor
activity explained the inhibition of P2X-mediated current flow by activated metabotropic P2Y receptors. Sensitivity analysisusing individual and the whole system outputs suggested which molecular subsystems were most important following P2activation. Taken together, modeling and analysis of ATP-induced P2 mediated calcium signaling generated qualitativeinsight into the critical interactions controlling ATP induced calcium dynamics. Understanding these critical interactions mayprove useful for the design of the next generation of molecular pain management strategies.
Citation: Song SO, Varner J (2009) Modeling and Analysis of the Molecular Basis of Pain in Sensory Neurons. PLoS ONE 4(9): e6758. doi:10.1371/ journal.pone.0006758
Editor: Jean Peccoud, Virginia Tech, United States of America
Received May 20, 2009; Accepted July 23, 2009; Published September 11, 2009
Copyright: ß 2009 Song, Varner. This is an open-access article distributed under the terms of the Creative Commons Attribution License, which permitsunrestricted use, distribution, and reproduction in any medium, provided the original author and source are credited.
Funding: The authors acknowledge the gracious financial support of the Office of Naval Research (ONR) Grant #N00014-06-1-0293 to J.D.V for the support of S.O.S. This work was also partially supported by the Korea Research Foundation Grant funded by the Korean Government (MOEHRD) (KRF-2005-214-D00249). TheOffice of Naval Research and the Korea Research Foundation had no role in study design, data collection and analysis, decision to publish, or preparation of the
manuscript.Competing Interests: The authors have declared that no competing interests exist.
* E-mail: [email protected]
Introduction
Millions worldwide suffer daily from acute and chronic pain.
Extracellular ATP plays an important role in pain transduction in
both the periphery and central nervous systems. ATP released from
damaged tissue can activate sensory receptors (nociceptors) and
contribute to increased pain sensitivity [1]. Subcutaneous admin-
istration of ATP or its analog a,b{methylene ATP ( a,b{meATP)
has been linked with pain in animals and humans [2–5]. ATP
initiates pain by interacting with the P2 family of surface receptors.
P2 receptors can be divided into ionotropic P2X receptors (ligand-gated ion channels) and metabotropic P2Y Gq-protein coupled
receptors. This classification is based on molecular structure and
signal transduction mechanism [6,7]. Activated P2 receptors are
either directly (P2X) or indirectly (P2Y) responsible for the transport
of calcium into the cytosol. Intracellular calcium levels are
important in several neuronal functions like transmitter release,membrane excitability and protein/gene regulation [8–13]. Calci-
um levels are also important in cell proliferation, differentiation, anddeath programs [14].
P2 receptors have been implicated in pain transmission in the
peripheral and central nervous systems. Different P2X receptor
subtypes e.g., P2X3 and P2X2/3 are localized on capsicaicin-
sensitive, isolectin B4 (IB4 ) binding, small-sized Dorsal Root
Ganglion (DRG) neurons [15,16]. These receptors are involved in
several pain states including migraine headaches [17–22]. ATP
activates P2X receptors by binding, leading to slowly (P2X2/3) and
rapidly (P2X3) desensitizing transmembrane currents [23]. Con-
versely, P2Y receptors transduce signals through a Gq-coupled
protein cascade leading to IP3-IP3R channel activation [7]. P2Y2
receptors are equipotently activated by both ATP and UTP in a
variety of cell types [7,24–26]. Eight different P2Y receptors have
been identified in humans [7]. P2Y1 and P2Y2 receptors are highly
expressed in small DRG sensory neurons [27], medium and large-
size sensory neurons [24,28,29] and linked with action potential in
afferent nerve fibers [30,31]. However, their role in P2X regulation
or the transmission of pain signals remains unclear.
Results
In this study, we developed a mechanistic mathematical model
of P2 driven calcium signaling in archetype sensory neurons. The
model architecture, which described 90 species connected by 162
interactions, was formulated by aggregating disparate molecular
PLoS ONE | www.plosone.org 1 September 2009 | Volume 4 | Issue 9 | e6758

8/9/2019 Plos One 2009 Song
http://slidepdf.com/reader/full/plos-one-2009-song 2/15
modules from literature [32–35]. While the interaction network
was similar (but not identical) to these previous studies, we used a
different modeling strategy to describe the kinetics and identify the
model parameters. The model described P2Y/P2X surface
receptor activation (including Gq protein signaling), Phophoinosi-
tide (PI) metabolism, ATPase pumps, Naz/Ca2z exchangers, ion
leaks and IP3R channels (Fig. 1 and Table 1). We used only
elementary mass-action kinetics to describe the rate of each
molecular interaction. The mass-action formulation, while ex-panding the dimension of the P2 calcium model, regularized the
mathematical structure. For example, each model interaction was
associated with a single parameter. The regular structure also
allowed automatic generation of the model equations and
components required for model analysis. Mass-action kinetics also
regularized the model parameters. Unknown model parameters
were one of only three types, association, dissociation or catalytic
rate constants. Thus, although mass-action kinetics increased the
number of parameters and species, they reduced the complexity of
model analysis. The one exception was the kinetics of flow through
gated channels which was parameterized by permeability
constants and modeled using the Nernst equation. In addition,
while we assumed spatial homogeneity in any single compartment,
we differentiated between cytosolic, Endoplasmic Reticulum (ER)
and membrane localized species and processes. The model had
252 unknown parameters (initial conditions and kinetic constants,
Table 2). Model parameters were estimated from nine indepen-
dent data sets taken from multiple laboratories and different cell-
lines (Table 3). The training data consisted of both dynamic and
steady-state measurements. However, we were unable to estimate
unique model parameters from the training data. Instead, weestimated a family or ensemble of probable model parameter sets
[36–38] using a Multi-Objective Thermal Ensemble (MOTE)
technique (materials and methods). Each member of the ensemble
met a training error criterion and was located along or near the
optimal trade-off surface between the individual training data sets.
Thus, while we did not uniquely determine the model parameters,
we constrained their values to regions that were consistent with
observations. Sensitivity analysis was then conducted over the
parameter ensemble to better understand the role and importance
of the model parameters. All model code as well as all code used in
the parameter identification studies is available in the supplemen-
tal materials (Supplemental Materials S1).
Figure 1. Schematic of calcium signaling network used in this study. Ca2z can enter the cytosol via P2X channels, inositol trisphosphatereceptors (IP3R) and passive Ca2z leakage. ATP binding to P2X activates the channel and induces a rapid increase in cytosolic Ca2z in the presence of extracellular calcium. ATP binding to P2Y receptors activates membrane-bound phospholipase C (PLC) which hydrolyzes phosphatidylinositol-4, 5-bisphophate (PIP2) into inositol 1,4,5-trisphosphate (IP3) and diacylglycerol (DAG). Cytosolic calcium and IP3 binding triggers the opening of IP3Rchannels and the subsequent release of endogenous Ca2z from the Endoplasmic Reticulum (ER) into the cytosol. Cytosolic Ca2z is translocated tothe extracellular medium by plasma membrane Ca2z ATPase (PMCA) pumps, Naz/Ca2z exchangers (NCX) and to the ER by Sarcoplasmic/Endoplasmic Reticulum Ca2z (SERCA) ATPase pumps. Phosphoinositides (PIs) are recycled between the plasma membrane and cytosol byphosphorylation and dephosphorylation events. The specific reactions, kinetic constants and non-zero initial conditions used in this study are givenin Table 1 and Table 2, respectively.doi:10.1371/journal.pone.0006758.g001
Modeling Calcium Dynamics
PLoS ONE | www.plosone.org 2 September 2009 | Volume 4 | Issue 9 | e6758
8/9/2019 Plos One 2009 Song
http://slidepdf.com/reader/full/plos-one-2009-song 3/15
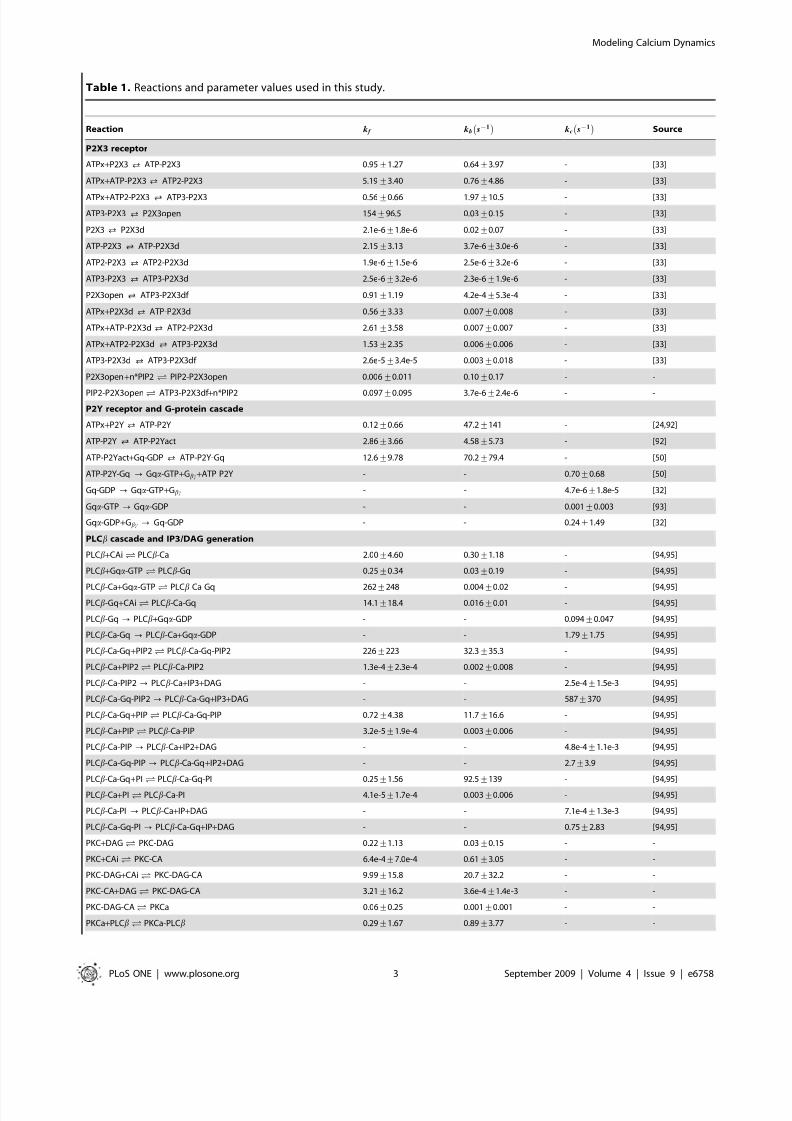
Table 1. Reactions and parameter values used in this study.
Reaction k f kb s{1À Á
kc s{1
À ÁSource
P2X3 receptor
ATPx+P2X3 /? ATP-P2X3 0.95+1.27 0.64+3.97 - [33]
ATPx+ATP-P2X3 /? ATP2-P2X3 5.19+3.40 0.76+4.86 - [33]
ATPx+ATP2-P2X3 /? ATP3-P2X3 0.56+0.66 1.97+10.5 - [33]
ATP3-P2X3 /? P2X3open 154+96.5 0.03+0.15 - [33]
P2X3 /? P2X3d 2.1e-6+1.8e-6 0.02+0.07 - [33]
ATP-P2X3 /? ATP-P2X3d 2.15+3.13 3.7e-6+3.0e-6 - [33]
ATP2-P2X3 /? ATP2-P2X3d 1.9e-6+1.5e-6 2.5e-6+3.2e-6 - [33]
ATP3-P2X3 /? ATP3-P2X3d 2.5e-6+3.2e-6 2.3e-6+1.9e-6 - [33]
P2X3open /? ATP3-P2X3df 0.91+1.19 4.2e-4+5.3e-4 - [33]
ATPx+P2X3d /? ATP-P2X3d 0.56+3.33 0.007+0.008 - [33]
ATPx+ATP-P2X3d/? ATP2-P2X3d 2.61+3.58 0.007+0.007 - [33]
ATPx+ATP2-P2X3d /? ATP3-P2X3d 1.53+2.35 0.006+0.006 - [33]
ATP3-P2X3d /? ATP3-P2X3df 2.6e-5+3.4e-5 0.003+0.018 - [33]
P2X3open+n*PIP2 ' PIP2-P2X3open 0.006+0.011 0.10+0.17 - -
PIP2-P2X3open' ATP3-P2X3df +n*PIP2 0.097+0.095 3.7e-6+2.4e-6 - -
P2Y receptor and G-protein cascade
ATPx+P2Y /? ATP-P2Y 0.12+0.66 47.2+141 - [24,92]
ATP-P2Y /? ATP-P2Yact 2.86+3.66 4.58+5.73 - [92]
ATP-P2Yact+Gq-GDP /? ATP-P2Y-Gq 12.6+9.78 70.2+79.4 - [50]
ATP-P2Y-Gq ? Gqa-GTP+Gbc+ATP-P2Y - - 0.70+0.68 [50]
Gq-GDP ? Gqa-GTP+Gbc - - 4.7e-6+1.8e-5 [32]
Gqa-GTP ? Gqa-GDP - - 0.001+0.003 [93]
Gqa-GDP+Gbc ? Gq-GDP - - 0.24+1.49 [32]
PLCb cascade and IP3/DAG generation
PLCb+CAi ' PLCb-Ca 2.00+4.60 0.30+1.18 - [94,95]
PLCb+Gqa-GTP ' PLCb-Gq 0.25+0.34 0.03+0.19 - [94,95]
PLCb-Ca+Gqa-GTP' PLCb-Ca-Gq 262+248 0.004+0.02 - [94,95]PLCb-Gq+CAi ' PLCb-Ca-Gq 14.1+18.4 0.016+0.01 - [94,95]
PLCb-Gq ? PLCb+Gqa-GDP - - 0.094+0.047 [94,95]
PLCb-Ca-Gq ? PLCb-Ca+Gqa-GDP - - 1.79+1.75 [94,95]
PLCb-Ca-Gq+PIP2' PLCb-Ca-Gq-PIP2 226+223 32.3+35.3 - [94,95]
PLCb-Ca+PIP2' PLCb-Ca-PIP2 1.3e-4+2.3e-4 0.002+0.008 - [94,95]
PLCb-Ca-PIP2 ? PLCb-Ca+IP3+DAG - - 2.5e-4+1.5e-3 [94,95]
PLCb-Ca-Gq-PIP2 ? PLCb-Ca-Gq+IP3+DAG - - 587+370 [94,95]
PLCb-Ca-Gq+PIP ' PLCb-Ca-Gq-PIP 0.72+4.38 11.7+16.6 - [94,95]
PLCb-Ca+PIP ' PLCb-Ca-PIP 3.2e-5+1.9e-4 0.003+0.006 - [94,95]
PLCb-Ca-PIP ? PLCb-Ca+IP2+DAG - - 4.8e-4+1.1e-3 [94,95]
PLCb-Ca-Gq-PIP ? PLCb-Ca-Gq+IP2+DAG - - 2.7+3.9 [94,95]
PLCb-Ca-Gq+PI ' PLCb-Ca-Gq-PI 0.25+1.56 92.5+139 - [94,95]
PLCb-Ca+PI ' PLCb-Ca-PI 4.1e-5+1.7e-4 0.003+0.006 - [94,95]
PLCb-Ca-PI ? PLCb-Ca+IP+DAG - - 7.1e-4+1.3e-3 [94,95]
PLCb-Ca-Gq-PI ? PLCb-Ca-Gq+IP+DAG - - 0.75+2.83 [94,95]
PKC+DAG' PKC-DAG 0.22+1.13 0.03+0.15 - -
PKC+CAi ' PKC-CA 6.4e-4+7.0e-4 0.61+3.05 - -
PKC-DAG+CAi ' PKC-DAG-CA 9.99+15.8 20.7+32.2 - -
PKC-CA+DAG' PKC-DAG-CA 3.21+16.2 3.6e-4+1.4e-3 - -
PKC-DAG-CA' PKCa 0.06+0.25 0.001+0.001 - -
PKCa+PLCb ' PKCa-PLCb 0.29+1.67 0.89+3.77 - -
Modeling Calcium Dynamics
PLoS ONE | www.plosone.org 3 September 2009 | Volume 4 | Issue 9 | e6758

8/9/2019 Plos One 2009 Song
http://slidepdf.com/reader/full/plos-one-2009-song 4/15
Reaction k f kb s{1À Á
kc s{1
À ÁSource
PKCa-PLCb ? PKCa+pPLCb - - 1.43+2.10 -
pPLCb ? PLCb - - 0.006+0.02 -
PKCa+PLCb-Ca ' PKCa-PLCb-Ca 66.7+103 14.1+12.4 - -
PKCa-PLCb-Ca ? PKCa+pPLCb-Ca - - 0.50+1.63 -
pPLCb-Ca ? PLCb-Ca - - 0.005+0.022 -
PI signaling
PI+PIK ' PI-PIK 957+813 146+133 - [34]
PI-PIK ? PIK +PIP - - 78.8+32.2 [34]
PIP+PIPP ' PIP-PIPP 1741+918 152+126 - –
PIP-PIPP ? PI+PIPP - - 61.7+34.5 –
PIP+PIPK ' PIP-PIPK 243+203 949+717 - [34]
PIP-PIPK ? PIPK +PIP2 - - 163+87.0 [34]
PIP+PA-PIPK ' PIP-PA-PIPK 329+212 837+1276 - –
PIP-PA-PIPK ? PA-PIPK +PIP2 - - 60.1+33.5 –
PIP2+PIP2P' PIP2-PIP2P 346+211 1212+1741 - –
PIP2-PIP2P ? PIP+PIP2P - - 145+119 –IP3+IP3P' IP3-IP3P 117+52.8 533+188 - [34]
IP3-IP3P ? IP2+IP3P - - 109+63.1 [34]
IP2+IP2P' IP2-IP2P 78.9+46.1 94.7+69.0 - [34]
IP2-IP2P ? IP+IP2P - - 44.0+28.5 [34]
IP+IPP ' IP-IPP 849+894 245+140 - [34]
IP-IPP ? Ins+IPP - - 37.5+19.6 [34]
DAG+DAGK ' DAG-DAGK 250+111 86.5+59.1 - [34]
DAG-DAGK ? PA+DAGK - - 62.9+36.2 [34]
PA+CDS' PA-CDS 22.4+12.7 110+61.6 - [34]
PA-CDS ? CDPDG+CDS - - 17.7+14.5 [34]
CDPDG+Ins ' CDPDG-Ins 33.1+27.5 51.5+46.1 - [34]
CDPDG-Ins+PIS ' CDPDG-Ins-PIS 26.9+37.8 104.7+87.3 - [34]
CDPDG-Ins-PIS? PI+PIS - - 36.6+23.2 [34]
PA+PIPK ' PA-PIPK 178+75.5 6.80+4.07 - [34]
IP3R channel
IP3R+IP3 /? IP3R-IP3 1.20+1.93 300+128 - [42,46,47]
IP3R-IP3 /? IP3R-IP3a 1550+516 63.7+54.1 - [42,46,47]
IP3R-IP3a+Ca2zi /? IP3R-IP3-CA 65.3+34.1 71.7+42.8 - [42,46,47]
IP3R-IP3-CA /? IP3Ropen 409+315 47.3+32.5 - [42,46,47]
IP3R-IP3-CA+Ca2zi /? IP3R-IP3-2CA 3.58+1.03 0.36+0.20 - [42,46,47]
IP3R-IP3-2CA/? IP3Ri 0.52+0.10 0.03+0.02 - [42,46,47]
IP3R-IP3-2CA+Ca2zi /? IP3R-IP3-3CA 3.07+2.29 0.95+0.56 - [42,46,47]
IP3R-IP3-3CA/? IP3Rii 0.10+0.08 0.04+0.016 - [42,46,47]
Ca
2z
i permeation through channels and leaksP2X3open+Ca2z
x /? P2X3open+Ca2zi 0.98+0.52 0.98+0.52 - [33,56]
PIP2-IP3Ropen+Ca2zER /? PIP2-IP3Ropen+Ca2z
i 4.52+1.83 4.52+1.83 - [24,42,46,47]
IP3Ropen+Ca2zER /? IP3Ropen+Ca2zi
14.2+6.51 14.2+6.51 - [24,42,46,47]
Ca2zER /? Ca2z
i 5.3e-4+5.3e-4 5.3e-4+5.3e-4 - -
Ca2zx /? Ca2z
i 2.2e-5+1.4e-5 2.2e-5+1.4e-5 - -
Ca2zi pumps and exchangers
SERCA+2Ca2zi /? SERCA-2Ca 2969+1666 87.0+69.7 - [96]
SERCA-2Ca ? SERCA+2Ca2zER - - 208+83.8 [96]
Table 1. Cont.
Modeling Calcium Dynamics
PLoS ONE | www.plosone.org 4 September 2009 | Volume 4 | Issue 9 | e6758
8/9/2019 Plos One 2009 Song
http://slidepdf.com/reader/full/plos-one-2009-song 5/15
Independent training sets constrained the behavior of the model
Models of signal transduction networks often exhibit complex
relationships between model performance and parameter values
[38]. It is rarely possible to uniquely identify parameters from
noisy experimental measurements, even when given extensive
training data [39]. Uncertainty in model parameters translates to
uncertainty in model simulations. To address uncertainty in the
calcium model parameters, we estimated a family of possible
parameter sets using a MOTE technique. The 252 unknown
parameters (initial conditions and kinetic constants) were estimated
using nine data sets from multiple laboratories. Training data wasselected to approximately constrain the behavior of each of the
submodels in the integrated model. Because the training data
consisted of both steady-state and time-series measurements taken
from multiple sources, it contained intrinsic conflicts. To balance
these conflicts, we treated each training set as a separate objective
in a multiple objective optimization calculation. Parameter values
were adjusted to minimize the squared error between model
simulations and experimental measurements. We generated 250
parameters sets on or near the Pareto-optimal frontier and finally
selected 123 parameters just on the Pareto-optimal frontier. The
number of parameter sets obtained was constrained by compu-
tational demands. The ensemble reported here required greater
than 20,000 annealing runs and 107 hours on an Apple 2.6 Ghz
Intel Core 2 Duo workstation (Apple Computer, Cupertino CA).In the ensemble, 31 parameters had a Coefficient of Variation
(CV) of less than 0.5 while 108 had a CV of less than one. The
minimum CV was 0.18 while the maximum was 6.5. The most
constrained parameters were largely associated with IP3R
regulation while the dissociation rates of PLC b-Ca-Gq complex
or ATP-P2X3R complexes were least constrained. Most of non-
zero initial conditions (92%) had a CV of less than one (Fig. 2).
The IP3/IP3R module recapitulated the steady-state regulation of
IP3R channels as a function of IP3 and cytosolic calcium. IP3R
receptors have previously been modeled as multimeric proteins
composed of four identical subunits [40–45]. Single IP3R channel
recordings have shown four conductance levels where one conduc-
tance level was correlated with greater opening time [46]. Based on
these findings, we assumed that each IP3R had one IP3 and three
calcium ion binding sites. Using this model, IP3R opening requiredsequential binding of IP3 and one calcium ion. We assumed IP3
binding induced an IP3R conformational change that blocked
additional IP3 binding and exposed three calcium binding sites.
Cytosolic calcium binding to the IP3-IP3R complex was assumed to
initially open the IP3-IP3R channel allowing calcium transport from
the ER to the cytosol. However, binding of a second or third calcium
ion was assumed to downregulate the transport activity of the channel.
Parameters and initial conditions for the IP3R channel model were
estimated from independent steady-state measurements of the fraction
of open IP3R channels as a function of cytosolic calcium and IP3
concentrations [46,47]. The IP3R model reproduced steady-state
Reaction k f kb s{1À Á
kc s{1
À ÁSource
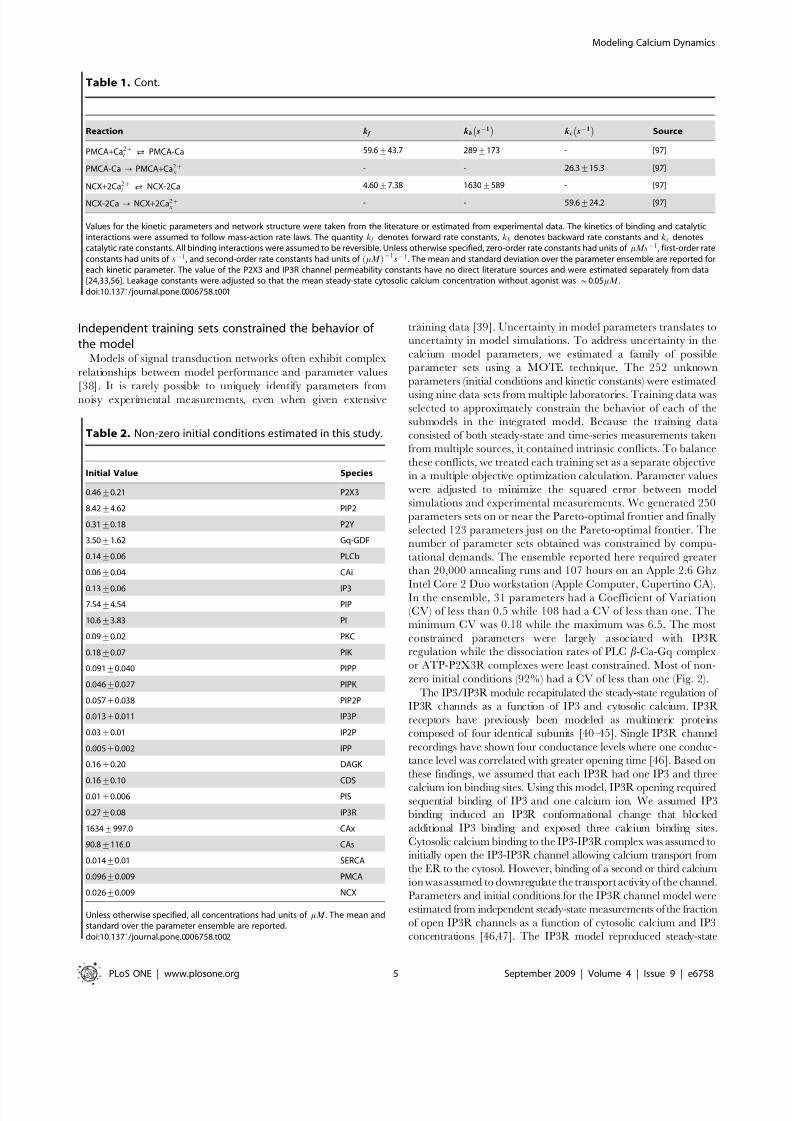
PMCA+Ca2zi /? PMCA-Ca 59.6+43.7 289+173 - [97]
PMCA-Ca ? PMCA+Ca2zx
- - 26.3+15.3 [97]
NCX+2Ca2zi /? NCX-2Ca 4.60+7.38 1630+589 - [97]
NCX-2Ca ? NCX+2Ca2zx - - 59.6+24.2 [97]
Values for the kinetic parameters and network structure were taken from the literature or estimated from experimental data. The kinetics of binding and catalyticinteractions were assumed to follow mass-action rate laws. The quantity k f denotes forward rate constants, k b denotes backward rate constants and k c denotescatalytic rate constants. All binding interactions were assumed to be reversible. Unless otherwise specified, zero-order rate constants had units of mMs{1, first-order rateconstants had units of s{1, and second-order rate constants had units of mM ð Þ{1
s{1 . The mean and standard deviation over the parameter ensemble are reported foreach kinetic parameter. The value of the P2X3 and IP3R channel permeability constants have no direct literature sources and were estimated separately from data[24,33,56]. Leakage constants were adjusted so that the mean steady-state cytosolic calcium concentration without agonist was *0.05mM .doi:10.1371/journal.pone.0006758.t001
Table 1. Cont.
Table 2. Non-zero initial conditions estimated in this study.
Initial Value Species
0.46+0.21 P2X3
8.42+4.62 PIP2
0.31+0.18 P2Y
3.50+1.62 Gq-GDP
0.14+0.06 PLCb
0.06+0.04 CAi
0.13+0.06 IP37.54+4.54 PIP
10.6+3.83 PI
0.09+0.02 PKC
0.18+0.07 PIK
0.091+0.040 PIPP
0.046+0.027 PIPK
0.057+0.038 PIP2P
0.013+0.011 IP3P
0.03+0.01 IP2P
0.005+0.002 IPP
0.16+0.20 DAGK
0.16+0.10 CDS
0.01+0.006 PIS
0.27+0.08 IP3R
1634+997.0 CAx
90.8+116.0 CAs
0.014+0.01 SERCA
0.096+0.009 PMCA
0.026+0.009 NCX
Unless otherwise specified, all concentrations had units of mM . The mean andstandard over the parameter ensemble are reported.doi:10.1371/journal.pone.0006758.t002
Modeling Calcium Dynamics
PLoS ONE | www.plosone.org 5 September 2009 | Volume 4 | Issue 9 | e6758

8/9/2019 Plos One 2009 Song
http://slidepdf.com/reader/full/plos-one-2009-song 6/15
channel behavior with a bell-shaped calcium dependency (Fig. 3A).
The IP3R model also reproduced the fraction of open IP3R channels
as a function of IP3 at a fixed calcium level (Fig. 3B). The ensemble of
IP3R models reproduced between 73%–82% of the measured values
within a single ensemble standard deviation and 100% of the
measurements at three ensemble standard deviations.The P2Y and PI modules recapitulated time-dependent
cytosolic calcium and phosphoinositide measurements following
ATP and UTP stimulation. The P2Y module was adapted from
the Gq-protein coupled receptor (GPCR) and PLCb activation
models of Bhalla et al. [32]. P2Y parameter values were
constrained using two independent sets of time-resolved cytosolic
calcium measurements following P2Y2 activation in Neuro2a cells
and rat DRG neurons [24,48]. To make sure the calcium
dynamics were attributable solely to P2Y stimulation, we selected
calcium measurements induced by ATP in the absence of
extracellular calcium [48]. To capture dose-dependence and
possible saturation effects, we used dose-dependent UTP-evoked
calcium dynamics to constrain the P2Y module [24]. The model
ensemble reproduced both ATP-P2Y2-evoked calcium dynamics
and UTP-P2Y2-evoked calcium peak measurements (Fig. 3F and
3H). The P2Y module captured 75%–82% of the cytosoliccalcium measurements within a single ensemble standard
deviation and 100% of the measurements at three standard
deviations. To capture the integration of PI metabolism with P2Y-
driven calcium release, we used dynamic measurements of PIPx
levels in stimulated SH-SY5Y human neuroblastoma cells to
constrain the PI module [49]. Previous models have neglected PI
recycling. Typically, these models assumed that PIP2 replenish-
ment and IP3 degradation were constant or were mediated by
enzymes with time-invariant activity [32,42,50,51]. We addressed
this issue by modifying a model of P2Y1-evoked calcium dynamics
Table 3. Experimental training data used to estimate the ensemble of the model parameters (Fig. 3).
Observation Stimulation Cell line Source
A gated IP3R fraction Ca2z Ã
i dependent ER vesicles f rom canine cer eb el lu m [47]
B gated IP3R fraction [IP3] dependent ER vesicles from canine cerebellum [46]
C [PIP] transient GPCR activation SH-SY5Y cells [49]
D [PIP2] transient GPCR activation SH-SY5Y cells [49]
E Ca2z Ã
i transient 100 mM ATP P2X3-transfected GT1 cells [56]
F Ca2z Ã
i transient 100 mM ATP Neuro2a cells [48]
G P2X3 current peak ATP-dose dependent rat DRG neurons [31]
H Ca2z Ã
i peak ATP-dose dependent rat DRG neurons [24]
doi:10.1371/journal.pone.0006758.t003
Figure 2. Coefficient of Variation (CV) of parameters (reaction rate constants and non-zero initial conditions) in the ensemble.Thirty-one parameters were constrained with a CV of less than or equal to 0.5 and 108 had a CV of less than one. The minimum CV was 0.18 while themaximum was 6.5.doi:10.1371/journal.pone.0006758.g002
Modeling Calcium Dynamics
PLoS ONE | www.plosone.org 6 September 2009 | Volume 4 | Issue 9 | e6758

8/9/2019 Plos One 2009 Song
http://slidepdf.com/reader/full/plos-one-2009-song 7/15
Figure 3. Comparison of model simulations versus training data. The dashed lines in each case denote the mean simulated value over theensemble of model parameters while the shaded regions denote one ensemble standard deviation (N= 123). Experimental data are shown with errorbars. In each corner, the fraction of experimental points captured at one and three standard deviations is given. (A,B): Steady state fraction of openIP3R channels as a function of cytosolic Ca2z (A) and IP3 concentration (B). The experimental data was reproduced from Bezprozvanny et al. [47] andWatras et al. [46], respectively. (C,D): Time-resolved measurements of PIP (C) and PIP2 (D) levels following GPCR activation in SH-SY5Y cells. The PIP/PIP2 data was reproduced from Willars et al., [49]. (E): ATP-induced transient increase in cytosolic Ca2z following P2X receptor activation in P2X3-transfected GT1 cells. Experimental data reproduced from He et al., [56]. (F): ATP-induced transient increase in cytosolic Ca2z following P2Y receptoractivation in Neuro2a cells. Experimental data reproduced from Lakshmi et al., [48]. (G): ATP-dose dependent fraction of gated P2X3 channels forcontrol (black) and cells treated with GDP-b-S (blue) from rat DRG neurons. Experimental data reproduced from Gerevich et al., [31]. (H): UTP-dosedependent increases in peak cytosolic Ca2z levels in rat DRG neurons. Experimental data was reproduced from Sanada et al., [24].doi:10.1371/journal.pone.0006758.g003
Modeling Calcium Dynamics
PLoS ONE | www.plosone.org 7 September 2009 | Volume 4 | Issue 9 | e6758
8/9/2019 Plos One 2009 Song
http://slidepdf.com/reader/full/plos-one-2009-song 8/15
in platelets developed by Purvis et al. [34] by adding more
phosphatases and kinase activities (Table 1). Following agonist
stimulation, the concentration of both PIP (Fig. 3C) and PIP2
(Fig. 3D) decreased to approximately 30% of the basal level and
then recovered albeit with different recovery rates. The model
captured 50%–80% of the PIPx measurements within one
ensemble standard deviation and between 80%–90% at three
ensemble standard deviations. The agreement between measured
and simulated PIP2 levels in particular was qualitatively correctbut missing fine measurement features.
The P2X module recapitulated time-dependent cytosolic calcium
measurements and the role of PI metabolism on P2X activity as a
function of extracellular ATP stimulation. The structure of the P2X
module was based on the study of Sokolova et al. [33]. Sokolova et al.
experimentally and computationally explored the electrophysiolog-
ical properties of P2X3 receptors using cultured rat sensory
neurons. We modified the Sokolova model to reflect experimental
evidence [52–55] suggesting that PIP2 stabilizes open P2X
conformations (Table 1). We assumed two PIP2 binding events
were required to stabilize open P2X channels. ATP-induced
intracellular calcium dynamics measured in GT1 cells transfected
with rat P2X3 receptors were used to train the behavior of the P2X
module [56]. However, the GT1 experiments were done at a single
ATP concentration. To capture ATP dose effects and constrain theinfluence of PIP2 on P2X channels, simulations of the fraction of
open P2X3 receptors were compared with nominal rat DRG
neurons and neurons loaded with the Gq-protein inhibitor GDP-b-
S as a function of ATP [31]. Consistent with Gerevich et al., we
assumed that P2X3-mediated current amplitude was proportional
to the fraction of gated P2X3 channels [31]. The parameter
ensemble captured the calcium dynamics following ATP-stimula-
tion of transfected GT1 cells (Fig. 3E). The ensemble of models
described 95% of the GT1 calcium measurements within one
ensemble standard deviation. Using the hypothesis that PIP2
stabilized gated P2X3 receptors (Table 1), the model reproduced
experimental observations in which ATP-induced peak current
increased when GPCR activity was blocked by GDP-b-S (Fig. 3G).
The model described 83%–100% of the measured peak currentmeasurements as a function of ATP forcing within one ensemble
standard deviation. We further explored the relationship between
P2Y activation and the regulation of gated P2X channels by
simulating simultaneous ATP-induced activation of P2X and P2Y
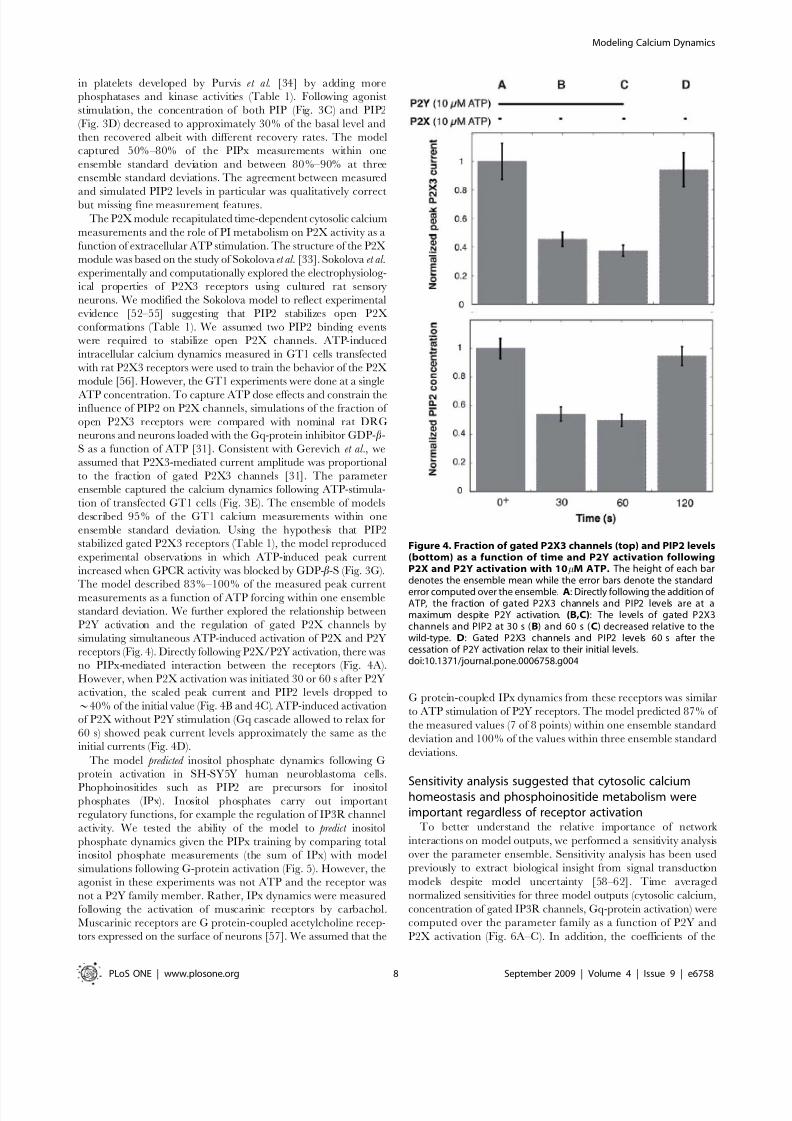
receptors (Fig. 4). Directly following P2X/P2Y activation, there was
no PIPx-mediated interaction between the receptors (Fig. 4A).
However, when P2X activation was initiated 30 or 60 s after P2Y
activation, the scaled peak current and PIP2 levels dropped to
*40% of the initial value (Fig. 4B and 4C). ATP-induced activation
of P2X without P2Y stimulation (Gq cascade allowed to relax for
60 s) showed peak current levels approximately the same as the
initial currents (Fig. 4D).
The model predicted inositol phosphate dynamics following G
protein activation in SH-SY5Y human neuroblastoma cells.
Phophoinositides such as PIP2 are precursors for inositolphosphates (IPx). Inositol phosphates carry out important
regulatory functions, for example the regulation of IP3R channel
activity. We tested the ability of the model to predict inositol
phosphate dynamics given the PIPx training by comparing total
inositol phosphate measurements (the sum of IPx) with model
simulations following G-protein activation (Fig. 5). However, the
agonist in these experiments was not ATP and the receptor was
not a P2Y family member. Rather, IPx dynamics were measured
following the activation of muscarinic receptors by carbachol.
Muscarinic receptors are G protein-coupled acetylcholine recep-
tors expressed on the surface of neurons [57]. We assumed that the
G protein-coupled IPx dynamics from these receptors was similar
to ATP stimulation of P2Y receptors. The model predicted 87% of
the measured values (7 of 8 points) within one ensemble standard
deviation and 100% of the values within three ensemble standard
deviations.
Sensitivity analysis suggested that cytosolic calciumhomeostasis and phosphoinositide metabolism wereimportant regardless of receptor activation
To better understand the relative importance of network
interactions on model outputs, we performed a sensitivity analysis
over the parameter ensemble. Sensitivity analysis has been used
previously to extract biological insight from signal transduction
models despite model uncertainty [58–62]. Time averaged
normalized sensitivities for three model outputs (cytosolic calcium,
concentration of gated IP3R channels, Gq-protein activation) were
computed over the parameter family as a function of P2Y and
P2X activation (Fig. 6A–C). In addition, the coefficients of the
Figure 4. Fraction of gated P2X3 channels (top) and PIP2 levels(bottom) as a function of time and P2Y activation followingP2X and P2Y activation with 10mM ATP. The height of each bardenotes the ensemble mean while the error bars denote the standard
error computed over the ensemble. A: Directly following the addition of ATP, the fraction of gated P2X3 channels and PIP2 levels are at amaximum despite P2Y activation. (B,C): The levels of gated P2X3channels and PIP2 at 30 s (B) and 60 s (C) decreased relative to thewild-type. D: Gated P2X3 channels and PIP2 levels 60 s after thecessation of P2Y activation relax to their initial levels.doi:10.1371/journal.pone.0006758.g004
Modeling Calcium Dynamics
PLoS ONE | www.plosone.org 8 September 2009 | Volume 4 | Issue 9 | e6758

8/9/2019 Plos One 2009 Song
http://slidepdf.com/reader/full/plos-one-2009-song 9/15
eigenvector corresponding to the largest eigenvalue of the
normalized sensitivity matrix product NNT were used to analyze
the effects of a combination of parameter changes on the whole
system and rank order the model parameters with respect to their
sensitivity [63] as a function of condition (Fig. 6D–F). The
parameter ranking studies explored which combinations of
parameters were globally important while the time averaged
sensitivities looked only at specific model outputs. Dashed lines on
each plot demarcate the upper 10% of the sensitive parameters for
each condition. Sensitivity coefficients that lie along either axis
denote parameters directly involved with particular activation
states. Conversely, parameters that lie along the 45o line in the
upper 10% quadrant denote parameters which are important
regardless of the activation state. Both rate constants and initial
conditions were considered in the sensitivity analysis.
PI metabolism and the governance of cytosolic calcium levels
were in the upper 10% of model parameters for both P2X and
P2Y activation (Fig. 6A). When considering cytosolic calcium as
the model output, interactions directly involved with P2X or P2Y
activity segregated along their respective axis. The most sensitive
parameters controlling the relationship between P2X and
intracellular calcium was the permeability of P2XR channels with
and without PIP2 stabilization. Conversely, ATP binding and PIrecycling strongly influenced cytosolic calcium levels when only
P2Y receptors were activated. Components involved in calcium
homeostasis for example, SERCA and PMCA pumps were
globally important for both P2X and P2Y activation. Similar
results were obtained when looking at parameter groups for P2X
activation (Fig. 6D) or P2Y activation (Fig. 6E). The combination
studies supported the hypothesis that calcium homeostasis was
critical (including IP3R channel regulation), with PI metabolism
being secondarily important globally. From the simulation studies
and the P2X sensitivity results, we expect phosphoinositides may
regulate P2X channel activity. We explored which parameters
regulated the activity of gated P2X versus IP3R channels when
only P2X channels were active (Fig. 6B). G protein activation
(PLCb, Gq-GDP), ion pumps and transporters were more
important to the regulation of IP3R channels than to gated P2X
receptors. However, parameters regulating PI metabolism and
P2XR activation were important to both P2XR and IP3R activity.
This suggested a cascade where PI metabolism influenced both
IP3R and P2XR activity and IP3R activity was coupled to P2XR
through intracellular calcium feedback. In particular, gated IP3Rchannels were sensitive to interactions involved with the PIP2
stabilization of gated P2XR channels. However, gated P2X
channels were also indirectly sensitive to calcium through ATP-
independent G protein activation. The initial condition of Gq-
GDP was in the upper 10% of sensitive mechanisms regulating
gated P2XR and IP3R channels.
Discussion
Intracellular calcium levels are important to neuronal func-
tions such as transmitter release and membrane excitability
[8–13,64,65] as well as to pain networks, including the Bradykinin,
COX-2, prostaglandins, and Serotonin signaling networks [66].
Thus, understanding the regulation of cytosolic calcium levels
following agonist stimulation could be important to the develop-ment of treatments for acute and chronic pain [65]. In this study,
we modeled ATP-induced calcium dynamics mediated by the P2
family of surface receptors. The model described the dynamics of
90 proteins, protein complexes or ions connected by 162
interactions. A family of model parameters was estimated using
nine experimental training sets compiled from different cell-lines
and laboratories. We estimated the parameter family using a
Multi-Objective Thermal Ensemble (MOTE) technique. The
MOTE algorithm identified parameter sets on or near the optimal
trade-off surface between the individual training data constraints.
The family of models simultaneously recapitulated the training
data and predicted total inositol levels following GPCR activation.
Sensitivity analysis was then used, over the family of parameter
sets, to estimate which parameters were critical globally and key to
specific model outputs (cytosolic calcium concentration, the
fraction of gated IP3R channels and Gq-protein activation).
Phosphoinositide metabolism may mediate crosstalk between
P2X and P2Y family members in neurons. Phosphoinositides,
which are regulated by proteins with lipid recognition, kinase/
phosphatase and phospholipase activities, have been suggested to
control ion channel activity [67,68]. Electrostatic interactions
between the negatively charged headgroups of PIP2 and positively
charged amino acids on the ion channels are thought to modulate
the activity of the channels [55,69]. For example, Zhao et al.
showed that decreased PIP2 levels inhibited P2X3 currents in
primary rat DRG neurons [52]. Bernier et al. showed that PIP2
modulated the current amplitude, recovery, and activation/de-
activation kinetics of P2X1 channels in rat mesenteric arteries
[53]. In this study, we hypothesized that plasma membranephophoinositides modulated the activity of P2X channels by
stabilizing the open conformation [52–55]. Using the hypothesized
connectivity, the model explained the inhibitory effect of Gq-
protein coupled P2Y receptor activity on P2X3 receptor-mediated
currents in rat DRG neurons. It is widely accepted that P2X
receptors, especially P2X3 and P2X2/3 selectively expressed in
small DRG neurons, play an important role in pain transmission.
However, the role of P2Y receptors in pain transmission remains
unclear [30,31,70–73]. Metabotropic P2Y receptors, especially
P2Y1 and P2Y2, are often co-expressed with P2X receptors in
small DRG neurons and other cell types. Gerevich et al. suggested
Figure 5. Predicted time course of total inositol phosphatelevels (sum of IPx) versus experimental measurements in SH-SY5Y cells. The dashed line denotes the mean simulated value overthe ensemble of model parameters while the shaded region denotesone ensemble standard deviation (N= 123). Experimental data areshown with error bars. The data was reproduced from Willars et al.,where muscarinic receptors (another class of G protein coupledreceptor) was activated by carbachol in the human neuroblastoma cellline, SH-SY5Y [49]. Both the simulation and experiment were conductedwith saturating levels of agonist. No parameters were adjusted for thiscomparison.doi:10.1371/journal.pone.0006758.g005
Modeling Calcium Dynamics
PLoS ONE | www.plosone.org 9 September 2009 | Volume 4 | Issue 9 | e6758

8/9/2019 Plos One 2009 Song
http://slidepdf.com/reader/full/plos-one-2009-song 10/15
Figure 6. Sensitivity analysis as a function of model output and activation conditions. Squares denote rate constants while circles denoteinitial conditions organized by biological function. The mean values of the sensitivity coefficients calculated over the parameter ensemble are shown.Vertical and horizontal lines denote the top 10% of sensitive parameters or parameter combinations. Parameters in the shaded regions are highlysensitive regardless of conditions. A: Comparison of cytosolic calcium sensitivity for P2X versus P2Y activation (100mM ATP). B: Comparison of thesensitivity of gated P2X and IP3R channels for P2X receptor activation (100mM ATP). C: Comparison of the sensitivity on PIP2 and Gq.GTP levels whenboth P2X and P2Y receptors were activated (100mM ATP). (D,E,F): Average rank-ordering of parameter sensitivities as a function of receptoractivation state.doi:10.1371/journal.pone.0006758.g006
Modeling Calcium Dynamics
PLoS ONE | www.plosone.org 10 September 2009 | Volume 4 | Issue 9 | e6758

8/9/2019 Plos One 2009 Song
http://slidepdf.com/reader/full/plos-one-2009-song 11/15
that negative synergy between stimulatory P2X3 and inhibitory
P2Y receptors may be a novel regulatory mechanism to manage
extreme pain signals [31]. The notion that P2Y receptors may
dampen extreme P2X activity by modulating phosphoinositide
levels was consistent with our simulation studies. Moreover,
sensitivity analysis suggested that gated P2X channels could be
strongly influenced by PI metabolism. However, the inverse
relationship between P2Y and P2X activity may be cell-type or
receptor subtype dependent. For example, P2X1 and P2Yreceptors have been shown to have a positive synergy during
platelet stimulation [74]. Moreover, inflammatory mediators like
substance P and bradykinin, acting through PKC activity
following Gq and phospholipase C cascades, potentiate currents
through P2X3 and P2X2/3 channels in Xenopus oocytes [75].
Thus, more experimental and modeling studies are required to
fully understand the physiological relationship between P2X and
P2Y receptors in sensory neurons.
The rank-ordering of sensitive parameter combinations sug-
gested the subsystems managing calcium homeostasis were
structurally fragile. Evolutionarily optimized cellular infrastructure
like ATPases, NCX or IP3R channels might be expected to be
robust. However, these mechanisms were consistently ranked the
most sensitive irrespective of receptor activation. PI metabolism
was also predicted to be globally important regardless of whichreceptor was activated. Thus, malfunctions in or direct targeting of
SERCA, PMCA or NCX channels may be more likely to elicit a
global response independent of receptor activation or pain state.
There are experimental studies which have tested or hypothesized
the importance of these molecular components. For example,
NCX inhibitors have been suggested for the treatment of
cardiovascular disorders such as ischemia, arrhythmias and
hypertension [76]. SERCA activity has been correlated with
decreased neuronal viability in SH-SY5Y human neuroblastoma
cells [77] and with the accumulation of ganglioside GM2 in the
brain, a component of the neuropathology of Sandhoff’s disease
[78]. Abnormal SERCA or PMCA activities have been implicated
in Multiple Sclerosis [79], hypertension [80], diabetes-induced
disorders in nociceptive neurons [81], neuronal damage and death[79] and male infertility [82]. Thus, there is strong circumstantial
evidence suggesting the maintenance of calcium homeostasis is a
source of global fragility. However, targeting these globally
important mechanisms in order to disrupt pain signals may not
be appropriate and could perhaps initiate non-specific effects.
Parameter ranking analysis also provided a means to differentiate
between subsystems that were always sensitive versus those only
sensitive following receptor activation. Mechanisms sensitive only
after receptor activation could act as targets to manipulate the
specific response of a neuron to stimulation. For example, P2X
channel permeability or the initial levels of P2X receptors were
sensitive only in the presence of ATP. This suggests that P2X
channel inhibitors could selectively block different types of pain
without intentionally interfering with other subsystems. P2X3
inhibitors have been explored clinically as novel analgesics [66,83].Research using selective P2X3 antagonists suggested these
receptors were involved in both inflammatory and neuropathic
pain [84]. However, this picture is complicated by a recent report
showing P2X7 receptor activation down-regulated the expression
of P2X3 in DRGs [85]. Thus, different receptor subtypes within
the P2X family may be important in different types of pain. G
protein cascade components were also only sensitive following P2Y
activation. However, the value of P2Y and associated Gq-protein
targets for the treatment of pain [72,86] remains unclear as G
protein agonists are likely to cross-react and interfere with non-
pain networks.
Materials and Methods
Formulation and solution of the model equationsThe calcium model was formulated as a set of coupled Ordinary
Differential Equations (ODEs):
d x
dt~S:r x,pð Þ x toð Þ~xo ð1Þ
The symbol S denotes the stoichiometric matrix ( 90|162 ). Thequantity x denotes the concentration vector of proteins, protein
complexes or ions ( 90|1 ). The term r x,pð Þ denotes the vector of
reaction rates ( 162|1 ). Each row in S described a protein, protein
complex or ion while each column described the stoichiometry of
network interactions. Thus, the i , j ð Þ element of S, denoted by sij ,
described how species i was involved in rate j . If sij v0, then
protein i was consumed in r j . Conversely, if sij w0, protein i wasproduced by r j . Lastly, if sij ~0, then protein i was not involved in
process j .We assumed mass-action kinetics for each interaction in the
network. The rate expression for protein-protein interaction or
catalytic reaction q:
X j [ Rqf g
s jqx j ?X
p[ Pqf gs pqx p ð2Þ
was given by:
rq x,k qÀ Á
~k q P j [ Rqf g
x{s jq j ð3Þ
The set Rq
È Édenotes reactants for reaction q. The quantity
Pq
È Édenotes the set of products for reaction q. The k q term
denotes the rate constant governing the qth interaction. Lastly,s jq,s pq denote stoichiometric coefficients (elements of the matrix
S ). We treated every interaction in the model as non-negative. All
reversible interactions were split into two irreversible steps. Themass-action formulation, while expanding the dimension of the P2
calcium model, regularized the mathematical structure. The
regular structure allowed automatic generation of the model
equations. In addition, an analytical Jacobian ( A ) and matrix of
partial derivatives of the mass balances with respect to the model
parameters ( B ) were also generated. Mass-action kinetics also
regularized the model parameters. Unknown model parameters
were one of only three types, association, dissociation or catalytic
rate constants. Thus, although mass-action kinetics increased the
number of parameters and species, they reduced the complexity of
model analysis. The one exception to the mass-action formulation
was the flow of ions through gated channels. We modeled thisusing a Nernst-like expression. Flow through gated channels from
compartment a to b was assumed to be directly proportional to the
fraction of open ion-channels C modified by the natural log of theconcentration driving force between compartments:
r flow,a,b~k flow,a,bC |lnCa2za
Ca2zb
ð4Þ
where Ca2z j , j ~a,b denotes the concentration of calcium in
compartment j and k flow,a,b denotes the channel permeability. In
this study, we did not consider intracellular concentration
gradients. However, we accounted for extracellular, cytosolic
and ER compartments by explicitly incorporating compartment
Modeling Calcium Dynamics
PLoS ONE | www.plosone.org 11 September 2009 | Volume 4 | Issue 9 | e6758

8/9/2019 Plos One 2009 Song
http://slidepdf.com/reader/full/plos-one-2009-song 12/15
specific species. We accounted for differences in the volume of
each of the compartments using correction factors. The majorityof the model equations were formulated based on the volume of
the cytosol. ER species were derived from the cytosolic variants bydividing by rER (the volume ratio of the ER and the cytosol) to
correct for the different volume basis. We also corrected for the
effect of Ca2z binding to protein buffers in both the cytosol and
ER. At least 99% of Ca2z in the cytosol is bound to Ca2z binding
proteins of which there are about 200 encoded by the humangenome [87,88]. Similar to previous studies [89], we assumed that
calcium buffering had sufficiently fast kinetics and the net effect of
the buffers was to create effective volumes for the ER and the
cytosol defined as V eER~V ER= f ER and V ei ~V i = f i where f i denoted the fraction of free calcium in the cytosol and f ERdenoted the fraction of free calcium in the ER. The mass balance
equations for Ca2zi and Ca2zER were multiplied by f i and f ERrespectively. The values of rER, f i , and f ER were estimated along
with the other parameter values in the optimization framework.
The model equations were solved using the LSODE routine of
the OCTAVE programming environment (http://www.octave.
org; version 2.9.15) on an Apple Computer (Mac OSX; version
10.5.1, Cupertino CA). Model parameters and structure were
taken from the literature or based on experimental data obtained
in sensory neurons (see Table 1). Possible initial conditions werealso taken from literature [32,50]. However, the initial conditions
of SERCA, PMCA, NCX were estimated as part of the parameter
ensemble. In all simulations, we defined the homeostatic state as
the stable equilibrium point in the absence of ATP stimulation.
Sensitivity analysis of the model equationsSensitivity values were computed by first calculating the first-
order sensitivity coefficients at time tk :
sij tk ð Þ~Lxi
L p j
tk
ð5Þ
which are solutions of the matrix differential equation:
d s j
dt~A tð Þs j zb j tð Þ j ~1,2, . . . ,P ð6Þ
subject to the initial condition s j t0ð Þ~0. In Eqn. 6, the quantity j
denotes the parameter index, P denotes the number of parameters
in the model, A denotes the Jacobian matrix, and b j denotes the
j th column of the matrix of first-derivatives of the mass balances
with respect to the parameter values (denoted by B ). The Jacobian
matrix and the matrix of first-derivatives of the mass balances w.r.tthe parameter values are given by:
A~Lf x
Lx
xÃ,pÃð Þ
B~Lf x
Lp
xÃ,pÃð Þ
ð7Þ
where f x~S:r x,kð Þ and xÃ,pÃð Þ denotes a point along the system
solution. Because the solution of the sensitivity equations required
that we solve the model equations (to evaluate the A and B
matrices), we formulated the sensitivity problem as an extended
kinetic-sensitivity system of equations [90]
_xx
_ss j
~
S:r x,kð Þ
A tð Þs j zb j tð Þ
!j ~1,2, . . . ,P ð8Þ
where _xx~d x=dt and _ss j ~d s j dt. The model parameters were
independent, thus we solved the extended kinetic-sensitivity system
for multiple parameters in a single calculation using the LSODE
routine of OCTAVE. The matrices A and B were estimated at
each time step using their analytical expressions. The sensitivity
coefficients were then normalized by the nominal parameter and
state values:
N ij tk ð Þ~sij tk ð Þ p j xi ð9Þ
The normalized sensitivities could then by time-averaged by
integration (Simpson’s rule):
N ij :1
T
ð T 0
dt: N ij tð Þ ð10Þ
The normalized time-averaged sensitivity N ij describes the
time-averaged change in the state variable xi following a change in
the parameter p j . In addition to analyzing single sensitivity values,
we used the Hearne method to find the most sensitive direction in
the parameter space by estimating parameter combinations that
maximized the difference in calcium model trajectories [63]. Theabsolute values of the eigenvector coefficients corresponding to the
largest eigenvalue of the NNT matrix were ranked-ordered for
each parameter set and averaged over the ensemble.
Estimation of the model parameter ensemble using amulti-objective thermal ensemble technique
The model parameters were estimated from nine independent
data sets taken from multiple laboratories and cell-lines. We
estimated an ensemble of model parameters from the training data
using a Multi-Objective Thermal Ensemble (MOTE) method
(Fig. 7). The MOTE algorithm integrated Simulated Annealing
Figure 7. Multi-objective thermal ensemble algorithm used inthis study.doi:10.1371/journal.pone.0006758.g007
Modeling Calcium Dynamics
PLoS ONE | www.plosone.org 12 September 2009 | Volume 4 | Issue 9 | e6758
8/9/2019 Plos One 2009 Song
http://slidepdf.com/reader/full/plos-one-2009-song 13/15
(SA) with Pareto optimality to estimate parameter sets on or near
the optimal tradeoff surface between the distinct training sets. APareto-optimal energy function was constructed using rank-based
fitness assignment. Denote a candidate parameter set generated atiteration i z1 as ki z1. The Mean Squared Error (MSE) between
simulations and the N training sets at iteration i z1 is given by:
E ki z1ð Þ~ E 1 ki z1ð Þ,E 2 ki z1ð Þ,,E N ki z1ð Þf g ð11Þ
where E ki z1ð Þ denotes the set of model simulation errors over all
training data. The MOTE minimized the simulation error of each
training constraint and balanced conflicts between constraints. We
stored the parameter sets, model output and error estimates which
lie along or near the trade-off surface through iteration i in the
data structure Ki . We computed the Pareto rank of ki z1 by
comparing the simulation error at iteration i z1 against the
simulation archive Ki . We used the Fonseca and Fleming scheme
to compute the Pareto rank [91]. Suppose ki z1 is worse in an
Pareto-optimal sense than p members in the current archive Ki ,
i.e., ki z1 is dominated by p previous parameter sets. Then the
Pareto rank of ki z1 is given by:
rank ki z1 Ki jð Þ~ p ð12Þ
Parameter sets on the optimal trade-off surface have a rank
equal to 0 (no other current parameter sets are better). Sets with
increasing non-zero rank are progressively farther away from the
optimal trade-off surface. Thus, a parameter set with a rank ~0 is
better in a trade-off sense than rank w0. We used the Pareto rank to
inform the SA calculation. The parameter set ki z1 was accepted
or rejected by the SA using the acceptance probability P ki z1ð Þ:
P ki z1ð Þ:exp {rank ki z1jKi ð Þ=T f g ð13Þ
where T is the computational annealing temperature. As
rank ki z1jKi ð Þ?0, the acceptance probability moved toward
one, ensuring that we explored parameter sets along the Paretosurface. Occasionally (depending upon T ) a parameter set with a
high Pareto rank was accepted by the SA allowing a more diverse
search of the parameter space. However, as T was reduced, the
probability of this occurring decreased. Parameter sets could be
accepted by the SA and not archived in Ki . Only parameter sets
with rank ƒ2 were included in Ki to ensure that we characterized
the neighborhood near the trade-off surface. The parameter
ensemble used in the simulation and sensitivity studies was
generated from parameter sets in Ki .
Supporting Information
Supplemental Materials S1 The archive for the Octave filesfor simulating the model
Found at: doi:10.1371/journal.pone.0006758.s001 (0.02 MB ZIP)
Author Contributions
Conceived and designed the experiments: SOS JDV. Performed the
experiments: SOS. Analyzed the data: SOS JDV. Contributed reagents/
materials/analysis tools: SOS JDV. Wrote the paper: SOS JDV.
References
1. Burnstock G, Wood JN (1996) Purinergic receptors: their role in nociception andprimary afferent neurotransmission. Curr Opin Neurobiol 6: 526–532.
2. Tsuda M, Koizumi S, Kita A, Shigemoto Y, Ueno S, et al. (2000) Mechanicalallodynia caused by intraplanar injection of P2X receptor agonist in rats -
involvement of heteromeric P2X2/3 receptor siganling in capsaicin-insensitiveprimary afferent neurons. J Neurosci 20: RC90.
3. Hamilton SG (2002) Atp and pain. Pain Practice 2: 289–294.4. Hilliges M, Weidner C, Schmelz M, Schmidt R, Orstavik K, et al. (2002) ATP
response in human C nociceptors. Pain 98: 59–68.5. Inoue K, Tsuda M, Koizumi S (2003) ATP has three types of pain behaviors,
including allodynia. Drug Dev Res 59: 56–63.
6. Abbracchio MP, Burnstock G (1994) Purinoceptors: Are there families of p2xand p2y purinoceptors. Pharmacol Ther 64: 445–475.
7. Ralevic V, Burnstock G (1998) Receptors for purines and pyrimidines.Pharmacol Rev 50: 413–492.
8. Cesare P, McNaughton P (1997) Periphral pain mechansims. Curr OpinNeurobiol 7: 493–499.
9. Berridge MJ (1997) Elementary and global aspects of calcium signalling. J Physiol499: 291–306.
10. Berridge MJ, Lipp P, Bootman MD (2000) The Versatility and Universality of Calcium Signalling. Nat Rev Mol Cell Biol 1: 11–21.
11. Burgoyne RD (2007) Neuronal calcium sensor proteins: Generating diversity inneuronal Ca2+ signalling. Nat Rev Neurosci 8: 182–193.
12. Kress M, Guenther S (1999) Role of [ca2+
]i in the atp-induced heat sensitizationprocess of rat nociceptor neurons. J Neurophysiol 81: 2612–2619.13. Hagenacker T, Ledwig D, Busselberg D (2007) Feedback mechanisms in the
regulation of intracellular calcium ([ca2+ ]i) in the peripheral nociceptive system:Role of trpv-1 and pain related receptors. Cell Calcium.
14. Carafoli E (2002) Calcium signaling: A tale for all seasons. Proc Natl AcadSci U S A 99: 1115–1122.
15. Chen CC, Akoplan AN, Sivilotti L, Colquhoun D, Burnstock G, et al. (1995) AP2X purinoceptor expressed by a subset of sensory neurons. Nature 377:428–431.
16. Lewis C, Neidhart S, Holy C, North RA, Buell G, et al. (1995) Coexpression of P2X2 and P2X3 receptor subunits can account for ATP-gated currents insensery neurons. Nature 377: 432–435.
17. Burnstock G (2000) P2x receptors in sensory neurons. Br J Anaesth 84: 476–488.
18. Chizh BA, Illes P (2000) P2X receptors and nociception. Pharmacol Rev 53:553–568.
19. Ding Y, Cesare P, Drew L, Nikitaki D, Wood JN (2000) ATP, P2X receptorsand pain pathways. J Autonomic Nerv Sys 81: 289–294.
20. Dunn PM, Zhong Y, Burnstock G (2001) P2X receptors in peripheral neurons.Prog Neurobiol 65: 107–134.
21. North RA (2004) P2X3 Receptors and Peripheral Pain Mechanisms. J Physiol554: 301–308.
22. Jennings EA, Cho HJ (2007) Peripheral Sensitization in Migraine - Role of P2XPurinergic Receptors in the Dura-Vascular Sensory Pathway. Drug Dev Res 68:321–328.
23. Cook SP, McCleskey EW (1997) Desensitization, recovery and Ca2+-depndentmodulation of ATP-gated P2X receptors in nociceptors. Neuropharmacol 36:1303–1308.
24. Sanada M, Yasuda H, Omatsu-Kanbe M, Sango K, Isono T, et al. (2002)Increase in intracellular Ca2+ and calcitonin gene-related peptide releasethrough metabotropic P2Y receptors in rat dorsal root ganglion neurons.Neurosci 111: 413–422.
25. Lustig KD, Shiau AK, Brake AJ, Julius D (1993) Expression cloning of an ATPreceptor from mouse meuroblastoma cells. Proc Natl Acad Sci U S A 90:5113–5117.
26. Koizumi S, Fujishita K, Inoue K, Shigemoto-Mogami Y, Tsuda M (2004) Ca2+waves in keratinocytes are transmitted to sensory neurons: the involvement of extracellular atp and p2y2 receptor activation. Biochem J 380: 329–338.
27. Molliver DC, Cook SP, Carlsten JA, Wright DE, McCleskey EW (2002) ATP
and UTP excite sensory neurons and induced CREB phophorylation throughthe metabotropic receptor, P2Y2. Eur J Neurosci 16: 1850–1860.28. Tominaga M, Wada M, Masu M (2001) Potentiation of capsaicin receptor
activity by metabotropic ATP receptors as a possible mechanism for ATP-evoked pain and hyperalgesia. Proc Natl Acad Sci 98: 6951–6956.
29. Ruan HZ, Burnstock G (2003) Localisation of P2Y1 and P2Y2 receptors indorsal root, nodose and trigeminal ganglia of the rat. Histochem Cell Biol 120:415–426.
30. Stucky CL, Medler KA, Molliver DC (2004) The P2Y agonist UTP activatescutaneous afferent fibers. Pain 109: 36–44.
31. Gerevich Z, Zadori Z, Muller C, Wirkner K, Schroder W, et al. (2007)Metabotropic P2Y receptors inhibit P2X3 receptor channels via G protein-dependent facilitation of their desensitization. Br J Pharmacol 151:226–236.
32. Bhalla US, Iyengar R (1999) Emergent properties of networks of biologicalsignaling pathways. Science 283: 381–387.
Modeling Calcium Dynamics
PLoS ONE | www.plosone.org 13 September 2009 | Volume 4 | Issue 9 | e6758

8/9/2019 Plos One 2009 Song
http://slidepdf.com/reader/full/plos-one-2009-song 14/15
33. Sokolova E, Skorinkin A, Moiseev I, Agrachev A, Nistri A, et al. (2006)Experimental and modeling studies of desensitization of P2X3 receptors. MolPharmacol 70: 373–382.
34. Purvis J, Chatterjee M, Brass LF, Diamond SL (2008) A molecular signaling model of platelet phosphoinositide and calcium regulation during homeostasisand P2Y 1 activation. Blood 112: 4069–4079.
35. Purvis JE, Radhakrishnan R, Diamond SL (2009) Steady-state kinetic modeling constrains cellular resting States and dynamic behavior. PLoS Comput Biol 5:e1000298.
36. Brown KS, Sethna JP (2003) Statistical mechanical approaches to models withmany poorly known parameters. Phys Rev E Stat Nonlin Soft Matter Phys 68:
021904.37. Battogtokh D, Asch DK, Case ME, Arnold J, Schuttler HB (2002) An ensemble
method for identifying regulatory circuits with special reference to the qa genecluster of neurospora crassa. Proc Natl Acad Sci U S A 99: 16904–16909.
38. Brown KS, Hill CC, Calero GA, Myers CR, Lee KH, et al. (2004) The statisticalmechanics of complex signaling networks: nerve groth factor signaling. Phys Biol1: 184–195.
39. Gadkar KG, Varner J, Doyle FJ (2005) Model identification of signaltransduction networks from data using a state regulator problem. Syst Biol(Stevenage) 2: 17–30.
40. Adkins CE, Taylor CW (1999) Lateral inhibition of inositol 1,4,5-trisphosphatereceptors by cytosolic ca2+. Curr Biol 9: 1115–1118.
41. DeYoung G, Keizer J (1992) A single pool inositol 1,4,5-triphosphate-receptor-based model for agonist-stimulated oscillations in ca2+ concentration. Proc Natl
Acad Sci U S A 89: 9895–9899.
42. Doi T, Kuroda S, Michikawa T, Kawato M (2005) Inositol 1,4,5-trisphosphate-dependent ca2+ threshold dynamics detect spike timing in cerebellar purkinjecells. J Neurosci 25: 950–961.
43. Sneyd J, Dufour JF (2002) A dynamic model of the type-2 inositol trisphosphate
receptor. P Natl Acad Sci USA 99: 2398–2403.44. Tang Y, Stephenson J, Othmer HG (1996) Simplification and analysis of models
of calcium dynamics based on ip3 sensitive calcuim channel kinetics. Biophys J70: 246–263.
45. Sneyd J, Falcke M, Dufour JF, Fox C (2004) A comparison of three models of theinositol trisphosphate receptor. Prog Biophy Mol Biol 85: 121–140.
46. Watras J, Bezprozvanny I, Ehrlich BE (1991) Inositol 1,4,5-trisphophaste-gatedchannels in cerebellum: presence of mutiple conductance states. J Neurosci 11:3239–3245.
47. Bezprozvanny I, Watras J, Ehrlich BE (1991) Bell-shaped calcium responsecurves of ins(1,4,5)p3-and calcium-gated channels from endoplasmic reticulumof cerebellum. Nature 351: 751–754.
48. S Lakshmi PGJ (2005) Co-activation of p2y2 receptor and trpv channel by atp:Implications for atp induced pain. Cell Mol Neurobiol 25: 819–832.
49. Willars GB, Nahorski SR, Challiss RAJ (1998) Differential regulation of muscarinic acetylcholine receptor sensitive polyphosphoinositide pools andconsequences for signaling in human neuroblastoma cells. J Biol Chem 273:5037–5046.
50. Lemon G, Gibson W, Bennett M (2003) Metabotropic receptor activation,
desensitization and sequestration-I: modelling calcium and inositol 1,4,5-trisphosphate dynamics following receptor activation. J Theor Biol 223: 93–111.
51. Maurya MR, Subramaniam S (2007) A kinetic model for calcium dynamics inraw 264.7 cells: 1. mechanism, parameter, and subpopulational variability.Biophys J 93: 709–728.
52. Zhao Q, Logothetis DE, Seguela P (2007) Regulation of ATP-gated P2Xreceptors by phosphoinositides. Pflugers Arch - Eur J Physiol 455: 181–185.
53. Bernier LP, Ase AR, Tong X, Hamel E, Blais D, et al. (2008) Direct modulationof P2X1 receptor-channels by the lipid phophatidylinositol 4,5-bisphosphate.Mol Pharmacol 74: 785–792.
54. Bernier LP, Ase AR, Chevallier S, Blais D, Zhao Q, et al. (2008)Phosphoinositides regulate P2X4 ATP-gated channels through direct interac-tions. J Neurosci 28: 12938–12945.
55. Y Fujiwara YK (2006) Regulation of the desensitization and ion selecitvity of atp-gated p2x2 channels by phosphoinositides. J physiol 576: 135–149.
56. He M, Zemkova H, Koshimizu T, Tomic M, Stojilkovic SS (2003) Intracellularcalcium measurements as a method in studies on activity of purinergic P2Xreceptor channels. Am J Physiol Cell Physiol 285: 467–479.
57. Nathanson NM (2008) Synthesis, trafficking, and localization of muscarinicacetylcholine receptors. Pharmacol Ther 119: 33–43.
58. Stelling J, Gilles ED, Doyle FJ, III. (2004) Robustness properties of circadianclock architectures. Proc Natl Acad Sci U S A 101: 13210–13215.
59. Mahdavi A, Davey RE, Bhola P, Yin T, Zandstra PW (2007) Sensitivity Analysisof Intracellular Signaling Pathway Kinetics Predicts Targets for Stem Cell FateControl. PLoS Comput Biol 3: 1257–1267.
60. Luan D, Zai M, Varner JD (2007) Computationally derived points of fragility of a Human Cascade are consistent with current therapeutic strategies. PLoSComput Biol 3: 1347–1359.
61. Nayak S, Salim S, Luan D, Zai M, Varner J (2008) A test of highly optimizedtolerance reveals fragile cell-cycle mechanisms are molecular targets in clinicalcancer trials. PLoS ONE 3: e2016.
62. Chen W, Schoeberi B, Jasper PJ, Niepel M, Nielsen UB, et al. (2009) Input-output behavior of ErbB signaling pathways as revealed by a mass action modeltrained against dynamic data. Mol Sys Biol 5: 1–19.
63. Hearne JW (1985) Sensitivity analysis of parameter combinations. Appl Math
Modelling 9: 106–108.
64. Gover TD, Kao JP, Weinreich D (2003) Calcium signaling in single peripheral
sensory nerve terminals. J Neurosci 23: 4793–4797.
65. Nakayama S, Yamashita T, Konishi M, Kazama H, Kokubun S (2004) P2Y-
mediated Ca2+ response is spatiotemporally graded and synchronized in sensoryneurons: a two-photon photolysis study. FASEB J 18: 1562–1564.
66. Okuse K (2007) Pain signalling pathways: From cytokines to ion channels.
Int J Biochem and Cell Biol 39: 490–496.
67. Prestwich GD (2004) Phosphoinositide signaling: from affinity probes topharmaceutical targets. Chem Biol 11: 619–637.
68. B-C Suh BH (2008) Pip2 is a necessary cofactor for ion channel function: howand why? Annu Rev Biophys 37: 175–195.
69. Zhao Q, Yang M, Ting AT, Logothetis DE (2007) PIP2 regulates the ionic
current of P2X receptors and P2X7 receptor-mediated cell death. Channels 1:46–55.
70. Murthy KS, Makhlouf GM (1998) Coexpression of ligand-gated P2X and G
protein-coupled P2Y receptors in smooth muscle. J Biol Chem 273: 4695–4704.
71. Ruan HZ, Birder LA, de Groat WC, Tai C, Roppolo J, et al. (2005) Localization
of P2X and P2Y receptors in dorsal root ganglia of the cat. J Histochem
Cytochem 53: 1273–1282.
72. Gerevich Z, Illes P (2004) P2Y receptors and pain transmission. Purinergic Sig 1:
3–10.
73. Z Gerevich PI C Muller (2005) Metabotropic p2y1 receptors inhibit p2x3
receptor-channels in rat dorsal root ganglion neurons. Eur J Pharmacol 521.
74. Vial C, Rolf M, Mahaut-Smith MR, Evans RJ (2002) A study of P2X1 receptor
function in murine megakaryocytes and human platelets reveals synergy with P2receptors. Br J Pharmacol 135: 363–372.
75. Paukert M, Osteroth HS R amd Geisler, Brandle U, Glowatzki E,
Ruppersberg JP, et al. (2001) Inflammatory mediators potentiate ATP-gated
channels through the P2X2 subunit. J Biol Chem 276: 21077–21082.
76. Iwamoto T (2004) Forefront of Na+/Ca2+ exchanger studies: molecular
pharmacology of Na+/Ca2+ exchange inhibitors. J Pharmacol Sci 96: 27–32.
77. Nguyen HN, Wang C, Perry DC (2002) Depletion of intracellular calcium stores
is toxic to SH-SY5Y neuronal cells. Brain Res 924: 159–166.
78. Pelled D, Lloyd-Evans E, Riebeling C, Jeyakumar M, Platt FM, et al. (2003)
Inhibition of calcium uptake via the sarco/endoplasmic reticulum Ca2+-ATPase
in a mouse model of Sandhoff disease and prevention by treatment with N-butyldeoxynojirimycin. J Biol Chem 278: 29496–29501.
79. Kurnellas MP, Nicot A, Shull GE, Elkabes S (2005) Plasma membrane calcium
ATPase deficiency causes neuronal pathology in the spinal cord: a potential
mechanism for neurodegeneration in multiple sclerosis and spinal cord injury.
FASEB J 19: 298–300.
80. Lehotsky J, Kaplan P, Murin R, Raeymaekers L (2002) The Role of Plasma
Membrane Ca2+ Pumps (PMCAs) in Pathologies of Mammalian Cells. FrontBiosci 7: d53–d84.
81. Fedirko N, Vats Y, Kruglikov I, Voitenko N (2004) Role of ca2+, mg2+-atpases
in diabetes-induced alterations in calcium homeostasis in input neurons of the
nociceptive system. Neurophysiol 36: 169–173.82. Schuh K, Cartwright EJ, Jankevics E, Bundschu K, Liebermann J, et al. (2004)
Plasma Membrane Ca2+ ATPase 4 Is Required for Sperm Motility and Male
Fertility. J Biol Chem 279: 28220–28226.
83. Burnstock G (2006) Historical review: Atp as a neurotransmitter. Trends
Pharmacol Sci 27: 166–176.
84. Kennedy C (2005) P2X receptors: targets for novel analgesics? The
Neuroscientist 11: 345–356.
85. Chen Y, Zhang X, Wang C, Li G, Gu Y, et al. (2008) Activation of P2X7
receptors in glial satellite cells reduces pain through downregulation of P2X3
receptors in nociceptive neurons. Proc Natl Acad Sci U S A 105: 16773–16778.
86. K V Kolen HS (2006) Integration of p2y receptor-activated signal transduction
pathways in g protein-dependent signaling networks. Purinergic Signalling 2:
451–469.
87. Tse A, Tse FW, Almers W, Hille B (1993) Rhythmic exocytosis stimulated by
gnrh-induced calcium oscillations in rat gonadotropes. Science 260: 82–84.
88. Carafoli E, Santella L, Brance D, Brini M (2001) Generation, control, and
processing of cellular calcium signals. Crit Rev Biochem Mol Biol 36: 107–260.
89. Li Y, Keizer J, Stojilkovic SS, Rinzel J (1995) Ca2+ excitability of the ER
membrane: an explanation for IP3-induced Ca2+ oscillations. Am J Physiol 269:C1079–C1092.
90. Dickinson RP, Gelinas RJ (1976) Sensitivity analysis of ordinary differential
equation systems-a direct method. J Comp Phys 21: 123–143.
91. Fonseca C, Fleming PJ (1993) Genetic Algorithms for Multiobjective
Optimization: Formulation, Discussion and Generalization. In: Proceedings of
the 5th International Conference on Genetic Algorithms. pp 416–423.
92. Colquhoun D (1998) Binding, gating, affinity and efficacy: The interpretation of
structure-activity relationships for agonists and of the effects of mutating
receptors. Br J Pharmacol 125: 923–947.
93. Ross EM, Wilkie TM (2000) Gtpase-activating proteins for heterotrimeric g
proteins: Regulators of g protein signaling (rgs) and rgs-like proteins. Annu RevBiochem 69: 795–827.
94. Mishra J, Bhalla US (2002) Simulations of inositol phosphate metabolism and its
interaction with insp3-mediated calcium release. Biophys J 83: 1298–1316.
Modeling Calcium Dynamics
PLoS ONE | www.plosone.org 14 September 2009 | Volume 4 | Issue 9 | e6758

8/9/2019 Plos One 2009 Song
http://slidepdf.com/reader/full/plos-one-2009-song 15/15
95. Biddlecome GH, Berstein G, Ross EM (1996) Regulation of phospholipase c-beta 1 by gq and m1 muscarinic chloinergic receptor. J Biol Chem 271:7999–8007.
96. Lytton J, Westlin M, Burk SE, Shull GE, MacLennan DH (1992) Functionalcomparisons between isoforms of the sarcoplasmic or endoplasmic reticulumfamily of calcium pumps. J Biol Chem 267: 14483–14489.
97. Blaustein MP, Juhaszova M, Golovina VA, Church PJ, Stanley EF (2002) Na/ca
exchanger and pmca localization in neurons and astrocytes. Ann NY Acad Sci
976: 356–366.
Modeling Calcium Dynamics
PL S ONE | l 15 S t b 2009 | V l 4 | I 9 | 6758