PLGA-based microparticles: elucidation of mechanisms and a ...
12
European Journal of Pharmaceutical Sciences 15 (2002) 355–366 www.elsevier.nl / locate / ejps PLGA-based microparticles: elucidation of mechanisms and a new, simple mathematical model quantifying drug release * N. Faisant, J. Siepmann , J.P. Benoit ´ INSERM ERIT-M 0104, College of Pharmacy, Universite d’ Angers, 16 Boulevard Daviers, 49100 Angers, France Received 16 October 2001; received in revised form 22 February 2002; accepted 27 February 2002 Abstract The two major aims of this study were: (i) to elucidate the underlying release mechanisms from drug-loaded, erodible microparticles based on poly(lactic-co-glycolic acid) (PLGA) showing biphasic drug release behavior: an initial ‘burst’ effect, followed by a zero order release phase; and (ii) to develop a new, simple mathematical model that allows the quantitative description of the observed in vitro drug release patterns from this type of delivery system. PLGA-based microparticles offer various advantages, such as the possibility to control the resulting drug release rate accurately over prolonged periods of time, easiness of administration (e.g., by stereotaxic injection), good biocompatibility and complete erosion (avoiding the removal of empty remnants). Consequently, the practical importance of these advanced drug delivery systems is remarkably increasing. However, only little knowledge is yet available concerning the processes controlling the release rate of the drug out of these devices. Various chemical and physical phenomena are involved, rendering the identification of the crucial mechanisms and the mathematical description of the resulting drug release kinetics difficult. In the present study, different physicochemical characterization methods (e.g., DSC, SEM, SEC, particle size analysis) were used to monitor the changes occurring within anticancer drug-loaded PLGA microparticles upon exposure to phosphate buffer pH 7.4. Based on these experimental findings, the most important underlying drug release rate controlling mechanisms were identified and a new mathematical model was developed that allows the quantitative description of the resulting release patterns. 2002 Elsevier Science B.V. All rights reserved. Keywords: Release mechanism; Mathematical modeling; Microparticle; PLGA; Diffusion 1. Introduction Depending on the type of polymer and design of the device (composition and geometry), different physico- The elucidation of the underlying drug release mecha- chemical processes can be involved in the control of drug nisms and the mathematical modeling of erodible delivery release. As evident, the erosion of the polymer may play systems is not as advanced as for purely diffusion-, or an important role. Roughly, two different types of erosion diffusion- and swelling-controlled release devices, simply behavior can be distinguished: surface (heterogeneous) and because these systems are generally more complex (Crank, bulk (homogeneous) erosion. In surface eroding systems, 1975; Siepmann et al., 1998; Siepmann and Peppas, 2001). polymer degradation is much faster than the water imbibi- In addition to physical mass transport phenomena, chemi- tion into the polymer bulk. Thus, degradation occurs cal reactions (e.g., polymer degradation) have to be predominantly within the outermost polymer layers. Con- considered in erodible systems (Fan and Singh, 1989; sequently, erosion affects only the surface and not the Siepmann and Goepferich, 2001). These reactions change inner parts of the system (heterogeneous process). In the conditions for the occurring mass transfer processes, contrast, bulk eroding polymers degrade more slowly and rendering the mathematical treatment of this type of the imbibition of water into the system is much faster than controlled release system difficult (Baker, 1987; Vert et al., the degradation of the polymer. Hence, the entire device is 1992). rapidly wetted and polymer chain cleavage occurs through- out the system. Consequently, erosion is not restricted to the polymer surface only (homogeneous process). As a *Corresponding author. Present address: College of Pharmacy, Freie basic rule, polymers containing very reactive functional Universitaet Berlin, Kelchstrasse 31, 12169 Berlin, Germany. Tel.: 149- groups tend to degrade fast and to be surface eroding, 30-8385-0613; fax: 149-30-8385-0707. E-mail address: [email protected] (J. Siepmann). whereas polymers with less reactive functional groups tend 0928-0987 / 02 / $ – see front matter 2002 Elsevier Science B.V. All rights reserved. PII: S0928-0987(02)00023-4
Transcript of PLGA-based microparticles: elucidation of mechanisms and a ...

European Journal of Pharmaceutical Sciences 15 (2002) 355–366www.elsevier.nl / locate /ejps
PLGA-based microparticles: elucidation of mechanisms and a new, simplemathematical model quantifying drug release
*N. Faisant, J. Siepmann , J.P. Benoit´INSERM ERIT-M 0104, College of Pharmacy, Universite d’Angers, 16 Boulevard Daviers, 49100 Angers, France
Received 16 October 2001; received in revised form 22 February 2002; accepted 27 February 2002
Abstract
The two major aims of this study were: (i) to elucidate the underlying release mechanisms from drug-loaded, erodible microparticlesbased on poly(lactic-co-glycolic acid) (PLGA) showing biphasic drug release behavior: an initial ‘burst’ effect, followed by a zero orderrelease phase; and (ii) to develop a new, simple mathematical model that allows the quantitative description of the observed in vitro drugrelease patterns from this type of delivery system. PLGA-based microparticles offer various advantages, such as the possibility to controlthe resulting drug release rate accurately over prolonged periods of time, easiness of administration (e.g., by stereotaxic injection), goodbiocompatibility and complete erosion (avoiding the removal of empty remnants). Consequently, the practical importance of theseadvanced drug delivery systems is remarkably increasing. However, only little knowledge is yet available concerning the processescontrolling the release rate of the drug out of these devices. Various chemical and physical phenomena are involved, rendering theidentification of the crucial mechanisms and the mathematical description of the resulting drug release kinetics difficult. In the presentstudy, different physicochemical characterization methods (e.g., DSC, SEM, SEC, particle size analysis) were used to monitor the changesoccurring within anticancer drug-loaded PLGA microparticles upon exposure to phosphate buffer pH 7.4. Based on these experimentalfindings, the most important underlying drug release rate controlling mechanisms were identified and a new mathematical model wasdeveloped that allows the quantitative description of the resulting release patterns. 2002 Elsevier Science B.V. All rights reserved.
Keywords: Release mechanism; Mathematical modeling; Microparticle; PLGA; Diffusion
1. Introduction Depending on the type of polymer and design of thedevice (composition and geometry), different physico-
The elucidation of the underlying drug release mecha- chemical processes can be involved in the control of drugnisms and the mathematical modeling of erodible delivery release. As evident, the erosion of the polymer may playsystems is not as advanced as for purely diffusion-, or an important role. Roughly, two different types of erosiondiffusion- and swelling-controlled release devices, simply behavior can be distinguished: surface (heterogeneous) andbecause these systems are generally more complex (Crank, bulk (homogeneous) erosion. In surface eroding systems,1975; Siepmann et al., 1998; Siepmann and Peppas, 2001). polymer degradation is much faster than the water imbibi-In addition to physical mass transport phenomena, chemi- tion into the polymer bulk. Thus, degradation occurscal reactions (e.g., polymer degradation) have to be predominantly within the outermost polymer layers. Con-considered in erodible systems (Fan and Singh, 1989; sequently, erosion affects only the surface and not theSiepmann and Goepferich, 2001). These reactions change inner parts of the system (heterogeneous process). Inthe conditions for the occurring mass transfer processes, contrast, bulk eroding polymers degrade more slowly andrendering the mathematical treatment of this type of the imbibition of water into the system is much faster thancontrolled release system difficult (Baker, 1987; Vert et al., the degradation of the polymer. Hence, the entire device is1992). rapidly wetted and polymer chain cleavage occurs through-
out the system. Consequently, erosion is not restricted tothe polymer surface only (homogeneous process). As a
*Corresponding author. Present address: College of Pharmacy, Freiebasic rule, polymers containing very reactive functionalUniversitaet Berlin, Kelchstrasse 31, 12169 Berlin, Germany. Tel.: 149-groups tend to degrade fast and to be surface eroding,30-8385-0613; fax: 149-30-8385-0707.
E-mail address: [email protected] (J. Siepmann). whereas polymers with less reactive functional groups tend
0928-0987/02/$ – see front matter 2002 Elsevier Science B.V. All rights reserved.PI I : S0928-0987( 02 )00023-4

356 N. Faisant et al. / European Journal of Pharmaceutical Sciences 15 (2002) 355 –366
to be bulk eroding. PLGA-based microparticles can gener- specific physicochemical phenomena, such as diffusionalally be regarded as bulk eroding dosage forms (Burker- mass transfer and/or chemical reactions. A subclass of thesroda and Goepferich, 1999). latter models simulates polymer degradation as a random
Most often, polymer erosion is not the only process that event using direct Monte Carlo techniques. The theoriescontributes to the control of drug release. After water developed by Hopfenberg (1976) and Cooney (1972) areimbibition into PLGA-based microparticles, drug dissolu- examples for empirical mathematical models, whereastion and the cleavage of the hydrolytically unstable ester Heller and Baker (1980), and Lee (1980) presentedbonds occurs. Simultaneously, the drug diffuses out of the mathematical approaches that consider specific physico-device due to concentration gradients. Drug diffusion can chemical phenomena. Thombre, Joshi and Himmelsteinoccur: (i) predominantly through the polymer matrix; (ii) (Thombre and Himmelstein, 1985; Joshi and Himmelstein,predominantly through water-filled pores; or (iii) through 1991; Thombre, 1992) developed a sophisticated theoryboth, the macromolecular network and water-filled cavities considering autocatalytic effects occurring within erodiblein parallel and/or sequence. In addition, the generated devices. Recently, Charlier et al. (2000) presented anpolymer degradation products can significantly alter the interesting model quantifying drug release from thin PLGA
1microenvironmental conditions, e.g., the H concentration films, considering polymer degradation and drug diffusionwithin the system. Lactic and glycolic acid resulting from simultaneously. Zygourakis (1989, 1990) was the first tothe degradation of PLGA polymers can lead to signifi- use Monte Carlo techniques to simulate polymer degra-cantly decreased pH values at the center of the dosage dation in drug delivery systems. Both, polymer degradationforms (Shenderova et al., 1999). As the degradation of (simulated with Monte Carlo techniques) and diffusionalPLGA is catalyzed by protons, this decrease in the micro mass transport processes (described using Fick’s secondpH can lead to autocatalytic effects and, thus, to acceler- law of diffusion) are taken into account in the modelsated polymer degradation (Spenlehauer et al., 1989; Dunne developed by Goepferich (1996, 1997a,b).et al., 2000). Depending on the size and porosity of the Once an adequate mathematical theory has been founddevice, the imbibition of hydroxide ions from the release or newly developed, it can be used to facilitate themedium into the system and/or the diffusion of generated optimization of the device and/or the development ofmonomeric and/or oligomeric acids out of the system can related systems (Siepmann et al., 1999c; Streubel et al.,be rapid enough to prevent acidic microenvironments and, 2000). For example, the effect of the composition andhence, suppress any autocatalytic effects (Anderson and geometry (size and shape) of the dosage form on theShive, 1997; Sansdrap and Moes, 1997). Furthermore, resulting drug release can be simulated. Thus, the requiredpolymer degradation products can crystallize within the device design to achieve a certain, desired drug releasedosage form (Goepferich and Langer, 1995; Park, 1995), profile can be predicted, minimizing the number of re-leading to modified porosities. Depending on their solu- quired experimental studies (Siepmann et al., 1999a;bility and the respective microenvironmental conditions, Siepmann and Peppas, 2000; Siepmann et al., 2000).these degradation products subsequently dissolve more or PLGA-based microparticles are widely used for theless rapidly and diffuse out of the device. At a critical controlled administration of a drug, because they offertime-point, the polymeric structure of the system becomes various advantages compared to conventional pharmaceu-unstable and leads to the breakdown of the macromolecu- tical dosage forms: (i) good biocompatibility; (ii) easylar network. In contrast to purely diffusion-controlled drug administration (e.g., by stereotaxic injection into the braindelivery systems, the increase in the diffusion pathways tissue); (iii) the possibility to control drug release overwith time can be (over)compensated by the increased prolonged periods of time; and (iv) complete erosionpermeability /porosity of the erodible device, leading to (avoiding the removal of empty remnants). Anticancerconstant or even increasing drug release rates with time. drug-loaded PLGA-based microparticles have been suc-
These and other phenomena can be involved in the cessfully used for the treatment of brain cancer (Boisdron-control of drug release from erodible delivery systems. Celle et al., 1995; Menei et al., 1996, 1999).When developing a new mathematical model, it is not The aim of this study was to elucidate the complexreasonable to take all these processes into account, because phenomena that are involved in the control of drug releasethe theory would become too complex and the model too from PLGA-based microparticles showing biphasic releasecumbersome for routine use. It is, thus, a crucial point to patterns. A detailed physicochemical characterization ofidentify the dominating phenomena and to take only these the system and changes thereof occurring upon exposure tointo account. phosphate buffer was followed by a critical analysis and
Roughly, the mathematical modeling approaches for interpretation of the experimental data. The crucial drugerodible drug delivery systems reported in the literature release rate controlling mechanisms were identified and acan be divided into two categories: (i) empirical models new mathematical model was developed that allows thethat usually assume a single, zero-order process controlling quantification of the resulting drug release kinetics morethe overall drug release rate; and (ii) models considering accurately than already existing theories.

N. Faisant et al. / European Journal of Pharmaceutical Sciences 15 (2002) 355 –366 357
2. Experiments and methods buffer pH 7.4 (containing 0.1% sodium azide to avoidmicrobial growth) (7 ml in each dialysis bag, plus addi-
2.1. Materials tional 500 ml in each vessel) was chosen as releasemedium, kept constant at 37 8C and stirred at 100 rpm. The
Poly(D,L-lactic-co-glycolic acid) (PLGA; Resomer apparatus was protected from light. At pre-determined time506; PLGA 50:50; containing 25% D-lactic units, 25% intervals, 1 ml samples were withdrawn (not replaced withL-lactic units and 50% glycolic units; weight-average fresh medium) and analyzed UV-spectrophotometricallymolecular weight, Mw: approximately 104 kDa) was (Uvikon 922, Kontron, St Quentin en Yvelines, France) atobtained from Boehringer Ingelheim (Paris, France). 5- the following wavelength: l5266 nm. Each experimentFluorouracil (5-FU) was received from Roche (Neuilly sur was conducted in triplicate.Seine, France) (mean particle size: 371619 mm) andmilled in a planetary micro mill (Pulverisette 7, Fritsch, 2.2.4. Determination of initial drug loadingIdar-Oberstein, Germany) until a mean particle size be- Approximately 7 mg drug-loaded microparticles weretween 15 and 20 mm was achieved. dissolved in 50 ml dimethylsulfoxide. After agitation at
room temperature, samples were analyzed UV-spectro-2.2. Methods photometrically (Uvikon 922, Kontron) at l5266 nm.
2.2.1. Microparticle preparation 2.2.5. Monitoring of changes during drug release5-FU-loaded PLGA microparticles (drug loading: ap- To monitor the physicochemical changes occurring
proximately 20% w/w) were prepared with an O/W during drug release, microparticles were treated as de-solvent extraction technique in a 5 g scale. A dispersion of scribed under Section 2.2.3, except that 300 mg micro-4 g drug powder within 45 ml dichloromethane was particles were placed within each dialysis bag (whichprepared using an Ultra turrax (Ika, T25 basic /S25N-10G, did not alter the resulting drug release kinetics, data notStaufen, Germany) (13,500 rpm, 4 min). This organic shown). At predetermined time intervals, dialysis bagsphase was transferred into a 150 ml double-wall reactor, were withdrawn and their contents filtered (0.45 mm). Theand 5 g PLGA were added. To allow complete polymer separated microparticles were then freeze dried and storeddissolution the liquid was stirred for 4 h at room tempera- at 4 8C for further analysis (particle size determination,ture. The 150 ml reactor was then cooled to 2 8C and differential scanning calorimetry [DSC], size exclusionconnected to a 6000 ml double-wall reactor containing chromatography [SEC] and scanning electron microscopy1500 ml aqueous polyvinyl alcohol solution (10% w/w, [SEM]). For the DSC studies half of the samples were only2 8C). The organic phase was rapidly transferred from the deep frozen and not freeze dried, in order to measure the150 ml reactor into the 6000 ml reactor and emulsified glass transition temperature of water-containing micro-within the aqueous phase by stirring with a propeller at particles.375 rpm for 4.75 min at 2 8C. The addition of 4500 mlwater and further stirring for 2 min allowed microparticle 2.2.6. Particle size analysishardening. The latter were separated by filtration under Particle size distributions and mean diameters werenitrogen pressure (0.8 bar, filtration system supplied by determined using a Coulter Counter (Multisizer, Coul-Sartorius, Palaiseau, France) with a cellulose ester filter tronics, Margency, France). Microparticles (approximatelymembrane (8 mm, Millipore, Saint Quentin en Yvelines, 10 mg) were suspended by sonication for 10 min in anFrance). The microparticles were then freeze dried and aqueous solution of Tween 80 (0.02% w/v) and assayed
sieved (125 mm). To minimize residual solvents they were after dilution in Isoton II (Coultronics).also vacuum dried at 37 8C for 72 h.
2.2.7. Differential scanning calorimetry2.2.2. Gamma-irradiation The glass transition temperature of the polymer (Tg) in
Approximately 700 mg microspheres were placed in wet and freeze dried samples was analyzed by differentialvials, sealed under vacuum and gamma-irradiated (19.6 scanning calorimetry (Mettler Toledo, Viroflay, France).
60kGy) using a Co source (performed at Ionosos, Dagneux, Approximately 5 mg samples were heated in sealedFrance). aluminum pans (investigated temperature range: 230 to
1330 8C, heating rate: 10 8C/min, two heating cycles).2.2.3. Drug release studies
Sterilized and non-sterilized, drug-loaded microparticles 2.2.8. Size exclusion chromatography(approximately 40 mg) were placed within dialysis bags Microparticles were dissolved in dimethylsulfoxide(molecular weight cut-off 6–8 kDa; Bioblock, Illkirch, (0.5% w/v). One volume part of this solution was mixedFrance) at the bottom of USP XXIV paddle apparatus glass with three volume parts of the mobile phase (tetrahydro-vessels (Sotax AT7, Sotax, Basel, Switzerland). Phosphate furane:methanol:acetic acid, 85:15:0.8 v /v /v). Approxi-

358 N. Faisant et al. / European Journal of Pharmaceutical Sciences 15 (2002) 355 –366
mately 200 ml of this mixture were injected into a size drug 5-FU from erodible PLGA microparticles into phos-exclusion (gel permeation) chromatography (SEC) ap- phate buffer pH 7.4 at 37 8C. The release rates fromparatus equipped with a precolumn (Shodex KGF, Waters, gamma-sterilized (19.6 kGy) and from non-sterilizedSt Quentin en Yvelines, France), two main columns microparticles are shown. Three observations are important
E(Styragel HR1, Waters; PL-gel 5 mm 10 4A, Polymer indicators for the underlying drug release mechanism: (i)Laboratories, Marseille, France) and a refractometric detec- Both release profiles are biphasic. An initial ‘burst’ phasetor (RID-10A, Shimadzu, Touzart et Matignon, Cour- (25–35% of the total amount of drug is released within thetaboeuf, France). All measurements were performed at a first 24 h) is followed by a zero-order drug release phase;flow-rate of 1 ml /min at room temperature. The system (ii) Drug release is complete after 3 weeks in both cases;was calibrated with polystyrene standards (PS-2, Polymer (iii) Gamma-sterilization leads to an increased ‘burst’Laboratories, Marseille, France). All indicated molecular effect, but does not significantly affect the release rateweights are weight-average molecular weights (Mw). during the subsequent, constant drug release phase. To
adequately analyze these data, additional information is2.2.9. Scanning electron microscopy required, such as the particle shape, size and surface
The external and internal morphology of sterilized and morphology and the glass transition temperature of thenon-sterilized microparticles was characterized by scan- polymer, Tg.ning electron microscopy (SEM). Samples were carboncoated (10 nm) using a MED 020 (Baltec, Balzers, 3.2. Particle shape, size and surface morphologyLiechtenstein) and observed on a JEOL 6301F fieldemission microscope (JEOL, Paris, France) (voltage: 5 Fig. 2 shows SEM pictures of surfaces of sterilizedkV). The MED 020 coater evaporates carbon at elevated 5-FU-loaded PLGA microparticles at time t50 (beforetemperatures and reduced pressure. The carbon sub- drug release), at two different magnifications. Pictures ofsequently deposits on the surface of the sample, formingvery thin layers. Cross-sections of the microparticles wereobtained after inclusion into epon (Epon 812 Fluka, SaintQuantin Fallavier, France) (liquid monomers serve assuspension vehicle and are subsequently polymerizedunder solidification) and cutting with a diamond knife(Leica Ultracut S, Rueil Malmaison, France).
3. Results and discussion
3.1. In vitro drug release kinetics
Fig. 1 illustrates the release kinetics of the anticancer
Fig. 1. Experimentally determined in vitro drug release kinetics from Fig. 2. SEM pictures of surfaces of 5-FU-loaded PLGA microparticles5-FU-loaded PLGA microparticles into phosphate buffer pH 7.4 at 37 8C. before drug release (t50): (a) population; (b) single microparticle. Here,Open circles correspond to sterilized (19.6 kGy), filled squares to non- only sterilized microparticles are shown, the morphology of non-sterilizedsterilized microparticles (n53). microparticles being very similar.

N. Faisant et al. / European Journal of Pharmaceutical Sciences 15 (2002) 355 –366 359
non-sterilized microparticles are very similar (data notshown). From Fig. 2a illustrating a population of particles,it is clear that the shape of these devices can be assumed tobe spherical. The mean particle radius before drug releasewas determined to be equal to 26 mm. Fig. 2b shows thevery smooth surface of a single microparticle at time t50.Importantly, no non-encapsulated drug was visible on anyof the SEM pictures (Fig. 2). Thus, the initial ‘burst’ effectobserved with both types of microparticles (Fig. 1) canneither be attributed to non-encapsulated 5-FU, nor to drugrelease through ‘macropores’ (size .100 nm) or from drugcavities (size .100 nm) directly connected to the surfaceof the particles. Wang et al. (2000a,b) could show that theinitial burst effect observed with their system (octreotideacetate-loaded PLGA microparticles) can probably be
Fig. 3. Evolution of the glass transition temperature of the polymer uponattributed to pores in the size range of 0.1 to 1 mm whichexposure of 5-FU-loaded PLGA microparticles to phosphate buffer pH
are initially present at the surface (t50). Upon water 7.4 at 37 8C. The Tg was determined by DSC scans. Data obtained withimbibition, these surface pores are closed within the first lyophilized and non-lyophilized microparticles are shown.24 h, leading to a dense, film-like diffusion barrier. It hasto be emphasized that the smooth surface of the micro-particles observed by SEM (Fig. 2b) only indicates the lyophilized microparticles. As can be seen, the Tg of theabsence of ‘macropores’ (size .100 nm), ‘nanopores’ (size polymer remains about constant during the first 2 weeks in,100 nm) would not be visible with the applied technique. both cases. Importantly, the Tg of non-lyophilized micro-Thus, it cannot be excluded that ‘nanopores’ are initially particles is well below the temperature of the systempresent at the surface and—similar to Wang’s system— (37 8C, broken line). Thus, the polymer is in the rubberycause the observed ‘burst’ effect. state allowing reasonably high drug diffusion rates through
Furthermore, a mono- or multi-layer of adsorbed drug its matrix. In contrast, the Tg of the PLGA of themolecules onto the surface of the microparticles would not lyophilized microparticles is above the temperature of thebe visible in the SEM pictures. But the extent and rate of system, indicating that the polymer is in the glassy state.drug release during the first 24 h makes it very unlikely This clearly shows the importance of water acting as athat such adsorbed layers significantly contribute to the plasticizer. Upon exposure to the release medium, waterobserved ‘burst’ effect. imbibes into the system (due to concentration gradients)
and lowers the Tg of the polymer, resulting in a phase3.3. Glass transition temperature of the polymer transition from the glassy to the rubbery state. Fig. 4 shows
exemplarily the DSC thermograms of sterilized, lyophil-The glass transition temperature of the polymer and its ized (curve A) and non-lyophilized (curve B) 5-FU-loaded
evolution during drug release is a very important feature PLGA microparticles which had been exposed to thewhen elucidating the underlying release mechanism from release medium for 1 day. Clearly, the Tg is lowered in thecontrolled delivery systems. If the polymer is in the glassy wetted particles. The large endothermic peak at 0 8C instate (T,Tg), the mobility of the macromolecules is very curve B corresponds to the melting of frozen water.low (Fan and Singh, 1989). Thus, the free volume avail-able for diffusion and, consequently, the diffusion rate of
3.4. Exact solution of Fick’s second law of diffusion,the drug through the polymer matrix are very small.
monolithic solutionGenerally, the latter is negligible compared to the diffusionrate of the drug through water-filled pores. In contrast, if
Based on the above described experimental findings, athe polymer is in the rubbery state (T.Tg), the macro-
simple mathematical approach was used to describe themolecules are much more mobile and the resulting drug
observed in vitro drug release rates from sterilized anddiffusion coefficients are orders of magnitudes higher than
non-sterilized 5-FU-loaded PLGA microparticles. Thisin the glassy state (Fan and Singh, 1989). Drug diffusion
theory assumes that drug release is governed solely bythrough the polymer matrix can be the sole transport
diffusion, a mass transfer process which can be quantifiedmechanism, or be combined with drug diffusion through
using Fick’s second law (Crank, 1975):water-filled pores.
Fig. 3 shows the evolution of the glass transition ≠c ≠ ≠c ≠ ≠c ≠ ≠c] ] ] ] ] ] ]5 SD D1 D 1 SD D (1)S Dtemperature of the polymer in the investigated system upon ≠t ≠x ≠x ≠y ≠y ≠z ≠z
exposure to phosphate buffer pH 7.4. The Tg was de-termined by DSC scans of both, lyophilized and non- Here, c and D are the concentration and the diffusion

360 N. Faisant et al. / European Journal of Pharmaceutical Sciences 15 (2002) 355 –366
Fig. 4. DSC thermograms of sterilized, 5-FU-loaded PLGA microparticles which were exposed to the release medium for 1 day (curve A showslyophilized, curve B non-lyophilized particles).
coefficient of the diffusing species, respectively; t repre- trolled drug delivery systems generally show a very highsents time, and x, y and z the three spatial coordinates. drug release rate at the beginning due to small diffusion
Considering the spherical geometry of the investigated pathways at early time-points (Siepmann et al., 1999b).system (radius, r), and assuming: (i) constant drug diffu- Thus, the ‘burst’ effect might be attributable to a ‘normal’sion coefficients; (ii) perfect sink conditions; and (iii) a diffusion-controlled drug release. At later time-points, alsouniform initial drug concentration that is smaller than the other phenomena seem to contribute to the release mecha-solubility of the drug within the system (monolithic nism. However, it has to be kept in mind that the presentedsolution), the following analytical solution of Fick’s sec- mathematical modeling approach (Eq. (2)) is not suitableond law of diffusion can be used to describe the resulting to describe the observed drug release rates over the entiredrug release rate (Crank, 1975): period of time. Thus, any mechanistic interpretation should
be viewed with caution. The following drug diffusivities` 2 2M 6 1 D ? n ? p ? tt
] ] ] ]]]]5 1 2 ?O ? exp 2 (2)S D2 2 2M p n r` n51
where M and M denote the cumulative absolute amountt `
of drug released at time t and at infinite time, respectively.As the existence of ‘nanopores’ cannot be excluded, Drepresents an apparent diffusivity, taking into account drugtransfer through the polymer itself as well as possible drugtransfer through water-filled ‘nanopores.’
Fitting Eq. (2) to the experimentally determined drugrelease rate from sterilized and non-sterilized 5-FU-loadedPLGA microparticles does not lead to good agreementbetween theory and experiment (Fig. 5, solid curves). Thefitting procedure was based on the minimization of theresulting differences between experimental and theoreticalvalues (least squares method, combined with a modifiedsimplex method: Nelder–Mead method). Significant devia-
2tions result, the coefficients of determination (R ) being Fig. 5. Fit of an exact solution of Fick’s second law of diffusion(considering spherical device geometry, constant drug diffusivity, perfectequal to 0.92 and 0.93, respectively. Interestingly, thesink conditions, monolithic solutions, Eq. (2): solid curves) and of theinitial ‘burst’ phase seems to be described rather well,Koizumi model (Eq. (3): dashed curves) to the experimentally determined
whereas the subsequent constant drug release phase is drug release rate from 5-FU-loaded PLGA microparticles into phosphatedescribed very poorly. This might indicate a possible buffer pH 7.4 at 37 8C. The symbols represent the experimental data,explanation for the ‘burst’ effect. Purely diffusion-con- whereas the curves represent the fitted theoretical values.
Kinam Park
Highlight
Kinam Park
Highlight
Kinam Park
Highlight
Kinam Park
Highlight
Kinam Park
Highlight
Kinam Park
Highlight
Kinam Park
Highlight
Kinam Park
Highlight
Kinam Park
Highlight
Kinam Park
Highlight
Kinam Park
Highlight

N. Faisant et al. / European Journal of Pharmaceutical Sciences 15 (2002) 355 –366 361
213 2within the system were obtained: D56.7310 cm /s213 2for sterilized and D54.7310 cm /s for non-sterilized
microparticles. The higher value for the sterilized devicescan be explained by the chain cleavage effect of gamma-irradiation on PLGA (Spenlehauer et al., 1988). Withdecreasing polymer molecular weight the mobility of themacromolecules increases and, thus, the free volumeavailable for diffusion and the diffusion coefficient of thedrug increase (Fan and Singh, 1989).
3.5. Approximate solution of Fick’s second law ofdiffusion, monolithic dispersion, constant drug diffusivity
One major assumption of the above described theory isthat the drug is molecularly dispersed within the system(monolithic solution). To study the initial distribution ofthe drug within the investigated devices, SEM pictures ofcross-sections of the microparticles at time t50 (beforedrug release) were taken (Fig. 6, only sterilized microparti-cles are shown, the structure of non-sterilized microparti-cles being very similar). Clearly, the internal structure ofthe devices is very heterogeneous. The drug is locatedwithin cavities of different sizes and distributed throughoutthe microparticles. The higher magnifications (Fig. 6b andc) of the SEM pictures and the drug melting peaksobserved in DSC scans (e.g., Fig. 4, curve A) indicate thatat least parts of the drug are in crystalline form. Thus, thedrug is distributed throughout the device in the form ofcrystals or a mixture of crystals and amorphous agglomer-ates and the assumption of a molecular distribution withinthe polymer at time t50 is not fulfilled.
In the literature, different mathematical models havebeen reported quantifying drug release from devices inwhich the drug is homogeneously distributed throughoutthe system with an initial drug concentration higher thanthe solubility of the drug in the carrier material (monolithicdispersions) (Crank, 1975; Lee, 1980; Fan and Singh,1989). The most important theory of this type wasdeveloped by Higuchi (1961). The principle of his ap-proach (a pseudo steady-state assumption) is illustrated inFig. 7 for the geometry of a thin slab (for reasons ofsimplicity). The resulting concentration profiles of a drug
Fig. 6. SEM picture of cross-sections of 5-FU-loaded PLGA microparti-initially suspended in an ointment are illustrated. The solidcles before drug release (t50), at three different magnifications (a), (b)line represents the drug concentration profile after expo-and (c). The hatched regions correspond to the epon that was used to
sure of the ointment to perfect sink for a certain time t. As obtain the cross-sections, the dark grey regions correspond to PLGA, thecan be seen, there is a sharp discontinuity at distance h bright grey regions to 5-FU. Here, only sterilized microparticles are
shown, the morphology of non-sterilized microparticles being veryfrom the surface. For this distance h above the absorbingsimilar.surface the concentration gradient is essentially constant,
provided, the initial drug concentration within the system,c , is much greater than the solubility of the drug (c ..0 0
c ). After an additional time interval, Dt, the new con-s
centration profile of the drug is given by the broken line. case of planar devices. Later, he extended his theory alsoAgain, a sharp discontinuity and otherwise linear con- to spherical geometry, deriving an implicit mathematicalcentration profiles result. Under these particular conditions equation quantifying drug release (Higuchi, 1963). A veryHiguchi derived the very simple relationship between the similar approach was used by Koizumi and Panomsukrelease rate of the drug and the square root of time in the (1995). The advantage of their solution is that the obtained

362 N. Faisant et al. / European Journal of Pharmaceutical Sciences 15 (2002) 355 –366
3.6. Approximate solution of Fick’s second law ofdiffusion, monolithic dispersion, time-dependent drugdiffusivity
Upon exposure to the release medium water imbibesinto the microparticles and leads to the hydrolytic degra-dation of the PLGA molecules (ester bond cleavage). Asdiscussed above, smaller polymer chains are less restrictivefor drug diffusion than larger ones. Thus, the diffusioncoefficient of the drug in this type of delivery system is notconstant, but increases with time. The evolution of themacromolecular weight (Mw) of the PLGA in the investi-gated 5-FU-containing microparticles upon exposure toFig. 7. Pseudo steady-state approach applied for the derivation of the
classical Higuchi model quantifying drug release from planar systems phosphate buffer pH 7.4 is illustrated in Fig. 8 (normal–(monolithic dispersion). Theoretical concentration profile existing in an normal plot and semi-logarithmic plot). Clearly, the mac-ointment containing suspended drug and in contact with a perfect sink.
romolecular weight decreases right from the beginning. Asa straight line is obtained in the semi-logarithmic plot,polymer degradation follows first order kinetics. Thismight be seen as a first indication that autocatalytic effects
(approximate) equation is in an explicit form and, thus, accelerating polymer degradation at the center of theeasier to handle than the respective Higuchi equation: devices do not play a major role in the investigated system.
Pronounced autocatalytic effects would lead to deviations4 ? c ? D ? t from the first order kinetics of polymer degradation]]]]]] s2 F ]]]M 5 4 ? p ? r ? 2 ? c 2 c ? c ? D ? t 1s dœt 0 s s 9 ? r (increasing degradation rate constant with time). However,
c it has to be pointed out that only average moleculars]]]? 2 3 (3)S DG weights have been determined. Thus, deviations of only2 ? c 2 c0 s
parts of the polymer bulk from first order degradationHere, M is the cumulative absolute amount of drug might be difficult to be seen. From the slope of the straightt
released at time t; r represents the radius of the spherical line in Fig. 8 (semi-logarithmic plot) the degradation rate21device; c and c are the initial drug concentration and the constant was determined, being equal to 0.46 weeks .0 s
solubility of the drug within the system, respectively; and This value is in good agreement with data reported in theD denotes the constant diffusion coefficient of the drug. literature (Kenley et al., 1987; Lewis, 1990; Chiu et al.,
The fit of this equation to the experimentally determined 1995).drug release rate from sterilized and non-sterilized 5-FU- Interestingly, the critical threshold value of 20 kDa iscontaining PLGA microparticles is shown in Fig. 5 (dashedcurves), resulting in slightly better agreement betweentheory and experiment compared to the monolithic solution
2approach (R 50.93 and 0.94, respectively). The obtaineddiffusion coefficients of the drug are much higher than thediffusivities determined with the ‘monolithic solution
212 2model’: D55.7310 cm /s for sterilized and D54.13212 210 cm /s for non-sterilized microparticles (compared to
213 2 213D56.7310 cm /s for sterilized and D54.73102cm /s for non-sterilized microparticles with the ‘mono-
lithic solution model’). This is in good agreement with thetheory, the initial drug loading being approximately oneorder of magnitude higher than the drug solubility withinthe investigated system. Thus, the calculated concentrationgradients (driving forces for diffusion) are approximately10-times smaller in the ‘Koizumi model’ than in the‘monolithic solution model.’ This is compensated by thedifference in the diffusion coefficients.
Fig. 8. Evolution of the polymer molecular weight (Mw) in 5-FU-loadedHowever, the deviation between theory and experimentPLGA microparticles upon exposure to phosphate buffer pH 7.4 at 37 8C:
is still important, which might be attributable to the fact normal–normal plot (left Y-axis) and semi-logarithmic plot (right Y-axis).that the Koizumi model was developed for non-degradable The solid curve and solid line represent exponential fits, the broken linespolymers. critical threshold values (discussed in the text).
N. Faisant et al. / European Journal of Pharmaceutical Sciences 15 (2002) 355 –366 363
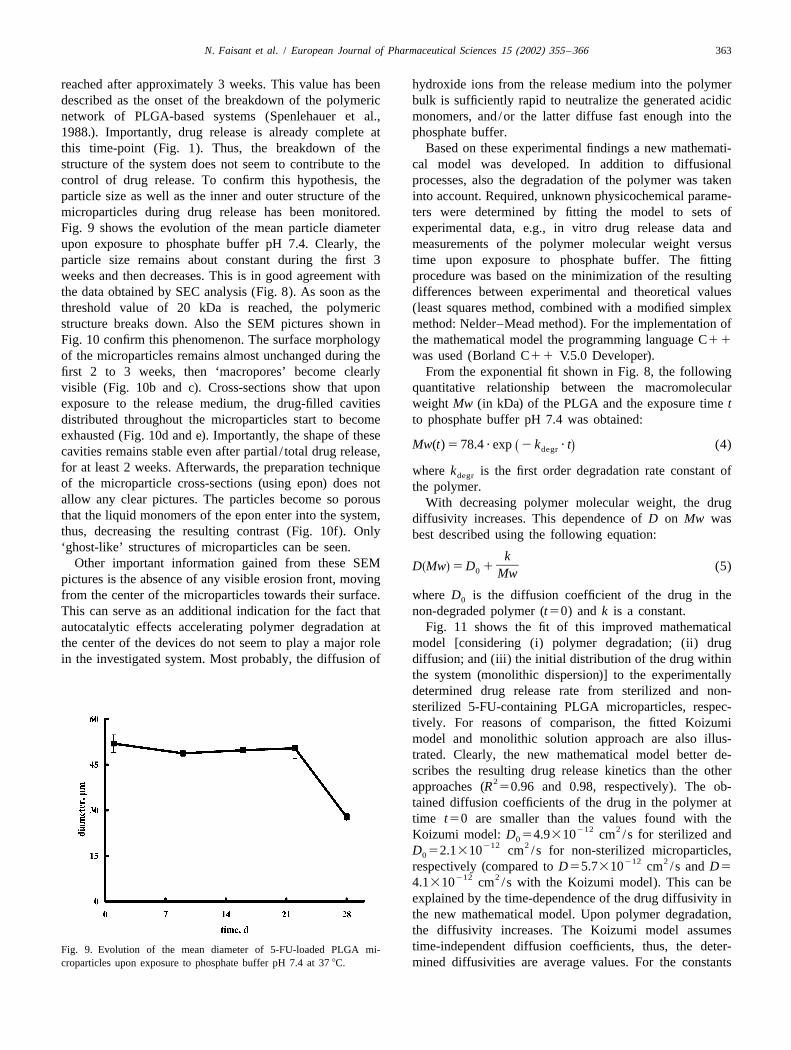
reached after approximately 3 weeks. This value has been hydroxide ions from the release medium into the polymerdescribed as the onset of the breakdown of the polymeric bulk is sufficiently rapid to neutralize the generated acidicnetwork of PLGA-based systems (Spenlehauer et al., monomers, and/or the latter diffuse fast enough into the1988.). Importantly, drug release is already complete at phosphate buffer.this time-point (Fig. 1). Thus, the breakdown of the Based on these experimental findings a new mathemati-structure of the system does not seem to contribute to the cal model was developed. In addition to diffusionalcontrol of drug release. To confirm this hypothesis, the processes, also the degradation of the polymer was takenparticle size as well as the inner and outer structure of the into account. Required, unknown physicochemical parame-microparticles during drug release has been monitored. ters were determined by fitting the model to sets ofFig. 9 shows the evolution of the mean particle diameter experimental data, e.g., in vitro drug release data andupon exposure to phosphate buffer pH 7.4. Clearly, the measurements of the polymer molecular weight versusparticle size remains about constant during the first 3 time upon exposure to phosphate buffer. The fittingweeks and then decreases. This is in good agreement with procedure was based on the minimization of the resultingthe data obtained by SEC analysis (Fig. 8). As soon as the differences between experimental and theoretical valuesthreshold value of 20 kDa is reached, the polymeric (least squares method, combined with a modified simplexstructure breaks down. Also the SEM pictures shown in method: Nelder–Mead method). For the implementation ofFig. 10 confirm this phenomenon. The surface morphology the mathematical model the programming language C11
of the microparticles remains almost unchanged during the was used (Borland C11 V.5.0 Developer).first 2 to 3 weeks, then ‘macropores’ become clearly From the exponential fit shown in Fig. 8, the followingvisible (Fig. 10b and c). Cross-sections show that upon quantitative relationship between the macromolecularexposure to the release medium, the drug-filled cavities weight Mw (in kDa) of the PLGA and the exposure time tdistributed throughout the microparticles start to become to phosphate buffer pH 7.4 was obtained:exhausted (Fig. 10d and e). Importantly, the shape of these
Mw(t) 5 78.4 ? exp 2 k ? t (4)s ddegrcavities remains stable even after partial / total drug release,for at least 2 weeks. Afterwards, the preparation technique where k is the first order degradation rate constant ofdegrof the microparticle cross-sections (using epon) does not the polymer.allow any clear pictures. The particles become so porous With decreasing polymer molecular weight, the drugthat the liquid monomers of the epon enter into the system, diffusivity increases. This dependence of D on Mw wasthus, decreasing the resulting contrast (Fig. 10f). Only best described using the following equation:‘ghost-like’ structures of microparticles can be seen.
kOther important information gained from these SEM ]D Mw 5 D 1 (5)s d 0 Mwpictures is the absence of any visible erosion front, movingfrom the center of the microparticles towards their surface. where D is the diffusion coefficient of the drug in the0
This can serve as an additional indication for the fact that non-degraded polymer (t50) and k is a constant.autocatalytic effects accelerating polymer degradation at Fig. 11 shows the fit of this improved mathematicalthe center of the devices do not seem to play a major role model [considering (i) polymer degradation; (ii) drugin the investigated system. Most probably, the diffusion of diffusion; and (iii) the initial distribution of the drug within
the system (monolithic dispersion)] to the experimentallydetermined drug release rate from sterilized and non-sterilized 5-FU-containing PLGA microparticles, respec-tively. For reasons of comparison, the fitted Koizumimodel and monolithic solution approach are also illus-trated. Clearly, the new mathematical model better de-scribes the resulting drug release kinetics than the other
2approaches (R 50.96 and 0.98, respectively). The ob-tained diffusion coefficients of the drug in the polymer attime t50 are smaller than the values found with the
212 2Koizumi model: D 54.9310 cm /s for sterilized and0212 2D 52.1310 cm /s for non-sterilized microparticles,0
212 2respectively (compared to D55.7310 cm /s and D5212 24.1310 cm /s with the Koizumi model). This can be
explained by the time-dependence of the drug diffusivity inthe new mathematical model. Upon polymer degradation,the diffusivity increases. The Koizumi model assumestime-independent diffusion coefficients, thus, the deter-Fig. 9. Evolution of the mean diameter of 5-FU-loaded PLGA mi-
croparticles upon exposure to phosphate buffer pH 7.4 at 37 8C. mined diffusivities are average values. For the constants

364 N. Faisant et al. / European Journal of Pharmaceutical Sciences 15 (2002) 355 –366
Fig. 10. SEM pictures of 5-FU-loaded PLGA microparticles upon exposure to phosphate buffer pH 7.4 at 37 8C: (a) surface at time t51 day; (b) surface attime t524 days, lower magnification; (c) surface at time t524 days, higher magnification; (d) cross-section at time t51 day, lower magnification; (e)cross-section at time t51 day, higher magnification; (f) cross-section at time t524 days. Only sterilized microparticles are shown, the morphology ofnon-sterilized microparticles being very similar.
characterizing the dependence of the diffusivity on the [y(x) 2 y(x) ] are positive at early time-points,i,exp i,theo
molecular weight of the polymer, the following values become negative for intermediate time-points and then211 2have been found: k52.1310 cm 3kDa/s for sterilized again positive at late time-points. This structure in the
211 2and k55.9310 cm 3kDa/s for non-sterilized mi- residuals is observed in both cases, sterilized and non-croparticles. This difference might be attributed to the fact sterilized microparticles and indicates that certain assump-that this parameter is not a universal constant, but depends tions of the model are not realistic and/or that not all theon the physicochemical properties of the system. Gamma- important physicochemical phenomena have been takensterilization might induce changes that affect the depen- into account. A more accurate mathematical description ofdence of the drug diffusivity on the polymer molecular the polymer degradation and microparticle erosion processweight. might help to eliminate this deviation between theory and
Although the agreement between theory and experiment experiment. For example, the underestimation of drugcould be improved, it can clearly be seen in Fig. 11 that release at late time-points might be due to the beginning ofthere are still systematic deviations. The resulting residuals the breakdown of the polymeric structure, which is neg-

N. Faisant et al. / European Journal of Pharmaceutical Sciences 15 (2002) 355 –366 365
R. Filmon (Service Commun de Microscopie Electronique,´ ´ ´Faculte de Medecine, Universite d’Angers, Angers,
France) for the SEM pictures and to J. Haffner for herassistance.
References
Anderson, J.M., Shive, M.S., 1997. Biodegradation and biocompatibilityof PLA and PLGA microspheres. Adv. Drug Del. Rev. 28, 5–24.
Baker, R., 1987. Controlled Release of Biologically Active Agents. JohnWiley & Sons, New York.
Boisdron-Celle, M., Menei, P., Benoit, J.P., 1995. Preparation andcharacterization of 5-fluorouracil-loaded microparticles as biodegra-dable anticancer drug carriers. J. Pharm. Pharmacol. 47, 108–114.
Burkersroda, F., Goepferich, A., 1999. An approach to classify degrad-Fig. 11. Fit of the new mathematical model to the experimentally
able polymers. In: Neenan, T., Marcolongo, M., Valentini, R.F. (Eds.),determined drug release rate from 5-FU-loaded PLGA microparticles into
Biomedical Materials—Drug Delivery, Implants and Tissue Engineer-phosphate buffer pH 7.4 at 37 8C. The open circles and filled squares
ing. Symp. Proceed. 550, Mat. Res. Soc, pp. 17–22.correspond to experimental data, the fitted theory is represented by series
Charlier, A., Leclerc, B., Couarraze, G., 2000. Release of mifepristoneof black crosses (microparticle radius: 26 mm, obtained diffusion co-
from biodegradable matrices: experimental and theoretical evaluations.212 2efficients of the drug: D 54.9*10 cm /s for sterilized, and D50 Int. J. Pharm. 200, 115–120.212 22.1*10 cm /s for non-sterilized microparticles). For reasons ofChiu, L.K., Chiu, W.J., Cheng, Y.-L., 1995. Effects of polymer degra-
comparison, the fitted Koizumi model and monolithic solution approachdation on drug release — a mechanistic study of morphology and
(dashed and solid curves, respectively) are also illustrated.transport properties in 50:50 poly(DL-lactide-co-glycolide). Int. J.Pharm. 126, 169–178.
Cooney, D.O., 1972. Effect of geometry on the dissolution of pharma-lected in the present model. But even if the newly ceutical tablets and other solids: surface detachment kinetics control-developed mathematical model does not take into account ling. AIChE J. 18, 446–449.
Crank, J., 1975. The Mathematics of Diffusion. Clarendon Press, Oxford.all processes occurring during drug release from PLGA-Dunne, M., Corrigan, O.I., Ramtoola, Z., 2000. Influence of particle sizebased microparticles, it represents a clear improvement
and dissolution conditions on the degradation properties of polylac-compared to the theories so far reported in the literature. In tide-co-glycolide particles. Biomaterials 21, 1659–1668.addition, the new model has the major advantage of being Fan, L.T., Singh, S.K., 1989. Controlled Release: A Quantitative Treat-simple and, thus, easy to handle. The obtained accuracy is ment. Springer—Verlag, Berlin.
Goepferich, A., Langer, R., 1995. Modeling monomer release fromsufficient for many practical purposes.bioerodible polymers. J. Controlled Release 33, 55–69.
Goepferich, A., 1996. Mechanisms of polymer degradation and erosion.Biomaterials 17, 103–114.
4. Conclusion Goepferich, A., 1997a. Bioerodible implants with programmable drugrelease. J. Controlled Release 44, 271–281.
Goepferich, A., 1997b. Erosion of composite polymer matrices. Bioma-Drug release from the investigated PLGA-based mi-terials 18, 397–403.croparticles is biphasic (initial ‘burst’, followed by a zero-
Heller, J., Baker, R.W., 1980. Theory and practice of controlled drugorder drug release phase) and is predominantly controlled delivery from bioerodible polymers. In: Baker, R.W. (Ed.), Controlledby drug diffusion. However, there is a significant contribu- Release of Bioactive Materials. Academic Press, New York, pp. 1–18.tion of the polymer degradation process: upon water Higuchi, T., 1961. Rate of release of medicaments from ointment bases
containing drugs in suspensions. J. Pharm. Sci. 50, 874–875.imbibition, the average molecular weight of the macro-Higuchi, T., 1963. Mechanisms of sustained action mediation. Theoreticalmolecules decreases, leading to increased drug diffusion
analysis of rate of release of solid drugs dispersed in solid matrices. J.coefficients. Importantly, the breakdown of the polymeric Pharm. Sci. 52, 1145–1149.network occurs only after drug exhaust and, thus, does not Hopfenberg, H.B., 1976. Controlled release from erodible slabs, cylin-contribute to the control of the release process. A new ders, and spheres. In: Paul, D.R., Harris, F.W. (Eds.). Controlled
Release Polymeric Formulations. ACS Symp. Ser. No. 33. Americanmathematical model has been developed that allows theChemical Society, Washington, pp. 26–32.quantitative description of the resulting drug release kinet-
Joshi, A., Himmelstein, K.J., 1991. Dynamics of controlled release fromics more accurately than existing theories. bioerodible matrices. J. Controlled Release 15, 95–104.
Kenley, R.A., Lee, M.O., Mahoney, T.R., Sanders, L.M., 1987. Poly-(glycolide-co-lactide) decomposition kinetics in-vivo and in-vitro.Macromolecules 20, 2398–2403.Acknowledgements
Koizumi, T., Panomsuk, S.P., 1995. Release of medicaments fromspherical matrices containing drug in suspension: theoretical aspects.
This work was supported by the European Commission Int. J. Pharm. 116, 45–49.(Marie Curie Individual Fellowship, Contract No. HPMF- Lee, P.I., 1980. Diffusional release of a solute from a polymeric matrix—CT-1999-00033). Furthermore, the authors are grateful to approximate analytical solutions. J. Membr. Sci. 7, 255–275.

366 N. Faisant et al. / European Journal of Pharmaceutical Sciences 15 (2002) 355 –366
Lewis, D.H., 1990. Controlled release of bioactive agents from lactide / Siepmann, J., Goepferich, A., 2001. Mathematical modeling of bioerod-glycolide polymers. In: Chasin, M., Langer, R. (Eds.), Biodegradable ible, polymeric drug delivery systems. Adv. Drug Del. Rev. 48,Polymers as Drug Delivery Systems. Marcel Dekker, New York, pp. 229–247.1–42. Siepmann, J., Peppas, N.A., 2001. Modeling of drug release from delivery
Menei, P., Boisdron-Celle, M., Croue, A., Guy, G., Benoit, J.P., 1996. systems based on hydroxypropyl methylcellulose (HPMC). Adv. DrugEffect of stereotactic implantation of bioerodible 5-fluorouracil-loaded Del. Rev. 48, 139–157.microspheres in healthy and C6 glioma-bearing rats. Neurosurgery 39, Spenlehauer, G., Vert, M., Benoit, J.P., Chabot, F., Veillard, M., 1988.117–124. Biodegradable cisplatin microspheres prepared by the solvent evapora-
Menei, P., Venier-Julienne, M.-C., Gamelin, E., Saint-Andre, J.-P., Hayek, tion method: morphology and release characteristics. J. ControlledG., Jadaud, E., Fournier, D., Mercier, P., Guy, G., Benoit, J.P., 1999. Release 7, 217–229.Local and sustained delivery of 5-fluorouracil from biodegradable Spenlehauer, G., Vert, M., Benoit, J.P., Boddaert, A., 1989. In vitro and inmicrospheres for the radiosensitization of glioblastoma: a pilot study. vivo degradation of poly(DL-lactide /glycolide) type microspheresCancer 86, 324–329. made by solvent evaporation method. Biomaterials 10, 557–563.
Park, T.G., 1995. Degradation of poly(lactic-co-glycolic acid) micro- Streubel, A., Siepmann, J., Peppas, N.A., Bodmeier, R., 2000. Bimodalspheres: effect of copolymer composition. Biomaterials 16, 1123– drug release achieved with multi-layer matrix tablets: transport mecha-1130. nisms and device design. J. Controlled Release 69, 455–468.
Sansdrap, P., Moes, A.J., 1997. In vitro evaluation of the hydrolytic Thombre, A.G., Himmelstein, K.J., 1985. A simultaneous transport–degradation of dispersed and aggregated poly(DL-lactide-co-glycolide) reaction model for controlled drug delivery from catalyzed bioerodiblemicrospheres. J. Controlled Release 43, 47–58. polymer matrices. AIChE J. 31, 759–766.
Shenderova, A., Burke, T.G., Schwendeman, S.P., 1999. The acidic Thombre, A.G., 1992. Theoretical aspects of polymer biodegradation:microclimate in poly(lactide-co-glycolide) microspheres stabilizes mathematical modeling of drug release and acid-catalyzed poly(ortho-camptothecins. Pharm. Res. 16, 241–248. ester) biodegradation. In: Vert, M., Feijen, J., Albertsson, A., Scott, G.,
Siepmann, J., Ainaoui, A., Vergnaud, J.M., Bodmeier, R., 1998. Calcula- Chiellini, E. (Eds.), Biodegradable Polymers and Plastics. Redwoodtion of the dimensions of drug–polymer devices based on diffusion Press, Melksham, pp. 214–228.parameters. J. Pharm. Sci. 87, 827–832. Vert, M., Feijen, J., Albertsson, A., Scott, G., Chiellini, E., 1992.
Siepmann, J., Kranz, H., Bodmeier, R., Peppas, N.A., 1999a. HPMC- Biodegradable Polymers and Plastics. Redwood Press, Melksham.matrices for controlled drug delivery: a new model combining Wang, J., Wang, B.M., Schwendeman, S.P., 2000a. Characterization of thediffusion, swelling and dissolution mechanisms and predicting the initial burst drug release from poly(D,L-lactide-co-glycolide) micro-release kinetics. Pharm. Res. 16, 1748–1756. spheres I: multiphasic release behavior uncovered by continuous
Siepmann, J., Lecomte, F., Bodmeier, R., 1999b. Diffusion-controlled monitoring. In: Proceedings AAPS Annual Meeting, Indianapolis,drug delivery systems: calculation of the required composition to USA.achieve desired release profiles. J. Controlled Release 60, 379–389. Wang, J., Wang, B.M., Schwendeman, S.P., 2000b. Characterization of the
Siepmann, J., Podual, K., Sriwongjanya, M., Peppas, N.A., Bodmeier, R., initial burst drug release from poly(D,L-lactide-co-glycolide) micro-1999c. A new model describing the swelling and drug release kinetics spheres II: alterations in surface permeability implicated in cessationfrom hydroxypropyl methylcellulose tablets. J. Pharm. Sci. 88, 65–72. of burst release. In: Proceedings AAPS Annual Meeting, Indianapolis,
Siepmann, J., Kranz, H., Peppas, N.A., Bodmeier, R., 2000. Calculation USA.of the required size and shape of hydroxypropyl methylcellulose Zygourakis, K., 1989. Discrete simulations and bioerodible controlledmatrices to achieve desired drug release profiles. Int. J. Pharm. 201, release systems. Polym. Prep. ACS 30, 456–457.151–164. Zygourakis, K., 1990. Development and temporal evolution of erosion
Siepmann, J., Peppas, N.A., 2000. Hydrophilic matrices for controlled fronts in bioerodible controlled release devices. Chem. Eng. Sci. 45,drug delivery: an improved mathematical model to predict the 2359–2366.resulting drug release kinetics (the ‘sequential layer’ model). Pharm.Res. 17, 1290–1298.