
PLFPS V8 public - EPA WA | EPA Western...
82
APPENDIX 6 Health Risk Assessment – Dioxin
Transcript of PLFPS V8 public - EPA WA | EPA Western...

APPENDIX 6Health Risk Assessment – Dioxin

PLFPS v8 public Dioxin Health Risk Assessment 25/06/02
Proponent: Blair Fox Generation WA Pty Ltd Suite 1, 164 Beaufort St. Perth WA 6000 Telephone: 9227 0633 / 9228 8846 Fax: 9227 0488 Email: [email protected]
Facility: Poultry Litter Fired Power Station
Location: Muchea Western Australia Brand Highway 70km north of Perth
Health Risk Assessment – Dioxin Consultants: Dingle & Bird Environmental Pty Ltd

PLFPS v8 public Dioxin Health Risk Assessment 25/06/02
Disclaimer and Limitation This report has been prepared on behalf of and for the exclusive use of the Client, and is subject to and issued in accordance with the agreement between the Client and Dingle & Bird Environmental Pty Ltd. Dingle & Bird Environmental Pty Ltd accepts no liability or responsibility whatsoever in respect to its use, or reliance upon, by any third party outside of its intended use for regulatory assessment. This document has been abridged for public use. Copying of this report or any part thereof is not permitted without the authorisation of the Client or Dingle & Bird Environmental Pty Ltd. Client: Blair Fox Generation WA Pty Ltd
Job No: 91-01 Version Prepared by Reviewed by Submitted to Client
Status Copies Date
Draft Report 5 KW MR DR
29/11/01
Final Report 6 KW PD 2 Hard, CD 3/12/01
Public Report 7 KW PD PDF 11/06/02
Dingle & Bird Environmental Pty Ltd Tel: (08) 9319 3754 Fax: (08) 9319 3616
EMAIL [email protected]

PLFPS v8 public Dioxin Health Risk Assessment 25/06/02
EXECUTIVE SUMMARY
This report is a Health Risk Assessment (HRA) that estimates the increased exposure to dioxins and furans that individuals may experience due to the Proposed Poultry Litter Fired Power Station that will be located near the town of Muchea, Western Australia. The proposed facility will burn approximately 100,000 tonnes per annum (13 tonne/hr) of poultry litter, to produce superheated steam, which in turn is passed through a turbine to produce approximately 11 MW of electricity. This study used a multi-pathway approach to estimate the effects emissions produced from the facility will have on local human dioxin exposure. Firstly, dispersion modelling was conducted for ‘worst-case’ and ‘expected’ dioxin emissions from the facility combined with other local sources of dioxins (Tiwest). The ‘Worst-case’ equates to 90% availability of the baghouse and ‘expected’ to 100% availability. This is significant to the HRA as the baghouse will contain GORE-TEX REMEDIA D/F catalytic filters that destroy gaseous dioxins and furans and captures solid phase particulates. The results of the dispersion modelling were applied to an exposure model similar to that recommended by the US EPA for human dioxin exposure assessment. This involved assessing two scenarios: a ‘high-end’ scenario; which represents individuals that might come into contact with higher concentrations of dioxins via their lifestyle (such as farmers) and a ‘central’ scenario; which represents residential individuals. For each scenario an assessment of: food ingestion, air inhalation, soil dermal contact, child soil ingestion and water ingestion was conducted. High-end individuals were assumed to consume locally grown fruit and vegetables, beef and chicken (includes eggs) and collect their own drinking water from their roof. The ‘worst-case’ emissions modelled with the lifestyle of a ‘high-end’ individual showed that very low dioxin exposures would result from the facility even when operated under worst-case conditions. When this is combined with assumed background dioxin levels the resulting exposure for adults is 0.358pg TEQ/kgBW-d and for children is 0.317pg TEQ/kgBW-d. When compared to the WHO Tolerable Daily Intake (TDI) of 1 to 4pg TEQ/kgBW-d both of these scenario results are seen to be small and therefore, according to the WHO TDI, dioxin exposure levels from the facility are acceptable. Assessment of the worst-case emission (90% baghouse availability), whilst providing a valuable insight into the possible dioxin exposure from the proposed facility could be considered unrealistic. It should be noted under such a scenario dioxin exposure has been assumed to be the maximum likely for every assessed parameter. The likely exposure from the facility operating under expected conditions, i.e. 100% baghouse availability, and a central exposure scenario will result in increases above the background concentration of approximately 0.0000000000085pg TEQ/kgBW-d for children and approximately 100 times lower again for adults. When these results are combined with the background concentration of 0.3pg TEQ/kgBW-d, no significant change occurs.

PLFPS v8 public Dioxin Health Risk Assessment 25/06/02
TABLE OF CONTENTS
Executive Summary Introduction....................................................................................................................................1
1.1 Facility location..................................................................................................1 1.2 Need for the facility...........................................................................................2 1.3 Facility description............................................................................................3 1.4 Facility emissions ..............................................................................................5
1.4.1 Dioxin and furan emissions .............................................................................5 1.4.1.1 Dioxin and furan Health Risk Assessment ...................................................5
Chapter 2 Health Risk assessment..................................................................................6 2.1 Introduction........................................................................................................6 2.2 Receptors of dioxin...........................................................................................7 2.3 Pathway exposure ............................................................................................7 2.4 US EPA Procedure for Estimating Exposure ...............................................8
2.4.1 Step 1. Identify sources ...................................................................................8 2.4.2 Step 2. Estimate release rates .......................................................................8 2.4.3 Step 3. Estimate exposure point concentrations .........................................9 2.4.4 Step 4. Characterise exposure patterns .......................................................9 2.4.5 Step 5. Characterise exposure scenarios.....................................................9 2.4.6 Step 6. Estimate exposure and risk...............................................................9 2.4.7 Step 7. Assess uncertainty ...........................................................................10
Chapter 3 Dioxins and furans ..........................................................................................11 3.1 Background......................................................................................................11 3.2 Toxic equivalency...........................................................................................12 3.3 Sources and emissions..................................................................................14
3.3.1 Australian sources and emissions ...............................................................15 3.3.2 Emissions to air...............................................................................................16
3.4 Proposed facility emissions ...........................................................................17 3.4.1 Atmospheric concentration from the proposed facility..............................18 3.4.2 Emissions from coal Vs poultry litter ...........................................................19 3.4.3 Global Olivine Western Australia estimated emissions ............................20
3.5 Health risks from exposure ...........................................................................20 3.6 Nursing infants exposure...............................................................................20
Chapter 4 risk assessment ..............................................................................................22 4.1 Estimating exposure.......................................................................................22 4.2 Background exposure ....................................................................................22 4.3 Exposure model for GOWA facility..............................................................22 4.4 Exposure model for proposed facility..........................................................24
4.4.1 Exposure Pathways and Parameters ..........................................................26 4.4.2 Soil Related Exposures .................................................................................27
4.4.2.1 Soil Ingestion...................................................................................................27 4.4.2.2 Soil Dermal Contact .......................................................................................27

PLFPS v8 public Dioxin Health Risk Assessment 25/06/02
4.4.3 Water Ingestion...............................................................................................28 4.4.4 Ingestion of Terrestrial Food Products ........................................................28 4.4.5 Air inhalation....................................................................................................28 4.4.6 Lifetime average daily dose (LADD)............................................................28
Chapter 5 Discussion........................................................................................................30 References ..................................................................................................................................32 Glossary.......................................................................................................................................34 Appendices..................................................................................................................................35

PLFPS v8 public Dioxin Health Risk Assessment 25/06/02

PLFPS v8 public Page 1 of 35 Dioxin Health Risk Assessment 25/06/02
INTRODUCTION
1.1 Facility location
The proposed facility is located near Muchea, approximately70 kilometres north of Perth on the Brand Highway (figure 1). The title details are District Swan Suburb Muchea Location 713/1809 in Certificate of Title Volume 1070 Folio 936. The AMG location is 400998 mE and 6510178mN.
Figure 1.1 Proposed Poultry Litter Fired Power Station, Brand Highway Muchea.
The Brand Highway borders the site on the east. The adjacent land uses are farming to the north, west and south, and Tiwest Joint Venture’s Chandala mineral processing operation to the east. The Alinta Gas Muchea Offtake lies on the northern boundary of the site. The site is currently zoned Rural 2: general farming with provision for special use of the land. The nearest residential dwelling is 1.4 km away. Table 1.1 lists the map coordinate locations of the nearest nine residential dwelling.
N
500 m

PLFPS v8 public Page 2 of 35 Dioxin Health Risk Assessment 25/06/02
Table 1.1 Location of the nearest residences. Source Environmental Alliances.
AMG Easting (m) AMG Northing (m) Distance from facility (m) 399583 6512926 3091 399555 6512804 2996 400031 6511945 2014 400056 6511769 1787 400098 6511673 1745 400122 6511531 1612 400476 6511461 1385 401551 6507932 2313 401912 6508091 2278
1.2 Need for the facility
The Western Australian poultry industry supplies poultry meat to the State’s domestic market. The industry produces some 33 million birds annually and production is increasing at 4% per annum. A waste stream from this industry is some 250,000 cubic metres of poultry litter per annum. The litter contains a mixture of about 70% by volume manure, and 30% sawdust or some other bedding material (Agriculture WA 1998). The industry has always disposed of poultry litter to the horticultural industry for use as fertiliser. Unfortunately, once in the open environment, the litter provides an ideal site for stable flies to breed. Breeding may take place while the litter is temporarily in stockpiles, or in clumps once the litter is distributed upon the ground. The adverse impacts of stable flies have increased over time with the encroachment of urban development and other sensitive land uses in proximity to market gardens. More than 2,000 public complaints were, received between 1994 and 1997, by agriculture WA and local authorities in areas where flies are a problem. Grievances included people being “harassed, attacked and bitten” by flies resulting in the inability to conduct social activities in backyards, and livestock owners advising that stock were suffering and even dying as a result of fly harassment (Agriculture WA 1998). The Minister for Primary Industry and Fisheries established the Stable Fly Project in 1996 to develop and implement management practices to control stable fly breeding associated with horticultural and agricultural practices. This project will alleviate the problems associated with stable fly breeding in poultry litter by having the litter generate electricity. This follows similar practices adopted in Europe and the United States. This method of generation is similar to that of a coal power station, except that poultry litter is used as the fuel instead of coal. The energy produced from the proposed facility is classified as renewable because the inherent carbon is from biological sources. The office of Energy has confirmed the classification, and has determined that the output from the proposed poultry litter fired power station will displace 81,000 tonnes of fossil fuel generated CO2 per annum.

PLFPS v8 public Page 3 of 35 Dioxin Health Risk Assessment 25/06/02
The greenhouse benefit is further enhanced if nitrous oxide emissions generated from biological decomposition of poultry litter used as a fertiliser are taken into account. After allowing for nitrous oxide emissions that occur during combustion of the poultry litter, the additional greenhouse gas benefit of the proposal compared to the existing situation is conservatively estimated to be more than 16,000 tonnes per annum of equivalent CO2 emissions (Welker Environmental Consultancy 2000).
1.3 Facility description
The proposed power station will receive poultry litter from farms in the broad Perth region. The litter will be stockpiled in a purpose built shed (figure 1.2). Combustion air for the boiler will be drawn across the stockpile reducing associated odour problems. The plant will burn approximately 100,000 tonnes per annum (13 tonne/hr) of poultry litter, to produce superheated steam, which in turn is passed through a turbine to produce approximately 11 MW of electricity. The power plant is expected to have an operational availability of approximately 94% per annum (8200 hrs). Boiler start-up will be achieved using natural gas. Change over to poultry litter will occur once the furnace temperature is above 8500C. Combustion gases from the boiler will be directed to a baghouse scrubbing circuit and emitted through a 40 metre tall stack. The baghouse will be fitted with GORE-TEX REMEDIA D/F catalytic filter.
Figure 1.2 Overview of the proposed facility, depicting the poultry litter storage
shed and power plant.

PLFPS v8 public Page 4 of 35 Dioxin Health Risk Assessment 25/06/02
The baghouse filter system is suitable for combustion process based applications such as incinerators, pyrometallurgical plants and cement kilns. The GORE-TEX filters destroy gaseous dioxins and furans and capture solid phase particulates via the use of expanded polytetrafluoroethylene (PTFE) membranes laminated to a catalytic felt substrate. Captured particles are removed from the surface of the filter by high-pressure purge air and collected in the bottom of the baghouse hopper. Gaseous dioxin and furan molecules passing through the membrane into the felt instantly react with the catalyst converting them into CO2, H2O and HCl (see figure 1.3).
Figure 1.3 Cut-away view of typical baghouse compartment showing installation of
sock-like filters. Insert depicts action of GORE-TEX filters.
The baghouse will be fitted with equipment for the continuous measurement of particulate emissions. An alarm system will alert operators to changes in operating parameters and system failure. Redundancy in the number of compartments allows baghouses to continue to operate and meet emission specifications even in the event that one compartment is taken off-line for maintenance or repairs. Based on current experience, manufacturers of the GORE-TEX filter system have instructed the proponent that the GORE-TEX system when operated under normal operating and maintenance conditions will reduce the proposed facility’s dioxins and furans emissions by 90 – 95%. Under higher emission concentrations the GORE-TEX filter system is capable of removing up to 99% of all dioxins and furans. Appendix 1 documents correspondence from Gore-Tex and some of the extensive field and laboratory tests that validate the dioxins and furans reduction properties of the GORE-TEX REMEDIA D/F catalytic filter. The lifespan of the project is estimated at twenty-five years. The baghouse filters have an expected minimum lifespan of more than five years.
Clean Gas
Raw Gas
Hopper Dust

PLFPS v8 public Page 5 of 35 Dioxin Health Risk Assessment 25/06/02
1.4 Facility emissions
The proposed facility will release airborne emissions into the surrounding environment. Welker Environmental Consultancy was commissioned to undertaken an air quality assessment of the proposed facility to estimate emissions from the facility in order to ensure estimated emissions of key contaminants did not exceed legislative limits. Emission estimates for the following substances were modelled:
• Sulphur dioxide; • Hydrogen chloride; • Nitrogen oxides; • Heavy metals; • Dioxins and furans; and • Particulates.
The proponent is committed to minimising the release of contaminants and has given a clear undertaking to develop an environmental management plan to meet its environmental objectives. The proponent will develop an Environmental Management System (EMS) that is in accordance with the principles of ISO 14001 standard. Furthermore, the proponent will, after plant commissioning, undertake stack testing to verify that emissions of key contaminants are within licensed limits.
1.4.1 Dioxin and furan emissions
Dioxins and furans are unintentional substances formed during many industrial processes. In the case of industrial combustion processes minute quantities are formed in the low-temperature post-combustion zone of the stack through some heterogenous catalytic reactions occurring in the flue gas – fly ash environment (Huang 1995). Present knowledge about sources of PCDD and PCDF is mainly based on experiences from a few industrialised countries of the Northern Hemisphere. The toxicity of dioxins and furans began to be recognised some 40 years ago. Concern over the potential adverse effects of dioxins, is amplified by their resistance to metabolism and tendency to remain in the body fat of animals and humans for prolonged intervals. In recent years concern over the toxicity and exposure to dioxins and furans has seen the World Health Organisation (WHO) reduce its Tolerable Daily Intake (TDI) of dioxin and furans.
1.4.1.1 Dioxin and furan Health Risk Assessment
In line with increased local and international concern over personal exposure to dioxin and furans the proponent is required by the Department of Environmental Protection (DEP) to develop a Health Risk Assessment report (HRA) regarding dioxin and furan emissions from the proposed facility. The aim of the HRA is to assess whether emissions of dioxins and furans from the proposed facility will, in conjunction with background exposure concentrations, increase the TDI of the residents living in the surrounding area to levels above that of the prescribed 1998 WHO limit.

PLFPS v8 public Page 6 of 35 Dioxin Health Risk Assessment 25/06/02
CHAPTER 2 HEALTH RISK ASSESSMENT
2.1 Introduction
Health Risk Assessments (HRA) provide risk findings, estimates of human health risks associated with a site, activity or facility. Risk managers use HRA risk findings for many purposes and these findings guide risk reduction measures (Belluck 2001). HRA findings are often numerical and are compared to numerical regulatory criteria, official or informal measures of acceptable and unacceptable risk. If HRA numerical risk findings do not exceed numerical criteria, risks are typically deemed “acceptable” or “insignificant”. Risk findings that exceed applicable risk criteria are typically considered “unacceptable” or “significant”. Exceeding risk criteria may pose serious legal and economic results for a regulated entity because these numbers serve as triggers for regulatory action (Belluck 2001). Health risk assessments require the following:
• Details of the facility, such as process and location. Identification of other sources of the chemical.
• Identification of potential receptors for chemical exposure such as residential areas, schools, hospitals, activities such as farming, sensitive ecosystems etc.
• Estimation of emissions from the source. This may involve modelling for a proposed facility or direct monitoring for an existing one.
• Identification of exposure pathways (in the case of dioxins this is primarily ingestion, although dermal contact and inhalation may occur) and the potential exposure scenarios. These scenarios are based on the activities of the wide range of people in the community and the potential it gives for chemical exposure i.e. a farmer will have higher exposure to chemicals through their contact with soil, animals and vegetables than a typical urban resident.
• An estimate of exposure for the general community is required. An estimate for sensitive members of the community is also required. This would include children (who are generally more sensitive to chemical exposure) and those people, such as farmers, whose daily activities expose them more to chemicals.
• A comparison of estimated exposures for human exposures against numerical regulatory criteria.
The principal numerical criteria of this HRA was the WHO98 TDI. Evaluation of the risk of cancer was not required as per advice from the Department of Environmental Protection (Pers. Comm. Richard Sutherland October 2001).

PLFPS v8 public Page 7 of 35 Dioxin Health Risk Assessment 25/06/02
2.2 Receptors of dioxin
This assessment looks at the impact of dioxins on humans via exposure to the environment and the agricultural food chain. Individuals most vulnerable to chemicals are those in the developing stages of life, such as foetus and infants. This study has assessed the impact of dioxin exposure from the proposed facility on children as a separate category due to the growing evidence of the effects dioxins has at this important stage of development. The effect of high level dioxin exposure on children varies, however researchers agree on the possible adverse impacts on neurological development. This can be assessed by looking at movement co-ordination, (e.g. sitting, crawling, standing and walking) as a way of measuring the quality and integrity of brain function (Huisman et al. 1995). It has also been found that infants who were exposed to higher levels of these chemicals in the womb, and via breast feeding, had changes in the number of certain immune system cells. It is not known what the health impacts of this later in life are (Weisglas-Kuper et al. 1995).
2.3 Pathway exposure
The consumption of meat, diary products, eggs and fish, makes up more than 90% of the intakes of dioxins for the general population. In addition breathing low levels in air and drinking low levels in water as well as dermal contact may also be a source of exposure (Environment Australia 1999). Figure 2.1 provides an overview of possible exposure pathways and their linkages.
Figure 2.1 pathway exposure pathways for stack emissions. Source adapted from
U.S. EPA (2000a).

PLFPS v8 public Page 8 of 35 Dioxin Health Risk Assessment 25/06/02
2.4 US EPA Procedure for Estimating Exposure
The ”greatest resource existing today” for information regarding dioxins is the US EPA final draft document titled “Exposure and Human Health Reassessment of 2,3,7,8-Tetrachlorodibenzo-p-Dioxin (TCDD) and Related Compounds”. The US EPA draft document along with other resources such as WHO and United Nation reports have been extensively used in this assessment for the purposes of establishing general information, existing background levels and exposures and exposure modelling methods. The US EPA has identified seven steps in their procedure for estimating exposure to dioxins. Before making exposure estimates, an assessor needs to gain a thorough understanding of the exposure setting and be prepared to estimate exposure media concentrations (US EPA 2000).
2.4.1 Step 1. Identify sources
Three principal sources are addressed in the US EPA Draft document. The first, identified as ‘soil contamination’, is called a source in that the starting point of the assessment is a bounded area of soil contamination. For exposure and risk assessment purposes, the cause for contamination is not relevant except to assume that the cause is not ongoing and the impact of the ‘initial’ levels is what is being evaluated. For contaminated soils, exposures could occur on the site of contamination or distant from the site contamination. The second principal source is called ‘stack emissions’. Unlike the soil source, the contamination is assumed to be on-going. Stack emissions in particulate form are assumed to deposit onto the soil and vegetation at the site of exposure, and emissions in vapour form result in airborne concentrations that transfer into vegetation at sites of exposure. The third principal source is called ‘effluent discharges’. Such discharges represent point source inputs to surface water bodies. This assessment has identified stack emissions as the principal source of dioxins and furans. No sites of contaminated soil are known to exist in the study area and on-site surface water (including stormwater) will be directed to two lined evaporation ponds.
2.4.2 Step 2. Estimate release rates
Estimating the release of contaminants from the initial source is the first step towards estimating the concentration in the exposure media. The US EPA has provided draft guidelines for transport modelling procedures estimating soil releases to media such as food and directly to humans. Stack emissions are releases into the environment and release rates have been estimated in this case by using the monitoring results from the Eye Power Station; a similar facility that is already established in the United Kingdom.

PLFPS v8 public Page 9 of 35 Dioxin Health Risk Assessment 25/06/02
2.4.3 Step 3. Estimate exposure point concentrations
Site exposure concentrations were predicted by modelling the dispersion and deposition of stack plumes. The US EPA Draft document describes how soil and vegetation concentrations are estimated given contaminant concentrations and deposition rates, and also how release rates from soil initially contaminated translate to exposure point concentrations.
2.4.4 Step 4. Characterise exposure patterns
Assessor’s attempt to determine the concentrations of chemicals in a medium or location and link this information with the time that individuals or populations are in contact with the chemical. The set of assumptions about how this contact takes place is referred to as an: ‘exposure scenario’ (U.S. Environmental Protection Agency 1992). These assumptions can be made many different ways producing a wide variety of scenarios and associated exposure levels. The number of people exposed at different levels forms a distribution or continuum of exposures. The information necessary for developing a population distribution is rarely available, and accordingly the US EPA recommends developing a central and high-end scenario to provide some idea of the possible range of exposure levels. Such an approach has been affirmed by Browner (1995) as appropriate. The US EPA Draft document states that exposed individuals in the scenarios are individuals who are exposed in their home; this assessment uses the same assumption. The exposure pathways are evaluated at this stage and for dioxins these include inhalation, ingestion and soil dermal contact. Each pathway has a set of parameters that need to be determined/estimated. Examples include contact rates, contact fractions, body weights and lifetime.
2.4.5 Step 5. Characterise exposure scenarios
A common framework for assessing exposure is with the use of ‘settings’ and ‘scenarios’. Settings are the physical aspects of an exposure area and the scenario characterises the behaviour of the population in the setting and determines the severity of the exposure. A wide range of exposures are possible depending on the behaviour pattern assumptions. An exposure scenario framework offers the opportunity to vary any number of assumptions and parameters to demonstrate the impact of changes to exposure and risk estimates.
2.4.6 Step 6. Estimate exposure and risk
The US EPA Draft has described the basic equation that estimates exposure for each assumed pathway in an exposure scenario. The sum of all the potential pathways in an ‘exposure scenario’ gives the total human exposure for an individual living under those conditions assessed.

PLFPS v8 public Page 10 of 35 Dioxin Health Risk Assessment 25/06/02
2.4.7 Step 7. Assess uncertainty
Chapter 7 of the US EPA Draft provides a discussion on model validation and provides several exercises where the models of their assessment were validated with real world data. Therefore the model that this assessment has been based on has been validated. It should be noted that assumptions made in this assessment are stated where used and not collectively at the end of the report.

PLFPS v8 public Page 11 of 35 Dioxin Health Risk Assessment 25/06/02
CHAPTER 3 DIOXINS AND FURANS
3.1 Background
Dioxins (polychlorinated dibenzo-p-dioxins) and furans (polychlorinated dibenzofurans) are often referred to as PCDDs and PCDFs or simply dioxins. Dioxins are chemically classed as halogenated aromatic hydrocarbons. A polychlorinated dibenzo-p-dioxin is two benzene rings joined together by two oxygen atoms, whereas a polychlorinated dibenzofuran is two benzene rings joined together by one oxygen atoms. All dioxin and furan congeners have relatively low volatility and minimal vapour pressure at normal temperatures. The less chlorinated compounds or congeners are found to a greater extent in the gas phase than the higher chlorinated congeners. In outdoor air most dioxins are in the vapour phase. Dioxins are rather stable in the atmosphere, and photolysis may be the most important degradation process. The majority of dioxins are deposited on environmental surfaces by wet or dry deposition from the atmosphere. For particles, dry deposition dominates over wet deposition by a factor of 5 to 6. Because of photo-degradation, losses are estimated to exceed the deposition rate of the gas-phase dioxins, total deposition to the surface is dominated by the particulate-bound compounds (Danish Environmental Protection Agency 1997). Dioxins are unintentional by-products of many chemical industrial processes and combustion processes, and almost all of the possible 210 chlorinated compounds in the dioxin family are released from these sources. Dioxins are generally present in the environment as mixtures containing a number of individual congeners. All have varying degrees of toxicity in comparison to the most toxic: 2,3,7,8-Tetrachlorodibenzo-p-dioxin, which is often referred to simply as Dioxin or TCDD (Commonwealth of Australia 1998; Environment Australia 1999; Environment Australia 2001). Dioxins are ubiquitous and can be found in trace amounts in a wide range of environments and organisms. Due to their chemical, physical, and biological stability they can accumulate in soil sediments, organic matter and waste disposal sites. They are soluble in fat (lipophilic). Dioxins are very toxic, both acutely and chronically. Some dioxins are carcinogens, immunotoxins, endocrine disruptors or teratogens. The half-life of dioxins in the human body varies between the different congeners, from a minimum of 3.7 years to a maximum of 50 years for the most persistent type, with an average of approximately 7 years (Danish Environmental Protection Agency 1997; Therapeutic Goods Administration 2000).

PLFPS v8 public Page 12 of 35 Dioxin Health Risk Assessment 25/06/02
3.2 Toxic equivalency
The task of assessing the risk of exposure to dioxins is difficult because dioxins are usually found as complex mixtures in the environment and in biological tissues and there is significant variation in the toxic potency of the different congeners. However, members of the dioxin class share similar physical, biological and toxic properties, and there is sufficient data to rank their potency relative to 2,3,7,8-tetrachloro-dibenzo-p-dioxin (TCDD), the most toxic member of the class. These rankings are known as Toxic Equivalency Factors (TEFs). This approach is based on the evidence that there is a common, receptor-mediated mechanism of action for these congeners. Although the scientific basis cannot be considered as solid, the TEF approach has been adopted as an administrative tool by many agencies and allows the conversion of quantitative analytical data for individual dioxin and furan congeners into a single TCDD Toxic Equivalent (TEQ). Using the TEF scheme TCDD is assigned a TEF of 1.0, while other dioxins have TEF values ranging from 1.0 down to 0.00001. To estimate the toxic potency of a given dioxin mixture, the TEF of each individual component is multiplied by its respective mass concentration, and the products are summed to represent the TCDD TEQ of the mixture (Fiedler 2000; Therapeutic Goods Administration 2000). It should be noted that of all the 210 dioxin congeners, all non-2,3,7,8-substituted congeners have been assigned a TEF of zero; only 17 congeners have been assigned TEFs above zero. As TEFs are interim values and administrative tools, they are based on present state of knowledge and have been revised as new data becomes available. The most recent review of TEFs was performed by WHO in 1998, and has been recognised by the US EPA as being the most appropriate scheme for estimating the toxicity of dioxin mixtures. Prior to the recent adoption of the WHO 1998 TEF scheme several TEF schemes have been used. In 1989 in an international effort aimed at adopting a common set of TEFs international TEFs were implemented and are referred to as I-TEFs, which correspond to I-TEQs. In 1994 the I-TEF scheme was extended to include 13 dioxin-like PCBs. The WHO 1998 update has altered the TEFs of three dioxins and furans, added one new PCB and removed two PCBs. Table 3.1 shows the current WHO 1998 TEFs and how they have changed since the adoption of I-TEFs in 1989. Table 3.2 details the nomenclature for dioxin-like compounds (Fiedler 2000; US EPA 2000). The most significant change between I-TEF and WHO98 TEF is the change in the TEF value of 1,2,3,7,8-PeCDD (pentachlorinated dibenzo-p-dioxins) from 0.5 to 1.0 and the inclusion of 12 dioxin-like PCBs. Throughout this document, the daily intake of dioxins will be expressed in units of TEQs applying the 1998 WHO TEFs, unless derived using the previous international TEF scheme abbreviated as I-TEQ.

PLFPS v8 public Page 13 of 35 Dioxin Health Risk Assessment 25/06/02
Table 3.1 The TEF Scheme for TEQ as Determined by WHO in 1998, figures in [ ] denote I-TEF values, ** denotes the new PCB, while values struck through denote PCBs assigned values of zero. Source: adapted from U.S. EPA (2000a)
Dioxin Congener TEF Furan Congener TEF 2,3,7,8-TCDD 1.0 2,3,7,8-TCDF 0.1 1,2,3,7,8-PeCDD 1.0 [0.5] 1,2,3,7,8-PeCDF 0.05 1,2,3,4,7,8-HxCDD 0.1 2,3,4,7,8-PeCDF 0.5 1,2,3,6,7,8-HxCDD 0.1 1,2,3,4,7,8-HxCDF 0.1 1,2,3,7,8,9-HxCDD 0.1 1,2,3,6,7,8-HxCDF 0.1 1,2,3,4,6,7,8-HpCDD 0.01 1,2,3,7,8,9-HxCDF 0.1 OCDD 0.0001 [0.001] 2,3,4,6,7,8-HxCDF 0.1 1,2,3,4,6,7,8-HpCDF 0.01 1,2,3,4,7,8,9-HpCDF 0.01 OCDF 0.0001 [0.0]
Chemical Structure IUPAC Number TEF 3,3',4,4'-TeCB PCB-77 0.0001 [0.0005] 3,4,4,5-TCB PCB-81 ** 0.0001 2,3,3',4,4'-PeCB PCB-105 0.0001 2,3,4,4',5-PeCB PCB-114 0.0005 2,3',4,4',5-PeCB PCB-118 0.0001 2',3,4,4',5-PeCB PCB-123 0.0001 3,3',4,4',5-PeCB PCB-126 0.1 2,3,3',4,4',5-HxCB PCB-156 0.0005 2,3,3',4,4',5'-HxCB PCB-157 0.0005 2,3',4,4',5,5'-HxCB PCB-167 0.00001 3,3',4,4',5,5'-HxCB PCB-169 0.01 2,2',3,3',4,4',5-HpCB PCB-170 0.0001 2,2',3,4,4',5,5'-HpCB PCB-180 0.00001 2,3,3',4,4',5,5'-HpCB PCB-189 0.0001
Table 3.2 Nomenclature for Dioxin-Like Compounds.
Symbol Definition Pe Symbol for penta (i.e., five halogen substitution) Hx Symbol for hexa (i.e., six halogen substitution) Hp Symbol for hepta (i.e., seven halogen substitution) O Symbol for octa (i.e., eight halogen substitution) CDD Chlorinated dibenzo-p-dioxins, halogens substituted in any position CDF Chlorinated dibenzofurans, halogens substituted in any position PCB Polychlorinated biphenyls
It should be noted that without the inclusion of PCBs the I-TEF and WHO98 TEF schemes are quite similar. Furthermore, the proponent has been advised by the DEP that PCB exposure does not need to be considered as part of this health risk assessment (Pers. Comm. Richard Sutherland October 2001). Given that most of the research data currently available is reported in I-TEQ units and given the above the authors believe under the terms of this HRA direct comparisons can be drawn between the I-TEQ and TEQ schemes.

PLFPS v8 public Page 14 of 35 Dioxin Health Risk Assessment 25/06/02
3.3 Sources and emissions
Dioxins and furans can enter the environment in a number of ways. Primary sources are from industrial and combustion processes. Because of their chemical, physical and biological stability emissions from primary sources can be transferred to secondary sources such as sewage sludge, compost, or contaminated areas. The United Nations Environment Programme Dioxins and Furans Inventory report (1999) compared the most important emission sources from national inventories and categorised dioxin and furan emissions into nine major sectors, which are listed below: Iron and Steel: Iron and steel plants including foundries, sinter and
coke plants Non-ferrous Metals: Primary and secondary plants for the generation of
copper, aluminium, zinc, lead Power Plants: Fuelled with coal, gas, crude oil, wood Industrial Combustion Plants: Industrial units fuelled with coal, gas, crude oil, sewage
sludge, and biomass for use on-site Small Combustion Units: Mostly domestic stoves and chimneys fired with coal,
oil, and gas Waste Incineration: Includes incineration of municipal solid waste,
hazardous waste, sewage sludge, hospital waste , waste wood, and crematoria
Road Transport: Passenger cars, busses, trucks run on leaded or unleaded petrol or Diesel
Mineral Products Production: Generation of cement, lime, glass, brick, etc. Others: Shredder plants, asphalt mixing, drying of green fodder,
wood chips, chemical industry, accidental fires and prescribed burnings
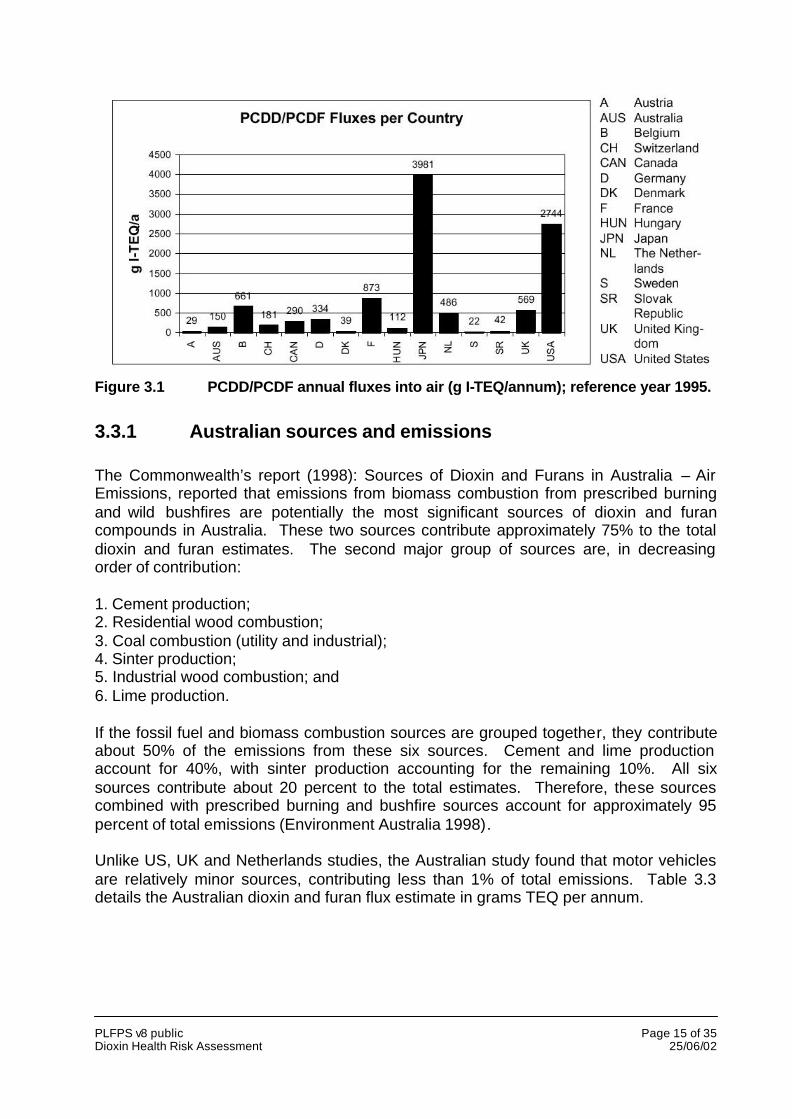
Waste incineration as defined above is still the major emitter in many countries. Exceptions are Austria, Australia, and Germany for the reference year 1995. Figure 3.1 depicts emissions as determined by the UN report; Australian data was supplied via the Commonwealth’s 1998 report titled Sources of Dioxin and Furans in Australia – Air Emissions (UNEP Chemicals 1999).
PLFPS v8 public Page 15 of 35 Dioxin Health Risk Assessment 25/06/02
Figure 3.1 PCDD/PCDF annual fluxes into air (g I-TEQ/annum); reference year 1995.
3.3.1 Australian sources and emissions
The Commonwealth’s report (1998): Sources of Dioxin and Furans in Australia – Air Emissions, reported that emissions from biomass combustion from prescribed burning and wild bushfires are potentially the most significant sources of dioxin and furan compounds in Australia. These two sources contribute approximately 75% to the total dioxin and furan estimates. The second major group of sources are, in decreasing order of contribution: 1. Cement production; 2. Residential wood combustion; 3. Coal combustion (utility and industrial); 4. Sinter production; 5. Industrial wood combustion; and 6. Lime production. If the fossil fuel and biomass combustion sources are grouped together, they contribute about 50% of the emissions from these six sources. Cement and lime production account for 40%, with sinter production accounting for the remaining 10%. All six sources contribute about 20 percent to the total estimates. Therefore, these sources combined with prescribed burning and bushfire sources account for approximately 95 percent of total emissions (Environment Australia 1998). Unlike US, UK and Netherlands studies, the Australian study found that motor vehicles are relatively minor sources, contributing less than 1% of total emissions. Table 3.3 details the Australian dioxin and furan flux estimate in grams TEQ per annum.

PLFPS v8 public Page 16 of 35 Dioxin Health Risk Assessment 25/06/02
Table 3.3 Estimated annual Australian dioxins and furans flux. Source Commonwealth’s 1998 report titled Sources of Dioxin and Furans in Australia – Air Emissions
Source Flux Fires – prescribed burning 65 –1300 Bushfires 7 – 400 Cement 0.12 – 153 Residential wood combustion 15 – 98 Coal combustion 4.5 – 73 Sinter production 9 – 68 Industrial wood combustion 10 – 65 Lime 0.035 – 44 Oil combustion (industrial and utility) 21 Non-Ferrous metal production 1 – 19 Medical waste incineration 0.9 – 19 Motor vehicles 0.35 – 17 Asphalt mixing 14.5 Iron and steel production 0.7 – 9.4 Landfill gas 0.8 –2.5 Residential oil combustion 0.075 – 0.2 Ceramic 0.02 – 0.05 Coke production 0.03 Glass 0.0014 – 0.0035 Municipal waste incineration 0 Total 150 - 2300
It should be noted that the estimates made for Australia are not based on emission or deposition measurements. Rather the basic methodology used was a review of international dioxin and furan inventory studies, and then a list of industries that release PCDD/PCDF to the atmosphere was collated. The emission factors for each of the industries were compiled and compared, and a final emission factor range was then assumed for Australia. Where possible, Australian source test data was also reviewed, however reliance on international data was significant due to the general lack of domestic source test data. As a result of this procedure, the emission estimates made in the Australian study are subject to uncertainty (UNEP Chemicals 1999).
3.3.2 Emissions to air
Regional and national fluxes vary by orders of magnitude depending on the level of industrialisation, type of industries present, legislative requirements and pollution control technology in use. Emissions from several countries, as determined from sampling, are given below. Emissions to air in Australia are essentially unknown. The National Pollution Inventory (NPI) has assembled data for some airsheds based on data from facilities reporting emissions using industry based emission estimate factors. There is no data available for the Perth airshed. However inferences about Australia’s ambient concentrations can be drawn from concentrations measured in other countries. In 1990 dioxins in air were determined at six locations in rural and industrial areas of the state of Hessen in Germany. The annual averages of dioxins in ambient airs were:

PLFPS v8 public Page 17 of 35 Dioxin Health Risk Assessment 25/06/02
0.05pg I-TEQ/m3 in a natural rural area, 0.08pg I-TEQ/m3 in other rural/suburban areas and 0.12pg I-TEQ/m3 in two industrial areas (Danish Environmental Protection Agency 1997). In a 1991 U.K. dioxin air survey, London had average levels of 0.20pg TEQ/m3, Cardiff 0.23pg TEQ/m3 and Stevenage 0.16pg TEQ/m3. Higher concentrations were measured in wintertime compared to summertime in accordance with more combustion sources operating in wintertime (Danish Environmental Protection Agency 1997). The mean US ambient concentration is estimated at 0.12pg TEQ/m3 (US EPA 2000). A recent investigation of dioxins in the air of remote Antarctica has shown that background air may still be free of dioxins. Close to the McMurdo Station, which is the largest human community in Antarctica, however, dioxins were detectable, although near the detection limit. Higher chlorinated congeners dominated and only hexachloro- and upward were detected. The maximum levels corresponded to 0.074pg I-TEQ/m3 in 1992-93 and 0.0015pg I-TEQ/m3 in 1993-94. The local incinerator was closed down in December 1992 (Danish Environmental Protection Agency 1997). Recent measurements in rural New Zealand identified background ambient levels similar to the Antarctic concentrations at 0.0038pg I-TEQ/m3 (Buckland et al., 2000)
3.4 Proposed facility emissions
Little information is available about dioxin and furan emissions from poultry litter fired power. The proposed facility is understood to be the first of its kind in Australia. The Eye Power Station in the U.K. serves as the nearest example. The Eye Power station is fuelled by poultry litter and has a slightly higher output at 13.6MW. Unlike the proposed facility the Eye power station did not have at the time of commissioning a baghouse scrubber circuit, as described for the proposed facility, and as a result its particulate emissions were higher than expected. After commissioning the Eye Power Station underwent stack testing for dioxin and furan emissions. Results of stack testing from the Eye power plant are listed in table 3.4, the results are speciated thereby allowing conversion from I-TEQ to TEQ via the application of the appropriate TEFs as listed in table 3.1. After normalisation to 101kPa, 2730K and 11% O2 the emissions were 0.199ng I-TEQ/m3 or 0.208ng TEQ/m3. The concentration of congeners reported at below the detection limit was assumed to be 50% of the limit. Table 3.4 Results of stack testing (ng I-TEQ) Eye Power Station 1999.
Dioxin Congener Concentration Furan Congener Concentration 2,3,7,8-TCDD <0.02 2,3,7,8-TCDF 0.07 1,2,3,7,8-PeCDD <0.03 1,2,3,7,8-PeCDF 0.12 1,2,3,4,7,8-HxCDD 0.03 2,3,4,7,8-PeCDF 0.1 1,2,3,6,7,8-HxCDD 0.03 1,2,3,4,7,8-HxCDF 0.3 1,2,3,7,8,9-HxCDD 0.03 1,2,3,6,7,8-HxCDF 0.14 1,2,3,4,6,7,8-HpCDD 0.1 1,2,3,7,8,9-HxCDF 0.03 OCDD 0.58 2,3,4,6,7,8-HxCDF 0.09 1,2,3,4,6,7,8-HpCDF 0.47 1,2,3,4,7,8,9-HpCDF 0.05 OCDF 0.86

PLFPS v8 public Page 18 of 35 Dioxin Health Risk Assessment 25/06/02
The emission rate of the Eye Power Station has been used as a surrogate raw gas emission rate for the proposed Blair Fox Poultry Litter Fired Power Station. It should be noted that during commissioning the Eye Power Station had problems with the moisture content of feedstock and this is believed to have contributed to higher than expected particulate emission rates and therefore most likely higher dioxin and furan emissions (Ernie 1995). Given the lower annual relative humidity of the Swan Coastal Plain it is likely that the moisture content of feedstock for the proposed facility will be lower and that therefore the concentration of dioxins and furans in the raw gas will be lower than the Eye Power Station. No attempt has been made to quantity how much lower the proposed facility emissions might be due to lower feed moisture content. Assuming a concentration of 0.208ng TEQ/m3 in the raw gas feed to the baghouse and a minimum dioxins and furans reduction rate of 90% as per GORE-TEX specifications, the emission concentration of dioxins and furans from the stack via baghouse clean gas would be 0.021ng TEQ/m3: approximately one fifth of the license limits at 0.1ng TEQ/m3. A summary of emission rates is listed in table 3.5. Allowing for the possibility of 95% availability of the baghouse, in conjunction with plant operation, the emission rate would increase to 0.030ng TEQ/m3. Such a possibility allows for the baghouse to be taken completely off-line for short periods of time for unscheduled maintenance whilst the plant is still operating and for process lag time in shutting down the boiler assuming the baghouse is off-line. Given the redundancy of the baghouse the above scenarios are unlikely. In a worse case scenario assuming a baghouse availability of only 90%, stack emission concentrations of dioxins and furans would increase to 0.040ng TEQ/m3. Baghouse operating targets will be 100% with a lower limit of 95%. In the event of baghouse failure and a baghouse availability of less than 95% the plant will shut down until such time as the baghouse is capable of being brought back on line. Table 3.5 Proposed facility emission concentration
Operating conditions Emission concentration ng TEQ/m3-a Expected with 100% baghouse availability 0.021 Raw gas – 0% availability of baghouse 0.208 95% availability of baghouse 0.030 Worst case 90% availability of baghouse 0.040
3.4.1 Atmospheric concentration from the proposed facility
Atmospheric modelling was undertaken by Environmental Alliances to determine the ambient concentration of dioxins and furans at any point on the ground within a twenty kilometre radius of the facility for expected (100% baghouse) and worst case emissions (90% baghouse). The model used was ‘CALPUFF’: a gaussian dispersion model. The assumptions and output of the model used by Environmental Alliances is detailed in Appendix 2. In addition to modelling emissions from the proposed facility the emissions from Tiwest’s Chandala mineral processing operation (supplied by Tiwest from stack testing) were used to determine worst-case cumulative emissions. A letter detailing Tiwest emissions is included with Appendix 2.

PLFPS v8 public Page 19 of 35 Dioxin Health Risk Assessment 25/06/02
The results of the worst-case scenario atmospheric modelling are plotted in figure 3.2. The figure depicts the total concentration of vapour phase plus particulate phase emissions in fg TEQ/m3 (fg = 10-15 g).
Figure 3.2 Estimated worst-case atmospheric vapour and particulate phase
concentrations of dioxins and furans from the proposed facility. Source EA Consulting.
3.4.2 Emissions from coal Vs poultry litter
Environment Australia has reviewed international data on dioxin and furan emissions and based on US AP42 lists, derived for the purposes of NPI, emission factors for coal based power stations. The NPI emissions factor for both black and brown coal fuelled combustion processes (tangentially fired) is 88 µg/tonne of coal combusted. With a fuel consumption rate of 13tph a coal-fired plant would produce an estimated 1144 µg/hr PCDD/PCDF. Based on the Eye Power Station stack test results of 7ng PCDD/PCDF /Nm3 and a emission rate of 13Nm3/s, the proposed facility would emit, with the same fuel usage, 330µg/hr PCDD/PCDF or less than one third the emissions of dioxins and furans as that of a comparable coal power plant. However, it should be noted that coal has a calorific value twice that of poultry litter. The above comparison does not consider any pollution abatement equipment for either coal or poultry litter fed plants.
Site Location

PLFPS v8 public Page 20 of 35 Dioxin Health Risk Assessment 25/06/02
3.4.3 Global Olivine Western Australia estimated emissions
In the ESR report titled: Multi-Pathway Health Risk Assessment for Emissions to Air for the GOWA Waste to Energy and Water Project, the estimated dioxins and furans emission rate is reported at 0.031µg I-TEQ/s (Ernie 1995). With an expected emission rate of 18m3/s; the estimated dioxins emission rate for the proposed facility would be approximately fifty times less than the GOWA facility at 0.001µg TEQ/m3. The dioxin exposure concentrations from the larger GOWA facility were deemed to be acceptable by the Department of Environmental Protection (WA).
3.5 Health risks from exposure
Exposure to high concentrations of dioxin may induce long-term alterations in glucose metabolism and subtle changes in hormonal levels. Exposure to lower levels can cause a variety of effects in animals, such as weight loss, liver damage, and disruption of the hormonal (endocrine) system. In many animal species TCDD weakens the immune system and causes a decrease in the system’s ability to fight bacteria and viruses. Some animal species exposed to dioxins during pregnancy often had miscarriages and the offspring exposed during pregnancy often have severe birth defects and weakened immune responses (Environment Australia 1999). In December 1990, the WHO established a tolerable daily intake (TDI) of 10pg/kgBW-d (body weight per day) for dioxins, based on the use of kinetic data in humans and experimental animals, liver toxicity, reproductive effects and immuno-toxicity in experimental animals. Since then new epidemiological and toxicological data has emerged, in particular with respect to neuro-developmental and endocrine effects of dioxin. In May 1998 WHO and the International Programme on Chemical Safety (IPCS) jointly organised a consultation on the assessment of the health risk of dioxins and a re-evaluation of the TDI. The outcome of the assessment was a refinement of the I-TEF’s and the evolution of TEQ system. Human daily intakes corresponding with body burdens similar to those associated with adverse effects in animals were estimated to be in the range of 14-37 pg/kgBW-d. By applying a composite uncertainty factor of 10 a TDI range of 1 to 4pg TEQs/kgBW-d was established (Rolaf van Leeuwen .F.X. 2000).
3.6 Nursing infants exposure
Certain groups of people may have higher exposures to dioxin-like compounds than the general population. Such a group includes nursing infants, who may be exposed to dioxin-like compounds via consumption of breast milk. These compounds are deposited in the fatty tissues (i.e., adipose tissue, blood lipids and breast milk) of the mother and may be transferred to the infant during nursing. Based on data from the ‘Public Health Action in Breast Feeding Report’ for 2001-2003 by the Health Department of Western Australia, approximately 84% Australian mothers initiate breastfeeding with their newborn infants. 61% continue after 3 months and 49% after 6 months.

PLFPS v8 public Page 21 of 35 Dioxin Health Risk Assessment 25/06/02
Although much research has been undertaken in this area there has not been a model developed to determine the LADD exposure to a breast fed infant from a given environmental exposure that the mother experiences. This may be because it appears there is no evidence to suggest a linear relationship between the two parameters. For this reason this study can not provide a numerical assessment of the effects that the proposed project emissions would have on breast fed infants. This assessment will however show how breast milk ingestion exposure; which is higher during breast-feeding on a body weight basis than during any other period in an individual’s life, impacts lifetime exposures. The correct way to derive an average dose to the child is to integrate exposure over the time period of interest. At birth, for example, with a mother’s milk concentration of 9 ppt TEQDF-WHO98, an infant body weight of 3.3kg, an average breast milk ingestion rate of 800g/d, the administered dose is predicted to be: [(25 pg/g x 0.04 x 800g/d) / (3.3 kg) = 242 pg/kg-d]. Using body weights and concentrations noted above, the dose at 6 months and 1 year would be 55 and 22 TEQDF-WHO98/kg bw/day. Doing this calculation for each of the first twelve months of life and then dividing by 12 results in an average dose to the infant of 92pg TEQDF-WHO98/kg BW-d. This value is much higher than the estimated average background TEQDFP-WHO98 exposure to adults, 1pg TEQDF-WHO98/kg-d. However, if a 70-year averaging time is used for this one year nursing scenario, then the LADD is estimated to be 1.3pg TEQDF-WHO98/kg BW-d. However this can be misleading since it ignores the difference in daily intake during potentially sensitive stages in development. Also, it doesn’t consider any exposures past the first year of life. In order to calculate a true lifetime average daily dose, one needs to incorporate the changes in dose over various life stages. Using estimates of dose that US EPA have derived elsewhere for various ages in children: 1-5: 3.6 pg TEQDFP/kg-d, 6-11: 1.9pg TEQDFP/kg-d, and 12-19: 1.1pg TEQDFP/kg-d, the following calculates the LADD for lifetime background exposures considering one year of feeding: LADD = 92 * 1yr + 3.6 * 4yrs + 1.9 * 6yrs + 1.1 * 8yrs + 1.0 * 51yrs
70yrs 70yrs 70yrs 70yrs 70yrs LADD = 2.2pg TEQDFP/kgBW-d (TEQDFP includes dioxins, furans and PCB’s) On a mass basis, the cumulative dose to the infant after a year is about 225ng TEQ. Using the age dependant doses mentioned earlier, a dose from year 1 to year 70 in a 70-year lifetime calculates to 1644ng TEQDFP-WHO98, so that a total lifetime dose is 1869ng TEQ-WHO98. This suggests that about 12% of lifetime dose may occur as a result of breast-feeding, if that feeding occurred for one year. It should be noted that due to cultural, environmental and industrial differences the US has higher background levels of dioxins than Australia does (see Section 4.2). Therefore the exposure to breast fed infants is also expected to be lower.

PLFPS v8 public Page 22 of 35 Dioxin Health Risk Assessment 25/06/02
CHAPTER 4 RISK ASSESSMENT
4.1 Estimating exposure
Estimating exposure requires the use of exposure models, scenarios and associated parameter values. Exposure modelling requires the use of soil ingestion rates, inhalation rates and other behavioural parameters. The US EPA has extensively documented such parameters and modelling for the proposed facility will use the most recently revised parameters as per the National Center for Environmental Assessment 1997-draft version of the Exposure Factors Handbook (refer to section 2.4). Before undertaking the construction of an exposure model of dioxins and furans for the proposed facility it is worthwhile considering the approach of other local dioxin and furan exposure models.
4.2 Background exposure
In the absence of Commonwealth estimates of dietary intake of dioxins and furans New Zealand estimates of dietary intake are seen as the most relevant to Australian dietary intake. New Zealand’s estimated mean intake is stated as 0.18pg I-TEQ/kg BW-d; (Ministry for Environment 1998) some three times lower than the estimated mean US general population intake (US EPA 2000). The contribution to the background level from various exposure pathways varies with each pathway. As determined by the US EPA, beef, fish and milk ingestion pathways heavily skew total exposure (table 4.1, section 4.4.1). Much of the US fish consumption comes from the Great Lakes, which have elevated dioxin concentrations (US EPA 2000). It is assumed that dioxin exposure via fish consumption in Australia is considerably lower than in the US. It is likely that Australian background levels are similar to New Zealand background levels given that the beef, fish and milk ingestion pathways make up the bulk of total exposure and that most beef, fish and milk is sourced locally. Erring on the side of extreme caution, a background level of 0.30pg TEQ/kgBW-day has been assumed for Australia in this study.
4.3 Exposure model for GOWA facility
Analysis of the GOWA model was undertaken as part of a review of previous dioxin studies in the State. The underlying assumptions and conclusions of the GOWA model have been examined with the view to providing a contextual background for the proposed facility’s model framework.

PLFPS v8 public Page 23 of 35 Dioxin Health Risk Assessment 25/06/02
The GOWA model took into account exposure from dioxins and furans from the estimated concentration and accumulation of contaminants in all environmentally significant media including air; rain; soil; pasture; fruit and vegetables; meat; eggs and milk. Based on a range of scenarios, such as whether people grow their own fruit and vegetables or obtain their drinking water from a roof supply at a location potentially affected by emissions, people’s intakes of contaminants were estimated. These intake estimates then allowed comparisons to be made to the WHO98 TDI, to consider possible health implications arising from the emissions. The estimated intakes were also compared with typical, normal dietary intakes for the general population not exposed to any identified contaminant source, to identify whether estimated contaminant intake increments from the proposed project would make any significant contribution to those normal intakes (Barker & Associates Ltd. 2000). The multi-pathway assessment generally followed the 1998 US EPA peer review draft: Human Health Risk Assessment Protocol for Hazardous Waste Combustion Facilities. This approach was chosen because the protocol is the result of several years of development, building on previous protocols that have been used extensively for multi-pathway health risk assessments. The multi-pathway assessment involves, initially, air dispersion/deposition modelling calculations using the US EPA ISCST3 dispersion model to estimate air concentrations and wet and dry deposition rates resulting from emissions. The assessment risk calculations use the US EPA equations to calculate for any given air concentration and wet and dry deposition rate (from the dispersion/deposition modelling), the concentrations in all media of interest, including air, rain, soil, plants, milk and meat. The modelling of transfer of dioxins from air, through grass, into grazing cows and milk used a validated German model. Once the concentrations in the various media had been calculated, information about people’s typical intake for each of the media or food types was used to calculate the intakes (ESR 2000). Two GOWA exposure scenarios were considered for nearby residents.
1. Central exposure scenario indicates the maximum exposures to which most people living at exposed locations, and buying most of their food from the usual commercial outlets, would be subject. People would only have higher exposures than these if there were particular features of their living arrangements such as drinking water collected from the roof or eating chicken and eggs from free-range poultry from a location significantly exposed to GOWA emissions.
2. High-end exposure scenario represents the maximum possible exposure a
person could achieve for a typical food consumption pattern if they spent all of their time exposed to the facility’s emissions, produced and consumed all of their own food at the location and drank only rainwater collected from their roofs. This exposure scenario implies a rare lifestyle but nevertheless sets an upper limit of exposure beyond which any increase is unrealistic.
The maximum exposure to dioxins and furans resulting from the GOWA facility for residents affected by the facility as represented by the High-end exposure scenario is 0.0008pg I-TEQ/kgBW-d and is plotted in figure 4.1 (ESR 2000).

PLFPS v8 public Page 24 of 35 Dioxin Health Risk Assessment 25/06/02
Based on US mean TDI data of 0.59pg TEQ/kgBW-d (US EPA 2000) and 0.3pg TEQ/kgBW-d for Australia, the cumulative effect of the GOWA facility is to increase TDI to less than 0.6pg TEQ/kgBW-d; well below the WHO target of 1pg TEQ/kgBW-day. Such an exposure scenario over-estimates exposures for most people because very few will spend 100% of their time at home or grow their own fruit and vegetables or obtain their chicken and eggs from free range poultry from a location significantly exposed to project emissions. Furthermore, it should be noted that exposure modelling was based on license limits and consequently exposure is likely to be much lower than the projected figures given emissions are expected to be less than half the license limit.
Dioxin exposures for various population
0.00
0.50
1.00
1.50
2.00
2.50
3.00
3.50
4.00
4.50
Populations
dio
xin
inta
ke p
g I-
TE
Q/k
gB
W-d
WHO TDI limit
WHO TDI target
US mean intake
NZ mean intake
AUS intake: backgroundplus GOWA emissions
Figure 4.1 Estimated daily dietary intake of dioxins and furans.
4.4 Exposure model for proposed facility
Based on US EPA media assessment procedures, as previously detailed, the exposure for a central and high-end scenario has been estimated. Within both scenarios stack emissions have been modelled on cumulative expected and cumulative worst-case emissions; which incorporate Tiwest’s stack test emission results. The US EPA Draft document describes procedures for conducting exposure assessments to estimate either potential or internal dioxin doses. A potential dose is defined as a daily amount of contaminant inhaled, ingested, or otherwise coming in contact with outer surfaces of the body, averaged over an individual’s body weight. An internal dose is defined as the amount of the potential dose that is absorbed into the body. The general equation used to estimate potential dose normalised over body weight and lifetime; referred to as LADD, is given below.
LADD = EMC x CR x CF x ED
BW x LA Where:

PLFPS v8 public Page 25 of 35 Dioxin Health Risk Assessment 25/06/02
EMC = exposure media concentration CR = contact rate CF = contact fraction ED = exposure duration BW = body weight LA = Lifetime average
Each of the terms in this Exposure Equation is described as below. Exposure Media Concentrations: These include the concentrations in soil for the dermal contact and soil ingestion exposure pathways, in the vapour and particulate phases in air for the inhalation exposure pathway, in water for the water ingestion pathway, and in food products such as fish, fruits and vegetables, and beef and milk, for the food ingestion pathways. The concentrations used should represent an average over the exposure period. Contact rate: These include the ingestion rates, inhalation rates, and soil contact rates for the exposure pathways. These quantities are generally the total amount of ingested, air inhaled, etc. Only a portion of this material may be contaminated. The next term, the contact fraction, which is 1.0 or less, reduces the total contact rate to the rate specific to the contaminated media. Contact Fraction: As noted, this term describes the distribution of total contact between contaminated and uncontaminated media. For example, a contact fraction of 0.8 for inhalation means that 80% of the air inhaled over the exposure period contains dioxin like compounds in vapour form or sorbed to airborne particula tes. The contact fractions for the exposure pathways of air inhalation and water ingestion are related to the time individuals spend at home. Results from different studies reviewed in (US EPA 1997) consistently indicate that the average adult spends between 68 to 73% of time in the home environment. Exposure Duration: This is the overall time period of exposure. Values of 9 years and 30 years are used for the two scenarios for this assessment. These values were determined by a recent US Bureau of the Census (1993) study that covered a national sample of 55,000 interviews. The 50th and 90th percentile values (to represent the central and top end scenarios) for years living in current residence were determined to be 9.1 and 32.7 years, which are rounded here simply to 9 and 30 years. The 9 years will be used in a residential scenario and the 30 years for the farming scenario. The fact that farmers tend to live longer in their residents than average individuals was supported by a second study (Isreali 1992). Another exposure duration is the one associated with childhood exposure patterns, in this case 5 years (US EPA 2000). Body Weight: Adult and child body weights are assumed to be 70kg and 15.5kg respectively. Lifetime: Following traditional assumptions, the average adult lifetime assumed throughout this document is 70 years. Even though actuarial data indicate that the United States average lifetime now exceeds 70 years, this convention is used to be consistent with other international assessments of exposure and risk.

PLFPS v8 public Page 26 of 35 Dioxin Health Risk Assessment 25/06/02
4.4.1 Exposure Pathways and Parameters
Dioxin-like compounds have been found primarily in air, soil, sediment and biota and to a lesser extent water. Thus, the most likely exposure pathways are:
• Ingestion of soil, water, fruit, and vegetables, terrestrial animal food products (beef, pork, chicken, eggs, dairy products) and fish;
• Dermal contact with soil; and • Inhalation of particulates and vapours.
Two classes of exposure scenario have been developed for the proposed facility. Fish and crustaceans are not harvested in the study area and therefore no fish ingestion pathway has been considered in either scenario. Central exposure scenario The following media pathways are assessed in the central exposure scenario:
• Soil Ingestion for Children • Soil Dermal Contact for Adults
High-end exposure scenario The following media pathways are assessed in the high-end exposure scenario:
• Soil Ingestion for Children • Soil Dermal Contact for Adults • Water Ingestion for Children • Water Ingestion for Adults • Fruit Ingestion for Children • Fruit Ingestion for Adults • Vegetable Ingestion for Children • Vegetable Ingestion for Adults • Beef and chicken Ingestion for Children • Beef and chicken Ingestion for Adults • Egg Ingestion for Children • Egg Ingestion for Adults • Air inhalation
The relative contribution of each exposure media or pathway to total potential exposure, as determined by the US EPA for a background and high exposure farm setting is detailed in table 4.1.
It should be noted that all modelled emission based parameters from the proposed facility are derived from the worst-case 90% baghouse availability model and also include Tiwest’s emissions. Furthermore, the highest calculated value for each emission phase from the 400km2 emission plot was used in the exposure modelling assessment.

PLFPS v8 public Page 27 of 35 Dioxin Health Risk Assessment 25/06/02
Table 4.1 Relative magnitude of all exposure pathways evaluated for the background setting and the stack emission, high exposure setting as per notes below table. Source (US EPA 2000)
Exposure pathway Background conditions Stack emissions Beef ingestion 1.00 1.00 Milk ingestion 0.49 0.48 Fish ingestion 0.82 0.07 Egg ingestion 0.05 0.10 Soil ingestion 0.04 0.10 Chicken ingestion 0.03 0.07 Inhalation 0.02 0.03 Vegetable ingestion 0.02 0.03 Soil dermal contact (high-end) 0.02 0.01 Fruit ingestion < 0.01 < 0.01 Water Ingestion < 0.01 < 0.01
Notes 1. 1.00 is the highest pathway, and values less than 1.00 describe the relation of that
pathway to the highest pathway. 2. This table is for the high-end exposure farm setting only. For the stack emission
scenario the farm was located 500m from the stack. Also the fish ingestion pathway was for the high ingestion rate, 25g/day, and the soil pathway – dermal and soil ingestion was for the high contact assumptions only.
3. For both background and stack scenarios results are for TEQs.
4.4.2 Soil Related Exposures
The two soil related exposures that are used in this assessment include a childhood pattern of soil ingestion and an adult exposure of soil dermal contact. Unlike ingestion, dermal contact refers to the amount of soil that adheres to the body over time, via contact: while related to internalisation (eg ingestion) it only quantifies exposure.
4.4.2.1 Soil Ingestion
Soil ingestion occurs commonly among children during activities such as mouthing of toys and other objects, non-sanitary eating habits, and inadvertent hand-to-mouth transfers. In addition to normal soil ingestion activities, some individuals exhibit behaviour known as pica that involves intentional soil ingestion. This dioxin assessment considers only normal soil ingestion among children.
4.4.2.2 Soil Dermal Contact
The total annual dermal contact (equating to LADD contact rate) is the product of three terms: the soil contact rate per soil contact event, the surface area of contact, and the frequency of dermal contact. Soil dermal exposure has two components: indoors and outdoors; both of which have different exposure concentrations and exposure durations. In this assessment, soil dermal contact exposures are demonstrated only for an adult for a ‘gardening’ central tendency pathway and a ‘farming’ high-end pathway.

PLFPS v8 public Page 28 of 35 Dioxin Health Risk Assessment 25/06/02
4.4.3 Water Ingestion
Exposure to dioxins through water ingestion for the central scenario has not been assessed in this study. It is assumed that residents only consume scheme water and therefore background dioxin exposure concentration adequately accounts for exposure to dioxins via the drinking water pathway. For the high-end scenario this assessment will assume that farmers consume rainwater that has been caught from the surface of their roofs and stored in a tank.
4.4.4 Ingestion of Terrestrial Food Products
The consumption of beef, chicken, eggs and fruit and vegetables are included in this group of ingestion pathways. All these pathways are similar in that the food products originate from the land. Of concern in this study are those food products that are grown or grazed in the study area, affected by the facility’s plume and then consumed by individuals, thus potentially exposing them to dioxins. It is assumed that residents in the central scenario purchase all of their food from supermarkets, which is grown outside of the study area. Accordingly dioxin exposure is presumed to be similar to background level and therefore need not be modelled. For the high-end scenario all foods that are grown on the home premises and consumed must be included in this assessment.
4.4.5 Air inhalation
Air inhalation is a component of the background dioxin concentration used in the central scenario. No data is available on local ambient dioxin concentration. It is assumed the local background ambient dioxin concentration is 0.06pg/m3; rural New Zealand ambient concentration is 0.004pg/m3, US ambient concentration is 0.12pg/m3 (section 3.3.2). Modelling indicates that worst-case emissions for the facility of 2.76E-04pg/m3 are orders in magnitude lower than the assumed ambient concentration and that of rural New Zealand and are therefore unlikely to significantly impact on total exposure via air inhalation. Modelling of the central scenario air inhalation exposure (assumed at 0.06pg/m3) cannot be cumulatively added to the central scenario because it has been accounted for in the background concentration of 0.30pg TEQ/kgBW-d.
4.4.6 Lifetime average daily dose (LADD)
The lifetime average daily dose of dioxin and furan exposure from the proposed facility (LADD) is the sum total of the individually modelled LADD exposure pathways, as summarised in table 4.2.

PLFPS v8 public Page 29 of 35 Dioxin Health Risk Assessment 25/06/02
Table 4.2 Summary of LADD exposure pathways for central and high-end scenarios (adults and children), modelled on worst-case dioxins emission data.
Scenario LADD pg TEQ/kgBW-d High-end children scenario plus background conc. 3.17E-01 (0.317) High-end adult scenario plus background conc. 3.58E-01 (0.358) Central children scenario plus background conc. 3.00E-01 (0.300) Central adult scenario plus background conc. 3.00E-01 (0.300)

PLFPS v8 public Page 30 of 35 Dioxin Health Risk Assessment 25/06/02
CHAPTER 5 DISCUSSION
As discussed in section 3.5 the main numerical when comparing dioxin exposure is the WHO98 TDI. There is currently no Australian standard, however it should be noted that the WHO standard has received international recognition and has been endorsed by the US EPA and other governing authorities including the Department of Health (WA). In assessing daily exposure it is important to consider an appropriate exposure time span. The Lifetime Average Daily Dose (LADD) does this by considering the exposure duration averaged over an average lifetime, which can then be compared to the TDI. Such an approach has been widely adopted and variations on that approach have been discussed in the nursing infants exposure model. Assessing daily and LADD exposure consists of evaluating a number of exposure pathways, which includes not only the exposure to various contaminated media such as homegrown fruit and vegetables but also lifestyle issues and behaviour patterns. Despite some anomalies, the results of media pathway modelling in this assessment generally concurred with international data. The magnitude of the various media exposure pathways bears some resemblance to table 4.1, with beef ingestion ranking the highest, followed by chicken and egg ingestion; such a result is due to bio-accumulation in the terrestrial food chain. Contamination of the beef pathway was highest due to both the higher fat content and the higher rate of consumption. Soil dermal contact was amongst the lowest LADD, air inhalation, water ingestion and fruit ingestion were of similar magnitude, although water and fruit ingestion were higher than the US data, such difference may stem from cultural and dietary differences. The beef contaminant concentration of 0.176pg/g fat equates to approximately 40pg TEQ/kg beef; such a result is some two orders of magnitude lower than the EU standard of 1.2ng TEQ/kg for animal products. It should be noted that, unlike the US EPA models, a water ingestion pathway was assessed for rainwater collected from roofs. This highlights the rigour of this assessment in attempting to comprehensively cover the high-end scenario. This assessment also included separate pathways for young children (2-3 years) in order to fully access the exposure to risk elevated groups in the community. For the same reason international exposure patterns for nursing infants was reviewed, however it should be noted that no definitive results were obtained due to a lack of local and international research. The results from this assessment indicate a LADD, for both the central and high-end scenarios evaluated at the highest likely worst-case emissions, to be well below the internationally adopted WHO target TDI of 1pg TEQ/kgBW-d, and far below the limit of 4pg TEQ/kgBW-d.

PLFPS v8 public Page 31 of 35 Dioxin Health Risk Assessment 25/06/02
As depicted in table 4.2 the LADD includes background exposure levels, as estimated at 0.30pg TEQ/kgBW-d. Furthermore it should be noted that in the high-end scenario dioxin exposure has been assumed to be the maximum likely for every assessed parameter. In conclusion, the ‘worst-case’ emissions modelled with the lifestyle of a ‘high-end’ individual showed that very low dioxin exposures would result from the facility even when operated under worst-case conditions. When this is combined with expected background dioxin levels the resulting exposure for adults is 0.358pg TEQ/kgBW-d and for children 0.317pg TEQ/kgBW-d. When compared to the WHO Tolerable Daily Intake (TDI) of 1 to 4pg TEQ/kgBW-d both of these are seen to be small and therefore according to the WHO TDI, dioxin exposure levels from the facility are acceptable. Assessment of the worst-case emission (90% baghouse availability), whilst providing a valuable insight into the possible dioxin exposure from the proposed facility could be considered unrealistic. The likely exposure from the facility operating under expected conditions, i.e. 100% baghouse availability, and a central exposure scenario will result in increases above the background concentration of approximately 0.0000000000085pg TEQ/kgBW-d for children and approximately 100 times lower again for adults. When these results are combined with the background concentration of 0.3pg TEQ/kgBW-d, no significant change occurs.

PLFPS v8 public Page 32 of 35 Dioxin Health Risk Assessment 25/06/02
REFERENCES
Agriculture WA, (1998) Poultry manure and stable flies in Western Australia
Barker & Associates Ltd., (2000) Public environmental review document: Waste to energy & water plant, lot 15 mason road, Kwinana, Kwinana, Western Australia.
Commonwealth of Australia (1998) Sources of dioxins and furans in Australia: Air emissions, Australian Government Publishing Services.
Danish Environmental Protection Agency, (1997) working document: Dioxins - sources, levels and exposures in Denmark.
Environmental Alliances, (2001) Dispersion modelling of dioxin emissions from proposed poultry litter fired power station, Muchea.
Environment Australia, (1998) Sources of dioxin and furans in Australia - air emissions, Canberra.
Environment Australia (1999) National pollutant inventory contextual information, Canberra.
Environment Australia, (2001) State of knowledge report: Air toxics and indoor air quality in Australia, Canberra.
Ernie, K., (1995) Use of poultry litter for power generation: Monitoring of Eye power station, FEC Ltd.
ESR, (2000a) Background information about dioxin sources and their presence in the environment and foods.
ESR, (2000b) Multipathway health risk assessment for emissions to air for the GOWA waste to energy and water plant.
Fiedler, H., Hutzinger, O., Welsch-Pausch, K., Schmiedinger, A., (2000) Evaluation of the occurrence of PCDD/PCDF and pops in wastes and their potential to enter the foodchain, European Commission, DG Environment.
Huisman M., Koopman-Esseboom C., Lanting C.I., Van der Paauw C.G., Tuinstra L.G.M., Fidler V., Weiglas-Kuperas N., Sauer P.J.J., Boersma E.R. and B.C.L (1995). ‘Neurological condition in 18 month old children perinatally exposed to PCBs and dioxins.’ Early human development 43: 165-176.
Huang, H. a. B., A., (1995) 'The mechanisms of dioxin sources formation in combustion processes', Chemosphere, 31 (9), pp. 4099-4177.
Ministry for Environment, (1998) Reporting on persistent organochlorines in New Zealand, Wellington.
Sutherland, R., (October 2001) Environmental Officer, Department of Environmental Protection, Western Australia.

PLFPS v8 public Page 33 of 35 Dioxin Health Risk Assessment 25/06/02
Therapeutic Goods Administration, (2000) Dioxins: Proposal for setting an Australian provisional tolerable daily intake, Department of Health and Aged Care, Canberra.
UNEP Chemicals, (1999) United Nations environmental programme dioxin and furan inventories: National and regional emissions of PCDD/PCDF, Geneva.
US EPA, (2000a) Exposure and human health reassessment of 2,3,7,8-tetrachlorodibenzo-p-dioxin (TCDD) and related compounds part I: Estimating exposure to dioxin-like compounds (peer review draft), Exposure Assessment and Risk Characterization Group National Center for Environmental Assessment, Washington.
US EPA, (2000b) Exposure and human health reassessment of 2,3,7,8-tetrachlorodibenzo-p-dioxin (TCDD) and related compounds part I: Estimating exposure to dioxin-like compounds, volume 3, chapter 4 (peer review draft), Exposure Assessment and Risk Characterization Group National Center for Environmental Assessment, Washington.
Weisglas-Kuperus N., Sas T.S., Koopman-Esseboom C., van der Zwan C., Riddler M.A.J., Boishuizen A., Hooijkaas H. and Sauer P.J.J. (1995). ‘Immunolological effects of background prenatal and postnatal exposure to dioxins and polychlorinated biphenyls in infants.’ Paediatric Research 30 (3): 404-410.
Welker Environmental Consultancy, (2000) Air quality assessment for proposed poultry litter fired power station, Muchea,

PLFPS v8 public Page 34 of 35 Dioxin Health Risk Assessment 25/06/02
GLOSSARY Availability An engineering term used to indicate the
proportion of technology being discussed that is accessible over time.
Central Exposure Scenario Indicates the maximum exposures to which most
people living at exposed locations, and buying most of their food from the usual commercial outlets, would be subjected to.
Exposure Scenario Characterises the behaviour of the population in
the exposure setting and determines the severity of the exposure.
Exposure Setting The physical aspects of an exposure area. Health Risk Assessment (HRA) Provide risk findings estimates of human
health risks associated with a site, activity or facility.
High-end exposure scenario Represents the maximum possible exposure a
person could achieve for a typical food consumption if they spent all their time exposed to the facility’s emissions, produced and consumed all their own food at the location and drank only rainwater from their roofs.
PCDD Polychlorinated dibenzo-p-dioxins-2 benzene rings
joined together by 2 oxygen atoms. PCDF Polychlorinated dibenzo furans 2 benzene rings
joined by one oxygen atom. TCDD Refers to 2,3,7,8 – tetrachloro-dibenzo-p-dioxin,
the most toxic member of the dioxin class. TDI Tolerable Daily Intake. TEF Refers to Toxic Equivalency Factors where each
member of the dioxin class is compared to TCDD for its potency. This allows for a system of ranking amongst the individual dioxins in the group.

PLFPS v8 public Page 35 of 35 Dioxin Health Risk Assessment 25/06/02
APPENDICES
(1) Gore-Tex information and correspondence
(2) Environmental Alliances Report

PLFPS v8 Dioxin Health Risk Assessment 25/06/02
APPENDICES (1)
Gore-Tex information and correspondence

The safest and simplest way to destroy dioxin.
remediaR E M E D I A™ D / F C A T A L Y T I C F I L T E R S Y S T E M

W. L. Gore & Associates, the leader in filtration technology,
now brings you a revolutionary way to meet dioxin and
furan emission regulations. Now you can destroy gaseous
dioxins and furans simply by installing new filters in your
baghouse.This innovative system is effective and cost-
efficient—without requiring process changes or adding costly
new equipment. Safer for the environment, safer for
employees, simpler to use, our REMEDIA™ D/F catalytic filter
system is the safest and simplest way to destroy dioxin.
The Safest and SimplestTechnology for Dioxin Control
MEETING THE DIOXIN CHALLENGE
The threat of dioxins is drawing increasing
attention around the world. Governments
are phasing in tougher dioxin restrictions,
and reports about dioxin levels in food
products have generated widespread
concern. Issues related to dioxin emissions
and disposal are moving up the environmental
agenda.With heightened public awareness,
stricter regulations, and potential penalties
for non-compliance, it’s more important
than ever to avoid the risks associated with
inadequate dioxin control.
Now, a safe and simple solution is
available. Gore’s REMEDIA D/F catalytic filter
system helps you efficiently meet dioxin
emission requirements without the burden
of costly new equipment. It offers a broad
range of benefits unmatched by any other
dioxin control technology.
“ The REMEDIA D/F
catalytic filter system proved to
be the simplest solution to our
dioxin problem.The worldwide
team from Gore provided
superior service.”Operating Director,
Crematorium

ELIMINATING DIOXIN IS A BREEZE
WITH REMEDIA™ D/F FILTERS
Combining the principles of surface filtration
and catalysis, the REMEDIA D/F catalytic filter
system is a unique dioxin control alternative
that works in your existing baghouse to
destroy gaseous dioxins and furans to levels
far below regulatory limits—safely,
economically, and with minimal maintenance.
The REMEDIA D/F catalytic filter system
consists of GORE-TEX® membrane, an
expanded polytetrafluoroethylene (ePTFE),
NO MAJOR MODIFICATIONS
NECESSARY The REMEDIA D/F
Catalytic Filter System works in your
existing baghouse, providing dioxin
destruction without process
modifications or changes to your
physical plant.
laminated to a catalytic felt substrate.
A leading and proven filter technology,
GORE-TEX® membrane is widely used to
control and collect particulate matter in
industrial applications.
Using a patented process, catalysts,
consistently proven to destroy gaseous
dioxins, are combined with PTFE to form
a coherent catalytic fiber.The resulting
catalyst/ePTFE fiber is needlepunched into
a RASTEX® ePTFE scrim to create the
felt substrate.
AN INNOVATIVE APPROACH
TO DIOXIN CONTROL
Here’s how the REMEDIA D/F catalytic filter
system works: the GORE-TEX® membrane
captures fine particulate on the surface of
the filter. As the filter is cleaned, solids are
released from the surface and collected in
the bottom of the baghouse hopper.The
gaseous dioxins and furans pass through the
GORE-TEX® membrane into the catalytic felt.
The catalyst instantly reacts with the dioxin
and furan molecules to convert them into
insignificant amounts of CO2, H2O and HCl.
Making the move to single-step
destruction of gaseous dioxins and removal
of particulates is easy. Simply replace your
existing filter bags with REMEDIA D/F
catalytic filters. No process changes are
required—no additional equipment,
procedures or worker training are needed.
Since the REMEDIA D/F catalytic filter
system is a passive control technology that
operates continuously, it offers reliable,
consistent performance unequaled by any
other alternative.The REMEDIA D/F catalytic
filter system also offers low maintenance and
better filter cake management.
REMEDIA™ D/F CATALYTIC FILTER SYSTEM
Combining the principles of surface filtration and catalysis.
Waste HeatBoiler
Acid GasDry Adsorption
Baghouse
Incinerator
▲
▲
▲
REMEDIA D/FCatalytic Filter System
RAW GAS CLEAN GAS
GORE-TEX® MembraneSurface Filtration Catalytic Filtration
Airflow
Catalyst/ePTFE Felt
CO2
CO2
O2
O2
O2
O2CO2
H2O
Dioxin
Dioxin
ParticulateMatter (dust)
Dioxin
Furan
Furan
H2O
HCl
▲
▲
▲

The REMEDIA™ D/F catalytic filter system
offers substantial benefits over sorbent
injection systems and other dioxin control
technologies.
Destroys dioxins. Unlike sorbent-based
systems such as powder activated carbon
(PAC), the REMEDIA D/F catalytic filter
system does not merely move dioxin and
furan molecules from the gas stream to the
solid residue stream—it destroys them.
Compared to sorbent-based systems, the
REMEDIA D/F catalytic filter system
decreases total release of dioxin to the
environment—both gas and solids—by more
than 90 percent.
Lower disposal costs. With no dioxin-
contaminated sorbents to dispose of, the
REMEDIA D/F catalytic filter system
minimizes the cost of hazardous waste
disposal. It addresses concerns about existing
or future landfill restrictions on the amount
and toxicity of sorbent levels in fly ash.
Reducing hazardous waste disposal with the
REMEDIA D/F catalytic filter system also
demonstrates your company’s commitment
to environmental protection.
The Total Dioxin Solution for Industry and the Environment
REMEDIA D/F CATALYTIC FILTER SYSTEM
The only dioxin abatement technology with all of the following benefits:
“ I am very pleased that
we are eliminating almost all of
our dioxin/furan emissions using
the REMEDIA D/F catalytic
filter system, rather than simply
transferring the material from
the flue gas to the solid residue
stream, such as with activated
carbon.”President and CEO, Medical
Waste Incinerator
BENEFIT Sorbent Carbon REMEDIA D/FInjection Reactor
Catalytic Bed Catalytic
(e.g., carbon) (e.g., SCR) Filter System
Meets PCDD/F emissions regulations ▲ ▲ ▲ ▲
Destroys gaseous PCDD/F ▲ ▲
Provides dust control ▲
Reduces PCDD/F total emissions▲ ▲
to the environment
Passive system—low maintenance ▲ ▲
No need to purchasenew equipment
▲
Uses existing facility footprint ▲

Total Cost of Ownership of a Dioxin/Furan Control Technology Over a 15-Year Period
$
■ Purchase Price■ PCDD/F Control Operating & Maintenance Cost■ Dust Control Operating & Maintenance Cost
CatalyticReactor
SorbentInjection
REMEDIA D/F CatalyticFilter System
Easy to get started. No new capital
equipment is required. REMEDIA D/F filters
work in your current baghouse so you can
optimize your existing assets. No change in
your current process is needed, and your
facility’s footprint remains the same.
Easy to operate. The REMEDIA D/F
catalytic filter system is a passive operation,
continuously destroying gaseous dioxins and
furans while in operation.With no additional
equipment to operate, ongoing maintenance
demands are kept to a minimum.
Safer for employees. Carbon-based
systems create a risk of baghouse fires.
Hazardous carbon dust, especially when it is
contaminated with dioxin, also puts operators
at risk. With the REMEDIA D/F catalytic filter
system, avoiding carbon eliminates the risk of
fires and minimizes potential health risks.
Efficient dioxin removal. With sorbent-
based systems, cooling of the flue gas is
often required to maximize dioxin removal
efficiency.The REMEDIA D/F catalytic filter
system operates at temperatures up to
260oC. Because no cooling is necessary, no
additional equipment or system modification
is required to cool the flue gases.
Reduces corrosion. The lower operating
temperatures required with other dioxin
control systems can cause corrosion in your
baghouse. Since the REMEDIA D/F catalytic
filter system works at higher temperatures,
there is less chance of corrosion.
Long product life. Made of a
catalyst/ePTFE fiber, the REMEDIA D/F
catalytic filter system has high mechanical
strength and durability. In fact, system life can
be expected to exceed five years—ensuring
savings well into the future.
Efficient dust control. The GORE-TEX®
membrane’s microporous structure filters
dust—even submicron particles. By capturing
fine particles it reduces total emissions of
toxins, such as trace heavy metals, to the
atmosphere.
Flexible baghouse operation. The
microporous structure and smooth surface
of the GORE-TEX® membrane make it easy
to clean, providing better dust cake
management.The resulting pressure drop can
lead to increased production, more stable
operation, and energy savings.
AFFORDABLE TO OWN The REMEDIA D/F catalytic filter system provides an unmatched
combination of benefits and value.

0 0
1
2
3
4
5
6
Compartment Data Stack Data
0.5
0.4
0.3
0.2
0.1
Raw
Gas
PC
DD
/F C
once
ntra
tion
[ng
(TEQ
)/N
m3 @
11%
O2]
2.9
PCD
D/F C
oncentration
[ng (TEQ)/N
m3 @
11% O
2 ]
Clean G
as
REMEDIA D/F filters installedin first of 3 compartments
REMEDIA D/F filters installed in remaining 17 compartments
.004 .002 .011 .037 .002 .025 .006 .023 .02 .02
3 8 13 16 18 21 25 28 32 35
▲ Raw Gas (Gas Phase PCDD/F)
■ Clean Gas (Gas & Solid Phase PCDD/F)
▲
5.9▲
5.9▲
4.7▲
4.1▲
▲ ▲
“Compartment Data” represent 3-hour measurements directly before the baghouse (raw gas) and after the baghouse compartment (clean gas). “Stack Data” represent measurements in the stack (clean gas).
All measurements were conducted according to the Euro Norm EN 1948. After destruction efficiency was quantified, raw gas readings were discontinued.
Months in Use
Full Scale Municipal Waste Incinerator
A TESTED AND PROVEN
TECHNOLOGY
Since 1995, Gore has performed more than
200 polychlorinated dibenzo-dioxin/furan
(PCDD/F) measurements in combustion
facilities around the world. In addition, more
than 700 REMEDIA™ D/F catalytic filter
samples have been tested in more than 70
facilities, including municipal waste incinerators,
as well as crematoria, pyrometallurgical plants,
and cement kilns burning hazardous waste.
Specifically, tests of the REMEDIA D/F
catalytic filter system at a full-scale municipal
waste combustor burning 200 tons of waste
per day yielded dioxin emissions well below
the required level of 0.1 ng (TEQ)/Nm3 over
a three-year period. Raw gas concentrations
of dioxins and furans were measured to be
between 2.9 and 5.9 ng (TEQ)/Nm3, with
subsequent emission concentrations as low
as 0.002-0.04 ng (TEQ)/Nm3—substantially
below the required 0.1 ng (TEQ)/Nm3 level.
Furthermore, analysis revealed that the
concentrations of dioxin in the fly ash using
the REMEDIA D/F catalytic filter system were
significantly lower than those achievable using
a PAC system.The results are impressive.
Total dioxin and furan emissions to the
environment—including release of both gas
and solids from the baghouse—were reduced
more than 90% compared to PAC systems.
These results are consistent with
numerous tests performed in both full-scale
systems and pilot test programs.Tests were
conducted at temperatures ranging from
180o to 250oC and at filtration velocities
varying from 0.8 m/minute to 1.4 m/minute.
Within these ranges, the REMEDIA D/F
catalytic filter system is designed to perform
with the same efficiency and reduce
emissions of dioxins/furans to below
0.1 ng (TEQ)/Nm3.
At facilities operating under good
combustion practices—a typical inlet dioxin
concentration below 10 ng (TEQ)/Nm3—
the REMEDIA D/F catalytic filter system is
designed to meet and exceed dioxin
regulations.
“ The best thing about
REMEDIA D/F catalytic filters is
that the system destroys dioxin
instead of simply capturing it.
There were no changes to our
process or equipment. In addition,
no operator is needed after these
filters are installed.”Plant Manager, Municipal
Waste Incinerator
PROVEN RESULTS Field tests over a long period of time confirm that the REMEDIA D/F Catalytic Filter System
efficiently controls dioxins and furans below regulatory requirements.

W. L. Gore & Associates is a worldwide
leader in providing high technology solutions
for demanding electronic, industrial, medical
and fabric applications. Gore is a global
manufacturer with worldwide sales and service.
Our innovation and technical
accomplishment in the application and use
of fluoropolymers, particularly PTFE, has
resulted in the development of thousands
of diverse products.
As the pioneer in the use of expanded
PTFE membrane technology for filtration,
Gore benefits from more than 25 years of
experience in particulate control. Expanded
PTFE’s inherent strength, chemical inertness,
thermal stability and microporosity make it a
versatile, highly efficient filter media. From
vents and adsorbent modules to cartridges
and filter bags, whether capturing
contaminants in computer disk drives or
industrial smokestacks, customers rely on the
consistent performance of Gore filtration
and separation products.
In order to keep up with environmental
regulations and evolving customers’ needs,
Gore has pushed the frontiers of traditional
filtration and separation technology. Catalytic
processes yield higher purity output with
less by-products and reduced environmental
hazards.The microporosity, cleanability, and
non-particulating properties of PTFE,
combined with the chemically reactive
properties of catalysts, provide particular
value in applications like fuel cells and
industrial filtration.
Now the REMEDIA D/F catalytic filter
system, the first in a series of catalytic
filtration products, is transforming the future
of filtration and toxic emissions control.
Gore: A Trusted Name
“ There will likely be
increasingly stringent regulations
governing the release of dioxin
to the environment and
REMEDIA D/F catalytic filters
will help facility operators meet
these requirements while
utilizing their existing baghouse.
It’s also beneficial that—in
addition to controlling dioxin—
REMEDIA D/F catalytic filters
effectively collect particulate
matter.”Technology Manager,
Pollution Control Equipment
Manufacturer
0.1
0.08
0.06
0.04
0.02
0
Dio
xin
Con
cent
ratio
n[n
g (T
EQ)/
Nm
3]
0.072
0.021
0.012
Full Scale SystemsStack Emissions
MunicipalWaste
IncineratorBelgium
MunicipalWaste
Incinerator Japan
Crematory 1Germany
Crematory 2Germany
0.042
MedicalWaste
IncineratorUSA
0.054
PROVEN RESULTS Emissions data from a variety of full scale applications confirm that the
REMEDIATM D/F catalytic filter system controls dioxins and furans below regulatory requirements.

To find out if the REMEDIA™ D/F catalytic filter system is right for your facility, contact your
local sales representative.
©2000 W. L. Gore & Associates, Inc.GORE, GORE-TEX, REMEDIA, RASTEX and designs are trademarks of W. L. Gore & Associates, Inc.Printed in Germany
4-323-016E 10/00
www.gore.com/remedia
France:W. L. Gore & Associés SarlZ. I. De Saint-Guénault4, rue Jean Mermoz91031 Evry CedexFRANCETel: +33 (0) 1 60 79 60 79
Germany:W. L. Gore & Associates GmbHWernher-von-Braun-Str. 18Plant 1D-85640 PutzbrunnGERMANYTel: +49 (0) 89 4612 0
Japan:JAPAN GORE-TEX INC.Business Operations Center1-42-5 AkazutsumiSetagaya-KuTokyo 156-8505JAPANTel: +81 (0) 3-3327-0011
Korea:W. L. Gore & Associates(Korea) Ltd.12F, Chong Kun Dang Building368 Chungjungro–3 KaSudaemoon-KuSeoul 102-103KOREATel: +82 2 393 3411
Benelux:W. L. Gore & Associates B.V.Pettelaarpark 64A5216 PP ’s-HertogenboschTHE NETHERLANDSTel: +31 (0) 73 687 2444
Sweden:W. L. Gore & AssociatesScandinavia ABBox 268S-431 23 MoelndalSWEDENTel: +46 (0) 31 706 7800
Taiwan:W. L. Gore & Associates (Far East) Ltd. (Taiwan Branch)4F, No. 136Sec. 3, Nanking East RoadTaipei,TaiwanREPUBLIC OF CHINATel: +886 2 8771 7799
UK (Scotland):W. L. Gore & Associates (UK) Ltd.Heather ParkKirkton South RoadKirkton CampusLivingstonWest Lothian, EH54 7BTSCOTLANDTel: +44 (0) 1506 460123
USA:W. L. Gore & Associates, Inc.101 Lewisville RoadP.O. Box 1100Elkton, MD 21922-1100USATel: +1 410 392 3300
REMEDIA™ D/F CATALYTIC FILTER SYSTEM*
Fiber content Staple – GORE-TEX®
Expanded PTFE/catalyst
Scrim – RASTEX®
Expanded PTFE fiber
Felt construction Supported needlefelt
Membrane surface GORE-TEX® ePTFE
Continuous operating temperature 500°F / 260°C (maximum)
Surge temperature 525°F / 274°C (maximum)
Acid resistance Excellent
Alkali resistance Excellent
*All specifications are subject to change without notice.
Learn More About REMEDIA™ D/FCatalytic Filter System

www.gore.com/remedia
Creative TechnologiesWorldwide
Flow rate per line: 30,000 Nm3/hr
Baghouse Temperature: 180˚C - 240˚CFilter area per line: 707 m2
Date of REMEDIA D/F catalytic filter systemInstallation: July – October 1997 (3 compartments),October 1998 (All remaining baghouse compartments).
Before Installation: Prior to installing REMEDIA D/Ffilters, powdered activated carbon (PAC) was used forthe adsorption of PCDD/F. In order to avoid the risk offire caused by ignition of carbon-rich fly ash and tosimplify plant operations, the plant installed theREMEDIA D/F Catalytic Filter System.
After Installation: The emissions of PCDD/F are significantly below 0.1 ng TEQ/Nm3 @ 11% O2 andparticulate emissions are below 1 mg/Nm3 @ 11% O2.Total PCDD/F released from the stack and the baghousehopper dust has been reduced more than 90% over the PAC system. The baghouse hopper dust contains13 times less PCDD/F than when PAC was used. Inaddition, the plant realized savings by eliminating thecost of purchasing, storing, and disposing of PAC.
Plant Type: Municipal waste incinerator
Plant Location: Belgium
Process Description: Stoker – Boiler – ESP – Dry Lime Scrubber – Baghouse – Stack
Number of Process Lines: 2
Number of Process Lines with REMEDIA D/F filters: 2
Feed rate per line: 4 tons/hr
Raw Gas (Gas Phase PCDD/F)
Clean Gas (Solid & Gas Phase PCDD/F)
Compartment Data
StackData
Raw Gas
PCDD/F Concentration(ng I-TEQ/Nm
3 @ 11%
O2 )PC
DD/F
Con
cent
ratio
n(n
g I-T
EQ/N
m3 @
11%
O2)
Clea
n Ga
s
REMEDIA D/F filters installedin first of 3 compartments
REMEDIA D/F filters installed in remaining 17 compartments
5.94
4.07
1.79
3.32
Months in Use
0.011 0.004 0.0150.037 0.031 0.012 0.013 0.012 0.008
42
6
5
4
3
2
1
0
0.5
0.4
0.3
0.2
0.1
0383428181716138
MUNICIPAL WASTE INCINERATOR
W. L. Gore & Associates, Inc.P. O. Box 1100, 101 Lewisville RoadElkton, MD USA 21922-1100
Gore Offices Worldwide:USA +1 410 392 3300 Japan +81 (0) 3 3327 0011 Sweden +46 (0) 31 7067800
France +33 (0) 1 60 79 60 79 Korea +82 2 393 3411 Taiwan +886 2 8771 7799Germany +49 (0) 89 4612 0 Benelux +31 (0) 73 687 24 44 UK (Scotland) +44 (0) 1506 460123
REMEDIA, GORE® and designs are trademarks of W. L. Gore & Associates.All rights reserved. Copyright © 2000 W. L. Gore & Associates, Inc.
4-323-024E 3/01
CATALYTIC FILTER SYSTEM

www.gore.com/remedia
Creative TechnologiesWorldwide
Number of Process Lines with REMEDIA D/F filters: 1
Feed rate per line: 100 tons/day
Flow rate per line: 19,400 Nm3/hr, dry
Baghouse Temperature: 194˚CFilter area per line: 788 m2
Date of REMEDIA D/F catalytic filter systemInstallation: March 1999
Before Installation: Plant personnel identified aneed to add PCDD/F control to meet future emissionsguideline.
After Installation: Plant has achieved emissions ofPCDD/ F significantly below 0.1 ng TEQ/Nm3 @ 12% O2
and particulate emissions below 1 mg/Nm 3 @12% O2
without any process modification.
Plant Type: Municipal waste incinerator
Plant Location: Japan
Process Description: Stoker – Boiler – Dry LimeScrubber – Baghouse – Stack
Number of Process Lines: 3
MUNICIPAL WASTE INCINERATOR
W. L. Gore & Associates, Inc.P. O. Box 1100, 101 Lewisville RoadElkton, MD USA 21922-1100
Gore Offices Worldwide:USA +1 410 392 3300 Japan +81 (0) 3 3327 0011 Sweden +46 (0) 31 7067800
France +33 (0) 1 60 79 60 79 Korea +82 2 393 3411 Taiwan +886 2 8771 7799Germany +49 (0) 89 4612 0 Benelux +31 (0) 73 687 24 44 UK (Scotland) +44 (0) 1506 460123
REMEDIA, GORE® and designs are trademarks of W. L. Gore & Associates.All rights reserved. Copyright © 2000 W. L. Gore & Associates, Inc.
4-323-012E 9/00
3.536
0.012 0.011
PCDD
/F C
once
ntra
tion
(ng
TEQ/
Nm3 @
12%
O2)
Raw Gas
Clean Gas
0
1
1 7
2
3
4
Months in Operation
CATALYTIC FILTER SYSTEM

www.gore.com/remedia
Creative TechnologiesWorldwide
Flow rate per line: 50,000 Nm3/hr, dry
Baghouse Temperature: 180˚C - 200˚CFilter area per line: 1177 m 2
Date of REMEDIA D/F catalytic filter systemInstallation: May - June 1999
Before Installation: Plant personnel identified aneed to add PCDD/F control to meet future emissionsguideline. Powdered activated carbon (PAC) waseliminated from consideration based on new equipmentrequirements and potential liability associated withdioxin-contaminated residue disposal.
After Installation: The emissions of PCDD/F arebelow 0.1 ng TEQ/Nm 3 @ 11% O2, and substantiallylower than the new emissions guideline and historicalvalues. Key advantages of the REMEDIA D/F catalyticfilters over PAC technology are 1) Destruction ofPCDD/F instead of adsorption on PAC, 2) No needto dispose of contaminated PAC, and 3) No newequipment required to store, handle, and inject PAC.
Plant Type: Medical waste incinerator
Plant Location: USA
Process Description: Incinerator – Boiler – Dry Scrubber (sodium sesquicarbonate) – Baghouse – Stack
Number of Process Lines: 2
Number of Process Lines with REMEDIA D/F filters: 2
Feed rate per line: 68 tons/day
MEDICAL WASTE INCINERATOR
W. L. Gore & Associates, Inc.P. O. Box 1100, 101 Lewisville RoadElkton, MD USA 21922-1100
Gore Offices Worldwide:USA +1 410 392 3300 Japan +81 (0) 3 3327 0011 Sweden +46 (0) 31 7067800
France +33 (0) 1 60 79 60 79 Korea +82 2 393 3411 Taiwan +886 2 8771 7799Germany +49 (0) 89 4612 0 Benelux +31 (0) 73 687 24 44 UK (Scotland) +44 (0) 1506 460123
REMEDIA, GORE® and designs are trademarks of W. L. Gore & Associates.All rights reserved. Copyright © 2000 W. L. Gore & Associates, Inc.
4-323-011E 9/00
Raw Gas
Clean Gas
2.57
0.042
PCDD
/F C
once
ntra
tion
(ng
TEQ/
Nm3 @
11%
O2)
0.0
0.5
1.0
1.5
2.0
2.5
3.0
CATALYTIC FILTER SYSTEM

4.7
0.072
LINE 1
PCDD
/F C
once
ntra
tion
(ng
TEQ/
Nm3 @
11%
O2)
Raw Gas
Clean Gas
0
1
2
3
4
5
www.gore.com/remedia
Creative TechnologiesWorldwide
Flow rate per line: 1400 Nm3/hr, dry
Baghouse Temperature: 200˚CFilter area per line: 74 m2
Date of REMEDIA D/F catalytic filter systemInstallation: July 1999 (Line 1), December 1999(Line 2)
Before Installation: In 1997, Germany adopted a new dioxin (0.1 ng TEQ/Nm3) and particulate (10 mg/Nm3) regulation for crematoria. Existing plants had 3 years to meet the regulation. Plantconsidered other PCDD/F control technologies that required considerable construction cost and time to install.
After Installation: This plant chose the REMEDIAcatalytic filter system because it was a less costlysolution than installing new equipment for alternativesolutions. They also valued dioxin destruction asthe best solution for the environment. Emissions arebelow the regulatory limits for both dioxin andparticulate.
Plant Type: Crematorium
Plant Location: Germany
Process Description: Kiln – Afterburner –Combustion air preheater – Air/water cooler –Cyclone – Baghouse – Stack
Number of Process Lines: 2
Number of Process Lines with REMEDIA D/F filters: 2
CREMATORIUM
W. L. Gore & Associates, Inc.P. O. Box 1100, 101 Lewisville RoadElkton, MD USA 21922-1100
Gore Offices Worldwide:USA +1 410 392 3300 Japan +81 (0) 3 3327 0011 Sweden +46 (0) 31 7067800
France +33 (0) 1 60 79 60 79 Korea +82 2 393 3411 Taiwan +886 2 8771 7799Germany +49 (0) 89 4612 0 Benelux +31 (0) 73 687 24 44 UK (Scotland) +44 (0) 1506 460123
REMEDIA, GORE® and designs are trademarks of W. L. Gore & Associates.All rights reserved. Copyright © 2000 W. L. Gore & Associates, Inc.
4-323-014E 9/00
CATALYTIC FILTER SYSTEM

www.gore.com/remedia
Creative TechnologiesWorldwide
Flow rate per line: 1300 Nm3/hr, dry
Baghouse Temperature: 220˚CFilter area per line: 60 m2 (Line 1), 64 m2 (Line 2)
Date of REMEDIA D/F catalytic filter systemInstallation: October 1998 (Line 1), February 2000(Line 2)
Before Installation: In 1997, Germany adopted a new dioxin (0.1 ng TEQ/Nm3) and particulate (10 mg/Nm3) regulation for crematoria. Existing plants had 3 years to meet the regulation. Plant hadan existing baghouse using conventional felt bags.Other alternatives required additional space and new equipment.
After Installation: Emissions are below theregulatory limits for both dioxin and particulate. Nonew equipment was purchased and the REMEDIAcatalytic filter system was installed in less than one day.
Plant Type: Crematorium
Plant Location: Germany
Process Description: Kiln – Afterburner – HeatExchanger – Cyclone – Baghouse – Stack
Number of Process Lines: 2
Number of Process Lines with REMEDIA D/F filters: 2
CREMATORIUM
W. L. Gore & Associates, Inc.P. O. Box 1100, 101 Lewisville RoadElkton, MD USA 21922-1100
Gore Offices Worldwide:USA +1 410 392 3300 Japan +81 (0) 3 3327 0011 Sweden +46 (0) 31 7067800
France +33 (0) 1 60 79 60 79 Korea +82 2 393 3411 Taiwan +886 2 8771 7799Germany +49 (0) 89 4612 0 Benelux +31 (0) 73 687 24 44 UK (Scotland) +44 (0) 1506 460123
REMEDIA, GORE® and designs are trademarks of W. L. Gore & Associates.All rights reserved. Copyright © 2000 W. L. Gore & Associates, Inc.
4-323-015E 9/00
0.0
0.5
1.0
1.51.266
0.054
LINE 1
PCDD
/F C
once
ntra
tion
(ng
TEQ/
Nm3 @
11%
O2)
Raw Gas
Clean Gas
CATALYTIC FILTER SYSTEM

www.gore.com/remedia
Feed Rate per Line: 120 tons/day
Flow Rate per Line: 35,000 Nm³/hr
Baghouse Temperature: 180-220°C
Filter Area: 1050 m²
Date of REMEDIA D/F catalytic filter systemInstallation: August 2000
Before Installation: Increased temperature to 200°C tomitigate corrosion issues. High temperature precluded theuse of activated carbon due to risk of fire.
After Installation: Dioxin emissions dramatically belowthe regulatory requirement of 0.1 ng I-TEQ/Nm3. Filtercleaning frequency approximately one tenth previousrequirements (P84/PTFE blend). BICAR ® consumption hasbeen reduced by 20-30%.
Plant Type: Municipal Waste Incinerator
Plant Location: France
Process Description: Grate Furnace-Boiler-ESP-DryAbsorption System (BICAR® Injection)-Baghouse-Stack
Number of Process Lines: 1
MUNICIPAL WASTE INCINERATOR
W. L. Gore & Associates, Inc.P. O. Box 1100, 101 Lewisville RoadElkton, MD USA 21922-1100
Gore Offices Worldwide:USA +1 410 392 3300 Japan +81 (0) 3 3327 0011 Sweden +46 (0) 31 7067800
France +33 (0) 1 60 79 60 79 Korea +82 2 393 3411 Taiwan +886 2 8771 7799Germany +49 (0) 89 4612 0 Benelux +31 (0) 73 687 24 44 UK (Scotland) +44 (0) 1506 460123
REMEDIA, GORE® and designs are trademarks of W. L. Gore & Associates.BICAR® is a trademark of Solvay S.A.
All rights reserved. Copyright © 2001 W. L. Gore & Associates, Inc.
4-323-027E 5/01
Remedia D/F filterinstallation
0.006 0.0260.011
1.9
0
0.2
0.4
0.6
0.8
1
1.2
1.4
1.6
1.8
2
July 2000 October 2000 November 2000 January 2001
PC
DD
/F S
tack
Co
nce
ntr
atio
n
[ng
I-T
EQ
/Nm
3 @11
% O
2]

www.gore.com/remedia
N.D. = non-detectable
0
0.5
1
1.5
2
2.5
3
Baghouse Inlet Stack
PC
DD
/F C
on
cen
trat
ion
(ng
TE
Q/N
m3 @
12%
O2) Particle phase
Gas phase
1.9
0.5
Total: 2.4
Total: 0.04Particle: N.D.
Gas: 0.04
MUNICIPAL WASTE INCINERATOR
W. L. Gore & Associates, Inc.101 Lewisville RoadP. O. Box 1100Elkton, MD USA 21922-1100
Gore Offices Worldwide:USA +1 410 392 3300 Japan +81 (0) 3-3327-0011 Sweden +46 (0) 31 7067800
France +33 (0) 1 60 79 60 79 Korea +82 2 393 3411 Taiwan +886 2 8771 7799Germany +49 (0) 89 4612 0 Netherlands +31 (073) 6872444 UK (Scotland) +44 (0) 1506 460123
REMEDIA, GORE® and designs are trademarks of W. L. Gore & Associates.All rights reserved. © 2001 W. L. Gore & Associates, Inc.
4-323-028E 6/01
Number of Process Lines with REMEDIA D/Ffilters: 2Feed Rate per Line: 5 tons/hrFlow Rate per Line: 29,000 Nm3/hr (Wet)Baghouse Temperature: 200°CFilter Area per Line: 705 m2
Date of REMEDIA D/F catalytic filter systemInstallation: November 2000 (Line 1); February2001 (Line 2)Before Installation: Plant personnel identified aneed to add dioxin and furan control to meetfuture emissions guideline.After Installation: Plant has achieved emissionsof dioxins and furans significantly below 0.1 ngTEQ/Nm3 @ 12% O2.
Plant Type: Municipal waste incineratorPlant Location: JapanProcess Description: Stoker-Boiler-Air Heater-Dry Lime Injection-Baghouse-Stack

CATALYTIC FILTER SYSTEM
Catalytic Filtration:Dioxin/FuranDestructionin the Baghouse
Jean Luc Bonte C.V. IVROKoen van Overberghe Oostnieuwkerksesteenweg 121
8800 RoeselareBelgium
Marc Plinke W. L. Gore & Associates, Inc.Robert Dandaraw 101 Lewisville RoadGlenn Brinckman Elkton, MD 21921Michelle Waters USA
Hein van den Heuvel W. L. Gore & Associates B.V.Pettelaarpark 64A
5216 PP ’s-HertogenboschThe Netherlands
Experiences at the
IVRO Municipal
Waste Incinerator in
Roeselare, Belgium

Abstract
This paper describes the current status of air pollution
control at the municipal waste incinerator of IVRO,
Roeselare, Belgium, using the REMEDIA™ D/F catalytic
filter system for dioxin/furan destruction and particulate
control. Several catalytic filters were first installed in the
baghouse in October 1996, to investigate catalyst activity.
Pilot scale tests were then conducted from March 1997 to
July 1998, to evaluate the dioxin destruction efficiency of
various catalysts. In October 1998, the full installation of the
plant was completed.
This paper is divided into five parts. Part 1 focuses on the
current dioxin/furan emissions to show that the catalytic
filter system destroys dioxin/furans below the regulatory
limit of 0.1 ng(ITEQ)/Nm3 at 11% O2. In Part 2, catalyst
durability is demonstrated. For three years a consistent
destruction of dioxins and furans has been observed. Part 3
focuses on the quality of dioxin/furan concentration
measurements. Several measurement companies have been
evaluated showing measurement accuracy of 15% within
one company. In Part 4, the ability of the REMEDIA D/F
filters to remove particles is demonstrated. In over 100
measurements, the clean gas dust concentrations were
below 1 mg/Nm3, and often below the detection limit of
0.2 mg/Nm3. In Part 5, the total release of dioxins into the
environment is evaluated. When comparing the catalytic
filter system with an activated carbon injection system,
the catalyst filter system not only decreased the gaseous
dioxin/furan emissions by more than 99%, but also
decreased the particulate phase dioxin/furan emissions
by more than 93%.
Background
Plant Information
The IVRO municipal waste incinerator is located in
Roeselare, Belgium. As shown in Figure 1, the plant consists
of a Stoker – Boiler – ESP – Dry Lime Injection – Fabric
Filter Baghouse. The baghouse operating temperature varies
between 200˚C and 230˚C.
Plant History
The plant was built in 1976 and consisted of two lines, each
having a stoker, an air cooler and an electrostatic precipitator
(ESP). In 1985, IVRO installed a dry gas cleaning system
and increased the capacity from 3.2 t/h to 4 t/h per line.
Including further optimization steps, the total investment for
the plant at that time was approximately 14 million euro.
In 1990, IVRO switched from dry lime to Spongiacal®,
an expanded lime, to reduce emissions of chlorines to
approximately 10 mg/Nm3. By installing GORE-TEX®
membrane filter bags, the particulate emissions were
reduced to less than 1 mg/Nm3. In 1996, new dioxin
regulations were enacted, prompting IVRO to install a
powdered activated carbon injection system (PAC), to
reduce dioxin emissions below 0.1 ng(ITEQ)/Nm3. The
PAC system was used at high temperatures of 200 –230°C.
At these temperatures corrosion is kept to a minimum, and
Spongiacal can be added with screw conveyers. However,
the disadvantage of using PAC at high temperatures is the
danger of fires in the baghouse. The burning carbon-rich fly
ash not only damages the filter bags, but also the dust
evacuation equipment. To avoid a subsequent plant shutdown,
IVRO began looking for alternative technologies for dioxin
and particulate control. In 1998, IVRO invested an additional
4.5 million euros to renovate the stokers and ESP, and install
new de-ashing and electrical control systems. The catalytic
filter system was installed in the existing baghouse without
any changes to the operation. Today the plant can be operated
to be within compliance with all European environmental
regulations.

LINE 1
Stoker
Boiler
ESP
LimeInjection
Baghouse
Stack
ID Fan
Dry
Lim
e Re
acto
r
Raw GasNov. 6, 1998: 6.6 ng/Nm
Jan. 27, 1999: 5.2 ng/Nm
Clean GasNov. 6, 1998: 0.015 ng/Nm
Jan. 27, 1999: 0.052 ng/Nm
ID Fan
3
3
3
Stack Gas ConcentrationNov. 6, 1998: 0.02 ng/NmDec. 10, 1998: 0.04 ng/NmJan. 27, 1999: 0.04 ng/Nm
3
3
3
3
Stoker
Boiler
ESP
Dry
Lim
e Re
acto
r
LINE 2
Baghouse
LimeInjection
Raw GasNov. 6, 1998: 3.6 ng/Nm
Jan. 27, 1999: 6.6 ng/Nm
Clean GasNov. 6, 1998: 0.015 ng/Nm
Jan. 27, 1999: 0.039 ng/Nm
3
33
3
Catalytic Filtration Product Information
REMEDIA D/F catalytic filter system is manufactured by
W. L. Gore & Associates. This new system consists of a
GORE-TEX® membrane laminated to a catalytically active
felt. The felt is composed of chemically active fibers
containing a variety of specially produced catalysts. As
gases pass through the felt, a catalytic reaction is induced
and dioxins/furans are decomposed into harmless gaseous
components. The new fiber provides the GORE-TEX
membrane filter bag with multifunctional filtration
capabilities. The GORE-TEX membrane provides
particulate collection, while the catalytic substrate will
destroy highly toxic gaseous pollutants. The temperature
range required for catalytic reaction is as low as 140˚C to
260˚C. A minimum temperature of 180˚C is preferred.
Experimental Procedure
Filter Installation Dates
Deactivation studies with catalytic materials in the main
baghouse at IVRO and other combustion plants started in
October 1995. The first complete REMEDIA D/F catalytic
filter system was installed in March 1997 into a 1000 m3/h
pilot baghouse. Full compartments of REMEDIA D/F filters
were installed in the main baghouse at IVRO in July 1997.
After showing continued catalyst activity, the whole plant
was equipped with REMEDIA D/F filters in October 1998.
Today, IVRO has a total of more than 3 years experience
with REMEDIA D/F filters in real gas conditions. In the
process, more than seven catalysts were tested for
dioxin/furan destruction, reaction by-product generation,
and continued catalyst activity.
Dioxin Measurement Procedure
All stack measurements at IVRO were conducted according
to the Euro Norm EN 1648. All other measurements of raw
gas (before the baghouse) and clean gas (after the baghouse)
were conducted according to the same method, but with
sampling times of three hours (see Figure 1).
Results
Part 1 – Current Dioxin/Furan Emissions at IVRO
All measurements at the baghouse inlet and outlet for
Lines 1 and 2, as well as the stack measurements, were
conducted simultaneously. All tests were conducted without
the injection of activated carbon. The measurement results
are presented in Figure 1.
Figure 1 IVRO plant schematic diagram with current dioxin concentrations in the raw gas (before the baghouse), clean gas (after baghouse) andstack using the REMEDIA D/F catalytic filter system. All dioxin/furan emissions in (ITEQ) at 11% O2.

Part 2 – Catalyst Life
Over a three-year period, laboratory activity tests were
conducted on several commercial and non-commercial
catalysts after they were exposed to the actual flue gas
conditions. After an extensive evaluation, only a select few
catalysts maintained their original activity. In July 1997,
these select few were then installed into several baghouse
compartments of the IVRO municipal waste combustor, and
their dioxin destruction performance was monitored. Then,
in October 1998, REMEDIA D/F filters were installed in all
baghouse compartments. The raw and clean gas dioxin
concentrations of one specific compartment and the entire
plant are shown in Figure 2.
Part 3 – Quality of the Measured Dioxin/Furan Emissions
More than 100 dioxin/furan measurements were conducted
at IVRO. An extensive measurement accuracy program
concluded that the measurement company (MPU, Germany)
was able to accurately measure dioxin/furan emissions
within 15%. This accuracy was achieved at dioxin
concentrations as low as 0.01 ng(ITEQ)/Nm3.
Part 4 – Particulate Control
More than 100 dust concentration measurements were
completed at the IVRO incinerator. The clean gas dust
concentration did not exceed the 1 mg/Nm3 level. In most
cases, for sampling times of 3 hours, the dust level was at or
below the dust detection level of 0.2 mg/Nm3 at 11% O2.
To evaluate the total release of dioxins into the environment,
a comparison was made between the PAC and the
REMEDIA D/F catalytic filter system. To do this, gas and
solid phase PCDD/F emissions were tested.
Part 5 – Total Release of Dioxins into the Environment
In January 1998, the gaseous dioxin emissions were
0.07 ng/Nm3 with the PAC system. In January 1999, the
gaseous PCDD/F emissions were 0.04 ng/Nm3 (see Figure
1) utilizing the REMEDIA D/F catalytic filter system,
without the injection of carbon. To determine the amount
of dioxins released into the environment before and after
installation of the REMEDIA D/F filters, the gas and
particulate phase dioxin emissions needed to be evaluated.
Figure 2 Dioxin concentration of the raw and clean gas, using REMEDIA D/F catalytic filter system to demonstrate continueddioxin destruction performance during incinerator operation at temperatures of 200˚C to 230˚C. All measurementswere conducted according to the Euro Norm EN 1648. After destruction efficiency was quantified, raw gas readingswere discontinued. "Compartment Data" represent 3-hour measurements directly before the baghouse (raw gas)and after the baghouse compartment (clean gas). "Stack Data" represent measurements in the stack (clean gas).
Full Scale Municipal Waste IncineratorResults over 35 Months
0
1
2
3
4
5
6
Raw Gas (Gas Phase PCDD/F)
Clean Gas (Gas & Solid Phase PCDD/F)
Compartment Data
Stack Data
0.5
0.4
0.3
0.2
0.1
0
Raw
Gas
PC
DD/F
Con
cent
ratio
n(n
g TE
Q/Nm
3 @ 1
1% O
2)
5.95.95.9
3.8 4.1
2.93.4
4.7
PCDD/F Concentration(ng TEQ/Nm
3 @ 11%
O2 )
Clean Gas
REMEDIA D/F filters installedin first of 3 compartments
REMEDIA D/F filters installed in remaining 17 compartments
01 .003 .004 .005 .002 .011 .037 .041 .002 .025 .006 .01 .014 .023 .009 .02 .04 .02 .013 .02
Measurement 1 2 3 4 5 6 7 8 9 10 11 12 13 14 15 16 17 18 19 20
Months in Use .25 1.5 3 4.8 8 13 16 17 18 21 25 26 27 28 29 29.5 30 32 33 35

PCDD/F in Hopper PCDD/F in Hopper DustMeasurement Date Dust Using PAC Date Using REMEDIA D/F
Number [ng ITEQ/kg dust] Filters [ng(ITEQ)/kg dust]
1 January 1, 1998 7490
2 January 15, 1998 2240 January 28, 1999 319
3 January 15, 1998 1247 January 28, 1999 248
Total Average 3659 283
In January 1998, the total amount of particulate entering the
baghouse was 2.5 g/Nm3 (0.1 g/Nm3 fly ash + 0.15 g/Nm3
PAC + 2.25 g/Nm3 Spongiacal) during PAC injection. In
January 1999, 2.1 g/Nm3 (0.25 g/Nm3 fly ash + 1.85 g/Nm3
Spongiacal) of particulate entered the baghouse after
installation of the REMEDIA D/F filters. The particulate
phase PCDD/F emissions from the stack are not included in
this calculation because they are considered negligible due
to the very low particulate emissions (see Part 4 above).
Table 1 shows the measured dioxin concentrations of the dust
released. In January 1998, powdered activated carbon and
lime were injected into the baghouse.
The total dioxin/furan emissions reduction with the
REMEDIA D/F catalytic filter system can be calculated
as follows:
Particulate phase PCDD/F emissions from baghouse
+ Gas phase PCDD/F emissions from stack
Total PCDD/F emissions
Amount of filter dust from baghouse hopper
x PCDD/F concentration in hopper dust
Particulate phase PCDD/F emissions from baghouse
Therefore, the total PCDD/F emissions using:
GORE-TEX membrane filter and PAC (Jan.’98):
0.07 ng/Nm3 + 2.5 g/Nm3
x 3659 ng/kg
9.22 ng(ITEQ)/Nm3
REMEDIA D/F catalytic filter system (Jan.’99):
0.04 ng/Nm3 + 2.1 g/Nm3
x 283 ng/kg
0.63 ng(ITEQ) /Nm3
The total reduction of dioxin/furan emissions into the
environment using the REMEDIA D/F catalytic filter
system exceeds 93% when compared to PAC injection.
At a total flow rate of 60,000 Nm3/h (both lines), the total
amount of dioxin/furans destroyed each year is equal to
about 4 g (ITEQ).
When comparing total release of PCDD/F from the baghouse
into the environment per ton of municipal waste burned:
Using powder activated carbon: 69 µg/ton of
municipal waste
Using the catalytic filter system: 4.7 µg/ton of
municipal waste
DiscussionIt was demonstrated that the REMEDIA D/F catalytic filter
system can destroy dioxins and furans to levels significantly
below the regulatory limits. The expected life of the filter
is in excess of five years according to long duration tests.
Laboratory examinations of the catalysts have shown no
statistically significant decrease in catalyst activity. This data
confirms the findings of many catalyst companies, which
indicate that catalytic honeycomb systems exceed three-year
lifetimes if not exposed to incinerator dust. High particulate
removal with the GORE-TEX membrane was also
demonstrated. In all cases, a clean gas dust concentration
of below 1 mg/Nm3 at 11% O2 was achieved.
Table 1 Comparison of dioxin concentrations in the baghouse hopper dust.

The total amount of PCDD/F released into the environment
was reduced by more than 8 ng(ITEQ)/Nm3 flue gas. When
comparing the raw gas and filter material PCDD/F
concentrations during PAC and catalytic filter use, it is
found that the PCDD/Fs were destroyed and not simply
adsorbed onto the filter material. The demonstrated overall
lower dioxin release into the environment is, therefore,
mostly due to the absence of carbon in the baghouse solid
residue.
ConclusionThe emissions of PCDD/F from the IVRO municipal waste
incinerator in Roeselare, Belgium, are significantly below
0.1 ng(ITEQ)/Nm3 at 11% O2 using the REMEDIA D/F
catalytic filter system. REMEDIA D/F catalytic filters that
were installed three years ago remain active, and still reduce
emissions below 0.1 ng(ITEQ)/Nm3 at 11% O2. Several
reliability measurements have been conducted, all indicating
that the chosen measurement company is capable of reliably
measuring dioxin/furan emissions (within 15%) for
concentrations as low as 0.01 ng(ITEQ)/Nm3 at 11% O2.
Lastly, in over 100 measurements, the clean gas dust
concentrations were below 1 mg/Nm3 (at 11% O2), often
below the detection limit of 0.2 mg/Nm3 (at 11% O2).
The total amount of dust removed from the baghouse
hoppers has decreased since the PAC injection system was
turned off. In addition, the contamination of the fly ash with
dioxins and furans decreased because the dioxins and furans
are destroyed by the REMEDIA D/F catalytic filter system.
In order to verify the performance of the REMEDIA D/F
catalytic filter system, stack tests and an additional 100
PCDD/F measurements within the system have been
conducted. Most importantly, the total PCDD/F emissions
of the plant, including gaseous stack emissions and hopper
dust emissions, were reduced by more than 93% from
levels associated with using PAC. This reduction is due
to a minimization of the amount of additives (PAC) and
subsequent reduction of baghouse dust toxicity.
AcknowledgementThe authors wish to thank Michael Wilken from MWC,
Berlin, Germany, and the measurement company, MPU,
Berlin, Germany, for their support.


PLFPS v8 Dioxin Health Risk Assessment 25/06/02
APPENDICES (2)
Environmental Alliances Report

DISPERSION MODELLING OF DIOXIN EMISSIONS FROM
PROPOSED POULTRY LITTER FIRED POWER STATION AT
MUCHEA
Prepared for
Blair Fox Generation WA Pty Ltd
by
EA EA EA EA Environmental Alliances
December 2001

Disclaimer and Limitation
Environmental Alliances will act in all professional matters as a faithful adviser to the Client and exercise all reasonable skill and care in the provision of its professional services.
This report has been prepared on behalf of and for the exclusive use of the Client, and is subject to and issued in accordance with the agreement between the Client and Environmental Alliances. Environmental Alliances accepts no liability or responsibility whatsoever for it in respect of any use of or reliance upon this report by any third party.
This report is based on the scope of services defined by the Client, budgetary and time constraints requested by the Client, the information supplied by the Client (and its agents), and methods consistent with the preceding.
Environmental Alliances has not attempted to verify the accuracy or completeness of the information supplied.
Copying of this report or parts of this report is not permitted without the authorisation of the Client or Environmental Alliances.
Client: Blair Fox Generation WA Pty Ltd
Job No: J1296 Version Prepared by Reviewed by Submitted to Client Status Copies Date
Draft Report a DP - electronic 30/11/2001 Final Report FINAL DP JP electronic 1/12/2001
Environmental Alliances Tel: (08) 9343 0554 Fax: (08) 9343 0079 ABN: 743 2928 0196

Final Page i
EA_J1296DioxinsModelRptFINALP – 1/12/2001 Environmental Alliances
TABLE OF CONTENTS
1. INTRODUCTION 1
2. METHODOLOGY 1
3. EMISSIONS PARAMETERS 3
3.1 POULTRY LITTER FIRED POWER STATION 3
3.2 TIWEST 4
4. DISPERSION MODEL AND MODELLING ASSUMPTIONS 6
4.1 METEOROLOGICAL DATA 6
4.2 DEPOSITION 6
4.3 LAND USE PARAMETERS 6
4.4 RECEPTORS 7
5. RESULTS 7
6. GLOSSARY 7
7. REFERENCES 7
LIST OF TABLES
1. Poultry litter power generation plant main stack emission parameters 3 2. Dioxins emission data from proposed poultry litter fired power station 4 3. Proposed facility emission concentration 4 4. Tiwest main stack emissions 5 5. Estimated dioxins congener emission concentrations from Tiwest 5 6. Physical properties of particle phase dioxin congeners 6

Final Page ii
EA_J1296DioxinsModelRptFINALP – 1/12/2001 Environmental Alliances
LIST OF FIGURES
1. Annual average vapour phase dioxin concentrations (fg/m3) for 90% baghouse availability 8
2. Annual average airborne particle phase dioxin concentrations (fg/m3) for 90% baghouse availability 9
3. Annual average airborne vapours plus particle phase dioxin concentrations (fg/m3) for 90% baghouse availability 10
4. Annual average dioxin deposition (pg/m2) for 90% baghouse availability 11
LIST OF APPENDICES
1. Dioxin congeners properties

Final Page 1
EA_J1296DioxinsModelRptFINALP – 1/12/2001 Environmental Alliances
1. INTRODUCTION
Blair Fox Generation WA Pty Ltd have engaged Environmental Alliances to model the dispersion of dioxin emissions from a proposed poultry litter fired power station (PLFPS) in Muchea together with those from the nearby Tiwest synthetic rutile production facility.
In the report, “dioxins” refers to the 17 substances listed in Appendix 1.
2. METHODOLOGY
Dioxins may be formed as a combustion by-product. Each dioxin congener has a unique WHO assigned toxicity equivalency factor (TEF). The measurement of dioxins as a whole is expressed in mass units of toxicity equivalents (TEQ).
In the environment, each congener may be present in vapour or particle phases. The relative concentration of each congener in the vapour and particle phases is dependent on the specific properties of the congener (eg molecular weight) and temperature. When dioxins are emitted to the environment from a combustion source, the vapour/particle ratios will typically vary as the emission cools.
For dispersion modelling in this study, the vapour/particle ratios of each congener are based on those at ambient temperature.
Particle phase congeners will be subject to gravitation settling – unlike the gaseous phase constituents. Therefore the dispersion patterns of particles will differ to those of the vapours.
The implication of unique TEFs and vapour/particle ratios for each congener is the dispersion of each congener from each source must be modelled separately if individual congener concentrations/depositions are required for risk assessment.
In estimating environmental risks from dioxins exposure:
• Air-to-plant transfers are based on the vapour phase concentrations for vapour transfers and the particle-phase for depositions;
• Air-to-soil transfers are based on the particle phase depositions; and
• Inhalation exposures are estimated as the sum of vapour and particle phase concentrations.
Therefore, the output from dispersion modelling needs to address, across the receptor grid:
• vapour phase concentrations;
• particle phase concentrations; and
• particle phase deposition.
Modelling the dispersion of each congener individually would be an onerous task. A simpler approach is to make use of the proportionality between mass emission rates and predicted ambient concentrations, in accordance with the following steps:
1. Model annual average vapour phase concentrations from each source using a unitary emission rate and no wet or dry deposition.
2. Model annual average particle phase airborne concentrations (“Step 2a”) and depositions (“Step 2b”) from each source using a unitary emission rate and wet plus dry deposition.

Final Page 2
EA_J1296DioxinsModelRptFINALP – 1/12/2001 Environmental Alliances
The derivation of the congener concentrations/depositions for each aspect of environmental risk can then be calculated as follows.
Congener concentrations for vapour phase air-to-plant transfers
The vapour phase concentration of each congener at each receptor from each source is given by:
C(x,y)vapouri = C(x,y)modelled_vapour x Fi x VPRi Equation 1
where
C(x,y)vapouri is the annual average vapour concentration of congener i at receptor (x,y)
C(x,y)modelled_vapour is the modelled annual average vapour concentration at receptor (x,y) for the unitary emission rate (Modelling step 1)
VPRi is the vapour phase ratio of congener i expressed as a fraction of the total concentration of that congener
Fi is the mass emission fraction of congener i
Congener particle phase depositions for air-to-plant transfers and air-to-soil transfers
The particle phase deposition of each congener at each receptor from each source is given by:
D(x,y)particlesi = D(x,y)modelled_particles x Fi x (1-VPRi) Equation 2
where
D(x,y)particlesi is the annual average particle deposition of congener i at receptor (x,y)
D(x,y)modelled_particles is the modelled annual average particle deposition at receptor (x,y) for the unitary emission rate (Modelling step 2b)
Congener concentrations for inhalation exposures
The airborne concentration of each congener at each receptor from each source is given by:
C(x,y)airbornei = [(C(x,y)modelled_vapour x VPRi) + (C(x,y)modelled_particlesi x (1-VPRi))] x Fi Equation 3
where
C(x,y)airbornei is the annual average airborne concentration of congener i at receptor (x,y)
C(x,y)modelled_particlesi is the modelled annual average particle concentration of congener i at receptor (x,y) (Modelling step 2a)

Final Page 3
EA_J1296DioxinsModelRptFINALP – 1/12/2001 Environmental Alliances
TEQ Concentrations
The TEQ concentration for each receptor from each source for each aspect of environmental risk is given by:
Ni C_TEQ(x,y)j= ΣΣΣΣ (C(x,y)ij x TEFi) Equation 4 i=1
where
C_TEQ(x,y)j is the TEQ concentration at receptor (x,y) for j=vapour or particles deposition or airborne particles
C(x,y)ij is the concentration of congener i at receptor (x,y) for j=vapour (Equation 1) or particles deposition (Equation 2) or airborne particles (Equation 3)
TEFi is the TEF for congener i
Ni is the number of congeners (17)
The total TEQ concentration at each receptor for the vapour, particles deposition or airborne particles mediums is the sum of each C_TEQ(x,y)j from each contributing source (ie the PLFPS proposal and Tiwest).
Dioxin congener properties are also shown in Appendix 1.
3. EMISSIONS PARAMETERS
3.1 POULTRY LITTER FIRED POWER STATION
The emissions parameters for the boiler stack of the proposed PLFPS are shown in Table 1.
Table 1 Poultry litter power generation plant main stack emission parameters
Parameter Value
Stack height above ground (m) 40 Location (AMG mE, mN) 400889, 6510178 Exit volume at exit temperature (dry m3/hour) Exit volume at exit temperature (dry m3/s) Exit volume at 0C (dry Nm3/s)
112,000 31.1 17.9
Exit velocity (m/s) 15 Exit temperature (C) 200 Height of boilerhouse above ground (m) 30 Width of boilerhouse (m) 40
The concentration of dioxin congeners in the emissions from the proposed PLFPS are based on sampling results from a similar facility in the UK and shown in Table 2. These emissions are uncontrolled for dioxins.

Final Page 4
EA_J1296DioxinsModelRptFINALP – 1/12/2001 Environmental Alliances
Table 2 Dioxins emission data from proposed poultry litter fired power station
Congener Uncontrolled Conc (ng/m3)(a)
Uncontrolled Conc (ng/dry Nm3) (b)
Uncontrolled emission rate (ng/s)
2,3,7,8-TCDD 0.01 0.02 0.33 1,2,3,7,8-PeCDD 0.015 0.03 0.49 1,2,3,4,7,8-HxCDD 0.03 0.05 0.98 1,2,3,6,7,8-HxCDD 0.03 0.05 0.98 1,2,3,7,8,9-HxCDD 0.03 0.05 0.98 1,2,3,4,6,7,8-HpCDD 0.1 0.18 3.28 OCDD 0.58 1.06 19.00 2,3,7,8-TCDF 0.07 0.13 2.29 2,3,4,7,8-PeCDF 0.1 0.18 3.28 1,2,3,7,8-PeCDF 0.12 0.22 3.93 1,2,3,4,7,8-HxCDF 0.3 0.55 9.83 1,2,3,6,7,8-HxCDF 0.14 0.26 4.59 2,3,4,6,7,8-HxCDF 0.09 0.16 2.95 1,2,3,7,8,9-HxCDF 0.03 0.05 0.98 1,2,3,4,6,7,8-HpCDF 0.47 0.86 15.40 1,2,3,4,7,8,9-HpCDF 0.05 0.09 1.64 OCDF 0.86 1.57 28.18 Total 0.16 ng TEQ/dry Nm3 0.29 ng TEQ/dry Nm3 5.2 ng TEQ/s (a) As measured based on Eye power plant. Stack conditions were 194C, 6.9% O2, 7% H2O. The concentration of congeners reported at below the detection limit was assumed to 50% of the limit. (b) At 6.9% O2.
The emissions from the proposed PLFPS at Muchea are, however, proposed to be scrubbed for dioxins. The emissions concentrations with various assumptions for baghouse availability are shown in Table 3.
Table 3 Proposed facility emission concentration
Operating conditions Emission concentration (ng TEQ/dry Nm3 at 11% O2)
Raw gas – baghouse off-line 0.208 Assuming 100% baghouse availability(a) 0.021 Assuming 95% annual availability of baghouse(a) 0.030 Assuming 90% annual availability of baghouse(a) (Worst case) 0.040 (a) Baghouse scrubbing efficiency assumed to be 90%.
In this study, it has been assumed that the baghouse scrubbing efficiency will be uniform for each congener and phase.
3.2 TIWEST
The emission parameters for the Tiwest synthetic rutile plant main stack are shown in Table 4.

Final Page 5
EA_J1296DioxinsModelRptFINALP – 1/12/2001 Environmental Alliances
Table 4 Tiwest main stack emissions
Parameter Value
Stack height above ground (m) 58 Location (AMG mE, mN) 401691, 6510589 Dioxins and furans-
concentration (ng TEQ/Nm3) emission rate (ng TEQ/s)
0.034 0.58
Exit volume at-
exit temperature (m3/s) standard conditions (Nm3/s)
22 17
Exit velocity (m/s) 11 Exit temperature (C) 80 Note: All data provided by the Client.
There was no data available on the relative concentrations of the dioxin congeners in the Tiwest emissions. These were therefore estimated from the relative concentrations of dioxin congeners in incinerator emissions published by the US EPA, adjusted to give the total TEQ concentration for Tiwest as advised by the client (ie 0.034 ng TEQ/Nm3). The estimated congener emission concentrations from Tiwest are shown in Table 5.
Table 5 Estimated dioxins congener emission concentrations from Tiwest
Congener Conc (ng/dry Nm3)
2,3,7,8-TCDD 0.002 1,2,3,7,8-PeCDD 0.004 1,2,3,4,7,8-HxCDD 0.005 1,2,3,6,7,8-HxCDD 0.007 1,2,3,7,8,9-HxCDD 0.008 1,2,3,4,6,7,8-HpCDD 0.068 OCDD 0.140 2,3,7,8-TCDF 0.125 2,3,4,7,8-PeCDF 0.013 1,2,3,7,8-PeCDF 0.008 1,2,3,4,7,8-HxCDF 0.019 1,2,3,6,7,8-HxCDF 0.018 2,3,4,6,7,8-HxCDF 0.007 1,2,3,7,8,9-HxCDF 0.012 1,2,3,4,6,7,8-HpCDF 0.024 1,2,3,4,7,8,9-HpCDF 0.010 OCDF 0.046

Final Page 6
EA_J1296DioxinsModelRptFINALP – 1/12/2001 Environmental Alliances
4. DISPERSION MODEL AND MODELLING ASSUMPTIONS
The dispersion of dioxins was modelled using the Californian Puff (CALPUFF) model1 (Scire et al 2000). This model simulates dispersion by transporting and dispersing successive “puffs” of emitted material through a three-dimensional grided “air-space”.
4.1 METEOROLOGICAL DATA
CALPUFF ideally makes use of three dimensional wind and temperature fields. Where, however, the spatial variability of the meteorological fields is not particularly significant (eg uniform terrain and land use such as for this study), meteorological data from a single station can be used. In this mode, CALPUFF assumes a spatially uniform meteorological field, however the essential features of a puff model - such as enabling curve trajectories and variable dispersion and stability conditions over multiple hours of transport, are retained.
The 1994 meteorological data set produced by the DEP for Caversham was used for this study, augmented by hourly rainfall data for Perth supplied by the Bureau of Meteorology.
4.2 DEPOSITION
The dispersion of the congeners in vapour phase was modelled assuming no deposition.
The dispersion of the congeners in particles phase was modelled assuming wet and dry deposition.
The dry deposition of particles is determined using deposition velocities based on a resistance model. The particle characteristics required are size and density. Wet removal of particles is determined using scavenging coefficients and precipitation rates. The physical properties of the dioxin particles relevant to deposition are shown in Table 6.
Table 6 Physical properties of particle phase dioxin congeners
Particle size range (µµµµm)
Percentage composition of
all particles
Average particle size
(µµµµm)
Average particle density
(g/cm3)
Deposition velocity (cm/s)
Wet scavenging coefficient
(1/(sec-mm/hr)
≤ 2 87.5 1 1.4 7.1 x 10⁻³ 0.43 x 10⁻⁴
> 2 to ≤ 10 9.5 6.78 1.4 2.87 x 10⁻¹ 0.46 x 10⁻³
> 10 3.0 20 1.4 2.47 0.66 x 10⁻³
4.3 LAND USE PARAMETERS
Key land form/use assumptions were:
• Flat terrain;
• Roughness length = 0.25 m;
• Irwin/Rural wind speed power law exponents for vertical wind speed profiling; and
1 The Ausplume model was used initially however a bug was found in the wet deposition algorithm. The Victorian
Environment Protection Authority were notified but were unable to supply a patch in time for this work.

Final Page 7
EA_J1296DioxinsModelRptFINALP – 1/12/2001 Environmental Alliances
• Dispersion curves based on ISCST PG coefficients for rural areas.
4.4 RECEPTORS
Receptors were specified across a 20 km x 20 km grid at 1 km intervals.
5. RESULTS
Contours showing:
• annual airborne vapour concentrations;
• annual airborne particle concentrations; and
• annual total dry plus wet depositions,
for the 90% baghouse availability (ie worst case) are shown in Figures 1 to 3 respectively.
These results were used for the subsequent assessment of environmental risks from dioxins.
6. GLOSSARY
Congeners: Individual dioxin and furan compounds distinguished by the number and position of their chlorine atoms. There are potentially 75 PCDD and 135 PCDF congeners. Example - All hexachlorodibenzodioxin congeners have six chlorine atoms.
PCDD: Abbreviation for Polychlorinated Dibenzo Dioxins.
PCDF: Abbreviation for Polychlorinated Dibenzo Furans.
TEQ: Toxicity Equivalents - a rough measure of the toxicity of a mixed group of dioxins and furan congeners, expressed as an equivalent amount of 2,3,7,8-TCDD (The most toxic form of dioxins).
ng: nanogram = 10-9 grams
pg: picogram = 10-12 grams
fg: femtogram = 10-15 grams
7. REFERENCES
Scire, J.S., Strimaitis, D.G. and Yamartino, R.J., 2000, “A User’s Guide for the Calpuff Dispersion Model”, Earth Tech Inc, January 2000.
USEPA, 2000, “Estimating Exposure to Dioxin-Like Compounds - DRAFT”.

Final Page 8
EA_J1296DioxinsModelRptFINALP – 1/12/2001 Environmental Alliances
Figure 1 Annual average vapour phase dioxin concentrations (fg/m3) for 90% baghouse availability
398500 399000 399500 400000 400500 401000 401500 402000 402500 403000
6508500
6509000
6509500
6510000
6510500
6511000
6511500
6512000
6512500

Final Page 9
EA_J1296DioxinsModelRptFINALP – 1/12/2001 Environmental Alliances
Figure 2 Annual average airborne particle phase dioxin concentrations (fg/m3) for 90% baghouse availability
398500 399000 399500 400000 400500 401000 401500 402000 402500 403000
6508500
6509000
6509500
6510000
6510500
6511000
6511500
6512000
6512500

Final Page 10
EA_J1296DioxinsModelRptFINALP – 1/12/2001 Environmental Alliances
Figure 3 Annual average airborne vapours plus particle phase dioxin concentrations (fg/m3) for 90% baghouse availability
398500 399000 399500 400000 400500 401000 401500 402000 402500 403000
6508500
6509000
6509500
6510000
6510500
6511000
6511500
6512000
6512500

Final Page 11
EA_J1296DioxinsModelRptFINALP – 1/12/2001 Environmental Alliances
Figure 4 Annual average dioxin deposition (pg/m2) for 90% baghouse availability
398500 399000 399500 400000 400500 401000 401500 402000 402500 403000
6508500
6509000
6509500
6510000
6510500
6511000
6511500
6512000
6512500

Final Page 12
EA_J1296DioxinsModelRptFINALP – 1/12/2001 Environmental Alliances
Appendix 1 Dioxin congeners properties
Table A1.1 Dioxin congeners and TEFs
Classification Congener # TEF Partitioning – Vapour fraction at 20C
2,3,7,8-TCDD 1 1 0.51 1,2,3,7,8-PeCDD 3 1 0.13 1,2,3,4,7,8-HxCDD 5 0.1 0.03 1,2,3,6,7,8-HxCDD 6 0.1 0.03 1,2,3,7,8,9-HxCDD 7 0.1 0.03 1,2,3,4,6,7,8-HpCDD 9 0.01 0.01
Dioxin Congeners
OCDD 11 0.0001 0.002 2,3,7,8-TCDF 12 0.1 0.53 2,3,4,7,8-PeCDF 14 0.5 0.16 1,2,3,7,8-PeCDF 15 0.05 0.25 1,2,3,4,7,8-HxCDF 17 0.1 0.07 1,2,3,6,7,8-HxCDF 18 0.1 0.07 2,3,4,6,7,8-HxCDF 19 0.1 0.04 1,2,3,7,8,9-HxCDF 20 0.1 0.04 1,2,3,4,6,7,8-HpCDF 22 0.01 0.02 1,2,3,4,7,8,9-HpCDF 23 0.01 0.01
Furan Congeners
OCDF 25 0.0001 0.002
Table A1.2 Nomenclature for dioxin-like compounds
Symbol Definition
Pe Symbol for penta (i.e., five halogen substitution) Hx Symbol for hexa (i.e., six halogen substitution) Hp Symbol for hepta (i.e., seven halogen substitution) O Symbol for octa (i.e., eight halogen substitution) CDD Chlorinated dibenzo-p-dioxins, halogens substituted in any position CDF Chlorinated dibenzofurans, halogens substituted in any position PCB Polychlorinated biphenyls


![Federal No. andRegulations...EPA ' ¯ ¯ EPA) NAAQS. {' "" ¯ is-)-\[] ¯ ¯ [¯ ¯ ¯ ¯ ¯ ¯ ¯ (." +),,• ...](https://static.fdocuments.net/doc/165x107/5ece9c4fad639c66df582bc6/federal-no-andregulations-epa-epa-naaqs-is-.jpg)

