Pleistocene stratigraphy and paleoenvironmental...
22
Ž . Global and Planetary Change 31 2001 1–22 www.elsevier.comrlocatergloplacha Pleistocene stratigraphy and paleoenvironmental variation from Lomonosov Ridge sediments, central Arctic Ocean M. Jakobsson a, ) , R. Løvlie b , E.M. Arnold a , J. Backman a , L. Polyak c , J.-O. Knutsen b , E. Musatov d a Department of Geology and Geochemistry, Stockholm UniÕersity, S-106 91 Stockholm, Sweden b Institute of Solid Earth Physics, Allegt. 41, N-5007, Bergen, Norway ´ c Byrd Polar Research Center, Ohio State UniÕersity, Columbus, OH 43210, USA d VNIIOkeangeologia, 1st Angliysky AÕe., 190121 St. Petersburg, Russian Federation Received 28 December 1999; accepted 23 May 2000 Abstract High resolution seismoacoustic chirp sonar data and piston cores were collected from the Lomonosov Ridge in the central Ž . Arctic Ocean 858 –908N; 1308 –1558E . The chirp sonar data indicate substantial erosion on the ridge crest above 1000 mbsl while data from deeper sites show apparently undisturbed sedimentation. Piston cores from both the eroded ridge crest and the slopes have been analyzed for a variety of properties, permitting inter-core correlation and description of paleoenviron- mental change over time. Based on the evidence of extensive sediment erosion at depths above 1000 mbsl, we infer that the top of the Lomonosov Ridge has been eroded by grounded ice during a prominent glacial event that took place during MIS 6 according to a newly published age model. This event is coeval with a dramatic shift from low amplitude glacial–interglacial variability to high amplitude variability recorded in the sedimentary record. The new age model used in our study is based on nannofossil biostratigraphy and correlation between sedimentary cycles and a low-latitude oxygen isotope record and confirmed by paleomagnetic polarity studies where negative paleomagnetic inclinations are assigned to excursions. Due to the controversy between this age model and age models that assign the negative paleomagnetic inclinations to polarity w Ž . x reversals, we provide a correlation to Lomonosov Ridge core PS2185-6 Spielhagen et al., Geology, 25 1997 783 . According to the latter age models, the Lomonosov Ridge was eroded by ice grounding much earlier, at MIS 16. q 2001 Elsevier Science B.V. All rights reserved. Keywords: Arctic Ocean; grain size; magnetics; seismics; sediment erosion; ice grounding; nannofossils; foraminiferas; stratigraphy ) Corresponding author. Current address: Center for Coastal and Ocean Mapping, University of New Hampshire, 24 Colovos Road, Durham, NH 03824, USA. Tel.: q 1-603-862-3755. Ž . E-mail address: [email protected] M. Jakobsson . 1. Introduction The Arctic Ocean perennial ice cover is primarily comprised of sea ice and smaller amounts of glacial ice. The primary sediment transport mechanism from the surrounding land and shallow shelf areas to the central Arctic Ocean ridges takes place by incorpora- 0921-8181r01r$ - see front matter q 2001 Elsevier Science B.V. All rights reserved. Ž . PII: S0921-8181 01 00110-2
Transcript of Pleistocene stratigraphy and paleoenvironmental...

Ž .Global and Planetary Change 31 2001 1–22www.elsevier.comrlocatergloplacha
Pleistocene stratigraphy and paleoenvironmental variation fromLomonosov Ridge sediments, central Arctic Ocean
M. Jakobsson a,), R. Løvlie b, E.M. Arnold a, J. Backman a, L. Polyak c,J.-O. Knutsen b, E. Musatov d
a Department of Geology and Geochemistry, Stockholm UniÕersity, S-106 91 Stockholm, Swedenb Institute of Solid Earth Physics, Allegt. 41, N-5007, Bergen, Norway´
c Byrd Polar Research Center, Ohio State UniÕersity, Columbus, OH 43210, USAd VNIIOkeangeologia, 1st Angliysky AÕe., 190121 St. Petersburg, Russian Federation
Received 28 December 1999; accepted 23 May 2000
Abstract
High resolution seismoacoustic chirp sonar data and piston cores were collected from the Lomonosov Ridge in the centralŽ .Arctic Ocean 858–908N; 1308–1558E . The chirp sonar data indicate substantial erosion on the ridge crest above 1000 mbsl
while data from deeper sites show apparently undisturbed sedimentation. Piston cores from both the eroded ridge crest andthe slopes have been analyzed for a variety of properties, permitting inter-core correlation and description of paleoenviron-mental change over time. Based on the evidence of extensive sediment erosion at depths above 1000 mbsl, we infer that thetop of the Lomonosov Ridge has been eroded by grounded ice during a prominent glacial event that took place during MIS 6according to a newly published age model. This event is coeval with a dramatic shift from low amplitude glacial–interglacialvariability to high amplitude variability recorded in the sedimentary record. The new age model used in our study is basedon nannofossil biostratigraphy and correlation between sedimentary cycles and a low-latitude oxygen isotope record andconfirmed by paleomagnetic polarity studies where negative paleomagnetic inclinations are assigned to excursions. Due tothe controversy between this age model and age models that assign the negative paleomagnetic inclinations to polarity
w Ž . xreversals, we provide a correlation to Lomonosov Ridge core PS2185-6 Spielhagen et al., Geology, 25 1997 783 .According to the latter age models, the Lomonosov Ridge was eroded by ice grounding much earlier, at MIS 16. q 2001Elsevier Science B.V. All rights reserved.
Keywords: Arctic Ocean; grain size; magnetics; seismics; sediment erosion; ice grounding; nannofossils; foraminiferas; stratigraphy
) Corresponding author. Current address: Center for Coastaland Ocean Mapping, University of New Hampshire, 24 ColovosRoad, Durham, NH 03824, USA. Tel.: q1-603-862-3755.
Ž .E-mail address: [email protected] M. Jakobsson .
1. Introduction
The Arctic Ocean perennial ice cover is primarilycomprised of sea ice and smaller amounts of glacialice. The primary sediment transport mechanism fromthe surrounding land and shallow shelf areas to thecentral Arctic Ocean ridges takes place by incorpora-
0921-8181r01r$ - see front matter q 2001 Elsevier Science B.V. All rights reserved.Ž .PII: S0921-8181 01 00110-2

( )M. Jakobsson et al.rGlobal and Planetary Change 31 2001 1–222
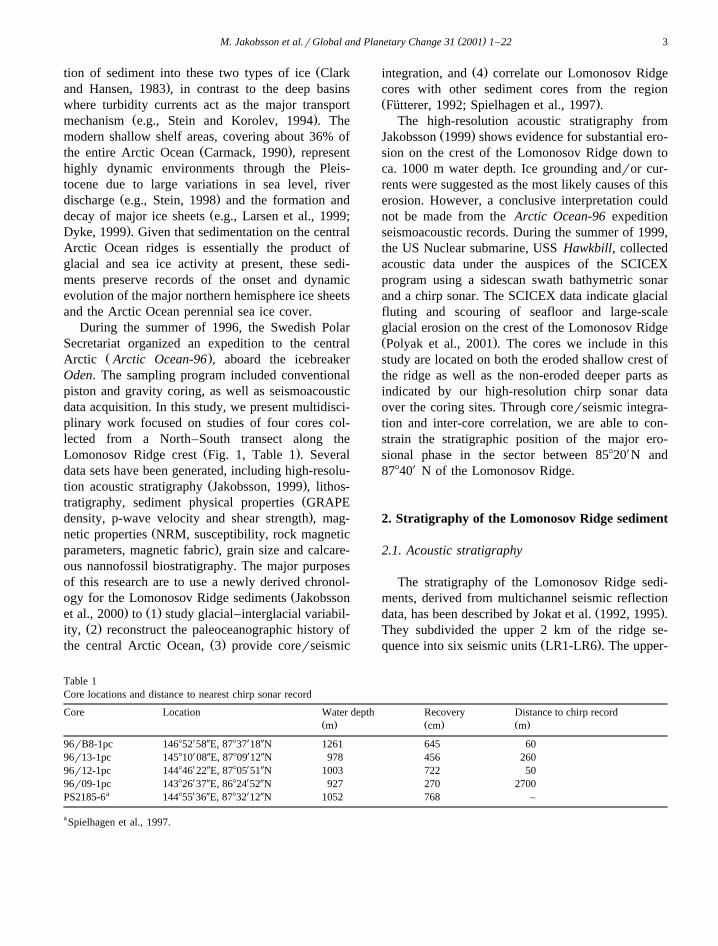
Fig. 1. Location map of the study area on the Lomonosov Ridge crest. The dotted line between A and B indicates the bathymetric profileshown in Fig. 2.
( )M. Jakobsson et al.rGlobal and Planetary Change 31 2001 1–22 3
Žtion of sediment into these two types of ice Clark.and Hansen, 1983 , in contrast to the deep basins
where turbidity currents act as the major transportŽ .mechanism e.g., Stein and Korolev, 1994 . The
modern shallow shelf areas, covering about 36% ofŽ .the entire Arctic Ocean Carmack, 1990 , represent
highly dynamic environments through the Pleis-tocene due to large variations in sea level, river
Ž .discharge e.g., Stein, 1998 and the formation andŽdecay of major ice sheets e.g., Larsen et al., 1999;
.Dyke, 1999 . Given that sedimentation on the centralArctic Ocean ridges is essentially the product ofglacial and sea ice activity at present, these sedi-ments preserve records of the onset and dynamicevolution of the major northern hemisphere ice sheetsand the Arctic Ocean perennial sea ice cover.
During the summer of 1996, the Swedish PolarSecretariat organized an expedition to the central
Ž .Arctic Arctic Ocean-96 , aboard the icebreakerOden. The sampling program included conventionalpiston and gravity coring, as well as seismoacousticdata acquisition. In this study, we present multidisci-plinary work focused on studies of four cores col-lected from a North–South transect along the
Ž .Lomonosov Ridge crest Fig. 1, Table 1 . Severaldata sets have been generated, including high-resolu-
Ž .tion acoustic stratigraphy Jakobsson, 1999 , lithos-Žtratigraphy, sediment physical properties GRAPE.density, p-wave velocity and shear strength , mag-
Žnetic properties NRM, susceptibility, rock magnetic.parameters, magnetic fabric , grain size and calcare-
ous nannofossil biostratigraphy. The major purposesof this research are to use a newly derived chronol-
Žogy for the Lomonosov Ridge sediments Jakobsson. Ž .et al., 2000 to 1 study glacial–interglacial variabil-
Ž .ity, 2 reconstruct the paleoceanographic history ofŽ .the central Arctic Ocean, 3 provide corerseismic
Ž .integration, and 4 correlate our Lomonosov Ridgecores with other sediment cores from the regionŽ .Futterer, 1992; Spielhagen et al., 1997 .¨
The high-resolution acoustic stratigraphy fromŽ .Jakobsson 1999 shows evidence for substantial ero-
sion on the crest of the Lomonosov Ridge down toca. 1000 m water depth. Ice grounding andror cur-rents were suggested as the most likely causes of thiserosion. However, a conclusive interpretation couldnot be made from the Arctic Ocean-96 expeditionseismoacoustic records. During the summer of 1999,the US Nuclear submarine, USS Hawkbill, collectedacoustic data under the auspices of the SCICEXprogram using a sidescan swath bathymetric sonarand a chirp sonar. The SCICEX data indicate glacialfluting and scouring of seafloor and large-scaleglacial erosion on the crest of the Lomonosov RidgeŽ .Polyak et al., 2001 . The cores we include in thisstudy are located on both the eroded shallow crest ofthe ridge as well as the non-eroded deeper parts asindicated by our high-resolution chirp sonar dataover the coring sites. Through corerseismic integra-tion and inter-core correlation, we are able to con-strain the stratigraphic position of the major ero-sional phase in the sector between 85820XN and87840X N of the Lomonosov Ridge.
2. Stratigraphy of the Lomonosov Ridge sediment
2.1. Acoustic stratigraphy
The stratigraphy of the Lomonosov Ridge sedi-ments, derived from multichannel seismic reflection
Ž .data, has been described by Jokat et al. 1992, 1995 .They subdivided the upper 2 km of the ridge se-
Ž .quence into six seismic units LR1-LR6 . The upper-
Table 1Core locations and distance to nearest chirp sonar record
Core Location Water depth Recovery Distance to chirp recordŽ . Ž . Ž .m cm m
X X96rB8-1pc 146852 580E, 87837 180N 1261 645 60X X96r13-1pc 145810 080E, 87809 120N 978 456 260X X96r12-1pc 144846 220E, 87805 510N 1003 722 50X X96r09-1pc 143826 370E, 86824 520N 927 270 2700X XaPS2185-6 144855 360E, 87832 120N 1052 768 –
aSpielhagen et al., 1997.
( )M. Jakobsson et al.rGlobal and Planetary Change 31 2001 1–224
most ca. 500 m of this sequence consists of flat lyingstrata which accumulated after the ridge subsided
Ž .below sea level about 50 Ma Jokat et al., 1995 . Aprominent unconformity below these flat lying sedi-ments was likely formed from sub-aerial and shallowmarine erosion that occurred during ridge subsidence
Ž .below sea level Jokat et al., 1995 .ŽThe sedimentary sequence within Unit LR6 up-
.permost 80–100 m has been studied by high-resolu-Žtion seismic surveying methods Blasco et al., 1979;.Futterer, 1992; Jakobsson, 1999 . The areas of the¨
Lomonosov Ridge where the high-resolution chirpsonar data from the Arctic Ocean-96 expeditionindicate substantial erosion are shown in Fig. 1.Estimates based on these seismoacoustic data sug-gest that more than 50 m of the sediment section ismissing in the shallowest areas of the ridge crest.The erosion was observed only in water depthsshallower than approximately 1000 m; in the deepersurveyed areas, the chirp profiles indicate con-formable, acoustically well-stratified sequences. Theacoustic stratigraphy within Unit LR6 has been sub-divided into five seismoacoustic units bounded by
Žprominent reflectors in the chirp records Jakobsson,. Ž .1999 . The uppermost Unit 5 ;4 ms TWT con-
sists of sediments deposited after a major erosionalphase. The erosional surface occurs as an angularunconformity as well as a disconformity. Unit 5 isthus bounded by the sea-floor and a prominent re-flector, reflector A, which defines the end of themajor erosional event. A semi-transparent to trans-
Ž .parent unit Unit 4 is present in conjunction withsome areas of erosion and was interpreted to consist
Ž .of reworked material Jakobsson, 1999 .
2.2. Sediment stratigraphy
Arctic Ocean sediments have been extensivelystudied, and many investigators have recognizedglacial–interglacial variability in sediment texture,
Žchemistry, color and faunal assemblages e.g.,Phillips and Grantz, 1997; Spielhagen et al., 1997;
.Jones et al., 1999 . A widely applied standard lithos-Ž .tratigraphy was developed by Clark et al. 1980 ,
which has provided a common stratigraphic frame-work for investigators to correlate sediments acrossvast areas of the Arctic Ocean.
While this common stratigraphic framework andcyclical glacialrinterglacial variability is widely rec-ognized in the Arctic Ocean, precise dating of thesediments has largely relied upon magnetic reversalstratigraphy due to the dearth of diagnostic microfos-
Ž .sils Steuerwald et al., 1968; Clark, 1970 . Coresraised from Ice Island T-3 in the Canadian Arcticduring the 1960s yielded polarity stratigraphies that
Ž .were presumed to extend into the Gauss 2.6 MaŽ .and Gilbert 3.57 Ma Chrons, suggesting sedimenta-
Žtion rates on the order of mmrka Steuerwald et al.,.1968; Clark, 1970 . These low sedimentation rates
were challenged by both amino acid epimerizationŽ .studies Sejrup et al., 1984 and paleomagnetic in-
vestigations. The latter attributed negative paleomag-netic inclinations to magnetic excursions rather than
Ž .to polarity reversals Løvlie et al., 1986 . Recentinvestigations of 25 cores from the Fram Strait,Yermak Plateau and the Nansen-Gakkel Ridge con-firmed the presence of magnetic excursions within
Ž . Žthe Brunhes Chron 0–0.78 Ma Nowaczyk and.Baumann, 1992 , implying relatively high sedimenta-
tion rates in these sections of the Arctic Ocean.Nannofossil biostratigraphy from these cores and
Ž .from the Lomonosov Ridge Gard, 1993 suggestedsedimentation rates on the order of cmrka, compara-ble to those in temperate oceans. Based mainly onAMS 14C dating, sedimentation rates in eastern cen-tral Arctic Ocean box cores have been suggested torange between 0.4 and )2cmrka during MIS 1 and
Ž0.4 and 0.9 cmrka during MIS 2 Stein et al.,.1994b .
Here, we will apply a new age model to theLomonosov Ridge sediments which is based on pale-omagnetic stratigraphy and glacialrinterglacial vari-ations in sediment chemistry, color and biostratigra-phy. This age model is derived from detailed studiesof core 96r12-1pc, which exhibits variations inmanganese content and color, mimicking low-lati-
18 Žtude d O glacialrinterglacial cyclicity Jakobsson.et al., 2000 . The combined Mn and color cyclicity
provides stratigraphic information that together withbiostratigraphic data permits the construction of adetailed chronological model. Correlation of the re-sulting age model to established age estimates ofgeomagnetic excursions in the Brunhes Chron re-veals a remarkable fit between the two independentlyderived time scales. Due to the incompatibility of our

( )M. Jakobsson et al.rGlobal and Planetary Change 31 2001 1–22 5
age model and age models that assign negative pale-omagnetic inclinations to polarity reversals, we alsoprovide a stratigraphic correlation to Lomonosov
Ž .Ridge core PS2185-6 Spielhagen et al., 1997 sothat the two age models can be directly compared.
3. Data collection and methods
A detailed description of the methods can befound in the electronic appendix.1 High-resolutionseismoacoustic data were acquired on Oden with anX-Star chirp sonar system used with a SC-512 towfish. Surveying was mainly performed with a 2–4-kHz 100-ms-long chirp pulse, resulting in a sedimentpenetration between about 40 and 90 ms TWT with aresolution of approximately 1 ms TWT in waterdepths ranging between about 600 and 2500 m.
A total of 24 piston cores were raised from theLomonosov Ridge area during the Arctic Ocean-96expedition. The core processing was initiated withmeasurements of GRAPE density, p-wave velocityand magnetic susceptibility at 1-cm intervals using a
Ž .whole core Multi Sensor Track MST at the Bed-ford Institute of Oceanography, Halifax. Sedimentlithology was visually described prior to destruc-tive measurements and sampling. Undrained shearstrength measurements were conducted on the splitcore’s working half with a motorized vane sheardevice and with a hand-held penetrometer for highlyconsolidated intervals. In core 96r09-1pc, a one-di-mensional consolidation test was performed with anodometer using incremented loading steps.
Samples for discrete magnetic measurements wereretrieved by continuous sampling with thin-walled
Ž 3.cubic plastic boxes 6.2 cm . The bottom 3 mof core 96r12-1pc was sampled with two 1.5-m-
Ž .long U-channels 2=2 cm . Paleomagnetic mea-surements of these U-channels were performed inGif-sur-Yvette using a 2G DC SQUID system as
Ž .described by Weeks et al. 1993 . Magnetic suscep-Ž . Ž .tibility MS and Anisotropy of MS AMS were
determined on a KLY-2 induction bridge. Thermo-magnetic curves were obtained by heating dried sam-
1 http:rrwww.elsevier.comrlocatergloplacha, see electronicappendices.
Ž .ples 0.1 to 0.4 g in air to 700 8C in an automaticrecording transversal Curie balance in magnetic fieldsranging from 0.3 to 0.6 T.
The )63 mm size fraction was isolated via wetsieving, and the -63 mm size fraction was analyzedon a Micromeritics Sedigraph 5100.
Smear-slides for calcareous nannofossil countswere made at 5-cm intervals from raw sediment
Žsamples, following standard procedures Haq and.Lohmann, 1976 . Fifty fields of view were examined
between crossed nicols from each of the 161 smear-slides investigated. The smear-slides were investi-gated at 1250= magnification, at a view-field diam-eter of 0.17 mm. The taxonomy follows Gard and
Ž .Backman 1990 . Foraminifers and ostracodes wereexamined in the )150 mm size fraction.
4. Results
4.1. Acoustic stratigraphy and coring sites
We present data from four cores collected from aNorth–South transect along the Lomonosov Ridge
Ž .crest Fig. 1 which were located close to chirp sonarŽ .profiles Fig. 2, Table 1 . The cores were selected
from areas showing significant variations in acousticstratigraphy as revealed by chirp sonar results.
Core 96rB8-1pc is 645 cm long and was raisedfrom the slope towards the Makarov basin at a waterdepth of 1261 m, 13.2 km NNE from core PS2185-6Ž .Futterer, 1992 . The adjacent chirp sonar record¨Ž .960902-49 is of relatively poor quality, but, never-theless, the acoustic stratigraphy indicates sedimentsdraping the ridge slope with no recognizable ero-sional features.
Core 96r13-1pc recovered 456 cm of sedimentsfrom the flat ridge crest at a water depth of 978 m.
Ž .The chirp sonar record 960810-33 near this siteshows abundant hyperbolic reflections, the result ofthe drape of the most recent sediments over anerosional surface which is indicated by an uncon-formity about 3 m below the sea-floor. The acousti-cally semi-transparent to transparent Unit 4, usuallyobserved above the erosional surface, appears to beabsent in this profile. However, this coring site islocated approximately 260 m from the chirp sonartrack and thus we cannot preclude the existence ofthe transparent unit at this site.

( )M. Jakobsson et al.rGlobal and Planetary Change 31 2001 1–226
Fig. 2. Examples of chirp sonar profiles acquired from the Lomonosov Ridge crest during the Arctic Ocean-96 expedition. The locations ofthe profiles are indicated in Fig. 1.
Core 96r12-1pc was raised from a water depth of1003 m on chirp sonar profile 960811-37. High-qual-ity sonar reflections reveal a smooth sea-bottomsurface and an apparently undisturbed acoustic strati-graphy containing no obvious indications of erosion.This core has been selected as a reference for thecorerseismic integration calculations, and was usedfor age model construction.
Ž .Core 96r09-1pc 270 cm was raised from 927 mŽ .water depth and is located in Area 2 Fig. 1 . The
Ž .nearby chirp sonar profile 960806-10 indicates un-conformable sediments below an erosional surface.
4.2. Lithology
Summaries of the major lithologies observed inthe cores are presented in Fig. 3, and detailed strati-graphic descriptions for the individual cores areavailable in the electronic appendix.1
Cores 96rB8-1pc and 96r12-1pc display no ob-vious evidence of major sediment erosion, whilecores 96r13-1pc and 96r09-1pc contain overconsol-
Židated sediments see physical properties section be-.low of unique lithology in the lowermost portions of
the cores. All cores exhibit similar lithostratigraphyin the uppermost units which we briefly summarizehere.
The uppermost unit is brown silty clay whichranges in thickness from 3 to 24 cm; the variation inunit thickness is partially due to incomplete recoveryin the tops of piston cores. Below the dark brownclay, the sediment is composed of yellowish brownto yellowish gray silty clay, with some reddish sand
Ž .layers mm scale in the lower part of the unit. Thisunit ranges from 60 to 111 cm thick. There is quartzand lithic fragment sand-size material in this unit,and it has a sharp contact with the underlying homo-
Žgeneous dark gray silty clay light olive gray in core

()
M.Jakobsson
etal.r
Globaland
Planetary
Change
312001
1–
227
Fig. 3. The lithology, susceptibility, median grain size and )63 mm weight percent for the study cores collected along the bathymetric profiles A–B, indicated in Fig. 1. SeeFig. 13 for the identification of paleomagnetic excursions.

( )M. Jakobsson et al.rGlobal and Planetary Change 31 2001 1–228
.96rB8-1pc with thicknesses from 11 to 66 cm. A1-cm-thick light gray clay unit with sharp upper andlower contacts is observed beneath the dark grayclay in all cores except core 96rB8-1pc. An olive toyellowish-gray silty clay with sharp upper and lowercontacts occurs below the light gray clay, and itranges from 13 to 36 cm in thickness. Below this,the cores are comprised of alternating dark and lightbrown clay units. These alternating units commonlydisplay black speckles, mottles or banding in thedark brown units and occasionally in the lighterunits. Contacts between the dark and light brownclay are usually gradational. These alternating darkand light brown sediments occur throughout the re-mainder of cores 96r12-1pc and 96rB8-1pc. Aunique pink sediment is observed within a lightbrown sediment from 390 to 393 cm and 471 to 488cm in core 96r12-1pc.
In core 96r09-1pc, these alternating units occurdown to 171 cm. An extremely fine grained pinkclay layer occurs at 171–173 cm. There is an abruptchange in the sedimentation at 173 cm which marksthe top of a strongly indurated dark olive gray
Ž .interlaminated few mm unit which extends down to270 cm. This unit has a sharp bottom contact with analternating light and dark gray clay unit at the bot-
Ž .tom of the core 270–274 cm .In core 12r13-1pc, the alternating light and dark
brown units occur down to 259 cm. Below this, thereis a 1-cm-thick light brown sand layer from 259 to260 cm. Beneath the sand, there is an abrupt changein the sediment to a very micaceous yellow brownsilty clay from 260 to 433 cm. At 433 to 437 cm,dark gray clay surrounds a 5-cm shale and calcite
Ž .clast. A thin 437–440 cm light olive brown claywith some reddish mottles grades into the final unitof olive brown silty clay through 456 cm.
4.3. Sediment physical properties and grain size
ŽSeveral pronounced density features labeled b1.to b in Fig. 4 are present in the four GRAPE4
records from all cores. All cores reveal a near steadyincrease in bulk density with depth until between 94
Ž . Ž . Ž .cm 96r09-1pc and 194 cm 96r13-1pc Fig. 4 .Following this increase, an abrupt density decreaseoccurs in all cores, which coincides with the base ofthe dark gray sediment in cores 96r09-1pc, 96r12-
1pc, and 96r13-1pc, and the light olive gray sedi-ment in core 96rB8-1pc. Stratigraphic correlationbased on the prominent density features, b to b ,1 4
results in a consistent lithologic correlation betweenthe cores. A remarkably large change in bulk densityis observed at 170 cm in core 96r09-1pc where thedensity increases from 1.71 to 2.00 grcm3 across a10-cm interval, corresponding to the top of the in-durated interlaminated unit. In core 96r12-1pc, a
Ž17-cm interval with anomalously low density ;1.433.grcm , corresponds to the pink clay layer at 471–Ž .488 cm Fig. 4 .
Ž .The undrained shear strength S generally in-u
creases with depth suggesting normal consolidationbehavior in all cores except for in the lower parts of
Ž .cores 96r13-1pc and 96r09-1pc Fig. 5 . Both thesecores are retrieved from the areas of the LomonosovRidge where erosion is evident from the acousticsurveys and the lithologic changes described above.In core 96r13-1pc, a slight increase in shear strengthcan be seen from 340 cm and downwards. Shearstrength in core 96r09-1pc increases rapidly at 170cm, corresponding to the top of the indurated inter-laminated unit to a maximum of 112 kPa at 260 cm.This value indicates over-consolidation of the sedi-ments below 170 cm. The observed maximum shearstrength of 112 kPa in core 96r09-1pc is equivalentto a sediment burden of approximately 37 m, calcu-lated using a crp ratio of 0.4 and a sediment bulkdensity of 1.8 grcm3. An alternative consolidationtest using an odometer was performed on a singlesample from 216 to 218 cm, applying the one-dimen-
Ž .sional method of Casagrande 1936 . This test re-Ž X.sulted in a pre-consolidation stress P of approxi-c
mately 264 kPa which is equivalent to a depth of 35Žmbsf for normally consolidated sediments density
3.1.8 grcm , which is in excellent agreement with theŽ .crp ratio result 37 m .
The grain size in cores 96r09-1pc, 96r12-1pcŽ .and 96r13-1pc 96rB8-1pc was not analyzed shows
considerable variability in the upper part of the coresŽ .Fig. 3 , and these variations are correlable abovesusceptibility feature a . The oldest correlable grain4
size feature observed in all three cores is a short,high amplitude peak in both median grain size and
Ž .)63 mm content which occurs in a light olivebrown unit centered at 215 cm in core 96r13-1pc,190 cm in core 96r12-1pc, and 145 cm in core

( )M. Jakobsson et al.rGlobal and Planetary Change 31 2001 1–22 9
Fig. 4. GRAPE measurements derived from MST logging of the sediment cores. The GRAPE density is used as an estimate of sedimentbulk density. Dots represent constant volume samples for which density was determined. b –b represent pronounced density peaks used1 4
for correlation.
Ž96r09-1pc. There is a dramatic increase from ;2.5to 15 mm for median size, and from 10 to 35 wt.%
.for )63 mm in the grain size at the base of thedark gray units in all cores; grain size then decreasesslightly toward the top of the gray unit. There isanother increase in grain size at the base of theyellow silty clay unit, followed by a small, gradual,decrease and a final increase near the top of theyellow silty clay unit. The median grain size for theyellow silty clay is ;9 mm, with an average )63mm of ;30 wt.%. The oxidized sediments at thetop of the cores are marked by a final decrease ingrain size. There is no appreciable difference in thegrain size between cores in these correlable sedi-ments.
The grain size is essentially constant below sus-Žceptibility feature a see mineral magnetic proper-4
. Žties below in cores 96r09-1pc indurated layer,. Žmedians2.1 mm and 96r13-1pc micaceous layer,.medians3.0 mm , but shows some high frequency,
generally low amplitude variation in core 96r12-1pcin the alternating dark and light brown clays. The
Žlight brown sediments are slightly coarser medians. Ž2.3 mm than the dark brown clays medians1.8
.mm . The exception to this low amplitude signal isobserved from 225 to 260 cm in core 96r12-1pc,where a sharp peak in the median grain size andpercent of )63 mm occurs; another slightly smallerpeak occurs from 186 to 193 cm. The light pink clayunits in core 96r12-1pc at 390–393 cm and 471–488

( )M. Jakobsson et al.rGlobal and Planetary Change 31 2001 1–2210
Fig. 5. Sediment shear strength measurements carried out on the sediment cores. The lines represent linear regressions of the shear strengthvalues.
cm are comprised of essentially 100% -2 mmmaterial.
4.4. Mineral magnetic properties
Susceptibilities range between 1=10y4 and 10=10y4 SI, with several pronounced features labeleda to a enabling stratigraphic correlation between1 6
Ž .the cores Fig. 3 . Feature a , the lowest correlable4
susceptibility feature in all cores, always occurs in alight brown clay and is located just above the majorsedimentary discontinuities in cores 96r09-1pc and13. While there are specific susceptibility features,which can be used for core correlation, there is, ingeneral, no systematic correspondence between vari-ations of susceptibility and lithologic boundaries.
The S -factor, defined as the ratio IRM r0.3 y0.3T
SIRM is routinely used to monitor variations in
magnetic coercivity which often reflect lithologicalŽ .changes Thompson and Oldfield, 1986 . Low coer-
Ž .civity soft magnetic minerals such as members ofŽ .the titanomagnetite series Fe Ti xO , 0FxF13yx 4
and their low-temperature oxidation products arecharacterized by S-values close to y1, while hexag-onal iron-oxide phases, such as hematite, typicallyhave positive S-values. We have applied a modifiedS-factor defined by the ratio S rS believed to be0.1 0.3
a more sensitive indicator for variations of magneti-cally soft constituents.
The modified S-factor in general varies aroundŽ .0.5 Fig. 6 . In cores 96r09-1pc, 12 and 13 distinct
intervals with higher S-factors correspond to the darkgray, light gray, and olive gray sediment sequence,indicating completely different magnetic mineralo-gies in these intervals. An interval with S-valueslower than 0.5 is observed in core 96r12-1pc in thealternating light and dark brown clay units below

( )M. Jakobsson et al.rGlobal and Planetary Change 31 2001 1–22 11
Fig. 6. S-ratio plotted with depth. The olive gray and dark gray silty clay units are shown with dotted lines for reference. Types 1, 2 and 3refer to three distinct magnetic mineral assemblages derived from hysteresis properties. See electronic appendix for details.
260 cm, corresponding to the shift in grain sizevariability at this level.
Thermomagnetic analyses of 51 samples andmagnetic hysteresis curve properties of 40 samplesfrom core 96r13-1pc have been carried out and theresults are available in the electronic appendix.1 Thehysteresis results generally show mineral magneticproperties that indicate the presence of magnetite-re-lated minerals, in agreement with the results reportedfrom the detailed investigation of PS2185-6Ž .Frederichs, 1995 .
4.5. Magnetic fabric
Ž .Anisotropy of magnetic susceptibility AMS wasdetermined on all samples from the cores. Mineralmagnetic constituents are dominated by titanomag-netitermaghemite assemblages justifying the inter-
Žpretation of AMS in terms of depositional fabric see.electronic appendix . Magnetic fabric, derived from
the lengths and directions of the principal suscepti-Ž .bility axes k , k , k , is characterized byMAX INT MIN
Ž .foliation dominated ellipsoids oblate generally as-Ž .sociated with sub-vertical minimum-axes k andMIN
Ž .sub-horizontal maximum axes k indicative of aMAXŽprimary depositional fabric Tarling and Hrouda,
.1993 . Departures from this pattern occur in severalmore or less well-defined intervals in the upper ca. 2
Ž .m in all cores Fig. 7 . The stratigraphic consistencyof these intervals between the cores indicates that
Ž .these features are primary pre-coring features re-flecting some regional process modifying the pri-mary depositional fabric. The Holocene brown clayat the top of some cores and the sandy layers ob-served in the lower part of the yellowish brownclayey silt occur in the same intervals as thesedeviations in k and k .MIN MAX
Core A96r12-1pc exhibits shallow inclinations ink between 350 and 400 cm either reflectingMIN
Ž .natural conditions Ellwood, 1984 or disturbancesimposed during coring, transportation or storage ofthe cores. However, this interval with anomalouslyshallow k inclinations is also reflected by aMIN
distinct pattern in the anisotropy factor suggesting

( )M. Jakobsson et al.rGlobal and Planetary Change 31 2001 1–2212
Ž .Fig. 7. Stratigraphic variations of anisotropy P2 and inclinations of the k principal susceptibility axis of the susceptibility ellipsoid forMIN
the study cores.
the action of sedimentary processes. The anisotropyŽ .factor P2sk rk varies between 0.8% andMAX MIN
5%, which is in the range expected for a primarydepositional fabric.
Core 96r09-1pc is characterized by several shortzones with anomalously shallow k inclinationsMINŽ .Fig. 7 . Abrupt changes in susceptibility have beenrelated to depositional hiatuses, but discontinuities insusceptibility do not appear to be generally related toAMS properties, nor does susceptibility, in general,appear to be associated with major lithology changes.At 180 cm depth, there is a distinct change in both
Ž .k and k inclinations and anisotropy P2 .MIN MAX
This corresponds to the top of the indurated unit,which is associated with a 10 times increase in shearstrength as well as disconformities in the seismicrecords. The significant increase in k inclina-MAX
Ž .tions suggests either tilted beds 158 , deposition oninclined surfaces or some sort of shear deformation.We observed cross-laminated and truncated laminae
in the dark olive gray indurated sediment, likely theproduct of current activity.
4.6. Nannofossil biostratigraphy of core 96r12-1pcand 96r12-1twc
The content of calcareous nannofossils was inves-tigated at 5 cm sample intervals from the piston coreand associated trigger weight core at site 96r12.Previous nannofossil work in the Eurasian part of theArctic Ocean is summarized in Gard and BackmanŽ . Ž .1990 . Baumann 1990 provided data from the
Ž .Nansen Basin and Gakkel Ridge, and Gard 1993provided data collected along two transects betweenthe Eurasian shelf and the Lomonosov Ridge, includ-ing core PS2185-6, which was retrieved less than 50km from core 96r12-1pc on the Lomonosov RidgeŽ .Fig. 1 .
Two taxonomic categories, Gephyrocapsa spp.and Emiliania huxleyi, are plotted in Fig. 8. Only the

( )M. Jakobsson et al.rGlobal and Planetary Change 31 2001 1–22 13
Fig. 8. Nannofossil census data from core 96r12-1pc and 96r12-1twc. Only the upper 300 cm of the 722 cm long core 96r12-1pcare shown because these taxa were not observed below 285 cm.
upper 300 cm of the 722 cm long core 96r12-1pcare shown because nannofossils were not observedbelow 285 cm. The 180–222.5-cm interval is domi-nated by gephyrocapsids, whereas the rare occur-rences in two samples from 274.5 and 280 cmcontain a mixture of G. muellerae and the smallspecies G. aperta. A specimen of Coccolithus pelag-icus was observed at 201 cm. The G. muelleraemorphotype was observed at 258 cm.
The interpretation of the results from core 96r12-1pc relies on the fact that E. huxleyi evolved during
Ž .oxygen isotope stage 8 Thierstein et al., 1977 andon the idealized Nordic Seas sequence of Gard and
Ž .Backman 1990, Fig. 8 . The co-occurrence of E.huxleyi and G. muellerae in the trigger weight coreand their co-occurrence with C. pelagicus at 201 cm
Ž .imply that 1 the nannofossils in the trigger weightŽcore represents the Holocene oxygen isotope stage
. Ž .1 and 2 , the abundance peak centered on 195 cmrepresents oxygen isotope stage 5.1 and the peak
centered on 220.5 cm represents stage 5.5. It is notknown if the small peak centered on 180 cm repre-sents reworking or indigenous occurrences. The smallpeak centered on 274.5 cm probably represents anindigenous occurrence, as there is no source materialavailable down-core for reworking. Based on thespecies composition, these two samples belong to the
Ž .Pleistocene. The age model of Jakobsson et al. 2000indicates that the nannofossils at 274.5–280 origi-nated during interglacial stage 7.5.
Ž .Gard 1993 observed Atraces of Quaternary nan-nofossilsB at 186, 233 and 309 cm in core PS2185-6,correlated to depths of approximately 200, 222 and260 cm in core 96r12-1pc. Finally, reworking ofrare Cretaceous species such as Watznaueria barne-sae occurs sporadically throughout the core.
4.7. Foraminiferal stratigraphy of core 96r12-1pcand 96r12-1twc
Ž .Calcareous foraminifers benthic and planktonicand ostracodes occur almost exclusively in four in-
Ž . Žtervals: 0–30 cm twc , 165–185, 194–230 three. Ž . Ž .spikes , and 257–286 two spikes Fig. 9 . One
Žsample outside these intervals, at 134 cm core.break , yields some planktonic foraminifers. Arena-
ceous benthic foraminifers occur in 206–227 cm andbelow 251 cm, to the base of the core. Generally, theforaminiferal species composition is common for the
Ž .Arctic Ocean e.g., Lagoe, 1977 . Plankton is repre-sented by Neogloboquadrina pachyderma, withoverwhelmingly prevalent left-coiling forms. Benthiccalcareous foraminifers are dominated by high per-
Ž .centages of Cassidulina teretis up to 92% , themost abundant species at water depths between 600
Žand 1200 m throughout the Arctic Ocean e.g.,.Polyak, 1990 .
The presence of only arenaceous foraminifers be-low 287 cm in 96r12-1pc likely indicates carbonatedissolution due to corrosive waters andror lower
Žsedimentation rates cf. O’Neill, 1981; Ishman et al.,.1996 . The spiky distribution of both calcareous and
arenaceous forms within the upper 287 cm presum-ably reflects abrupt productivity changes in the Arc-tic Ocean. This interpretation is consistent with theoccurrence of faunal spikes only in dark brown unitscorresponding to interglacial periods. Superimposed

( )M. Jakobsson et al.rGlobal and Planetary Change 31 2001 1–2214
Ž .Fig. 9. Down core distribution of foraminifers and ostracodes in 96r12-1 size fraction )150 mm . Lines show absolute numbers per gramŽ . Ž .of dry sediment scale on top , bars show percentages of major benthic calcareous foraminifers scale at the bottom . Note that scales vary
between species. Vertical bars on the right show the occurrence range of selected accessory species.
on foraminiferal abundance spikes, the down-coredistribution of benthic foraminiferal species shows a
Ž .distinct stratigraphic zonation Fig. 9 . The most
Ž .apparent changes in species composition include: 1the presence of Cibicidoides wuellerstorfi at severalintervals below 165 cm, with maximum percentages
Ž .Fig. 10. A Calculated impedance log versus two-way travel time in milliseconds for core 96r12-1pc. The hatched areas indicate intervalsin the core where constant values were assigned, by assigning the value directly above the interval in the p-wave log, as well as in the
Ž . Ž .GRAPE log, before calculating the impedance log. B The reflectivity function for core 96r12-1pc sub-sampled at 8 kHz. C The waveletcorresponding to the chirp sonar pulse, 2–4 kHz, calculated by the minimum four-term Blackman–Harris window as described by Schock et
Ž . Ž .al. 1989 . D Synthetic seismogram for core 96r12-1pc resulting from convolution between the wavelet corresponding to chirp pulse 2–4Ž . Ž .kHz in C and the reflectivity function in B .

( )M. Jakobsson et al.rGlobal and Planetary Change 31 2001 1–22 15
Ž .at 207 and 282 cm, 2 a consistent occurrence ofOridorsalis tener above 195 cm, reaching 35% at
Ž .165 cm, and 3 occurrence of Bulimina aculeata atŽ .165 and 200 cm up to 41% at 172 cm and in one
sample at 282 cm. Some accessory species, notcommon for the modern Arctic Ocean, occur in96r12-1pc at some levels: Nuttalides umboniferus at165–178 cm, Epistominella exigua at 220 and 275–282 cm, and Pullenia spp. at the latter interval.
(4.8. Corerseismic integration synthetic seismo-)grams
Acoustic stratigraphy based on chirp sonar resultsrevealed compelling evidence of erosional activity
Žover the Lomonosov Ridge crest rise Jakobsson,.1999 . The termination of the erosional phase is
Ž .indicated by reflector A at approximately 4 ms TWTsub-bottom, which is within the range of pistoncoring. A synthetic seismogram has been computedfor core 96r12-1pc in order to determine the rela-
Žtionships between acoustic reflector A identified inprofile 960811-37 crossing this coring site, Figs. 1
.and 2 and the physical properties of the sediments
Ž .Fig. 10A . For a description of the synthetic model-ing procedure see the electronic appendix.1
In some parts of core 96r12-1pc, the p-wavevelocity measurements did not yield reliable values.In order to minimize the effect of these intervals onthe calculated impulse response and thus on thesynthetic seismogram, constant values were assignedby using the p-wave log value directly above theinterval. The calculated impedance log is shownversus two-way travel time in Fig. 10A. The reflec-tivity function was calculated using this impedancelog, and is shown sub-sampled at 8 kHz in Fig. 10B.A simulated reflection for the waterrsediment inter-face was achieved by assigning a bottom watervelocity of 1450 mrs and a density of 1.028 grcm3
ŽCTD measurements carried out from Oden; P-I.Sehlstedt, pers. comm. . The computed synthetic
seismogram resulting from convolution between thecompressed wavelet corresponding to the chirp pulse
Ž .2–4 kHz Fig. 10C and the reflectivity function forcore 96r12-1pc reveals three large reflectors at 2.5,
Ž . Ž5.3 and 8.7 ms Fig. 10D . The first reflector 2.5.ms is due to the impedance contrast from the simu-
lated waterrsediment interface. The second reflector
Ž . Ž . Ž . Ž .Fig. 11. A Chirp sonar record at site 96r12. B Chirp envelope between 1360 and 1374 ms TWT . C Synthetic envelope for core96r12-1pc. A correlation is suggested between the uppermost chirp sonar acoustic reflector A and the first synthetic reflector below the
Ž .simulated sedimentrwater interface synthetic reflector A .

( )M. Jakobsson et al.rGlobal and Planetary Change 31 2001 1–2216
Ž .5.3 ms , is located 2.8 ms below the waterrsedi-Ž .ment interface 5.3–2.5 ms and may arise from
constructive interference composites caused by sev-eral smaller impedance contrasts associated with thetop of the olive gray clay and the upper part of thedarkrlight brown sediments in a manner such as
Ž .demonstrated by Mayer 1979 . The peak relativeamplitude of the third reflector occurs at a depth of
Ž6.2 ms below the waterrsediment interface 8.7–2.5.ms , the deepest significant reflector in the computed
synthetic seismogram for core 96r12-1pc, which islikely associated with the large density decreaseassociated with the pink sediment layer at this depth.
The uppermost prominent acoustic reflector A,occurring at approximately 4 ms sub-bottom depth inchirp sonar profile 960811-37 at site 96r12-1pc,correlates with the first synthetic reflector at 2.8 msbelow the simulated reflection for the waterrsedi-
Ž .ment interface in core 96r12-1pc Fig. 11 . Thediscrepancy between the sub-bottom depths betweenthe synthetic reflector and reflector A may be due toloss of the uppermost 30 cm of sediments in core96r12-1pc during core retrieval and sediment com-pression during coring.
5. Discussion and conclusions
The cores from the Lomonosov Ridge fall intoŽ .two categories: 1 Cores collected below 1000 mbsl
from regions which show conformable and continu-ous seismoacoustic stratigraphy as well as undis-turbed continuous sediments in the recovered core
Ž .material. 2 Cores collected from above 1000 mbslfrom areas which show unconformities in the seis-moacoustic stratigraphy, which can be related toabrupt changes in sediment lithology and physicalproperties in the sediment cores.
The investigated area of the Lomonosov Ridge islocated far away from the continents, and the coreswere collected from relatively shallow depths. There-fore, the dominant terrigenous sediment input ought
Ž .to be from ice rafting sea ice or icebergs . In thisenvironment turbidity currents are not an activetransport mechanism, and we observe no signs ofmass wasting on the shallow ridge crest in the chirp
Ž .sonar records Jakobsson, 1999 . Therefore, removal
or non-deposition of the sediments is most likelyfrom currents or ice grounding.
We observe generally continuous glacial–inter-glacial sedimentation in cores 96r12-1pc and 96rB8-1pc. This glacial–interglacial sedimentation ismanifested as alternating dark and light brown clayunits, which are continuous below about 1 m in core96rB8-1pc and 1.8 m in core 96r12-1pc. The darkbrown clays are characterized by high concentrationsof manganese and common bioturbation, both indica-tive of well-oxygenated water, and fine particle size,indicative of reduced glacial input. The light brownclays are characterized by lower manganese concen-tration with little or no bioturbation, indicative oflow oxygen concentration and coarser particle size,representing enhanced glacial ice sediment transportŽ . Ž .Fig. 12 . Below 260 cm core 96r12-1pc , weinterpret these light dark alternations as AdistalBglacial–interglacial sedimentation, meaning that thesite received some ice rafted material, but the amountof )63 mm material is only approximately 10wt.%, and the differences between glacial and inter-glacial coarse material are small. Above 260 cm, thecontrast in grain size between glacial and interglacialsediments is significantly enhanced. This change oc-curs soon after a transition from arenaceous to mostlycalcareous foraminiferal fauna at 287 cm. Addition-ally, indigenous nannofossils are observed in all the
Ž .dark brown units above this depth Fig. 12 .The sediment color and manganese variations were
used to construct an age model via correlation with aŽlow latitude oxygen isotope record Jakobsson et al.,
.2000 ; this age model is internally consistent withŽ .both the nannofossil biostratigraphy Fig. 8 and
paleomagnetic excursions determined from core 96rŽ .12-1pc Fig. 13 . Oxygen isotope stages 1 through
Ž .21 are all inferred in core 96r12-1pc Fig. 13 .Ž .The age model of Jakobsson et al. 2000 is
inconsistent with several previously published agemodels derived for sediments from the central ArcticOcean, and we recognize that our stratigraphy can beprecisely correlated to cores with alternative agemodels. If we interpret the excursion we identified asBiwa 2 in core 96r12-1pc as the BruhnesrMatuyamaboundary, our stratigraphy, susceptibility, and grainsize records are easily correlated with Frederichs’Ž . Ž .1995 , and Spielhagen’ et al. 1997 results fromLomonosov Ridge cores PS2185-6 and PS2185-3

( )M. Jakobsson et al.rGlobal and Planetary Change 31 2001 1–22 17
Fig. 12. Summary of major environmental changes for sediments from the Lomonosov Ridge based on core 96r12-1pc and 96r12-1twc.Ž .Land-based chronostratigraphic boundaries as defined by Larsen et al. 1999 . In the intervals where unambiguous correlation to core
Ž . Ž .PS2185-6 could be established Fig. 13 , the chronology suggested by Spielhagen et al. 1997 is shown.
Ž .Fig. 13 . In addition, the patterns of microfaunaldistribution allow correlation between 96r12-1pc andcore PS2185-6. The levels of planktonic foraminiferalspikes are almost identical in both cores; the onlysignificant difference is an additional spike at ca.
Ž .20–30 cm in PS2185-6 Spielhagen et al., 1997 .The close correlation between the two cores is fur-ther supported by means of arenaceous foraminifersŽ . ŽEvans and Kaminski, 1998 and ostracodes Jones et
.al., 1999 . Moreover, the patterns of foraminiferaldistribution provide a preliminary correlation of
96r12-1pc with distant Arctic Ocean sites such asthe Mendeleev, Northwind, and Alpha ridgesŽO’Neill, 1981; Polyak, 1986; Scott et al., 1989;
.Poore et al., 1994; Ishman et al., 1996 . A distinctmicrofaunal stratigraphic marker for this correlationis the boundary between almost entirely arenaceousto mostly calcareous assemblages that occurs in96r12-1pc at 287 cm. The validity of this strati-graphic marker is confirmed by a benthic foram-iniferal zonation, which is especially similar between96r12-1pc and cores raised from similar water depths

( )M. Jakobsson et al.rGlobal and Planetary Change 31 2001 1–2218
Ž .Fig. 13. Correlation between core PS2185-6 Spielhagen et al., 1997 and 96r12-1pc.
Žat the Mendeleev and Northwind ridges Polyak,.1986; Poore et al., 1994; Ishman et al., 1996 .
In contrast to the uniform glacialrinterglacial sed-imentation described above, cores 96r09-1pc and96r13-1pc show clear evidence for sediment ero-sion; the bottom portions of the cores contain darkolive-gray indurated sediments and micaceous yel-low brown silty clay, respectively. The age of thesesediments is unknown. Consolidation studies indicateeither that approximately 33 m of sediment wasstripped from above the indurated unit in core96r09-1pc, or that the sediments were compacted byan external load. The median grain size is quite
Ž .constant 2.1"0.5 in this unit, and it displays mmscale color variations which are convoluted, and insome cases truncated by other colored intervals.There is no evidence of glacialrinterglacial cyclicalvariability.
The lower part of the micaceous unit in core96r13-1pc is slightly overconsolidated, but detailed
consolidation tests were not run. The unit is basicallystructureless, but black banding is observed in some
Žintervals. The median grain size is constant 3.0"0.3.mm , and there is no evidence of cyclical variability.
The coarse grain size and a 1-cm-diameter dropstoneat 373 cm suggest that this unit received iceberg-rafted detritus and was formed during glacial condi-tions. The concentration of clay size material in thisunit is low compared with both the indurated unit incore 96r09-1pc, and the alternating dark and lightbrown layers in cores 96r12-1pc and 96rB8-1pc,suggesting that the micaceous sediment is associatedwith current winnowing. Additional support for win-nowing is taken from the AMS studies, which indi-cate an increase in the anisotropy factor P2, and a
Ždecrease in k in the lower part of this unit Fig.MIN.7 . The lack of cyclical variation could indicate
deposition sometime prior to MIS stage 21, as thisunit is not observed in cores 96rB8-1pc and 96r12-1pc. However, the micaceous sediment corresponds

( )M. Jakobsson et al.rGlobal and Planetary Change 31 2001 1–22 19
to the transparent seismoacoustic Unit 4 observed inmost of the eroded regions. Thus, an alternativeexplanation is that this unit might represent reworkedsediment related to the large-scale erosional activi-ties at the top of the Lomonosov Ridge crest.
ŽThe lithology, physical properties, grain size Fig.. Ž .3 , and the seismoacoustic stratigraphy Fig. 2 , illus-
trate that the sediments above the indurated andmicaceous units are conformable and correlable withthe continuous sedimentary records in cores 96rB8-1pc and 96r12-1pc. The corerseismic integrationshows that reflector A, representing the base ofseismoacoustic Unit 5, results from impedance con-trasts from density features b –b . The sediments1 4
which contain susceptibility feature a are light4
brown clay in all cores and formed during the laterpart of MIS 6. Thus, the major erosional event endedin stage 6, although we cannot rule out current
Ž .winnowing or short less than one MIS breaks insedimentation in any core. In addition to the abilityto correlate lithologies, the grain size variabilitychanges character above this interval. The first AlargeamplitudeB grain size peak occurs in core 96r12-1pcduring MIS 6; this peak is missing in cores 96r09-1pc and 96r13-1pc due to the erosion. The nextAlarge amplitudeB peak occurs during stage 5.1, andis observed in all cores. The glacial stages 4 and 2are also observed as large grain size increases in allcores. This suggests that the severity of glaciationincreased andror the transport of ice over these siteswas more common starting in stage 6 and the sitetransited from a Adistal glacialB sedimentary regime,to a Aproximal glacialB sedimentary regime. Spielha-
Ž .gen et al. 1997 found smectite-rich sediments asso-ciated with increased amounts of coarse material incore PS2185-6, which is easily correlated with core96r12-1pc. The main source for smectites in thecentral Arctic Ocean are the shelves of the Kara and
Žwestern Laptev seas Washner et al., 1999; Stein et. Ž .al., 1994a , and Spielhagen et al. 1997 interpreted
this coarse layer as an indication of substantial ice-berg activity from northern Siberia. Thus, this majorshift in amplitude of glacialrinterglacial activity inthe central Arctic Ocean was likely associated withenhanced glacial activity in northern Siberia. Thelithologies of the sediment column above thisglacialrinterglacial amplitude shift display increasedvariability as well.
All cores contain alternating dark and light brownunits from at least a to the base of an olive gray4
silty clay, representing glacial and interglacial sedi-mentation, respectively. The olive gray unit, formedin the latest part of stage 5, is observed in all cores,but the color of this unit in core 96rB8-1pc is quitelight and less distinct, although the density decrease
Ž .associated with this unit is clearly visible Fig. 4 . Inaddition to the anomalously low density found in thisunit, the grain size is slightly higher than the light–
Ž .dark brown clays median ;10 mm and it isassociated with susceptibility feature a . In all cores2
except core 96rB8-1pc, there is a distinctive 1-cm-thick light gray clay that forms the sharp uppercontact of the olive layer. Above this, a dark graysedimentary unit, formed during stage 4 and early
Žstage 3, is characterized by coarse grain size median.grain sizes15 mm , anomalous magnetic mineral
assemblages and sharp upper and lower contacts.Again, in core 96rB8-1pc, the unit is not wellpronounced and only occurs as a light olive graylayer which does not display much variability inmagnetic mineralogy magnetic mineralogy. Core96rB8-1pc was collected on the Amerasian side ofthe Lomonosov Ridge, and other investigators havenoted the absence of the dark gray silty clay on theAmerasian side of the ridge as well as in sediments
Ž .from the Makorov basin Morris et al., 1985 . Al-though we are able to identify a correlable sedimen-tary interval, the areally restricted distribution of thisunit indicates that the Lomonosov Ridge acts as abarrier to some sedimentary source area or transportsystem. The yellow brown silty clay, formed duringstages 2 and 3, is found in all cores and showsevidence of current winnowing from sandy layers in
Ž .the bottom portion stage 3 of the unit, has rela-Ž . Žtively coarse medianf9 mm grain size although
this is also a function of the increased ice rafting tothe site as indicated by the increase in grain size
.during stage 2 and the AMS parameters indicatecurrent related sedimentation.
Magnetic fabric based on AMS has been used toinfer the strength and direction of bottom-currents in
Ždeep-sea regimes Ellwood and Ledbetter, 1979;.Auffret et al., 1981 . The core sections studied here
have unknown azimuthal orientation and, hence, nodirect information about current azimuths acting dur-ing deposition can be retrieved. However, variation

( )M. Jakobsson et al.rGlobal and Planetary Change 31 2001 1–2220
in k inclination is likely to be related to varia-MAX
tions in current regimes. We have only presentedinclinations of the k axis, but since both axes areMIN
orthogonal, the latter varies in accord with k .MAXŽ .The anomalously shallow k -608 directionsMIN
occurring within several corresponding stratigraphicintervals in the cores cannot be attributed to normal
Ž .water flow conditions Fig. 7 , and are generallyassociated with interglacial sediments in the cores.Anomalous k directions are associated with lowerMIN
Ž .anisotropy factors P2 , which indicate the degree ofstatistical alignment of grains. The apparent relation-ship between the amplitude of inclination variationand degree of grain alignment indicates that otherprocesses have dominated over gravity. Hence, wepropose that the process may be current activityduring interglacial periods.
The areas of the Lomonosov Ridge crest wherewe had observed evidence for substantial erosion
Žduring the Arctic Ocean-96 expedition Jakobsson,.1999 were subjected to a detailed survey using a
Sidescan Swath Bathymetric Sonar during the sub-marine SCICEX expedition in 1999. The analyses ofthis data unambiguously indicate that this section ofthe ridge crest has been molded and scoured by agrounded ice sheet down to a modern water depth of
Ž .1 km Polyak et al., 2001 .The extent and thickness of Pleistocene Arctic
Žglacial ice is still the subject of much debate e.g.,.Karlen et al., 1998; Thiede and Bauch, 1999 . A´
single dynamic ice system consisting of terrestrialand marine grounded ice sheets and floating ice
Žshelves has been discussed by several authors e.g.,Hughes et al., 1977; Grosswald, 1980; Denton and
.Hughes, 1981 . A common, essential element inthese hypotheses is the presence of a thick ice shelfin the central Arctic Ocean.
Observations suggesting ice grounding at substan-tial water depths include results from ODP Site 910
Žat the Yermak Plateau at 556 mbsl Myhre et al.,.1995 ; this glacial event is thought to have occurred
Ž .prior to 660 ka Flower, 1997 . Relict plowmarkscarved by the keels of huge icebergs are reported
Ždown to ca. 850 mbsl on the Yermak Plateau Vogt.et al., 1994 , whereas, late Weichselian ice ground-
ing at 630 mbsl has been reported from the St. AnnaŽ .Trough on the Kara Sea margin Polyak et al., 1997 .
Our core studies indicate that the ice grounding at
the Lomonosov Ridge crest took place during thelater part of MIS 6, but according to an alternative
Ž .age model Spielhagen et al., 1997 , this event oc-curred much earlier, at MIS 16.
In summary, sediment cores and seismoacousticdata show that sedimentation comprised continuouscyclic variations between glacial and interglacialconditions. Well-oxygenated water, some current ac-tivity and some ice rafting prevailed during inter-glacials. Less well-oxygenated water, ice rafting of
Ž .coarse sediments and reduced or non-detectablecurrent activity characterized glacials. The amplitudeof the glacial–interglacial variability ramped up by
Žthe beginning of MIS 6 Jakobsson et al., 2000 age.model , indicating a major reorganization in glacial
activity and corresponding paleoceanographic condi-tions in the Arctic Ocean, and sediments in theshallowest parts of the ridge were removed during astrong erosional event during this glacial stage. In
Žcombination with SCICEX-99 findings Polyak et.al., 2001 , our data indicate that this erosion was
caused by ice grounding at 1 km present water depth.It appears that the increased glacial activity wasassociated with ice sheets formed in northern Eura-sia.
Acknowledgements
The Arctic Ocean-96 expedition was organizedand executed by the Swedish Polar Secretariat. Thegenerous support of the crew of the icebreaker Odenduring numerous chilly moments on the aft deck ismuch appreciated. The help provided by YngveKristoffersen and Arne Lif during coring and chirpsonar operations is gratefully acknowledged. JimBroda provided valuable advice during the construc-tion of the piston corer. Jan Kristiansson providedthe odometer test data. We are grateful to C. Kisselfor assisting in the U-channel analysis and hysteresismeasurements in the paleomagnetic laboratory, Gif-sur-Yvette. MST data were collected at AGCrBIO,Canada, and we acknowledge the help provided byKate Moran, Matthew and Andrew Barret. Discus-sions with Larry Mayer on chirp sonar theory areappreciated. Marianne Ahlbom, Heather Renyck andKristin Karsh performed the grain size analyses. Thisproject was financed by the Swedish Natural ScienceResearch Council, Stockholm University and the

( )M. Jakobsson et al.rGlobal and Planetary Change 31 2001 1–22 21
ŽNorwegian Research Council mineral magnetic pa-.rameters . The contribution by Leonid Polyak was
supported by NSF grant OPP-9817054. Reviews byRuediger Stein and Peter Vogt significantly im-proved the manuscript.
References
Auffret, G.A., Sichler, B., Coleno, B., 1981. Deep-sea sediments´texture and magnetic fabric, indicators of bottom currentsregime. Oceanol. Acta 4, 475–488.
Baumann, M., 1990. Coccoliths in sediments of the eastern ArcticŽ .Basin. In: Bleil, U., Thiede, J. Eds. , Geological History of
the Polar Oceans: Arctic versus Antarctic. NATO ASI Ser. C,vol. 308, pp. 437–445.
Blasco, S.M., Borhold, B.D., Lewis, C.F.M., 1979. Preliminaryresults of surficial geology and geomorphology studies of theLomonosov Ridge, Central Arctic Basin. Curr. Res.-Geol.Surv. Can., Part C, Paper 79-1C, pp. 73–83.
Carmack, E., 1990. Large-scale physical oceanography of polarŽ .oceans. In: Smith, W.O. Ed. , Polar Oceanography, Part A,
Physical Science. Academic Press, San Diego, pp. 171–222.Casagrande, A., 1936. Determination of preconsolidation load and
its practical significance. Proceedings 1st Conference SoilMechanics and Found. Am. Soc. Civ. Eng., vol. 3, pp. 60–64.
Clark, D.L., 1970. Magnetic reversals and sedimentation rates inthe Arctic Basin. Geol. Soc. Am. Bull. 81, 3129–3134.
Clark, D.L., Hansen, A., 1983. Central Arctic Ocean sedimenttexture: a key to ice-transport mechanism. In: Molnia, B.Ž .Ed. , Glacial-marine Sedimentation. Plenum, New York, pp.301–330.
Clark, D.L., Whitman, R.R., Morgan, K.A., Mackey, S.D., 1980.Stratigraphy and glacial-marine sediments of the AmerasianBasin, central Arctic Ocean. Geol. Soc. Am. Spec. Pap. 181,1–57.
Denton, G.H., Hughes, T.J., 1981. The Arctic ice sheet; anoutrageous hypothesis. The Last Great Ice Sheets. Wiley, NewYork, NY, USA, pp. 437–467.
Dyke, A.S., 1999. Last glacial maximum and deglaciation ofDevon Island, Arctic Canada: support for an innuitian icesheet. Quat. Sci. Rev. 18, 393–420.
Ellwood, B.B., 1984. Magnetic fabric and remanence analyses ofcores from the U.S. continental margin and the Vema Channel.Mar. Geol. 58, 151–164.
Ellwood, B.B., Ledbetter, M.T., 1979. Paleocurrent indicators indeep-sea sediment. Science 203, 1335–1337.
Evans, J.R., Kaminski, M.A., 1998. Pliocene and Pleistocenechronostratigraphy and paleoenvironment of the central ArcticOcean, using deep water agglutinated foraminifera. Micropale-ontology 44, 109–130.
Flower, B.P., 1997. Overconsolidated section on the YermakPlateau, Arctic Ocean Ice sheet grounding prior ca 660 ka?Geology 25, 147–150.
Frederichs, T., 1995. Regional and temporal variations of rock
magnetic parameters in Arctic marine sediments. Ber. Polar-forschung 164, 1–212.
Futterer, D.K., 1992. ARCTIC ’91: The expedition ARK VIIIr3¨of RV Polarstern in 1991. Ber. Polarforschung, 107.
Gard, G., 1993. Late quaternary coccoliths at the North Pole:evidence of ice-free conditions and rapid sedimentation in thecentral Arctic Ocean. Geology 21, 227–230.
Gard, G., Backman, J., 1990. Synthesis of Arctic and sub-Arcticcoccolith biochronology and history of North Atlantic driftwater influx during the last 500,000 years. In: Bleil, U.,
Ž .Thiede, J. Eds. , Geological History of the Polar Oceans:Arctic versus Antarctic. NATO ASI Ser. C, vol. 308, pp.417–436.
Grosswald, M.G., 1980. Late Weichselian ice sheets of northernEurasia. Quat. Res. 13, 1–32.
Haq, B.U., Lohmann, G.P., 1976. Early Cenozoic calcareousnannoplankton biogeography of the Atlantic Ocean. Mar. Mi-cropaleontol. 1, 119–194.
Hughes, T.J., Denton, G.H., Grosswald, M.G., 1977. Was there alate Wurm ice sheet? Nature 266, 596–602.¨
Ishman, S.E., Polyak, L., Poore, R.Z., 1996. An expanded recordof pleistocene deep arctic change: Canada Basin, westernArctic Ocean. Geology 24, 139–142.
Jakobsson, M., 1999. First high-resolution chirp sonar profilesfrom the central Arctic Ocean reveal erosion of LomonosovRidge sediments. Mar. Geol. 158, 111–123.
Jakobsson, M., Løvlie, R., Al-Hanbali, H., Arnold, E., Backman,J., Morth, M., 2000. Manganese and color cycles in Arctic¨Ocean sediments constrain Pleistocene chronology. Geology28, 23–26.
Jokat, W., Uenzelmann-Neben, G., Kristoffersen, Y., Rasmussen,T.M., 1992. Lomonosov Ridge—A double-sided continentalmargin. Geology 20, 887–890.
Jokat, W., Weigelt, E., Kristoffersen, Y., Rasmussen, T.M.,Schone, T., 1995. New insights into the evolution of the¨Lomonosov Ridge and the Eurasian Basin. Geophys. J. Int.122, 378–392.
Jones, R.L., Whatley, R.C., Cronin, T.M., Dowsett, H.J., 1999.Reconstructing late Quaternary deep-water masses in the east-ern Arctic Ocean using benthonic Ostracoda. Mar. Micropale-ontol. 37, 251–272.
Karlen, W., Lundqvist, J., Rutter, N.W., Teller, J.T., Catto, N.R.´Ž .Eds. , 1998. Problematic Ice Sheets. Quat. Int., vol. 45r46,pp. 1–142.
Lagoe, M.B., 1977. Recent benthic foraminifera from the centralArctic Ocean. J. Foramineferal Res. 7, 106–129.
Larsen, E., Funder, S., Thiede, J., 1999. Late Quaternary historyof northern Russia and adjacent shelves—synopsis. Boreas 28,6–11.
Løvlie, R., Markussen, B., Sejrup, H.P., Thiede, J., 1986. Magne-tostratigraphy in three Arctic Ocean sediment cores; argu-ments for magnetic excursions within oxygen-isotope stage2–3. Phys. Earth Planet. Int. 43, 173–184.
Mayer, L.A., 1979. The origin of the fine scale acoustic stratigra-Ž .phy in deep sea carbonates. J. Geophys. Res. 84 B11 ,
6177–6184.Morris, T.H., Clark, D.L., Blasco, S.M., 1985. Sediments of the

( )M. Jakobsson et al.rGlobal and Planetary Change 31 2001 1–2222
Lomonosov Ridge and Markov Basin: a Pleistocene stratigra-phy for the North Pole. Geology 96, 901–910.
Myhre, A.M., Thiede, J., Firth, J.V. et al., 1995. Proc. OceanŽ .Drill. Prog. Initial reports , 151, College Station, Texas,
Ocean Drilling Program, 1-926.Nowaczyk, N.R., Baumann, M., 1992. Combined high-resolution
magnetostratigraphy and nannofossil biostratigraphy for lateQuaternary Arctic Ocean sediments. Deep-Sea Res. 39, 567–601.
O’Neill, B.J., 1981. Pliocene and Pleistocene benthic foraminiferafrom the central Arctic Ocean. J. Paleontol. 55, 1141–1170.
Phillips, R.L., Grantz, A., 1997. Quaternary history of sea ice andpaleoclimate in the Amerasia basin, Arctic Ocean, as recordedin cyclical strata of Northwind Ridge. Geol. Soc. Am. Bull109, 1101–1115.
Polyak, L.V., 1986. New data on microfauna and stratigraphy ofbottom sediments of the Mendeleev Ridge, Arctic Ocean. In:
Ž .Andreev, S.I. Ed. , Sedimentogenesis and Nodule-FormationŽin the Ocean. Sevmorgeologia, Leningrad, pp. 40–50 in
.Russian .Polyak, L.V., 1990. General trends of benthic foraminiferal distri-
bution in the Arctic Ocean. In: Kotlyakov, V.M., Sokolov,Ž .V.E. Eds. , Arctic Research: Advances and Prospects. Part 2.
Nauka, Moscow, pp. 11–213.Polyak, L., Forman, S.L., Herlihy, F.A., Ivanov, G., Krinitsky, P.,
1997. Late Weichselian deglacial history of the SvyatayaŽ .Saint Anna Trough, northern Kara Sea, Arctic Russia. Mar.Geol. 143, 169–188.
Polyak, L., Edwards, M.H., Coakley, B.J., Jakobsson, M., 2001.Ice shelves in the Pleistocene Artic Ocean inferred fromglaciogenic deep-sea bedforms. Nature 410, 453–457.
Poore, R.Z., Ishman, S.E., Phillips, L., McNeil, D., 1994. Quater-nary stratigraphy and paleoceanography of the Canada Basin,Western Arctic Ocean. U.S Geol. Surv. Bull. 2080, 1–32.
Schock, S.G., LeBlanc, L.R., Mayer, L.A., 1989. Chirp subbottomprofiler for quantitative sediment analysis. Geophysics 54,445–450.
Scott, D.B., Mudie, P.J., Baki, V., MacKinnon, K.D., Cole, F.E.,1989. Biostratigraphy and late Cenozoic paleoceanography ofthe Arctic Ocean: foraminiferal, lithostratigraphic, and isotopicevidence. Geol. Soc. Am. Bull. 101, 260–277.
Sejrup, H.P., Gifford, H.M., Brigham-Grette, J., Løvlie, R., Hop-kins, D., 1984. Amino acid epimerization implies rapid sedi-mentation rates in Arctic ocean cores. Nature 310, 772–775.
Spielhagen, R.F., Bonani, G., Eisenhauer, A., Frank, M., Fred-erichs, T., Kassens, H., Kubik, P.W., Mangini, A., Norgaard-Pedersen, N., Nowaczyk, N.R., Schper, S., Stein, R., Thiede,
J., Tiedemann, R., Wahsner, M., 1997. Arctic Ocean evidencefor late Quaternary initiation of northern Eurasian ice sheets.Geology 25, 783–786.
Ž . Ž .Stein, R. Ed. , 1998. Arctic Paleo-River Discharge APARD —ANew Research Program of the Arctic Ocean Science BoardŽ .AOSB . Reports on Polar Research 279. Alfred WegenerInstitute, Bremerhaven, pp. 1–127.
Stein, R., Korolev, S., 1994. Shelf-to-basin sediment transport inthe eastern Arctic Ocean. In: Kassens, H., Hubberten, H.-W.,
Ž .Pryamikov, S.M., Stein, R. Eds. , Russian–German Coopera-tion in the Siberian Shelf Seas: Geo-System Laptev Sea.Reports on Polar Research 144. Alfred Wegener Institute,Bremerhaven, pp. 87–100.
Stein, R., Grobe, H., Washner, M., 1994a. Organic carbon, car-bonate, and clay mineral distributions in eastern central ArcticOcean surface sediments. Mar. Geol. 104, 269–285.
Stein, R., Schubert, C., Vogt, C., Futterer, D.K., 1994b. Stable¨isotope stratigraphy, sedimentation rates, and salinity changesin the Latest Pleistocene to Holocene eastern central ArcticOcean. Mar. Geol. 119, 333–355.
Steuerwald, B.A., Clark, D.L., Andrew, J.A., 1968. Magneticstratigraphy and faunal patterns in Arctic Ocean sediments.Earth Planet. Sci. Lett. 5, 79–85.
Tarling, D.H., Hrouda, F., 1993. The Magnetic Anisotropy ofRocks. Chapman & Hall, London.
Thiede, J., Bauch, H.A., 1999. The Late Quaternary history ofnorthern Eurasia and the adjacent Arctic Ocean: an introduc-tion to QUEEN. Boreas 28, 3–5.
Thierstein, H.R., Geitzenauer, K.R., Molfino, B., Shackleton, N.J.,1977. Global synchroneity of late Quaternary coccolith datumlevels: validation by oxygen isotopes. Geology 5, 400–404.
Thompson, R., Oldfield, F., 1986. Environmental Magnetism.Allen & Unwin, London, 227 pp.
Vogt, P.R., Crane, K., Sundvor, E., 1994. Deep Pleistoceneiceberg plowmarks on the Yermak Plateau: sidescan and 3.5kHz evidence for thick calving ice fronts and a possible
Ž .marine ice sheet in the Arctic Ocean. Geology 22 5 , 403–406.Washner, M., Muller, C., Stein, R., Ivanov, G., Levitan, M.,¨
Shelekova, E., Tarasov, G., 1999. Clay-mineral distribution insurface sediments of the Eurasian Arctic Ocean and continen-tal margin as indicator for source areas and transport pathways—a synthesis. Boreas 28, 215–232.
Weeks, R., Laj, C., Endignoux, L., Fuller, M., Roberts, A.,Manganne, R., Blanchard, E., Goree, W., 1993. Improvementsin long-core measurement techniques: applications in paleo-magnetism and paleoceanography. Geophys. J. Int. 114, 651–662.