Plate Wastage and the Service Quality of the Cafeteria in ...
15
E-ISSN: 2476-9606 Abstract Proceedings International Scholars Conference Volume 7 Issue 1, October 2019, pp.69-83 https://doi.org/10.35974/isc.v7i1.896 69 Plate Wastage and the Service Quality of the Cafeteria in a Private High School Kent Serafin N. Francisco 1 , Gerald Z. Macalinao 2 , Ranny Magdalena J. Satigi 3 , Ruchel G. Oasan 4 Adventist University of the Philippines [email protected] ABSTRACT Millions of people in the world are suffering from scarcity of food, yet tons of food are wasted every day. This study was conducted to determine the food wastage of high school students and the service quality of a cafeteria located in Silang, Cavite. Convenience sampling was utilized to select high school students enrolled in the school where the cafeteria is situated to participate in the study. A descriptive-evaluative research design was used and data gathered were analyzed using descriptive statistics such as frequency, mean, and standard deviation. Quarter waste method was used to measure plate wastage while adopted questionnaire was used to determine the service quality of the cafeteria. Findings revealed that the highest percentage of food wastage was gluten followed by ground vegescallop, vegemeat, tofu, and beans. In terms of service quality, the lowest percentage was the dining area (Mean= 2.95 and SD= 0.80), followed by Food Quality (Mean=3.44 and SD= 0.80), Food Variety (Mean= 3.76 and SD= 0.61), Personnel employees’ service (Mean= 3.80 and SD= 0.79), and Serving time (Mean= 3.85 and SD= 0.80). Among the five protein foods that incurred a leftover, gluten has the highest percentage of waste while among the five factors contributing to the service quality of a cafeteria, dining area has the lowest percentage. Based on the results, the use of gluten as part of the meal and the dining area as a place to eat should be improved to lessen the food wastage and enhance the service quality, respectively. Keywords: plate wastage; service quality; cafeteria; food waste; Quarter Waste Method. INTRODUCTION Millions of people in the world are suffering in the world are suffering from scarcity of food, yet tons of food are wasted every day. In developed countries, while housholds represent a significant source of food waste, the institutional food service sectors such as schools, prisons, and the hospitals are also major sources of food waste (Wilkie, Graunke & Cornejo, 2015). Cafetaria is one of the most important establisments in any university, many students rely primarily in the cafetaria for their food to eat especially at luch therefore quality of service must be considered. Students eat in cafetaria for several reasons such as the food itself, the price on the food, and the ambience. brought to you by CORE View metadata, citation and similar papers at core.ac.uk provided by Online Journal Universitas Advent Indonesia
Transcript of Plate Wastage and the Service Quality of the Cafeteria in ...

E-ISSN: 2476-9606 Abstract Proceedings International Scholars Conference Volume 7 Issue 1, October 2019, pp.69-83
https://doi.org/10.35974/isc.v7i1.896
69
Plate Wastage and the Service Quality of the Cafeteria
in a Private High School
Kent Serafin N. Francisco1, Gerald Z. Macalinao2, Ranny Magdalena J. Satigi3, Ruchel G. Oasan4
Adventist University of the Philippines
ABSTRACT
Millions of people in the world are suffering from scarcity of food, yet tons of food are wasted
every day. This study was conducted to determine the food wastage of high school students
and the service quality of a cafeteria located in Silang, Cavite. Convenience sampling was
utilized to select high school students enrolled in the school where the cafeteria is situated to
participate in the study. A descriptive-evaluative research design was used and data gathered
were analyzed using descriptive statistics such as frequency, mean, and standard deviation.
Quarter waste method was used to measure plate wastage while adopted questionnaire was
used to determine the service quality of the cafeteria. Findings revealed that the highest
percentage of food wastage was gluten followed by ground vegescallop, vegemeat, tofu, and
beans. In terms of service quality, the lowest percentage was the dining area (Mean= 2.95 and
SD= 0.80), followed by Food Quality (Mean=3.44 and SD= 0.80), Food Variety (Mean= 3.76
and SD= 0.61), Personnel employees’ service (Mean= 3.80 and SD= 0.79), and Serving time
(Mean= 3.85 and SD= 0.80). Among the five protein foods that incurred a leftover, gluten has
the highest percentage of waste while among the five factors contributing to the service quality
of a cafeteria, dining area has the lowest percentage. Based on the results, the use of gluten as
part of the meal and the dining area as a place to eat should be improved to lessen the food
wastage and enhance the service quality, respectively.
Keywords: plate wastage; service quality; cafeteria; food waste; Quarter Waste Method.
INTRODUCTION
Millions of people in the world are suffering in the world are suffering from scarcity of food,
yet tons of food are wasted every day. In developed countries, while housholds represent a
significant source of food waste, the institutional food service sectors such as schools, prisons,
and the hospitals are also major sources of food waste (Wilkie, Graunke & Cornejo, 2015).
Cafetaria is one of the most important establisments in any university, many students rely
primarily in the cafetaria for their food to eat especially at luch therefore quality of service
must be considered. Students eat in cafetaria for several reasons such as the food itself, the
price on the food, and the ambience.
brought to you by COREView metadata, citation and similar papers at core.ac.uk
provided by Online Journal Universitas Advent Indonesia

Abstract Proceedings International Scholars Conference, Volume 7 Issue 1, October 2019, pp. 69-83
70
According to Cohen, Richardson, Parker, Catalano, and Rimm (2015), acceptance of school
cafetaria services is determined by the percentage of food eaten or wasted by the school
community particularly the students who composed the bulk of the population. Moreover,
measuring food waste in the school cafetarias is a necessary part of an evaluation of the
effectiveness of schools policies and interventions designed to amplify consumption of
healthier meals and to reduce meals waste in schools ( Getts, Quinn, Johnson, and Otten, 2017).
Thus, this study aimed to determine the food wastage of high school students and the service
quality of a cafetaria.
University food service/Cafeteria
Cafeteria and food service programs are recognized as one of the determinants for students’
retention at university level. A university cafeteria with variety, diversity, and comfort causes
students to experience a sense of “home” while on campus where they can engage in longer
leisurely conversation that permits loud interactive activities among peers (Chang, Suki, &
Suki, 2015). University food service becomes one of the services that need to be considered in
order to gratify students by providing foods in universities (Zainol & Seladorai, 2016).
Food Waste
Each year, an estimated 1/3 of all food produced for human consumption is lost or wasted
world-wide. In Europe and North America is 95- 115 kg/ year while in sub- Saharan Africa
and Southeast Asia is 6-11 kg/ year (FAO, 2011). In the study of Hanks, Wansink, and Just
(2013), three different methods were used to measure food waste to the most convenient, less
time, and cost effective: (a) Half-Waste Method: All, some, or None food waste; (b) Quarter-
Waste Method: All, ¾, ½, or ¼ of a food wasted; and (c) Photograph Method: 10% increments
should be wasted using photographed. Among the three methods, Quarter-waste method is the
highest in terms of reliability and found to be the most accurate.
Food Quality
Food quality is related to satisfaction with the quality of fast food served to customers (Chang,
Suki, & Suki, 2015). In several empirical studies, food quality has emerged as the most
essential key attribute of customer satisfaction. There are various attributes of food quality
which had been discussed in past researches. These includes taste, health options, freshness,
presentation, quality of ingredients, safety, portion, halal, nutrition, menu variety, aroma,
temperature, innovative menu items, hygiene, authentic food and texture (Zainol & Seladorai,
2016).
Serving Time

Fransisco, Macalinao, Satigi, Oasan, Plate Wastage and …
71
Rioux, Schmitt, and Leclerc (2016) stated, waiting can be time-consuming, annoying, and
incredibly frustrating. First, unoccupied time of the students in the waiting line is always felt
longer than the occupied time. If a student in service waiting line is engaged with some activity
by himself or by service personnel, he will not feel waiting as longer. One of the funny but
practical suggestions is to provide a big mirror where people must wait in standing for longer.
This is nothing but the subjective element of the students as they not occupied by any activity
in the line. Second, preprocess waits of the students is always felt as longer by students than
in- process waits. Obviously, the students do not take cognizance of longer time involved in
the service delivery process as long as he is actively participating in the process. Third, any
anxiety on the part of the students make him to feel waiting time as subjectively longer
(Edwards, 2016).
Food variety
Variation gave a lot of improvement to the food service because customers satisfaction is low
when it comes to service but because of the assorted foods in the counter with beverages,
customer satisfaction became high and food waste reduced (Ahmad, 2015). Food variety is
important for satisfaction. Variety does not only referred to sensory variety within a meal, but
also variety between meals, in meal offerings (Andersen & Hyldig, 2015). The biggest
challenge food service establishments are facing today is meeting the nutritional requirements
the students need and getting them to actually eat what they serve. School food service should
offer food that tastes good to the students being served; foods that support their growth and
development, meeting their nutritional needs; and exposing them to a variety of foods. If food
service establishments have to increase students’ familiarity with foods that are both healthy
and tasty, they are to be more likely to incorporate these foods into their diets.
Personnel Service
The server is also an important part of the segment of the food service experience. They are the
face of the food service. Personnel should maintain a high degree of personal cleanliness and
should conform to good hygienic practices during all working periods. Apart from personal
hygiene, the students also expect prompt and courteous service from them. When every
employee strives to provide 100% customer satisfaction, every customer, every visit-
customers will keep coming back for more. Feeling and impressions upon leaving the place
have a lasting influence on whether or not they will return (Duong, 2015).
Ambiance

Abstract Proceedings International Scholars Conference, Volume 7 Issue 1, October 2019, pp. 69-83
72
In the food service industry, ambiance is a term used to refer to the aesthetic or emotional
impact of an establishment on its customers. It has any number of elements- sanitation,
ventilators, cleanliness, furnishings, lighting, sound, decoration, themes, table settings,
employees’ appearances and attitudes, and so on- all aspects of the establishment’s
environment. In a professionally designed restaurant, the ambiance is never left to chance. It is
carefully crafted to achieve a particular impact (Dipesh & Apil, 2018). Cleanliness of the food
service also matters. It is important that the food service provides a clean, comfortable
environment especially suited for the students. They also need to provide a warm and inviting
environment and a variety of comfortable seating arrangements to accommodate anyone- from
a single person to a group of students (Senduk, Saerang, & Lambey, 2016).
METHODS
Research Design
This study used descriptive-evaluative method, a type of descriptive research design used to
collect the data to describe and evaluate or measure the results against some known or
hypothesized standards. This design is best suited for this study because it measures the food
wastage and factors influencing customer satisfaction towards the service quality of the
cafeteria.
Instruments
Quarter-Waste method was used to determine the plate wastage by measuring one whole
(100%), ¾ (75%), ½ (50%), and ¼ (25%) and camera was used for documentation of leftover
food. A Quality Service Questionnaire was used to determine the service quality of the
cafeteria. Composition of the questionnaire used was to describe the extent quality of service
at cafeteria such as: Serving Time, Personnel Employee Service, Food Variety, Food Quality
and Dining Area.
Population and Sampling Techniques
The participants of the study were 132 high school students of a private academy in Silang,
Cavite during the school year 2018-2019. Participants were selected by convenience sampling,
a non- probability sample that is based on characteristics of a population and the objective of
the study. A convenience sample is a non-probability sample in which the researcher uses the
subjects that are nearest and available to participate in the research study. This technique is
also referred to as "accidental sampling," and is commonly used in pilot studies prior to
launching a larger research project (Crossman, 2019).

Fransisco, Macalinao, Satigi, Oasan, Plate Wastage and …
73
Data Gathering Procedure
The researchers used the menu in the cafeteria which focused only on one category which is
the protein-rich foods, these are the entrée and beans served during lunch time at the extension
lane of the said cafeteria. The researchers were referred to the menu as a guideline of the food
to be served during that day. The researchers asked the respondents to leave their plate on the
table after they were done eating, then the researchers examined each plate using Quarter-
Waste method. Quarter-waste method is a technique use for calculating accurate amounts of
tray waste (Hanks, Wansink, & Just, 2013). It is a visual method that reports whether none, ¼,
½, ¾, or all of the food item is wasted. On the fifth day of observation, the researchers
distributed adopted Quality Service Questionnaire to gather data. After gathering all the 132
questionnaires, the researchers tallied the results, and they were analyzed by the experts, as 123
questionnaires were validated.
RESULTS
Food Wastage of the High School Students
Table 1. Food Waste of High School Students
Vege-product f Percentage
Gluten 28 62.2%
Ground Vege-Scallop 4 8.9%
Vege-meat 4 8.9%
Beans 3 6.7%
Tofu 6 13.3%
Total 45 100%
Table 1 shows the composition of vege-products wastage of high school students in the
cafeteria regardless of the measurement. More than half of the accumulated left overs was from
gluten dishes which is 62.2%.

Abstract Proceedings International Scholars Conference, Volume 7 Issue 1, October 2019, pp. 69-83
74
Food Waste on Gluten
Table 2. Gluten Waste
f Percentage
No Left Over 127 81.9%
1 6 3.9%
¾ 1 0.6%
½ 2 1.3%
¼ 19 12.3%
Total 155 100%
Table 2 shows the food wastage of gluten dish wherein a total of 155 students ordered the food.
Results show that 127 (81.9%) students finished the food having no leftovers, while six (3.9%)
students wasted one whole serving. The quantity waste with highest percentage is ¼ serving
wasted by 19 (12.3%) students followed by ½ serving wasted by two (1.3%) students, and
lastly ¾ serving wasted by one (0.6%) student only.
Food Waste on Ground Vege-Scallop
Table 3 shows the wastage of protein food namely ground scallop. There were 131 students
who ordered and three (2.3%) students wasted ¼ serving of ground scallop, followed by ½
serving wasted by one (.8%) student.
Table 3. Ground Vege-Scallop Waste
f Percentage
No Left Over 127 96.9%
1 0 0
¾ 0 0
½ 1 0.8%
¼ 3 2.3%
Total 131 100%
Food Wastage on Vege Meat
Table 4 shows the wastage of vege-meat food, out of 131 students that ordered the said vege-
product, 127 (95.5%) do not have left overs, while three (3.8%) of the students wasted ½
serving of vege meat and one (0.8%) student wasted ¾ serving.

Fransisco, Macalinao, Satigi, Oasan, Plate Wastage and …
75
Table 4. Vege-Meat Waste
f Percentage
No Left Over 127 95.4%
1 0 0
¾ 1 0.8
½ 3 3.8%
¼ 0 0
Total 131 100%
Food Wastage on Beans
Table 5 shows the wastage of beans. Total of students who ordered beans is 130 students, 127
(97.7%) do not have left overs, two (1.6%) of the students wasted ½ serving and one (0.8%)
student wasted ¼ serving of Beans.
Table 5. Beans Waste
f Percentage
No Left Over 127 97.7%
1 0 0
¾ 0 0
½ 2 1.5%
¼ 1 0.8
Total 130 100%
Food Wastage on Tofu
Table 6 shows the wastage of protein food namely tofu. Total number of students who ordered
tofu is 133 and students who do not have left overs were 127 (95.5%). Six (4.5%) of the 133
wasted ¼ serving of the product. There were no left overs in the quantity of one whole serving,
three- fourth serving, and one- half serving.
Table 6. Tofu Waste
f Percentage
No Left Over 127 95.5%
1 0 0
¾ 0 0
½ 0 0
¼ 6 4.5%
Total 133 100%
Abstract Proceedings International Scholars Conference, Volume 7 Issue 1, October 2019, pp. 69-83
76
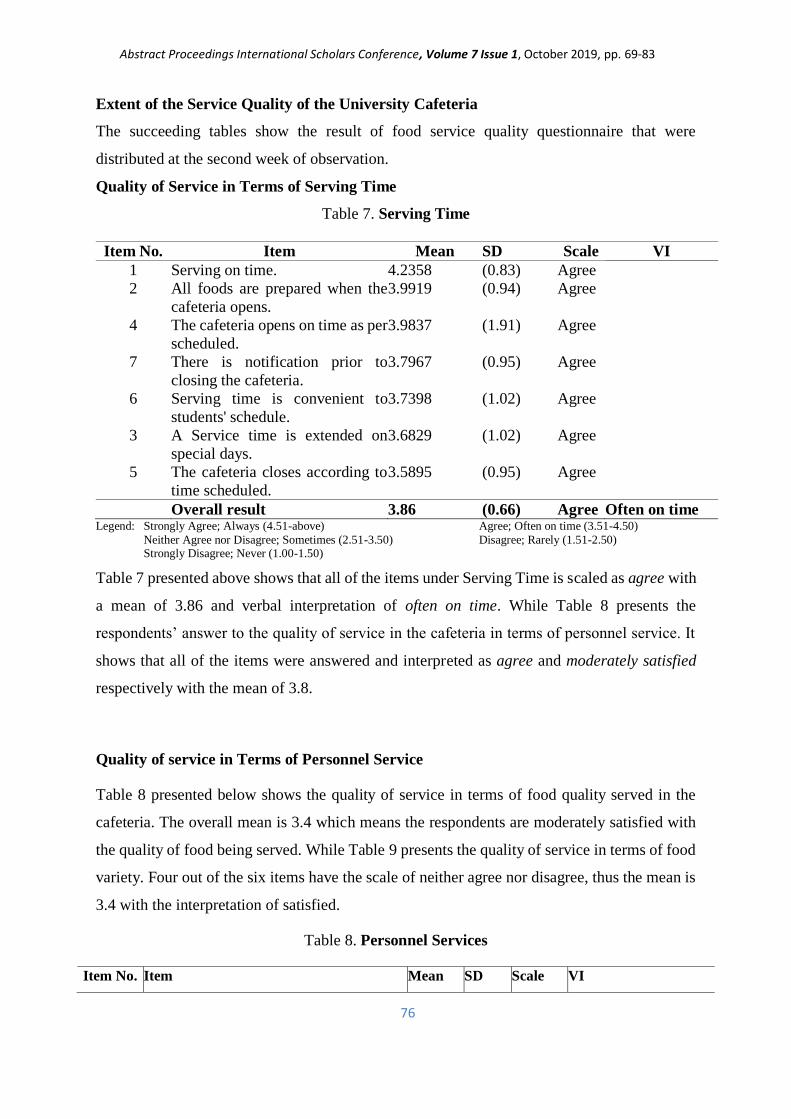
Extent of the Service Quality of the University Cafeteria
The succeeding tables show the result of food service quality questionnaire that were
distributed at the second week of observation.
Quality of Service in Terms of Serving Time
Table 7. Serving Time
Item No. Item Mean SD Scale VI
1 Serving on time. 4.2358 (0.83) Agree
2 All foods are prepared when the
cafeteria opens.
3.9919 (0.94) Agree
4 The cafeteria opens on time as per
scheduled.
3.9837 (1.91) Agree
7 There is notification prior to
closing the cafeteria.
3.7967 (0.95) Agree
6 Serving time is convenient to
students' schedule.
3.7398 (1.02) Agree
3 A Service time is extended on
special days.
3.6829 (1.02) Agree
5 The cafeteria closes according to
time scheduled.
3.5895 (0.95) Agree
Overall result 3.86 (0.66) Agree Often on time Legend: Strongly Agree; Always (4.51-above) Agree; Often on time (3.51-4.50)
Neither Agree nor Disagree; Sometimes (2.51-3.50) Disagree; Rarely (1.51-2.50) Strongly Disagree; Never (1.00-1.50)
Table 7 presented above shows that all of the items under Serving Time is scaled as agree with
a mean of 3.86 and verbal interpretation of often on time. While Table 8 presents the
respondents’ answer to the quality of service in the cafeteria in terms of personnel service. It
shows that all of the items were answered and interpreted as agree and moderately satisfied
respectively with the mean of 3.8.
Quality of service in Terms of Personnel Service
Table 8 presented below shows the quality of service in terms of food quality served in the
cafeteria. The overall mean is 3.4 which means the respondents are moderately satisfied with
the quality of food being served. While Table 9 presents the quality of service in terms of food
variety. Four out of the six items have the scale of neither agree nor disagree, thus the mean is
3.4 with the interpretation of satisfied.
Table 8. Personnel Services
Item No. Item Mean SD Scale VI

Fransisco, Macalinao, Satigi, Oasan, Plate Wastage and …
77
1 Cafeteria personnel are properly groomed. 4.1463 (0.74) Agree
5 Taking orders from customer. 3.8293 (1.01) Agree
4 Prompt in assisting customer. 3.8130 (0.99) Agree
7 Speaks clearly. 3.8130 (0.84) Agree
6 Helpful in assisting customers. 3.7642 (0.81) Agree
8 Help resolve customer needs. 3.7561 (0.84) Agree
3 Good attitude towards customer. 3.7154 (0.79) Agree
2 Knowledgeable on the food being served. 3.5772 (0.97) Agree
Overall result 3.8 (0.61) Agree Moderately satisfied Legend: Strongly Agree; Very Much Satisfied (4.5-above) Agree; Moderately Satisfied (3.51-4.50) Neither Agree nor Disagree; Satisfied (2.51-3.50) Disagree; Slightly Satisfied (1.51-2.50)
Strongly Disagree; Not Satisfied (1.00-1.50)
Quality of service in Terms of Food Quality Served in the Cafeteria
Table 9. Food Quality
Item No. Items Mean SD Scale VI
3 Food served are healthy. 3.7967 (0.99) Strongly Agree
1 Food served are prepared under
sanitary conditions.
3.7317 (1.05) Strongly Agree
5 Cold food is served cold. 3.4878 (1.08) Neither Agree nor
Disagree
2 Food served are delicious. 3.3496 (1.08) Neither Agree nor
Disagree
4 Hot food served hot. 3.2195 (1.13) Neither Agree nor
Disagree
6 Most food served are not oily. 3.0650 (1.26) Neither Agree nor
Disagree
Overall result 3.4 (0.80) Neither Agree nor
Disagree
Satisfied
Legend: Strongly Agree; Very Much Satisfied (4.5-above) Agree; Moderately Satisfied (3.51-4.50)
Neither Agree nor Disagree; Satisfied (2.51-3.50) Disagree; Slightly Satisfied (1.51-2.50)
Strongly Disagree; Not Satisfied (1.00-1.50)
Quality of service in Terms of Food Variety Served in the Cafeteria
Table 10. Food Variety
Item No. Items Mean SD Scale VI
1 Food being served offer variety of choices (main dish,
vegetable dish, pasta,etc.).
4.0325 (0.90) Agree
4 There is variety of texture in food items (soft, crunchy,
chewy, etc.).
3.7642 (0.96) Agree
3 There is variety of taste in food items (salty, sweet sour,
bitter).
3.7480 (0.96) Agree
5 There is variety of appearance in food items (different
color/presentation)
3.7398 (0.95) Agree

Abstract Proceedings International Scholars Conference, Volume 7 Issue 1, October 2019, pp. 69-83
78
2 Serving local and international cuisine. 3.5366 (1.09) Agree
Overall result 3.76 (0.79) Agree Very
Good Legend: Strongly Agree; Excellent (4.5-above) Agree; Very Good (3.51-4.50)
Neither Agree nor Disagree; Good (2.51-3.50) Disagree; Fair (1.51-2.50)
Strongly Disagree; Poor (1.00-1.50)
Quality service in Terms of Dining Area in the Cafeteria
Table 11. Dining Area
Item
No.
Item Mean SD Scale VI
1 The dining area is clean. 3.9024 (1.05) Agree
2 The dining area is attractively
structured.
3.2602 (1.10) Neither Agree
nor Disagree
3 The cafeteria provides cozy
environment.
2.9268 (1.15) Neither Agree
nor Disagree
4 The school cafeteria is well
ventilated.
2.8943 (1.19) Neither Agree
nor Disagree
5 The cafeteria provides comfortable
seating environment.
2.8537 (1.21) Neither Agree
nor Disagree
6 Music is played during dining time. 1.9024 (1.22) Disagree
Overall result 2.96 (0.80) Neither Agree
nor Disagree
Good
Legend: Strongly Agree; Excellent (4.5-above) Agree; Very Good (3.51-4.50)
Neither Agree nor Disagree; Good (2.51-3.50) Disagree; Fair (1.51-2.50)
Strongly Disagree; Poor (1.00-1.50)
Table 11 shows the mean of the quality service in terms of dining area. The result was dining
area in the cafeteria is good with the mean of 2.96 for almost all of the items has a result of
neither agree nor disagree and a verbal interpretation of good. In addition, the SD is 0.80,
stating that there answers were not far from each other.
DISCUSSION
Food Wastage of the High School Students
The observation of wastage of vege-products used were done in eight days using the Quarter-
Waste Method. Among the vege-products used and observed, gluten has the highest waste as
shown in Table 1. And the least waste were beans and tofu. In Table-2, the number of students
who have left overs in gluten dish are shown with six, one, two, and 19 students having
leftovers of one whole, ¾, ½, and ¼ servings respectively. In Table 3, 96.9% of students have
no leftover in scallop. The serving with the highest waste percentage is ¼ serving (2.3%)

Fransisco, Macalinao, Satigi, Oasan, Plate Wastage and …
79
followed by ½ serving with the percentage of 0.8% (only one student). While the highest
amount of waste in vege-meat as shown in Table-4 was ½ serving with a percentage of 3.8%
or three students followed by ¾ serving having only one student or 0.8%.
Out of 130 students who ordered beans as shown in Table-5, only two or 1.5% have ½ serving
of waste and only one has waste of ¼ serving with a percentage of 0.8%. It only shows that
these students that ordered beans dish like the food or maybe because of the cookery used. The
substitution of meat with legumes is one way of making food consumption more sustainable
according to Lemken, Spiller, and Schulze-Ehlers (2019). In their study of the acceptance of
meat with legume products, the result shows that although consumers in New Zealand do not
use them regularly, many are open to using meat substitutes made from legumes. It is suggested
in the study of Jallinoja, Niva, and Latvala (2016) that for plant proteins to replace meat, new
meanings and competences related to preparing and eating pulse-based dishes are needed.
When it comes to tofu, Table-6 shows that out of 133 students who ordered tofu, only six have
waste of ¼ serving and 127 finished their tofu dish. Soya is known to have high quality
nutritional and functional benefits. It is widely used for partial or complete replacement of meat
due to its comparative nutrient contents and lesser chances of cardiovascular diseases (Kumar,
Chatli, Mehta, Singh, Malav, & Verma, 2015). In the study of Joshi and Kumar (2015) of meat
analogues, they mentioned that the consumption of vegetable proteins in food products has
been increasing over the years because of animal diseases, global shortage of animal protein,
strong demand for wholesome and religious (halal) food, and economic reasons.
Service Quality of the University Cafeteria
The tables presented above under the service quality show the results of food service quality
questionnaires that were distributed at the second week of observation. A total of 132
questionnaires were given but only 123 questionnaires were analyzed.
In terms of serving time, Table 7 shows that students believe that the cafeteria is serving often
on time with a mean of 3.86. Waiting generally is regarded as an undesirable activity that
customers must undertake to complete the service. It could lead to both emotional (anger,
irritation, and frustration) and behavioral (e.g. abandonment) responses, especially when it is

Abstract Proceedings International Scholars Conference, Volume 7 Issue 1, October 2019, pp. 69-83
80
costly and limits the person's ability to engage in more productive or rewarding ways to spend
time (Djelassi, Diallo, & Zielke, 2018).
While in terms of personnel services as shown in Table 8, the respondents agree that the
cafeteria personnel are properly groomed with a mean of 4.14 (SD = 0.74) and a verbal
interpretation of very good. They also believed that cafeteria personnel are “taking orders from
customers” with a mean of 3.82 (SD = 1.1). The top two lowest results were item number 2
that states “knowledgeable on the food being served” with a mean of 3.57 (SD = 0.97) and item
number 3 that states “good attitude towards customer” with a mean of 3.71 (SD = 0.79).
However, both are still interpreted as very good. Moreover, the standard deviation (SD) is 0.61
which means that the respondents’ answers were not far from each other. A survey was
conducted among 382 passengers of an airline to examine satisfaction. The results indicate that
personnel quality positively affect satisfaction of customers (Koklic, Kukar-Kinney, & Vegelj,
2017). Moreover, personnel capability and customer satisfaction have a significant positive
impact on customer retention. Customer satisfaction partially mediates the effect of personnel
capability on customer retention according to the study of Darzi and Bhat (2018).
In Table-9, it shows that the respondents strongly agree that “food served in the cafeteria are
healthy” with a mean of 3.79 (SD = 0.99) and a verbal interpretation of very good. Second
highest was item number 1 that says “food served are prepared under sanitary conditions” with
a mean of 3.73 (SD = 1.05) and a verbal interpretation also of very good. However, there are
some respondents who do not believe that “food served are delicious” with a mean of 3.34 (SD
= 1.08) and a verbal interpretation of good. Second lowest was item number 4 that states, “hot
food served hot” with a mean of 3.21 (SD = 1.13) . Thus, the overall result in terms of food
quality was interpreted as good having a mean of 3.44. Studies show that food quality has a
positive influence on customer retention (Han & Hyun, 2017; Al-Tit, 2015) .
Table-10 shows the top two highest results with regard to Food Variety. First was item number
1 that states, “food being served offer variety of choices (main dish, vegetable dish, pasta
etc.)” having a mean of 4.03 (SD = 0.90) and a verbal interpretation of very good. Second was
item number 4 that says, “there is variety of texture in food items (soft, crunchy, chewy etc.)”
with a mean of 3.76 (SD = 0.96) and a verbal interpretation of very good. The top two lowest
results are items number 2 that states, “serving local and international cuisine” and number 5
that states, “there is variety of appearance in food items (different color/presentation)” having
a mean of 3.53 (SD = 1.09) and 3.21 respectively and a verbal interpretation of both good.

Fransisco, Macalinao, Satigi, Oasan, Plate Wastage and …
81
Overall, the respondents believe that cafeteria food variety is very good with a mean of 3.44.
According to Ahmad (2015), variety involves the number or assortment of different menu
items. Foodservice services constantly develop new menus to entice diners, and many
proactive food have created an assortment of food and beverage offerings. Menu items variety
was a crucial attribute of food quality in creating dining satisfaction and reduce the food waste.
When it comes to the dining area of the cafeteria, Table 11 shows that items number 1, 2, and
3 were the top three (3) highest results. In item number 1, the respondents believe that “the
dining area cleanliness” which is very good (mean of 3.9). Item number 2 that states, “the
dining area is attractively structured” with a mean of 3.2 and verbal interpretation of good.
The third highest was item number 3 that states “the cafeteria provides cozy environment”
with a mean of 2.9 and verbal interpretation of good. While the top three lowest results were
items number 6, 5, and 4. Item number 6 states “music is played during dining time” has a
mean of 1.9 and verbal interpretation of fair. Second lowest was item number 5 that states,
“the cafeteria provides comfortable seating environment” with a mean of 2.85 and verbal
interpretation of good. The third lowest was item number 4 that states, “the school cafeteria is
well ventilated” with a mean of 2.89 and verbal interpretation of good. Store atmosphere or
ambiance plays an important role in influencing customer behavior. It is suggested in the study
of Dabija and Băbuţ (2014) that management of retail chain should pay increased attention to
physical surrounding like décor, layout, configurations of merchandise, sounds, aromas,
lighting, and floor coverings. Because these will likely gain customer’s loyalty more easily.
CONCLUSION
Food Waste
Among the five vege-products observed (gluten, grounded vege-scallop, vege-meat, beans, and
tofu), gluten has the highest percentage of waste while Tofu has the least food waste.
Food Service Quality
In terms of service quality as a cafeteria, the researchers conclude that among the five factors
affecting the quality service of a food service (Serving Time, Personnel Employee Service,

Abstract Proceedings International Scholars Conference, Volume 7 Issue 1, October 2019, pp. 69-83
82
Food Variety, Food Quality, and Dining Area), dining area has the lowest average. Most of the
factors like Serving time, Personnel Employee Service and Food Variety have a very good
result, while Food Quality received good result.
REFERENCES
Ahmad A. (2015). The effect of service and food quality on customer satisfaction and hence
customer retention. Asian social science, 11(23). Canadian center of science and
education.
Andersen, B. V., & Hyldig, G. (2015). Food satisfaction: Integrating feelings before, during
and after food intake. Food Quality and Preference, 43, 126-134.
Chang, M. L. D., Suki, N. M., & Suki, N. M. (2015). Students’ Satisfaction with the
University Cafeteria: Structural Relationships of Food Quality, Staff, Price Fairness,
and Ambiance. Islamic Perspectives Relating to Business, Arts, Culture and
Communication, 373–381. doi:10.1007/978-981-287-429-0_35
Cohen JF, Richardson S, Parker E, Catalano PJ, Rimm EB (2014). Impact of the new
Department of Agriculture school meal standards on food selection, consumption, and
waste.
Crossman, A. (2019). Convenience Samples for Research.
Dabija, D. C., & Băbuţ, R. (2014). Enhancing consumers’ satisfaction and loyalty of retailers
in Romania through store ambiance and communication. Procedia Economics and
Finance, 15, 371-382.
Darzi, M. A., & Bhat, S. A. (2018). Personnel capability and customer satisfaction as
predictors of customer retention in the banking sector: A mediated-moderation
study. International Journal of Bank Marketing, 36(4), 663-679.
Dipesh K. & Apil P. (2018). How Food Quality, Price, Ambiance and Service Quality Effects
Customer Satisfaction: A study on Nepalese Restaurants in Finland. Haaga helia
university of applied sciences.
Djelassi, S., Diallo, M. F., & Zielke, S. (2018). How self-service technology experience
evaluation affects waiting time and customer satisfaction? A moderated mediation
model. Decision Support Systems, 111, 38-47.
Duong H. (2015). The effect of employee empowerment on service in food service firms.
Jamk university of applied science.
Edwards J. (2016). Energy and Time modelling of kerbside waste collection: changes
incurred when adding source separated food waste.
https://doi.org/10.1016/j.wasman.2016.06.033.

Fransisco, Macalinao, Satigi, Oasan, Plate Wastage and …
83
Food and Agriculture Organization. (2011). Technical Platform on the Measurement and
Reduction of Food Loss and Waste. Retrieved from: http://www.fao.org/platform-
food-loss-waste/food-waste/definition/en/
Getts, K. M., Quinn, E. L., Johnson, D. B., & Otten, J. J. (2017). Validity and Interrater
Reliability of the Visual Quarter-Waste Method for Assessing Food Waste in Middle
School and High School Cafeteria Settings. Journal of the Academy of Nutrition and
Dietetics, 117(11), 1816–1821. doi:10.1016/j.jand.2017.05.004.
Hanks, a. S., Wansink, B., & Just, a. D. (2013). Reliability and Accuracy of real time
visualization techniques for measuring cafeteria tray waste: Validating the quarter-
waste method. Journal of the academy of nutrition and dietetics, 470-474.
Jallinoja, P., Niva, M., & Latvala, T. (2016). Future of sustainable eating? Examining the
potential for expanding bean eating in a meat-eating culture. Futures, 83, 4–
14. doi:10.1016/j.futures.2016.03.006.
Joshi, V.K., & Kumar, S. (2015). Meat Analogues: Plant based alternatives to meat products-
A review. New Delhi Publishers, India. DOI Number: 10.5958/2277-
9396.2016.00001.5.
Koklic, M. K., Kukar-Kinney, M., & Vegelj, S. (2017). An investigation of customer
satisfaction with low-cost and full-service airline companies. Journal of Business
Research, 80, 188-196.
Kumar, P., Chatli, M. K., Mehta, N., Singh, P., Malav, O. P., & Verma, A. K. (2015). Meat
analogues: Health promising sustainable meat substitutes. Critical Reviews in Food
Science and Nutrition, 57(5), 923–932. doi:10.1080/10408398.2014.939739.
Lemken, D., Spiller, A., & Schulze-Ehlers, B. (2019). More room for legume – Consumer
acceptance of meat substitution with classic, processed and meat-resembling legume
products. Appetite, 104412. doi:10.1016/j.appet.2019.104412.
Rioux L., Schmitt B., & Leclerc F. (2016). Consumers' reactions to waiting: When delays
affect the perception of service quality. Advances in Consumer Research 16, 59-63.
Senduk, D., Saerang, D., & Lambey, L. (2016). The influence of restaurant ambiance and
service quality on customer satisfaction at Pondok Huau Restaurant Manado. Jurnal
Berkala Ilmiah Efisiensi, 16(03).
Wilkie, A., Graunke, R., & Cornejo, C. (2015). Food Waste Auditing at Three Florida
Schools. Sustainability, 7(2), 1370–1387. doi:10.3390/su7021370
Zainol, N. A., & Seladorai, J. (2016). What Matters Most? Factors Influencing International
Students’ Satisfaction towards Cafeteria Foods. Mediterranean Journal of Social
Sciences. doi:10.5901/mjss.2016.v7n4p295