PLATE 3 FLOOD-HAZARD MAP FOR THE ST. GEORGE… · ST. GEORGE–HURRICANE METROPOLITAN AREA Basemap...
1
08 09 06 10 18 19 19 30 07 18 08 04 05 03 30 13 11 14 15 31 22 30 18 19 05 09 11 11 11 30 19 16 18 25 07 07 12 13 12 06 01 01 02 09 04 15 10 14 27 22 15 24 24 26 10 13 26 03 12 21 29 22 12 15 25 23 22 27 01 23 13 23 12 20 12 10 13 24 24 29 24 25 36 13 36 13 14 09 25 29 14 21 28 20 08 03 28 13 28 21 17 21 17 24 36 24 23 29 22 09 25 20 16 02 16 14 09 04 21 28 16 21 17 16 15 07 36 08 33 32 23 10 31 31 36 35 35 34 34 36 32 33 33 32 36 34 33 32 26 06 06 31 30 18 19 27 07 18 31 11 30 19 11 25 11 31 18 19 11 17 11 11 02 06 35 11 26 31 30 11 31 22 06 07 18 05 06 30 19 07 30 18 09 19 18 31 06 04 18 07 30 19 03 20 07 01 10 36 08 01 07 34 19 31 17 15 04 06 05 03 24 29 05 03 27 24 24 17 13 14 08 03 12 12 05 26 22 23 30 22 25 14 12 16 13 13 28 13 25 12 10 21 05 02 36 01 23 10 26 01 26 02 10 03 04 23 35 15 15 34 10 32 22 01 14 03 10 01 35 36 12 33 26 21 27 15 35 27 24 20 22 33 34 24 15 04 20 10 22 13 32 16 25 28 22 23 17 04 23 25 20 08 08 29 17 09 36 27 24 27 24 02 25 09 17 16 13 32 34 21 01 09 36 33 12 29 12 08 25 28 33 27 21 20 29 27 28 32 05 12 14 27 16 28 15 34 29 34 24 26 35 32 28 26 35 26 32 21 25 26 25 05 23 20 29 28 35 20 35 14 23 34 29 16 33 33 36 27 09 36 20 16 32 28 34 35 22 17 33 23 14 28 02 21 26 03 33 16 09 01 34 14 04 06 15 04 02 27 02 08 01 02 21 17 31 32 33 36 34 35 35 Quail r e v i R n i g r i V a t n a S a r a l C r e v i R n i g r i V t r o F e c r a e P h s a W Bloomington Bloomington Hills South . d R s d l e i F n o t g n i h s a W Telegraph St. w o n S y a w k r a P n o y n a C t s a E 0 0 2 ® q FLOOD-HAZARD MAP FOR THE ST. GEORGE–HURRICANE METROPOLITAN AREA Basemap consists of National Agricultural Imagery Program natural color aerial photography. Universal Transverse Mercator Projection, zone 12. North American Datum 1983. Old US-91 Bloomington Hills North Little Valley § ¨ ¦ 15 § ¨ ¦ 15 § ¨ ¦ 15 § ¨ ¦ 15 Middleton . d R r e v i R Sun River St. George Blvd. . t S f f u l B r e v i R EXPLANATION Green Valley Sunbrook ! ( 8 ! ( 18 37 N 113 15' W ! ( 18 e i x i D . r D t n i u q a n o T . r D . r D Bloomington Man O War Rd. . d R m a h g i r B § ¨ ¦ 15 r e v i R . d R n i g r i V r e v i R Stone Cliff Knolls Ledges Diamond Valley Riverside . r D 0 5 4 1 1580 South Washington Fields t s a E 0 0 7 4 h t u o S § ¨ ¦ 15 ! ( 9 Creek Reservoir Sand Hollow Reservoir ! ( 9 ! ( 59 ! ( 9 ! ( 17 R 16 W R 15 W R 17 W R 16 W T 42 S T 43 S 113 22' 30" W 113 30' W 113 37' 30" W R 15 W R 14 W T 42 S T 41 S T 41 S T 40 S R 14 W R 13 W R 13 W R 12 W 37 7' 30" N 37 15' N R 17 W R 16 W R 16 W R 15 W R 15 W R 14 W R 14 W R 13 W T 41 S T 40 S T 42 S T 41 S T 42 S T 43 S 37 15' N 37 7' 30" N 37 N 113 22' 30" W 113 30' W 113 37' 30" W by FEDERAL EMERGENCY MANAGEMENT AGENCY (FEMA) FLOOD INSURANCE RATE MAP (FIRM) ZONES 0.2-percent-annual-chance (or 500-year) flood plain DISCUSSION USING THIS MAP MAP LIMITATIONS SYMBOLS Municipality boundary Interstate Highway State Highway Major local surface street Other road t r o F e c r a e P h s a W 1 0 1 2 0.5 Miles 1 0 1 2 0.5 Kilometers Scale 1:24,000 Approximate mean declination, 2007 14 o H T R O N E U R T H T R O N C I T E N G A M UTAH Map Location AE A AO D E R S N I A T N U O M w o n S n o y n a C Santa Clara Heights d n a S w o l l o H h s a W H T U O S S L L I H t s e W k c a l B e g d i R l l i H b b e W s l l i H y t i C e c i r P n o t e l d d i M k c a l B e g d i R b o n i h S e b i K e m o D n o t g n i h s a W R E N R A W E G D I R R E N R A W Y E L L A V D N A S N I A T N U O M n o t g n i h s a W k c a l B e g d i R l l i M k e e r C e m o D g r u b s i r r a H k e e r C d o o w n o t t o C l i a u Q k e e r C s d e e L k e e r C e n i v e p a r G h s a W h s A k e e r C S F F I L C E N A C I R R U H n i k r e V a L k e e r C n i g r i V r e v i R E N A C I R R U H S F F I L C d l u o G h s a W e l l i v n i k t A h s a W E N A C I R R U H S F F I L C N I A T N U O M K E E R C E L T T I L Zone AE: Areas with a 1% annual chance of flooding and a 26% chance of flooding over the life of a 30-year mortgage. Flood event determined by detailed methods. Mandatory flood insurance purchase requirements and flood-plain management standards apply. Zone A: Areas with a 1% annual chance of flooding and a 26% chance of flooding over the life of a 30-year mortgage. Flood event generally determined using approximate methodologies. Mandatory flood insurance purchase requirements and flood-plain management standards apply. Zone AO: Areas subject to inundation by 1-percent-annual-chance shallow flooding (usually sheet flow on sloping terrain) where average depths are between one and three feet. Some Zone AO have been designated in areas with high flood velocities such as alluvial fans and washes. Flooding is the overflow of water onto lands that are normally dry, and is the most prevalent and destructive (on an annual basis) geologic hazard affecting the St. George – Hurricane metropolitan area. Damage from flooding includes inundation of land and property, erosion, deposition of sediment and debris, and the force of the water itself, which can damage property. The high flood hazard in the study area results from the complex interaction of the area’s rugged topography and seasonal weather patterns that deliver moisture to southwestern Utah. Three types of floods typically occur in the study area: riverine (stream) floods, flash floods/debris flows, and sheetfloods. All three types of floods are associated with natural climatic fluctuations and may, under certain circumstances, occur in combination with each other. The risk from flooding can be significantly increased by human activities such as placing structures The Flood-Hazard Map is based on limited geological, geotechnical, and hydrological data; site-specific studies are required to produce more detailed flood-hazard information. The map also depends on the quality of those data, which varies throughout the study area. The mapped boundaries of the flood-hazard categories are approximate and subject to change with additional information. The flood hazard at any particular site may be different than shown because of geological and hydrological variations within a map unit, gradational and approximate map-unit boundaries, and the generalized map scale. Small, localized areas of higher or lower flood hazard may exist within any given hazard area, but their identification is precluded because of limitations of map scale. The map is not intended for use at scales other than the published scale, and is designed for use in general planning to indicate the need for site-specific studies. William R. Lund, Tyler R. Knudsen, Garrett S. Vice, and Lucas M. Shaw 2008 PLATE 3 EROSION HAZARD ZONES Erosion-hazard zones: these zones are independent of FIRMs 100-year flood zones, and are intended to prevent damage from erosion during flooding, “whether or not the property is located in a FIRMs 100-year flood zone” (CH2MHILL, 1997). Erosion-hazard zones were delineated by JE Fuller/Hydrology & Geomorphology, Inc, (2005, 2007a, 2007b) and are based chiefly on a geomorphic analysis of river behavior over time, and are determined through a combination of air photo interpretation, field observations, geology and soils mapping, and consideration of the location and design of structures in active stream channels including bridges, water diversion dams, and channel stabilization structures. Alternating yellow and black bar indicates the erosion-hazard zone study limit. HAZARD REDUCTION Early recognition and avoidance of areas subject to flooding are the most effective means of flood-hazard reduction. However, avoidance may not always be a viable or cost-effective hazard-reduction option, especially for existing developments, and other techniques are available to reduce potential flood damage. These may include, but are not limited to, source-area stabilization, engineered protective structures, flood and debris-flow warning systems, and floodproofing. Some of these techniques can be expensive and their cost versus benefit ratio should be carefully evaluated. With regard to sheetflooding, a properly sized and integrated system of street and storm drains is usually adequate to mitigate this hazard. If hazard-reduction techniques are not implemented, risk may be accepted, but an informed decision is only possible if the flood potential and consequences are clearly understood and disclosed. If the risk is significant but acceptable, the individual houses may be insured, either through NFIP, if eligible, or by a private insurance provider so damaged items covered by insurance can be repaired if flood damage occurs. Flooding studies are recommended in all hazard categories reported in the adjacent table. The first consideration in stream-flow-flooding- and debris-flow-hazard reduction is proper identification of hazard areas through detailed mapping, and qualitative assessment of the hazard (Giraud, 2004, 2005). The stream-flow-flooding- hazard assessment should determine the active flooding area, the frequency of past events, and the potential inundation and flow depths. A debris-flow-hazard assessment should determine active depositional areas, the frequency and volume of past events, and sediment burial depths. The level of detail for a hazard assessment depends on several factors including the type, nature, and location of the proposed development; the geology and physical characteristics of the drainage basin, channel, and alluvial fan; the history of previous flooding and debris-flow events; the level of risk acceptable to property owners and land-use regulators; and proposed risk-reduction measures. Where development is proposed in areas identified on the Flood-Hazard Map as having a potential flood hazard, a site-specific study should be performed early in the project design phase. A site-specific investigation can establish whether a flood and/or debris flow hazard is present at a site and provide appropriate design recommendations. placing structures and constrictions in flood plains or erosion-hazard zones, developing urban areas without adequate flood and erosion control, and poor watershed management practices, such as overgrazing or allowing indiscriminate off-road vehicle traffic. Additionally, portions of the study area are subject to inundation in the event of an unintentional release of water from an engineered water-retention or conveyance structure. For additional information about the flood hazard in the St. George – Hurricane metropolitan area, refer to the Flood- Hazard text document in this report. effectiveness is beyond the scope of this study. Through the National Flood Insurance Program (NFIP), FEMA makes federally subsidized flood insurance available to qualified individuals residing in participating communities. Many mortgage lenders require NFIP insurance before loaning money for home purchase or construction within a FIRM 100-year flood zone. Flood insurance rate maps are legal documents that govern the administration of the NFIP. Homeowners who suspect that they live within a FIRM 100-year flood zone, or individuals contemplating purchasing a home within a flood-prone area, should consult the corresponding FIRM directly and strongly consider purchasing NFIP insurance. Individuals who own their homes may elect to purchase NFIP insurance on a voluntary basis. Although this product represents the work of professional scientists, the Utah Department of Natural Resources, Utah Geological Survey, makes no warranty, expressed or implied, regarding its suitability for a particular use. The Utah Department of Natural Resources, Utah Geological Survey, shall not be liable under any circumstances for any direct, indirect, special, incidental, or consequential damages with respect to claims by users of this product. For use at 1:24,000 scale only. The Utah Geological Survey does not guarantee accuracy or completeness of data. FLOOD-HAZARD CATEGORIES BASED ON GEOLOGIC DEPOSITS MAPPED BY THE UTAH GEOLOGICAL SURVEY Very High (VH) Hazard Category Geologic Units 1 Description Hazard Type Comments High (H) Medium (M) Low (L) Qal , Qaf , Qafy, Qa, Qa/Qafo Qal , Qac, Qaec Qap , Qc, Qca, Qat Qae, Qaes, Qea Active flood plains and low terraces along perennial streams, and active alluvial fans. Stream channels, flood plains, and low terraces along ephemeral streams. Active pediment surfaces, higher stream terrace surfaces, and sloping depositional surfaces flanking upland areas. Valley bottoms receiving active deposition and minor ephemeral drainages. Riverine flood, flash flood, debris flow Flash flood, debris flow Chiefly sheetflood, possible flash flood and debris flow Sheetflood, minor flash flood Chiefly the Virgin and Santa Clara Rivers, Fort Pearce Wash, and active alluvial fans at the base of the Hurricane Cliffs. Normally dry streams with comparatively small drainage basins subject to flooding during infrequent cloudburst storms. Active depositional surfaces on the flanks and at the base of upland areas subject to flooding during infrequent cloudburst storms. Valley bottoms subject to infrequent flooding from adjacent upland areas during cloudburst storms. 1 2 1 1 1 Refer to UGS 1:24,000-scale geologic maps (see SOURCES OF DATA and REFERENCES in accompanying text) for a description of map units. The Flood-Hazard Map shows drainages covered by FIRMs, other flood-prone areas identified using geologic data, and erosion-hazard zones along the Virgin and Santa Clara Rivers and Fort Pearce Wash. The map provides a basis for requiring site-specific studies and identifies areas where FIRMs can be consulted to determine the availability of federally subsidized flood insurance. Site-specific studies can resolve uncertainties inherent in generalized hazard mapping and help ensure safety by identifying the need for flood-resistant design. However, because intense cloudburst storms may create a potential for flash floods and possible debris flows, and sheetfloods anywhere in the study area, even locations outside of identified flood-prone areas could be subject to periodic flooding. This map also shows where existing developments lie in flood-prone areas where flood-resistant-design measures should be considered. An evaluation of flood-mitigation measures already in place and their likely effectiveness UTAH GEOLOGICAL SURVEY a division of Utah Department of Natural Resources Plate 3 Utah Geological Survey Special Study 127 Geologic Hazards and Adverse Construction Conditions, St. George−Hurricane Metropolitan Area, Washington County, Utah
Transcript of PLATE 3 FLOOD-HAZARD MAP FOR THE ST. GEORGE… · ST. GEORGE–HURRICANE METROPOLITAN AREA Basemap...
08 09
06
10
18
19
19
30
07
18
08
0405 03
30
13
11
14
15
31
22
30
18
19
05
09
11
11
11
30
19
16
18
25
07
07
12
13
12
06
01
0102
09
04
15
10
14
27
22
15
24
24
26
10
13
26
03
12
21
29
22
12
15
25
23
22
27
01
23
13
23
12
20
12
10
13
24
24
29
24
25
36
13
36
1314
09
25
29
14
21
28
20
08
03
28
13
28
21
17
21
17
24
36
24
23
29
22
09
25
20
16
02
16
14
09
04
21
28
16
21
1716
15
07
36
08
3332
23
10
3131
36353534 3436 3233 3332
36
343332
26
06
06
31
30
18
19
27
07
18
31
11
30
19
11
25
11
31
18
19
11
17
11
11
0206
35
11
26
31
30
11
31
22
06
07
18
05
06
30
19
07
30
18
09
19
18
31
06
04
18
07
30
19
03
20
07
01
10
36
08
01
07
34
19
31
1715
04
06
05
03
24
29
0503
27
24
24
17
13 14
08
03
12
12
05
26
22 23
30
22
25
14
12
16
13
13
28
13
25
12
10
21
05 02
36
01
23
10
26
01
26
02
10
03
04
23
35
15
15
34
10
32
22
01
14
03
10
01
35
36
12
33
26
21
27
15
35
27
24
20
22
33 34
24
15
04
20
10
22
13
32
16
25
28
22
23
17
04
23
25
20
08
08
29
17
09
36
27
24
27
24
02
25
09
17
1613
32 34
21
01
09
36
33
12
29
12
08
25 28
33
27
21
20
29
27
28
32
05
12
14
27
16
28
15
34
29
34
24
26
35
32
28
26
35
26
32
21
25
26 25
05
23
20
2928
35
20
35
14
23
34
29
16
33
33
36
27
09
36
20
16
32
28
34
35
22
17
33
23
14
28
02
21
26
03
33
16
09
01
34
14
04
06
15
04
02
27
02
08
0102
21
17
31 32 3336 3435
35
Quail
reviR nigriV
atnaS
aralC
revi
R
nigriV
tro
F
ecra
eP
hsa
W
Bloomington
Bloomington HillsSouth
.dR sdleiF notgnihsa
W
Telegraph St.
wonS
yawk
raP
noyn
aC
tsa
E 00
2
®q
FLOOD-HAZARD MAP FOR THE ST. GEORGE–HURRICANE METROPOLITAN AREA
Basemap consists of National Agricultural Imagery Programnatural color aerial photography.
Universal Transverse Mercator Projection, zone 12.North American Datum 1983.
OldUS-91
Bloomington HillsNorth
LittleValley
§̈¦15
§̈¦15
§̈¦15
§̈¦15
Middleton
.dR r
evi
R
Sun River
St. George Blvd.
.tS f
fulB
reviR
EXPLANATION
GreenValley
Sunbrook
!(8
!(18
37 N113 15' W
!(18
eixi
D
.rD
tniuqanoT.r
D.r
DBloomington
Man O War Rd.
.dR mahgirB
§̈¦15
reviR
.dR
nigriVreviR
Stone Cliff
Knolls
Ledges
Diamond Valley
Riverside.rD
0541
1580 South
WashingtonFields
tsaE 0074
htuoS
§̈¦15
!(9
Creek
Reservoir
Sand
Hollow
Reservoir
!(9
!(59
!(9
!(17
R 16 W R 15 W
R 17 W R 16 W
T 42 ST 43 S
113 22' 30" W113 30' W113 37' 30" W R 15 W R 14 W
T 42 ST 41 S
T 41 ST 40 S
R 14 W R 13 W
R 13 W R 12 W
37 7' 30" N
37 15' N
R 17 W R 16 W
R 16 W R 15 W
R 15 W R 14 W
R 14 W R 13 W
T 41 ST 40 S
T 42 ST 41 S
T 42 ST 43 S
37 15' N
37 7' 30" N
37 N
113 22' 30" W
113 30' W
113 37' 30" W
by
FEDERAL EMERGENCY MANAGEMENT AGENCY (FEMA)FLOOD INSURANCE RATE MAP (FIRM) ZONES
0.2-percent-annual-chance (or 500-year) flood plain
DISCUSSION
USING THIS MAP
MAP LIMITATIONS
SYMBOLS
Municipality boundary
Interstate Highway
State Highway
Major local surface street
Other road
troF
ecraeP hsaW
1 0 1 20.5Miles
1 0 1 20.5Kilometers
Scale 1:24,000
Approximate meandeclination, 2007
14o
HTR
ON
EU
RT
HTR
ON
CITEN
GAM
UTAH
Map Location
AE
A
AO
DER
SNIA
TNU
OM
wonS
noyn
aC
Santa ClaraHeights
dnaS
woll
oH
hsa
W
HTUOS SLLIH
tseW
kcalB
egdiR
lliH bbeW
slliH ytiC ecirP
note
lddi
M
kcal
B
egdi
R
bonihSebiK
emoD notgnihsaW
RE
NR
AW
EGD
IR
RENRA
W
YELLAV
DNAS
NIATNUOM
notgnihsaW
kcalB
egdiR
lliM
keer
C
emoD grubsirraH
keer
C
doownottoC
liau
Q
keer
C
sdeeL
keerC
eniveparG
hsaW
hsA
keer
C
SFFILC E
NACI
RR
UH
nikreV aL
keerC
nigriV
reviR
ENA
CIR
RU
H
SFFILC
dluoG
hsa
W
ellivnik
tA
hsa
W
ENA
CIR
RU
H
SFFI
LC
NIAT
NU
OM
KE
ER
C ELTTI L
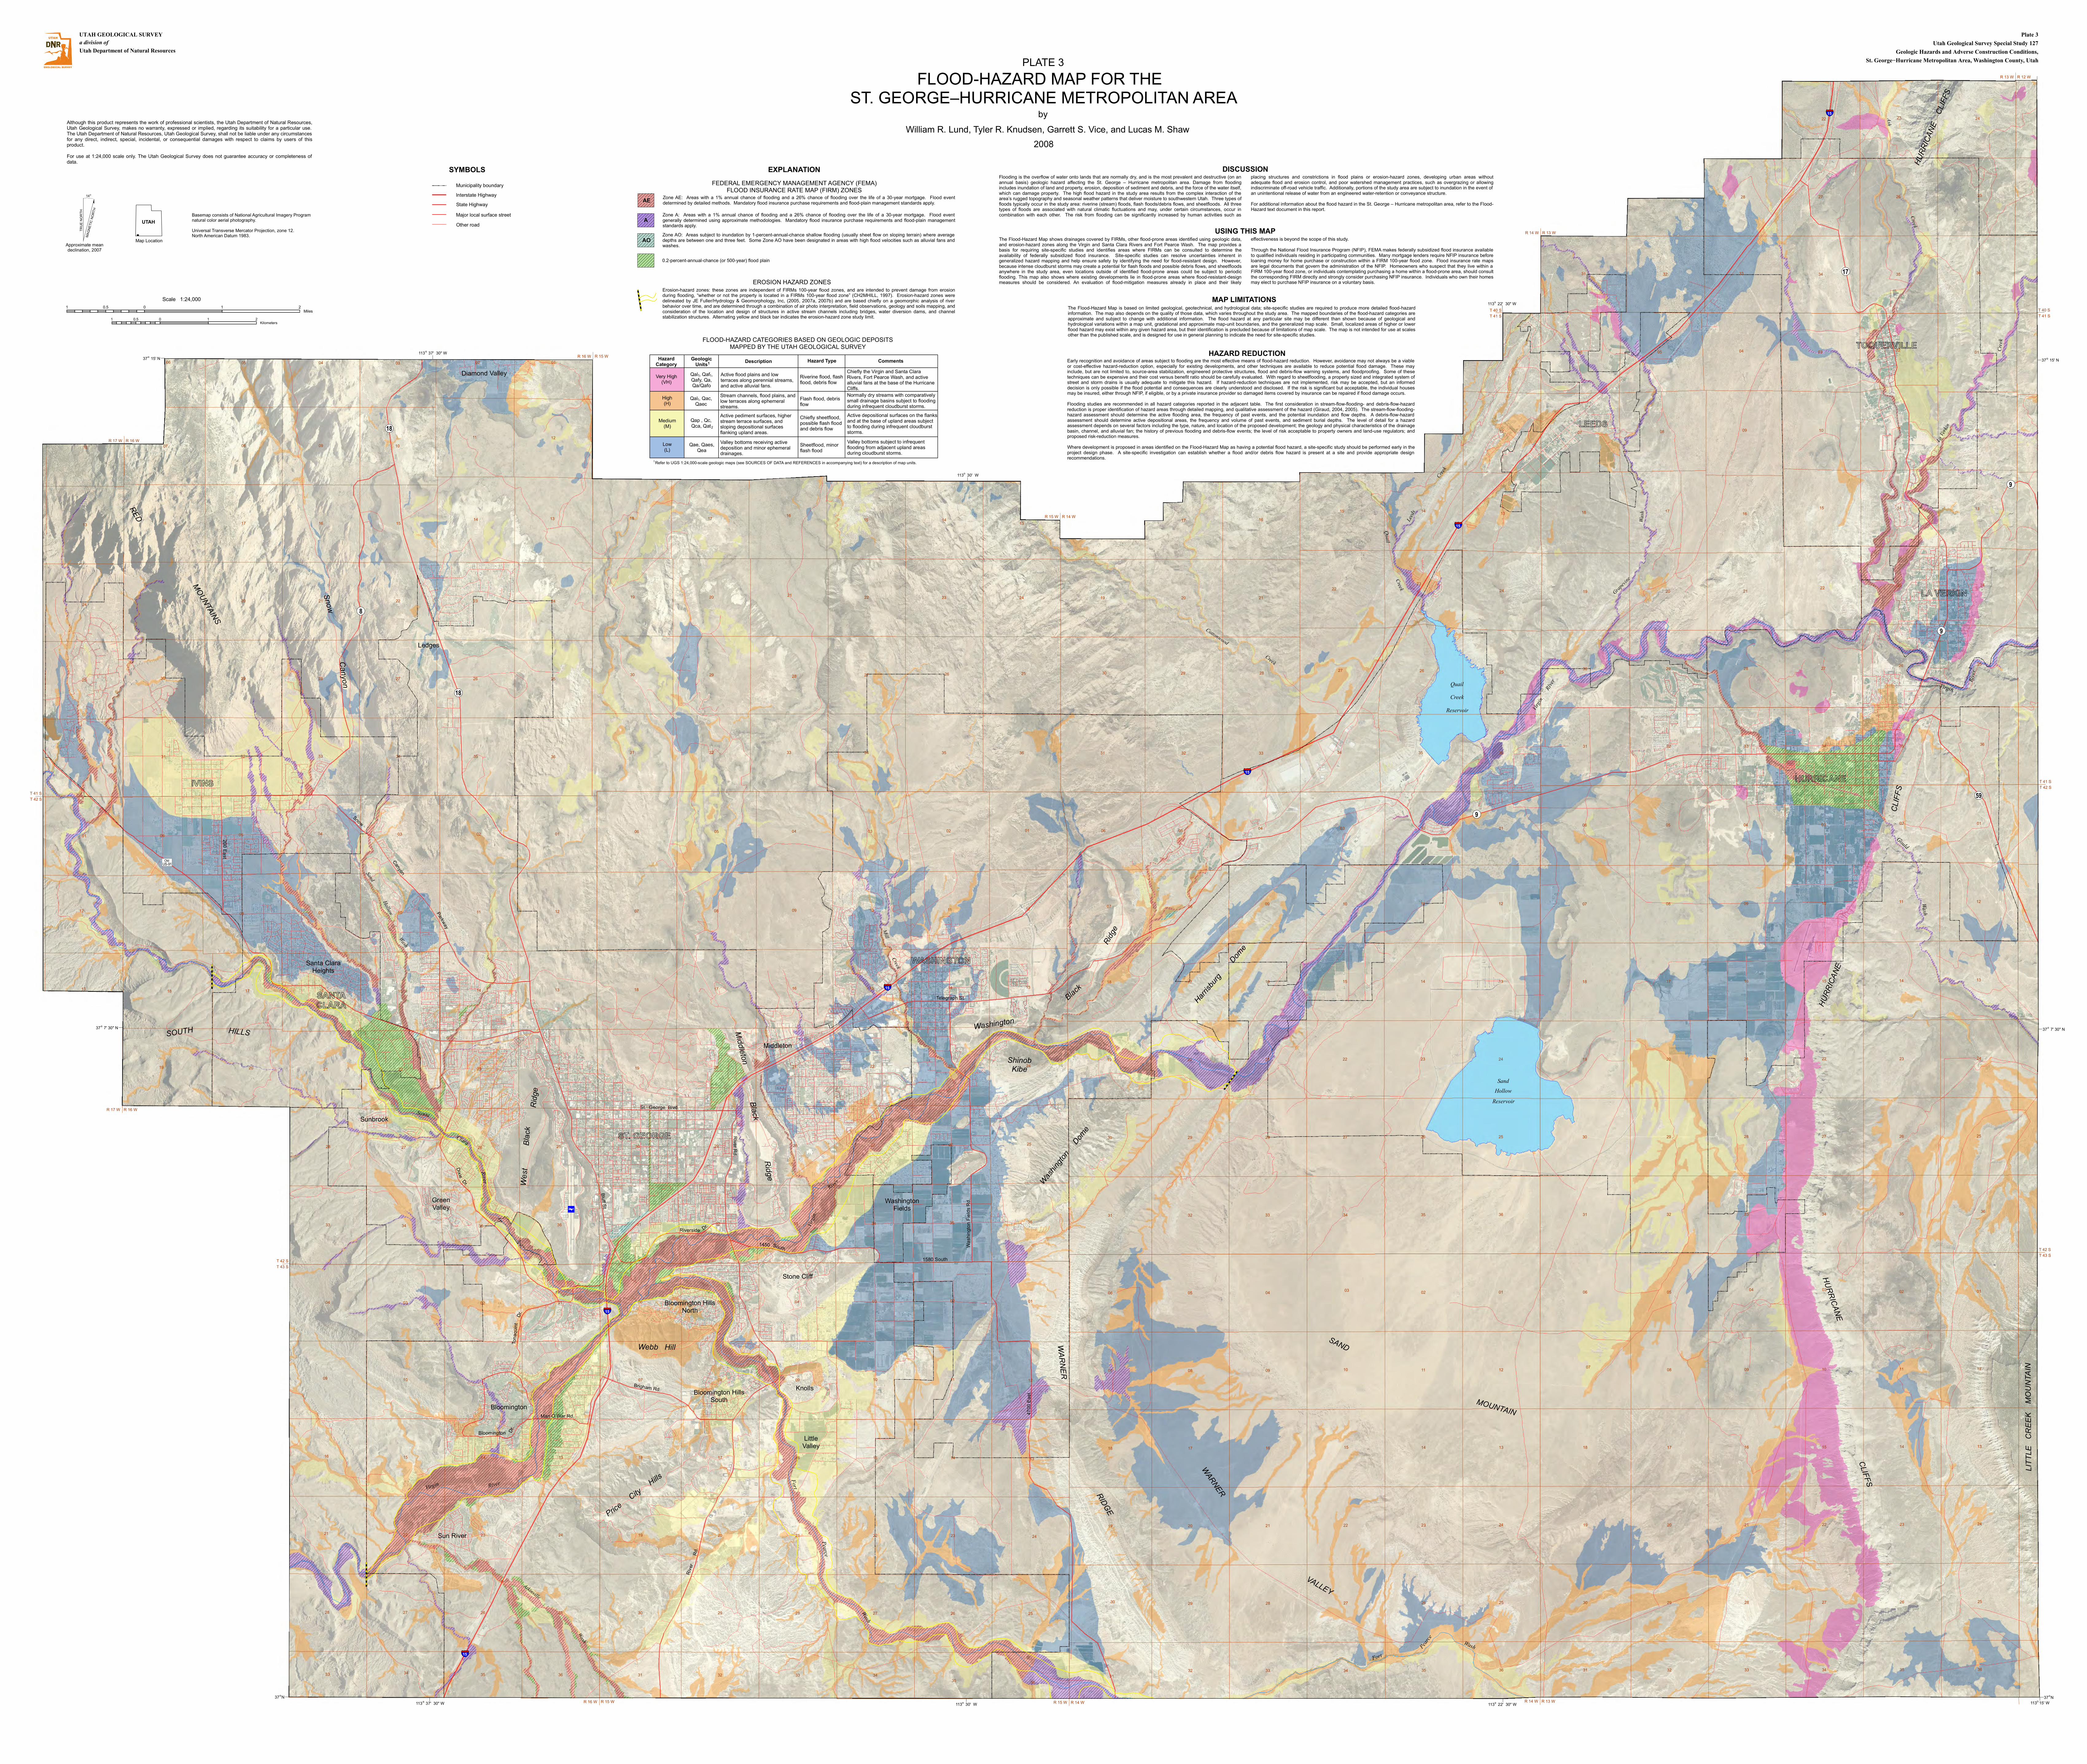
Zone AE: Areas with a 1% annual chance of flooding and a 26% chance of flooding over the life of a 30-year mortgage. Flood eventdetermined by detailed methods. Mandatory flood insurance purchase requirements and flood-plain management standards apply.
Zone A: Areas with a 1% annual chance of flooding and a 26% chance of flooding over the life of a 30-year mortgage. Flood eventgenerally determined using approximate methodologies. Mandatory flood insurance purchase requirements and flood-plain managementstandards apply.
Zone AO: Areas subject to inundation by 1-percent-annual-chance shallow flooding (usually sheet flow on sloping terrain) where averagedepths are between one and three feet. Some Zone AO have been designated in areas with high flood velocities such as alluvial fans andwashes.
Flooding is the overflow of water onto lands that are normally dry, and is the most prevalent and destructive (on anannual basis) geologic hazard affecting the St. George – Hurricane metropolitan area. Damage from floodingincludes inundation of land and property, erosion, deposition of sediment and debris, and the force of the water itself,which can damage property. The high flood hazard in the study area results from the complex interaction of thearea’s rugged topography and seasonal weather patterns that deliver moisture to southwestern Utah. Three types offloods typically occur in the study area: riverine (stream) floods, flash floods/debris flows, and sheetfloods. All threetypes of floods are associated with natural climatic fluctuations and may, under certain circumstances, occur incombination with each other. The risk from flooding can be significantly increased by human activities such asplacing structures
The Flood-Hazard Map is based on limited geological, geotechnical, and hydrological data; site-specific studies are required to produce more detailed flood-hazardinformation. The map also depends on the quality of those data, which varies throughout the study area. The mapped boundaries of the flood-hazard categories areapproximate and subject to change with additional information. The flood hazard at any particular site may be different than shown because of geological andhydrological variations within a map unit, gradational and approximate map-unit boundaries, and the generalized map scale. Small, localized areas of higher or lowerflood hazard may exist within any given hazard area, but their identification is precluded because of limitations of map scale. The map is not intended for use at scalesother than the published scale, and is designed for use in general planning to indicate the need for site-specific studies.
William R. Lund, Tyler R. Knudsen, Garrett S. Vice, and Lucas M. Shaw2008
PLATE 3
EROSION HAZARD ZONESErosion-hazard zones: these zones are independent of FIRMs 100-year flood zones, and are intended to prevent damage from erosionduring flooding, “whether or not the property is located in a FIRMs 100-year flood zone” (CH2MHILL, 1997). Erosion-hazard zones weredelineated by JE Fuller/Hydrology & Geomorphology, Inc, (2005, 2007a, 2007b) and are based chiefly on a geomorphic analysis of riverbehavior over time, and are determined through a combination of air photo interpretation, field observations, geology and soils mapping, andconsideration of the location and design of structures in active stream channels including bridges, water diversion dams, and channelstabilization structures. Alternating yellow and black bar indicates the erosion-hazard zone study limit.
HAZARD REDUCTIONEarly recognition and avoidance of areas subject to flooding are the most effective means of flood-hazard reduction. However, avoidance may not always be a viableor cost-effective hazard-reduction option, especially for existing developments, and other techniques are available to reduce potential flood damage. These mayinclude, but are not limited to, source-area stabilization, engineered protective structures, flood and debris-flow warning systems, and floodproofing. Some of thesetechniques can be expensive and their cost versus benefit ratio should be carefully evaluated. With regard to sheetflooding, a properly sized and integrated system ofstreet and storm drains is usually adequate to mitigate this hazard. If hazard-reduction techniques are not implemented, risk may be accepted, but an informeddecision is only possible if the flood potential and consequences are clearly understood and disclosed. If the risk is significant but acceptable, the individual housesmay be insured, either through NFIP, if eligible, or by a private insurance provider so damaged items covered by insurance can be repaired if flood damage occurs.
Flooding studies are recommended in all hazard categories reported in the adjacent table. The first consideration in stream-flow-flooding- and debris-flow-hazardreduction is proper identification of hazard areas through detailed mapping, and qualitative assessment of the hazard (Giraud, 2004, 2005). The stream-flow-flooding-hazard assessment should determine the active flooding area, the frequency of past events, and the potential inundation and flow depths. A debris-flow-hazardassessment should determine active depositional areas, the frequency and volume of past events, and sediment burial depths. The level of detail for a hazardassessment depends on several factors including the type, nature, and location of the proposed development; the geology and physical characteristics of the drainagebasin, channel, and alluvial fan; the history of previous flooding and debris-flow events; the level of risk acceptable to property owners and land-use regulators; andproposed risk-reduction measures.
Where development is proposed in areas identified on the Flood-Hazard Map as having a potential flood hazard, a site-specific study should be performed early in theproject design phase. A site-specific investigation can establish whether a flood and/or debris flow hazard is present at a site and provide appropriate designrecommendations.
placing structures and constrictions in flood plains or erosion-hazard zones, developing urban areas withoutadequate flood and erosion control, and poor watershed management practices, such as overgrazing or allowingindiscriminate off-road vehicle traffic. Additionally, portions of the study area are subject to inundation in the event ofan unintentional release of water from an engineered water-retention or conveyance structure.
For additional information about the flood hazard in the St. George – Hurricane metropolitan area, refer to the Flood-Hazard text document in this report.
effectiveness is beyond the scope of this study.
Through the National Flood Insurance Program (NFIP), FEMA makes federally subsidized flood insurance availableto qualified individuals residing in participating communities. Many mortgage lenders require NFIP insurance beforeloaning money for home purchase or construction within a FIRM 100-year flood zone. Flood insurance rate mapsare legal documents that govern the administration of the NFIP. Homeowners who suspect that they live within aFIRM 100-year flood zone, or individuals contemplating purchasing a home within a flood-prone area, should consultthe corresponding FIRM directly and strongly consider purchasing NFIP insurance. Individuals who own their homesmay elect to purchase NFIP insurance on a voluntary basis.
Although this product represents the work of professional scientists, the Utah Department of Natural Resources,Utah Geological Survey, makes no warranty, expressed or implied, regarding its suitability for a particular use.The Utah Department of Natural Resources, Utah Geological Survey, shall not be liable under any circumstancesfor any direct, indirect, special, incidental, or consequential damages with respect to claims by users of thisproduct.
For use at 1:24,000 scale only. The Utah Geological Survey does not guarantee accuracy or completeness ofdata.
FLOOD-HAZARD CATEGORIES BASED ON GEOLOGIC DEPOSITSMAPPED BY THE UTAH GEOLOGICAL SURVEY
Very High(VH)
HazardCategory
GeologicUnits1 Description Hazard Type Comments
High(H)
Medium(M)
Low(L)
Qal , Qaf ,Qafy, Qa,Qa/Qafo
Qal , Qac,Qaec
Qap , Qc,Qca, Qat
Qae, Qaes,Qea
Active flood plains and lowterraces along perennial streams,and active alluvial fans.
Stream channels, flood plains, and low terraces along ephemeral streams.
Active pediment surfaces, higher stream terrace surfaces, and sloping depositional surfaces flanking upland areas.
Valley bottoms receiving active deposition and minor ephemeral drainages.
Riverine flood, flash flood, debris flow
Flash flood, debrisflow
Chiefly sheetflood, possible flash flood and debris flow
Sheetflood, minor flash flood
Chiefly the Virgin and Santa Clara Rivers, Fort Pearce Wash, and active alluvial fans at the base of the Hurricane Cliffs.Normally dry streams with comparatively small drainage basins subject to flooding during infrequent cloudburst storms.
Active depositional surfaces on the flanks and at the base of upland areas subject to flooding during infrequent cloudburst storms.
Valley bottoms subject to infrequent flooding from adjacent upland areas during cloudburst storms.
1
2
1
1
1Refer to UGS 1:24,000-scale geologic maps (see SOURCES OF DATA and REFERENCES in accompanying text) for a description of map units.
The Flood-Hazard Map shows drainages covered by FIRMs, other flood-prone areas identified using geologic data,and erosion-hazard zones along the Virgin and Santa Clara Rivers and Fort Pearce Wash. The map provides abasis for requiring site-specific studies and identifies areas where FIRMs can be consulted to determine theavailability of federally subsidized flood insurance. Site-specific studies can resolve uncertainties inherent ingeneralized hazard mapping and help ensure safety by identifying the need for flood-resistant design. However,because intense cloudburst storms may create a potential for flash floods and possible debris flows, and sheetfloodsanywhere in the study area, even locations outside of identified flood-prone areas could be subject to periodicflooding. This map also shows where existing developments lie in flood-prone areas where flood-resistant-designmeasures should be considered. An evaluation of flood-mitigation measures already in place and their likelyeffectiveness
UTAH GEOLOGICAL SURVEYa division of
Utah Department of Natural Resources
Plate 3
Utah Geological Survey Special Study 127
Geologic Hazards and Adverse Construction Conditions,
St. George−Hurricane Metropolitan Area, Washington County, Utah