Plasticity of the Systemic Inflammatory Response to …zhang/publications/PLoSONE-vap.pdf · ¤a...
14
Plasticity of the Systemic Inflammatory Response to Acute Infection during Critical Illness: Development of the Riboleukogram Jonathan E. McDunn 1,2. , Kareem D. Husain 1. , Ashoka D. Polpitiya 1.¤a , Anton Burykin 1 , Jianhua Ruan 3 , Qing Li 4 , William Schierding 1 , Nan Lin 4 , David Dixon 1 , Weixiong Zhang 3,5 , Craig M. Coopersmith 1,2 , W. Michael Dunne 6 , Marco Colonna 7 , Bijoy K. Ghosh 8¤b , J. Perren Cobb 1,5 * 1 Center for Critical Illness and Health Engineering, Department of Surgery, Washington University in St. Louis, St. Louis, Missouri, United States of America, 2 Department of Anesthesiology, Washington University in St. Louis, St. Louis, Missouri, United States of America, 3 Department of Computer Science and Engineering, Washington University in St. Louis, St. Louis, Missouri, United States of America, 4 Department of Mathematics, Washington University in St. Louis, St. Louis, Missouri, United States of America, 5 Department of Genetics, Washington University in St. Louis, St. Louis, Missouri, United States of America, 6 Department of Molecular Microbiology, Washington University in St. Louis, St. Louis, Missouri, United States of America, 7 Department of Pathology and Immunology, Washington University in St. Louis, St. Louis, Missouri, United States of America, 8 Department of Electrical and Systems Engineering, Washington University in St. Louis, St. Louis, Missouri, United States of America Abstract Background: Diagnosis of acute infection in the critically ill remains a challenge. We hypothesized that circulating leukocyte transcriptional profiles can be used to monitor the host response to and recovery from infection complicating critical illness. Methodology/Principal Findings: A translational research approach was employed. Fifteen mice underwent intratracheal injections of live P. aeruginosa, P. aeruginosa endotoxin, live S. pneumoniae, or normal saline. At 24 hours after injury, GeneChip microarray analysis of circulating buffy coat RNA identified 219 genes that distinguished between the pulmonary insults and differences in 7-day mortality. Similarly, buffy coat microarray expression profiles were generated from 27 mechanically ventilated patients every two days for up to three weeks. Significant heterogeneity of VAP microarray profiles was observed secondary to patient ethnicity, age, and gender, yet 85 genes were identified with consistent changes in abundance during the seven days bracketing the diagnosis of VAP. Principal components analysis of these 85 genes appeared to differentiate between the responses of subjects who did versus those who did not develop VAP, as defined by a general trajectory (riboleukogram) for the onset and resolution of VAP. As patients recovered from critical illness complicated by acute infection, the riboleukograms converged, consistent with an immune attractor. Conclusions/Significance: Here we present the culmination of a mouse pneumonia study, demonstrating for the first time that disease trajectories derived from microarray expression profiles can be used to quantitatively track the clinical course of acute disease and identify a state of immune recovery. These data suggest that the onset of an infection-specific transcriptional program may precede the clinical diagnosis of pneumonia in patients. Moreover, riboleukograms may help explain variance in the host response due to differences in ethnic background, gender, and pathogen. Prospective clinical trials are indicated to validate our results and test the clinical utility of riboleukograms. Citation: McDunn JE, Husain KD, Polpitiya AD, Burykin A, Ruan J, et al (2008) Plasticity of the Systemic Inflammatory Response to Acute Infection during Critical Illness: Development of the Riboleukogram. PLoS ONE 3(2): e1564. doi:10.1371/journal.pone.0001564 Editor: Mervyn Singer, University College London, United Kingdom Received September 24, 2007; Accepted December 12, 2007; Published February 13, 2008 Copyright: ß 2008 McDunn et al. This is an open-access article distributed under the terms of the Creative Commons Attribution License, which permits unrestricted use, distribution, and reproduction in any medium, provided the original author and source are credited. Funding: This work was supported in part by NIH GM075023 (JPC), NIH GM008795 (JEM), NSF IIS-0535257 (WZ), the American College of Surgeons Clowes Career Development Award (JPC), a Barnes-Jewish Hospital Foundation Research Award (JPC), and an institutional grant from Washington University in St. Louis (JEM). Competing Interests: The authors have declared that no competing interests exist. *E-mail: [email protected] ¤a Current address: Pacific Northwest National Laboratory, Richland, Washington, United States of America ¤b Current address: Department of Mathematics and Statistics, Texas Tech University, Lubbock, Texas, United States of America . These authors contributed equally to this work. Introduction Critical illness is marked by organ dysfunction, the need for vital support, and a high risk of death, occurring against a backdrop of systemic immune activation. This immune activation may begin as an adaptive response to the initial injury, however, as the disease progresses, the immune response may become maladaptive or paralyzed [1,2]. Critical illness-associated immune dysregulation has been described as the interplay between pro- and anti- inflammatory responses [3], although recent evidence suggests a mixed inflammatory state is common [4,5]. While this process has been qualitatively described, there are no quantitative diagnostic or prognostic tools that have been validated clinically to assess immune status in the critically ill [6]. Consequently, infectious complications are not only common in intensive care units but also difficult to diagnose [7]. This has contributed to inappropriate use PLoS ONE | www.plosone.org 1 February 2008 | Volume 3 | Issue 2 | e1564
Transcript of Plasticity of the Systemic Inflammatory Response to …zhang/publications/PLoSONE-vap.pdf · ¤a...

Plasticity of the Systemic Inflammatory Response toAcute Infection during Critical Illness: Development ofthe RiboleukogramJonathan E. McDunn1,2., Kareem D. Husain1., Ashoka D. Polpitiya1.¤a, Anton Burykin1, Jianhua Ruan3,
Qing Li4, William Schierding1, Nan Lin4, David Dixon1, Weixiong Zhang3,5, Craig M. Coopersmith1,2, W.
Michael Dunne6, Marco Colonna7, Bijoy K. Ghosh8¤b, J. Perren Cobb1,5*
1 Center for Critical Illness and Health Engineering, Department of Surgery, Washington University in St. Louis, St. Louis, Missouri, United States of America, 2 Department
of Anesthesiology, Washington University in St. Louis, St. Louis, Missouri, United States of America, 3 Department of Computer Science and Engineering, Washington
University in St. Louis, St. Louis, Missouri, United States of America, 4 Department of Mathematics, Washington University in St. Louis, St. Louis, Missouri, United States of
America, 5 Department of Genetics, Washington University in St. Louis, St. Louis, Missouri, United States of America, 6 Department of Molecular Microbiology, Washington
University in St. Louis, St. Louis, Missouri, United States of America, 7 Department of Pathology and Immunology, Washington University in St. Louis, St. Louis, Missouri,
United States of America, 8 Department of Electrical and Systems Engineering, Washington University in St. Louis, St. Louis, Missouri, United States of America
Abstract
Background: Diagnosis of acute infection in the critically ill remains a challenge. We hypothesized that circulating leukocytetranscriptional profiles can be used to monitor the host response to and recovery from infection complicating critical illness.
Methodology/Principal Findings: A translational research approach was employed. Fifteen mice underwent intratrachealinjections of live P. aeruginosa, P. aeruginosa endotoxin, live S. pneumoniae, or normal saline. At 24 hours after injury,GeneChip microarray analysis of circulating buffy coat RNA identified 219 genes that distinguished between the pulmonaryinsults and differences in 7-day mortality. Similarly, buffy coat microarray expression profiles were generated from 27mechanically ventilated patients every two days for up to three weeks. Significant heterogeneity of VAP microarray profileswas observed secondary to patient ethnicity, age, and gender, yet 85 genes were identified with consistent changes inabundance during the seven days bracketing the diagnosis of VAP. Principal components analysis of these 85 genesappeared to differentiate between the responses of subjects who did versus those who did not develop VAP, as defined by ageneral trajectory (riboleukogram) for the onset and resolution of VAP. As patients recovered from critical illnesscomplicated by acute infection, the riboleukograms converged, consistent with an immune attractor.
Conclusions/Significance: Here we present the culmination of a mouse pneumonia study, demonstrating for the first timethat disease trajectories derived from microarray expression profiles can be used to quantitatively track the clinical course ofacute disease and identify a state of immune recovery. These data suggest that the onset of an infection-specifictranscriptional program may precede the clinical diagnosis of pneumonia in patients. Moreover, riboleukograms may helpexplain variance in the host response due to differences in ethnic background, gender, and pathogen. Prospective clinicaltrials are indicated to validate our results and test the clinical utility of riboleukograms.
Citation: McDunn JE, Husain KD, Polpitiya AD, Burykin A, Ruan J, et al (2008) Plasticity of the Systemic Inflammatory Response to Acute Infection during CriticalIllness: Development of the Riboleukogram. PLoS ONE 3(2): e1564. doi:10.1371/journal.pone.0001564
Editor: Mervyn Singer, University College London, United Kingdom
Received September 24, 2007; Accepted December 12, 2007; Published February 13, 2008
Copyright: � 2008 McDunn et al. This is an open-access article distributed under the terms of the Creative Commons Attribution License, which permitsunrestricted use, distribution, and reproduction in any medium, provided the original author and source are credited.
Funding: This work was supported in part by NIH GM075023 (JPC), NIH GM008795 (JEM), NSF IIS-0535257 (WZ), the American College of Surgeons Clowes CareerDevelopment Award (JPC), a Barnes-Jewish Hospital Foundation Research Award (JPC), and an institutional grant from Washington University in St. Louis (JEM).
Competing Interests: The authors have declared that no competing interests exist.
*E-mail: [email protected]
¤a Current address: Pacific Northwest National Laboratory, Richland, Washington, United States of America¤b Current address: Department of Mathematics and Statistics, Texas Tech University, Lubbock, Texas, United States of America
.These authors contributed equally to this work.
Introduction
Critical illness is marked by organ dysfunction, the need for vital
support, and a high risk of death, occurring against a backdrop of
systemic immune activation. This immune activation may begin as
an adaptive response to the initial injury, however, as the disease
progresses, the immune response may become maladaptive or
paralyzed [1,2]. Critical illness-associated immune dysregulation
has been described as the interplay between pro- and anti-
inflammatory responses [3], although recent evidence suggests a
mixed inflammatory state is common [4,5]. While this process has
been qualitatively described, there are no quantitative diagnostic
or prognostic tools that have been validated clinically to assess
immune status in the critically ill [6]. Consequently, infectious
complications are not only common in intensive care units but also
difficult to diagnose [7]. This has contributed to inappropriate use
PLoS ONE | www.plosone.org 1 February 2008 | Volume 3 | Issue 2 | e1564
of broad-spectrum antibiotics and the emergence of multi-drug
resistant organisms [8,9].
A few years ago, studies employing cultured human cells
suggested that instead of a single molecule (e.g., IL-6), a
constellation of molecules could be used to monitor the
complexities of the inflammatory response, serving as markers of
infection [10,11]. Miniaturized, multiplexed assays provide a rapid
method for the unbiased screening of thousands of molecular
species in a single assay [12]. These technological advances
provided the potential for investigators to leverage high-through-
put assays to better study the host response to and recovery from
critical illness and injury [13,14]. Improved molecular diagnostics
and prognostics, a better understanding of the complexity of
systemic inflammation, and new therapeutic targets are expected
deliverables, as reviewed recently [4,12].
Based upon our ability to diagnose abdominal sepsis in pilot
mouse studies [15], we hypothesized that the host response to
infection could not only differentiate between infected and non-
infected states, but could also be used clinically to differentiate
between the host response to infectious agents and to model the
host response to and recovery from infectious perturbations.
Pneumonia was chosen as an immune system perturbation, given
its relative frequency and considerable cost in terms of patient
morbidity and health care expense [7,16]. A bench-to-bedside,
translational approach was employed to study the host response to
pneumonia in critically ill subjects, comparing the informational
content of standard clinical parameters and plasma cytokines to
changes in the RNA abundance in circulating leukocytes.
MethodsMice, experimental procedures, and samples
Care and use of laboratory animals were conducted in
accordance with a protocol approved by the Washington
University Animal Studies Committee, in compliance with
guidelines (N01-RR-2-2135) prepared by the Committee on Care
and Use of Laboratory Animals, Division of Research Resources,
National Institutes of Health. Seven to nine week-old, male
C57BL/6 mice were purchased (Harlan, Inc. Madison WI) and
allowed to acclimatize for at least one week in a temperature- and
light-controlled, pathogen-free barrier facility. Treated animals
and concurrently studied controls were observed at 24 hour
intervals for survival over eight days. In additional cohorts, whole
blood was collected at 24 hours after injury.
The 5 experimental groups were selected to reflect clinically
important distinctions relevant to care of ICU patients: high
mortality Gram-negative pneumonia with Pseudomonas aeruginosa
(40 ml of 0.3 McFarland culture, 90% 7-day mortality (,2–46107
organisms)), high mortality Gram-positive pneumonia with
Streptococcus pneumoniae (60 ml of 0.5 McFarland culture, 85% 7-
day mortality (,1.8–3.66107 organisms)), and moderate mortality
Gram-negative pneumonia with Pseudomonas aeruginosa (20 ml of 0.1
McFarland culture, 50% 7-day mortality (,2–46106 organisms)).
To induce severe systemic inflammation without infection,
intratracheal (i.t.) injection of P. aeruginosa lipopolysaccharide
(500 mg in 50 ml 0.9% normal saline; Sigma, St. Louis) was
performed (LPS group, 90% 7-day mortality). Mice injected i.t.
with normal saline vehicle acted as the concurrent control group
(saline group, 0% 7-day mortality). Previously reported protocols
were used to intratracheally instill fluid into the lung [17,18]. The
census of surviving mice was recorded at 24-hour intervals for
seven days.
In three additional cohorts of animals, blood was collected into
an EDTA-coated syringe from the inferior vena cava being careful
to avoid contamination of the needle with other tissues. Blood was
diluted 1:1 with normal saline, pooled for the 8 animals in each
treatment group, and separated into cells and plasma. Plasma was
stored at 280uC until use. Erythrocytes were lysed hypotonically
and RNA from peripheral leukocytes was harvested using RLT
(Qiagen) and stored at 280uC until use. The 24 hour time point
after injury was chosen as a time before appreciable mortality
develops in animals with significant lung injury.
Target cRNA and gene expression signalEach RNA sample was run on one GeneChip (a total of 15
mouse blood GeneChips from 120 animals). Total RNA from
mouse blood was extracted as previously described [19]. cRNA
target for GeneChip hybridization was prepared from total RNA
(Affymetrix, Santa Clara, CA). Both total RNA and cRNA were
electrophoretically assessed for quality (Agilent Bioanalyzer). The
mouse blood cRNA samples were hybridized with the U74Av2
GeneChip (approximately 12,400 probe sets). Fluorescent hybrid-
ization signal was detected using a GeneChip Scanner 3000
(Affymetrix). These mouse microarray data (and those for patients,
see below) have been deposited in NCBI’s Gene Expression
Omnibus (GEO, http://www.ncbi.nlm.nih.gov/geo/) and are
accessible through GEO Series accession number GSE6377.
Data analysis and statistical tests for differentialexpression
Expression values were calculated from GeneChip .cel files
using Robust Multichip Average (RMA) software [20]. Differen-
tially expressed genes were identified using a mixed-model analysis
of variance (ANOVA) and linear contrasts (PartekH InferTM
software) as previously reported [15]. Leave-one out cross-
validation (k-nearest neighbors, k = 2) was used to determine the
reproducibility within this experimental set. Principal components
analysis (PCA) was used to visually explore global effects for
genome-wide trends, unexpected effects, and outliers in the
expression data (PartekH ProTM software, www.partek.com).
Patient studies. After obtaining informed consent, venous
blood (7 ml) was collected from mechanically ventilated, non-
septic patients according to a protocol approved by the
Washington University Institutional Review Board (#2004-
0294). Patients were candidates for enrollment if they were on
mechanical ventilation in the surgical ICU medical ICU,
neurological ICU, or cardiothoracic ICU (CTICU) for 48 hours,
were expected by the attending ICU physician to need mechanical
ventilation for at least another 48 hours at the time of enrollment,
and could provide written informed consent (from the patient or
legal surrogate). VAP was diagnosed by the ICU attending
physician, consistent with recently reported recommendations
[16], without input from the investigators. Clinical data were
entered into a VAP database, including gender, ethnic
background, age, admitting diagnosis, type of ICU, APACHE II
score, airway sampling technique and culture results, initial
antibiotic therapy, and maximal clinical pulmonary infection
score (CPIS) calculated based upon available data (several patients
lacked daily arterial blood gas measurements to calculate PaO2/
FiO2 ratios) [21]. Patient blood was processed as described
previously to minimize red blood cell RNA artifact [13]; briefly,
samples were centrifuged (4006g 109 RT) to form a buffy coat and
to separate plasma from cells. Plasma was withdrawn and stored at
280uC until use. Blood cells were diluted into EL buffer (90 ml)
(Qiagen) and incubated on ice for 159. Leukocytes were pelleted by
centrifugation (4006g 109 4uC), washed with EL buffer (30 ml)
and lysed into RLT buffer (Qiagen) containing 1% b-
mercaptoethanol. Genomic DNA was sheared by repeated
Development of Riboleukogram
PLoS ONE | www.plosone.org 2 February 2008 | Volume 3 | Issue 2 | e1564

passage through an 18 gauge needle and the resultant material was
stored at 280uC.
Patient plasma cytokine analysis. Cytokines (GRO-a,
IFN-c; IL1-b; IL1Ra; IL1sr2; IL4; IL6; IL8; IL10; IL12; IL18;
MCP1; MIP1a; MIP1b; NGF; RANTES; TNFa; TNF-sr1; TNF-
sr2) were measured using a microarray immunoassay as previously
described [22]. Procalcitonin was measured according to the
manufacturer’s instruction (BRAHMS PCT LIA kit, Product
number 354.1).
Patient blood leukocyte mRNA profiling. RNA was
extracted, amplified and assessed for quality as described for
murine samples. cRNA was hybridized against the HG-FOCUS
array (Affymetrix, .8700 probe sets encoding ,8400 genes) and
imaged as described for murine samples. Orthologs of murine
genes were identified by comparison of the GeneChip Identifiers
using the NetAffx Toolkit (Affymetrix). Consistent with recently
published consensus statements [16,21], clinical data were judged
to determine when (if ever) each patient developed ventilator-
associated pneumonia, with each patient acting as her/his own
control. The timeline for each patient was defined such that the
day of VAP diagnosis by the ICU attending physician was defined
as day 0. A seven day time window from the gene expression time
series was chosen as days 23, 21, 0, 1, and 3, with day 0 being the
day that a patient was diagnosed as having VAP by the attending
physician. Because blood samples were collected every other day,
patients’ samples were collected either on days 22, 0, +2 or on
days 23, 21, +1, +3 relative to the VAP day of diagnosis
described as time 0. For the purpose of analyzing the data from
those patients who had samples collected on ‘‘odd’’ days, the time
0 data for these patients were interpolated. Those mRNA species
whose abundance changed concordantly among the patients
during the 7-day window surrounding the date of diagnosis were
identified using extraction of Differential Gene Expression
(EDGE) software [23]. Online databases were used to determine
gene annotation and functional categorization (DAVID 2.0
accessed 16 November 2006) [24].
Clustering algorithm. Patient genes identified by EDGE
were clustered as described previously [25]. Briefly, a gene co-
expression network was constructed by connecting every gene to
the top d genes (d = 5 in this study) to which its expression profile is
most similar. The network then was partitioned into a set of
communities, i.e., relatively densely connected sub-graphs, by a
spectral graph algorithm [26]. The genes within each community
formed a cluster. The number of clusters was determined
automatically by the algorithm in order to maximize a
modularity score [25,26]. Gene expression data were normalized
prior to clustering such that the expression levels of each gene for
each patient had a mean of zero and a standard deviation of one.
Similarity between two gene expression profiles was measured by
Pearson correlation coefficient.
Karhunen-Loeve decomposition of microarray gene
expression data. To determine the dynamics of the host
response to pneumonia, we constructed first a raw gene expression
matrix corresponding to the ith pneumonia patient after RMA
normalization [20] to be Xi = [xi(1) … xi(NT)] where xi(k)MRN,
(k = 1,…,NT, i = 1,…11, and N = 8793 genes) is the gene expression
vector at k th time point. k = 1,…,NT where NT = 11 for most
patients, correspond to sample collecting days 1, 3, 5, …, 21. Note
that for few patients, only a portion of the time series (i.e., less than
11 points) was available.
For the EDGE-selected genes, the data were projected onto a
smaller dimensional space using the series expansion method
similar to principal components analysis, Karhunen-Loeve
Decomposition (KLD) [27]. In order to preserve the alignment
of the time series with respect to day 0 of VAP, we first obtained
the average expression vectors x kð Þ, k = 1,2,…9, by averaging the
expression values at days corresponding to 23,21,…,13 in all
patients (corresponding to the nine time points that most patients
had samples collected). The KLD method looks for a basis
y1,y2,…yN so that one can expand x kð Þ as
x kð Þ~ limN??
XN
i~1
ai kð Þyi
where ai kð Þ~Sx kð Þ,yiT and Æ?,?æ stands for the standard inner
product.
The orthonormal basis y1,y2,…yN can be selected as the
eigenvectors of the correlation matrix C1MRN6N, obtained as
C1~1
NT
XNT
k~1
�xx kð Þð Þ �xx kð Þð ÞT :
The first principal mode y1 corresponds to a constant bias term.
Hence the most important variation is captured by y2,y3,…yN
respectively in the decreasing order. Once the orthonormal basis is
obtained, each patient data can be projected onto this basis as
aji kð Þ~Sxj kð Þ,yiT for patients j = 1, 2, … . The discrete derivative
of the coefficients aji kð Þ at time k is obtained as
aji kz1ð Þ{aj
i kð Þ:
Validation of microarray results. Select genes were
subjected to real-time quantitative PCR (RTq-PCR) for
independent confirmation of relative expression levels. cDNA
was generated and 100 ng was subjected to routine SybrGreen
RT-PCR as per manufacturer’s instruction (Applied Biosystems,
Foster City, CA). In addition, 85 genes were selected at random
from the total number on the GeneChip. The gene expression
signal from these genes was analyzed in a manner identical to that
described above. This procedure was repeated 100 times to
estimate the informational value of randomly selected genes.
Validation of the riboleukogramAfter enrollment of the first 20 patients, a second cohort of 7
patients was analyzed to validate the informational content of the
leukocyte RNA species (genes) that changed in abundance in
response to critical illness complicated by VAP. The blood
handling, processing, and GeneChip analysis protocols were
identical to those described above.
Results
Murine modelIntratracheal (i.t.) installation of saline caused no deaths over 7-
days whereas i.t. introduction of P. aeruginosa endotoxin resulted in
death of 90% of the animals studied within 96 hours (Figure 1A).
The 7-day mortality caused by live P. aeruginosa was adjusted by
varying the size of the inoculum and injuries causing 50% and
90% 7-day mortality were achieved. A dose of S. pneumoniae was
given i.t. that resulted in 85% 7-day mortality. Once these injuries
were established, three separate cohorts of mice were used for each
experimental group in the subsequent studies.
Peripheral blood was collected and pooled from groups of 4–7
mice 24 h after surgery, prior to appreciable mortality in any
group (Figure 1A). All murine RNA were of good quality based on
Development of Riboleukogram
PLoS ONE | www.plosone.org 3 February 2008 | Volume 3 | Issue 2 | e1564

the peak profiles of 18S and 28S ribosomal RNA. cRNA
generated from these samples had a uniform size distribution.
All hybridizations were of good quality; both the number of
features present (35–40%) and the signals on each array fell within
acceptable ranges [28].
Analysis of normalized gene expression data identified 219
probe sets (40 unannotated ESTs, 10 redundant probe sets, 169
annotated genes (Table S1) whose expression levels differentiated
between the five groups. Leave one out cross-validation using k-
nearest neighbors (k = 2) resulted in a 93% classification accuracy.
The single misclassified sample was from the low-dose P. aeruginosa
infection and was classified as ‘‘saline’’. These 219 genes
differentiated between the host responses to Gram-negative
bacteria, Gram-negative bacterial toxin (LPS) and Gram-positive
bacteria. The probe sets clustered into six groups (Figure 1B) and
these groups defined the gene expression cartography of the
murine response to pneumonia (Figure 1C). Genes that fell within
clusters 2 and 3 exhibited increased RNA abundance in animals
responding to high lethality insults. Genes that fell within clusters
4–6 were transcriptionally suppressed during high lethality insults.
Cluster 1 bridged the two groups. Gene ontology assignments
identified enriched molecular functions in the three distinct
groups. The bridging cluster (cluster 1) was enriched for genes
involved in the immune response (N = 10, P = 461027) and genes
with NTPase activity (N = 6, P = 561024). Clusters 2 and 3 were
enriched for genes involved in intracellular signaling pathways
Figure 1. (A) Eight-day survival curves of mice challenged with intra-tracheal injection of one of 5 solutions, each dosed to produce the observedmortality. Significant differences (p,0.05) were observed between the 80–90% mortality (Pseudomonas bacteria, Streptococcus bacteria, andPseudomonas LPS) versus 50% mortality (Pseudomonas bacteria) versus 0% mortality groups. Blood samples were obtained at 24 hours (red arrow), atime prior to appreciable mortality. (B) Clustering of the 219 probe sets that differentiated the five treatment groups separated the probe sets into sixclusters. (C) Co-expression network analysis of these six mouse gene clusters were used to explore the gene expression cartography of the leukocyteresponse to pneumonia. Genes in common with the human coexpression network (Figure 3B) are circled. (D) Principal components (PC) analysis of analgorithm-selected subset of the 219 probe sets whose microarray-measured RNA abundance in leukocytes isolated 24 h after the onset ofpneumonia. PC2 appeared to explain in part expression signal variance due to mortality rates, while PC3 explained in part the variance due to type ofinsult.doi:10.1371/journal.pone.0001564.g001
Development of Riboleukogram
PLoS ONE | www.plosone.org 4 February 2008 | Volume 3 | Issue 2 | e1564

(N = 18, P = 661027). Clusters 4–6 were enriched for genes that
encode nuclear proteins (N = 24, P = 961024). Principal compo-
nents analysis of the microarray-derived transcript abundances of
the genes selected based on cross-validation clearly differentiated
the five experimental groups (Figure 1D) based on the 7-day
mortality (principal component 1) and the type of agent used
(Gram positive, sterile, Gram negative, principal component 2).
Clinical study—training cohortAfter being mechanically ventilated for .48 h, 27 patients were
enrolled into the study. The first 20 patients enrolled were assigned
arbitrarily to a training cohort; the other 7 were assigned to a
validation cohort. Blood samples were taken at ,48-hour intervals
during the study period and then separated into plasma and
leukocytes (see below). Of the 20 patients in the training cohort,
eight patients either were extubated without developing VAP or
withdrew from the study. Of the 12 patients in this cohort who
developed microbiologically-confirmed VAP (Table 1), 11 met our
analysis criteria of having samples before and after the attending
physician made a diagnosis of VAP (that is, one patient, #9, was
excluded from analysis for developing VAP on the study entry
day). Clinical pulmonary infection scores (CPIS) increased in all 11
patients coincident with the diagnosis of VAP. Three of the
patients were culture positive for a Gram positive agent (S. aureus)
and the remaining eight patients were culture positive for one or
more Gram negative agents. In every case, initial intravenous
antibiotic therapy was appropriate for the cultured organism
responsible for VAP, based upon cultured organism susceptibil-
ities. Nine of the 11 patients developed VAP 3–6 days after
enrollment in the study (‘‘early VAP’’) while two patients
developed VAP after prolonged mechanical ventilation (‘‘late
VAP’’, Table 1). All of the patients survived and were discharged
from the ICU. Patient-specific timelines were aligned for analysis
by assigning ‘‘day 0’’ to the day that the attending physician
diagnosed VAP.
RNA isolated from patient samples was of high quality and
hybridizations met standard performance criteria (vide supra). To
assess whether the genes identified in the murine model conveyed
information in the patient study, the microarray abundance of the
human orthologs of the 219 genes that distinguished the murine
pneumonias were numerically analyzed. Principal components
analysis of the average RMA-normalized expression levels of these
109 ortholog genes resulted in gene expression trajectories that
described the cohort of patients as they developed, were treated
for, and recovered from VAP (Figure 2A). Trajectory translocation
along the X-coordinate (principal component 2) appeared to be
informative with regard to the onset of VAP – beginning
immediately before the diagnosis and ending approximately six
days after appropriate antibiotic therapy was initiated. Principal
components analysis of plasma cytokine abundance in these
patients showed a qualitatively similar trajectory, but with large
error bars (Figure 2B). Nevertheless, translocation along the X-
coordinate (principal component 2) again appeared to coincide
with the onset of VAP.
Independent analysis of patient microarray data resulted in the
identification of 85 probe sets whose abundance changed
significantly during the course of VAP (Table 2). Of the 109
human orthologs that were used to calculate the trajectories shown
in Figure 2A, 5 probe sets (4.6%) were present in the list of human
probe sets (lactotransferrin, cathelicidin antimicrobial peptide,
phospholipid scramblase 1, inhibin beta A, and hydroxyprosta-
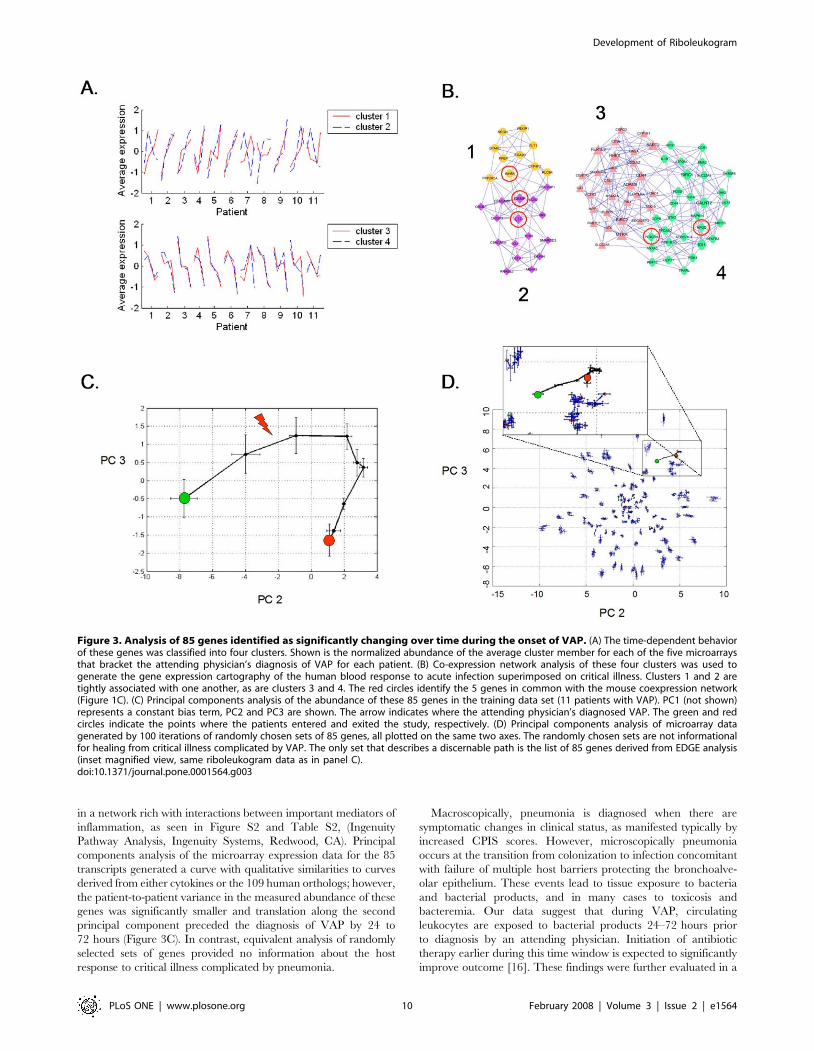
glandin dehydrogenase 15-(NAD)). Network analysis found that
the expression behavior of these 85 genes segregated into four
clusters (Figure 3A). Transcript abundance in clusters 1 and 2
generally increased and transcript abundance in clusters 3 and 4
generally decreased around the time of VAP diagnosis.
Molecular cartography of the human leukocyte transcriptional
response to acute bacterial infection identified two densely
connected networks of genes, the first containing clusters 1 and
2 and the second containing clusters 3 and 4 (Figure 3B). The 26
probe sets in clusters 1 and 2 are significantly enriched with GO
biological process terms: ‘‘defense response to bacteria’’ (8 genes,
p-value = 2610211), ‘‘response to biotic stimulus’’ (12 genes,
p = 461026), and ‘‘immune response’’ (8 genes, p = 0.002) and
the cellular compartment term ‘‘extracellular region’’ (14 genes,
p = 961029). The 59 probe sets in clusters 3 and 4 are enriched
with GO molecular function terms: ‘‘ATP binding’’ (13 genes,
p = 961024), ‘‘metal ion binding’’ (22 genes, p = 0.002), and
‘‘protein binding’’ (25 genes, p = 0.002) and the cellular compart-
ment terms ‘‘cytoplasm’’ (23 genes, p = 0.007) and ‘‘plasma
membrane’’ (13 genes, p = 0.02).
Principal components analysis of the microarray expression
profiles of these 85 genes defined a common response to
pulmonary infection complicating critical illness (Figure 3C).
Importantly, trajectory translocation in the X-coordinate (princi-
pal component 2) occurred days prior to the clinical diagnosis of
VAP. In addition, the informational content of 85 genes chosen at
random was determined iteratively 100 times for the first 11 VAP
patients. As shown in Figure 3D, only the 85 genes identified by
EDGE as significant (FDR#0.10) produced a trajectory; the other
sets of genes were scattered randomly around the origin of the
graph.
Three patients exhibited contrary gene expression profiles
within two of these four clusters (Figure 3A). Patients 1, 7 and 11
showed decreased expression of genes in cluster 2 and patients 7
and 11 showed increased expression of genes in clusters 3 and 4.
Based on patient demographics (Table 1 and data not shown), the
only clear difference between patients 7 and 11 and the other
patients in the study is that these two patients developed VAP later
in their ICU course (study day 18 and 14 respectively) whereas the
remaining patients developed VAP between study days 3 and 6.
This was also evident in PCA analysis of the 11 individual
trajectories (data not shown). The changes in transcript abundance
of selected genes were validated by quantitative RT-PCR (Figure
S1). Finally, we tested whether host ethnicity, host gender, host
age, or the cell wall phenotype of the infectious agent had an effect
on the number of informational genes. The most informational of
these demographic variables was host ethnicity (Figure 4).
We observed in Figure 3C that the aggregate riboleukogram
variance in principal component 2 decreased as patients recovered
from acute infection. This finding suggested that principal
components analysis of microarray-measured gene expression
described an attractor, as gene expression time series can be
described in terms of dynamical system theory as trajectories in the
phase space defined by the main principal components. By
plotting the change in PC2 against PC2 over time, we found
indeed that the mapped gene expression information appeared to
converge toward a common point, suggesting that PC2 represents
the expression of the infection-inducible genes (Figure 5).
Consistent with differences in patient age, gender, ethnicity, pre-
existing co-morbidities, and nature of injury insult, each patient’s
individual trajectory started at a different point and described a
patient-specific arc (data not shown).
Validation cohortA second cohort of 7 patients was analyzed to evaluate the
informational value of the 85 genes that were identified in the first
11 patients with VAP. Two of these 7 additional patients were
Development of Riboleukogram
PLoS ONE | www.plosone.org 5 February 2008 | Volume 3 | Issue 2 | e1564
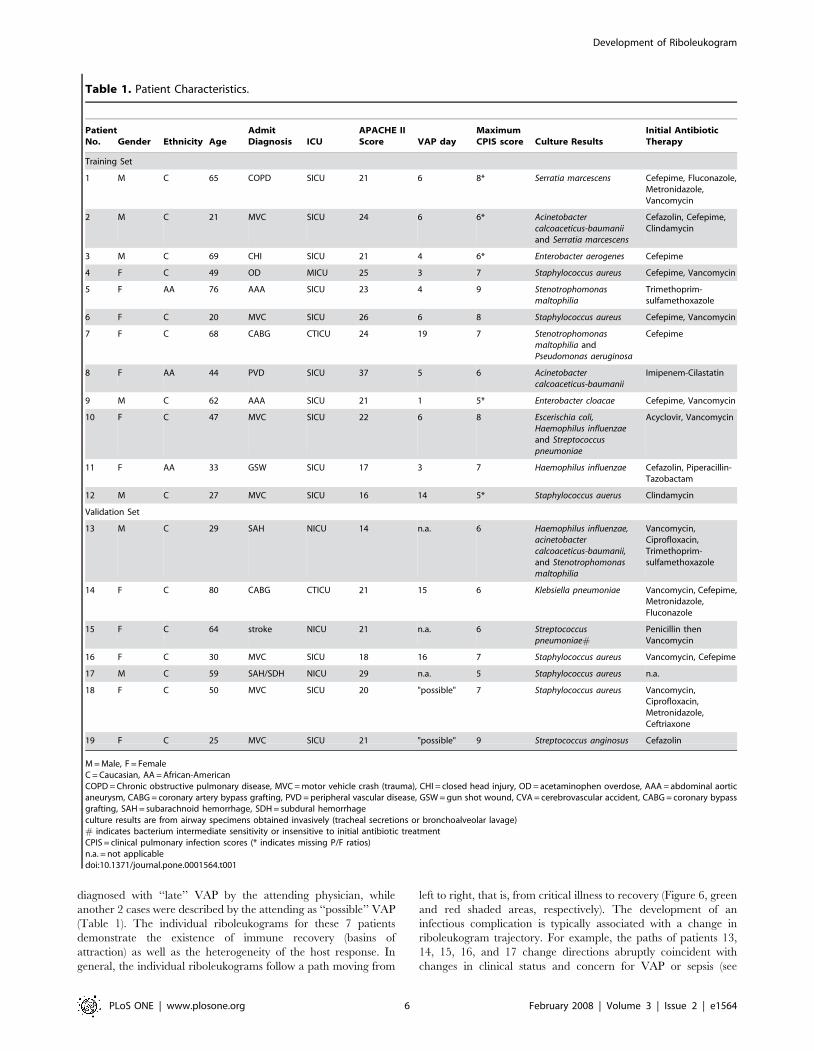
diagnosed with ‘‘late’’ VAP by the attending physician, while
another 2 cases were described by the attending as ‘‘possible’’ VAP
(Table 1). The individual riboleukograms for these 7 patients
demonstrate the existence of immune recovery (basins of
attraction) as well as the heterogeneity of the host response. In
general, the individual riboleukograms follow a path moving from
left to right, that is, from critical illness to recovery (Figure 6, green
and red shaded areas, respectively). The development of an
infectious complication is typically associated with a change in
riboleukogram trajectory. For example, the paths of patients 13,
14, 15, 16, and 17 change directions abruptly coincident with
changes in clinical status and concern for VAP or sepsis (see
Table 1. Patient Characteristics.
PatientNo. Gender Ethnicity Age
AdmitDiagnosis ICU
APACHE IIScore VAP day
MaximumCPIS score Culture Results
Initial AntibioticTherapy
Training Set
1 M C 65 COPD SICU 21 6 8* Serratia marcescens Cefepime, Fluconazole,Metronidazole,Vancomycin
2 M C 21 MVC SICU 24 6 6* Acinetobactercalcoaceticus-baumaniiand Serratia marcescens
Cefazolin, Cefepime,Clindamycin
3 M C 69 CHI SICU 21 4 6* Enterobacter aerogenes Cefepime
4 F C 49 OD MICU 25 3 7 Staphylococcus aureus Cefepime, Vancomycin
5 F AA 76 AAA SICU 23 4 9 Stenotrophomonasmaltophilia
Trimethoprim-sulfamethoxazole
6 F C 20 MVC SICU 26 6 8 Staphylococcus aureus Cefepime, Vancomycin
7 F C 68 CABG CTICU 24 19 7 Stenotrophomonasmaltophilia andPseudomonas aeruginosa
Cefepime
8 F AA 44 PVD SICU 37 5 6 Acinetobactercalcoaceticus-baumanii
Imipenem-Cilastatin
9 M C 62 AAA SICU 21 1 5* Enterobacter cloacae Cefepime, Vancomycin
10 F C 47 MVC SICU 22 6 8 Escerischia coli,Haemophilus influenzaeand Streptococcuspneumoniae
Acyclovir, Vancomycin
11 F AA 33 GSW SICU 17 3 7 Haemophilus influenzae Cefazolin, Piperacillin-Tazobactam
12 M C 27 MVC SICU 16 14 5* Staphylococcus auerus Clindamycin
Validation Set
13 M C 29 SAH NICU 14 n.a. 6 Haemophilus influenzae,acinetobactercalcoaceticus-baumanii,and Stenotrophomonasmaltophilia
Vancomycin,Ciprofloxacin,Trimethoprim-sulfamethoxazole
14 F C 80 CABG CTICU 21 15 6 Klebsiella pneumoniae Vancomycin, Cefepime,Metronidazole,Fluconazole
15 F C 64 stroke NICU 21 n.a. 6 Streptococcuspneumoniae#
Penicillin thenVancomycin
16 F C 30 MVC SICU 18 16 7 Staphylococcus aureus Vancomycin, Cefepime
17 M C 59 SAH/SDH NICU 29 n.a. 5 Staphylococcus aureus n.a.
18 F C 50 MVC SICU 20 "possible" 7 Staphylococcus aureus Vancomycin,Ciprofloxacin,Metronidazole,Ceftriaxone
19 F C 25 MVC SICU 21 "possible" 9 Streptococcus anginosus Cefazolin
M = Male, F = FemaleC = Caucasian, AA = African-AmericanCOPD = Chronic obstructive pulmonary disease, MVC = motor vehicle crash (trauma), CHI = closed head injury, OD = acetaminophen overdose, AAA = abdominal aorticaneurysm, CABG = coronary artery bypass grafting, PVD = peripheral vascular disease, GSW = gun shot wound, CVA = cerebrovascular accident, CABG = coronary bypassgrafting, SAH = subarachnoid hemorrhage, SDH = subdural hemorrhageculture results are from airway specimens obtained invasively (tracheal secretions or bronchoalveolar lavage)# indicates bacterium intermediate sensitivity or insensitive to initial antibiotic treatmentCPIS = clinical pulmonary infection scores (* indicates missing P/F ratios)n.a. = not applicabledoi:10.1371/journal.pone.0001564.t001
Development of Riboleukogram
PLoS ONE | www.plosone.org 6 February 2008 | Volume 3 | Issue 2 | e1564

Figure 6A inset). Patient 17 grew Staphylococcus aureus from both
urine and tracheal secretions prior to withdrawal of therapy for
cure (the only death in the study). In contrast, the riboleukograms
of patients 13, 18, and 19 are atypical, in that their paths do not
start and/or do not finish with the others. Both patients 18 and 19
had pulmonary contusions secondary to polysystem trauma,
maximal CPIS scores of 7 and 9, Gram-positive cocci cultured
from airway secretions, and were treated with antibiotics, but had
a clinical course labeled by the attending physician as ‘‘possible’’
VAP. Their riboleukograms are in different portions of the graph
in Figure 6A, but have a similar shape and slope. Both patients 13
and 18 had intracranial hemorrhage. Patient 13 was not diagnosed
with VAP (no infiltrate on CXR) but was treated with antibiotics
for a fever of 39.4uC and WBC of 31,300 (day 5), tracheal
secretions that subsequently grew out Acinetobacter and Steno-
trophomonas (CPIS 6), and concern for catheter-related sepsis.
In Figure 6B, the aggregate riboleukogram for the training
cohort of VAP patients (aligned for day of VAP diagnosis, see also
Figure 3C) is compared to the aggregate riboleukogram for all
patients aligned for day of study entry (that is, both training and
validation cohorts, N = 11+7, irrespective of VAP day). Again
noted are the PCA domains of critical illness and recovery. The
aggregate VAP riboleukogram diverges from the aggregate critical
illness riboleukogram and rejoins the latter at the point of
recovery.
Discussion
Using a bench-to-bedside approach, we have implemented a
mouse model of pneumonia and found that RNA abundance
profiles obtained from blood samples taken prior to appreciable
mortality were able to distinguish between the two variables tested
in the assay: lethality of the insult and type of infectious agent.
These data extend our previous observations in a mouse model of
abdominal sepsis, wherein microarray-measured expression pro-
files from circulating leukocytes distinguished between infectious
and non-infectious etiologies of systemic inflammation in a de-
identified cohort [15]. Thus, the mouse circulating leukocyte
transcriptional response to infection can not only distinguish
between infectious and non-infectious inflammatory insults, but
also the type of infectious agent and its associated mortality.
Network analysis suggested that the pneumonia-induced tran-
scriptional changes reprioritized mouse leukocytes for the
initiation of an immune response, the transcriptional regulation
of intracellular signaling cascades, and the induction of numerous
transcription factors and other nuclear genes.
Results from the mouse model suggested that the transcriptional
activity of buffy coat-isolated cells may be used to monitor the
onset of and recovery from acute infection. We tested this
hypothesis by calculating principal components using microarray
expression profiles of RNA isolated from mechanically ventilated
patients at risk for pneumonia. Initially, we examined the behavior
of the human orthologs to the genes identified in the mouse
pneumonia study. The onset of acute infection corresponded with
translation along PC 2 in Figure 2. Translation along PC2 ceased
5–6 days after appropriate antibiotic therapy in the patients was
started, consistent with recovery. These data show that there are
specific transcriptional programs instituted by circulating immune
cells during acute infection which have diagnostic potential in the
setting of critical illness. Principal components analysis of plasma
cytokine abundance generated a qualitatively similar trajectory;
however, in line with previous reports, plasma cytokine abundance
(including procalcitonin) was insufficient to diagnose acute
infection in this small cohort of critically ill patients. As with
other tissues, changes in RNA abundance observed in circulating
leukocyte do not necessarily reflect changes in protein abundance,
and vice versa. While principal components analysis of informa-
tional murine genes in authentic human disease showed there was
a conserved and informational peripheral leukocyte transcriptional
response to localized infection, the information contained in those
genes would not appear to be more useful than current clinical
Figure 2. (A) Principal components analysis of the leukocyte average relative RNA abundance of the 109 human orthologs to the 219 murine genesidentified in Supplemental Table S1, plotted for all eleven patients who developed VAP. The translation along principal component (PC) 2 appears tobe associated with the development and recovery from pneumonia. The red arrow indicates the day where the attending physician diagnosed VAP.The green circle indicates the point at which the patient entered the study; the red circle is the point at which the patient exited the study. (B)Principal components analysis of the average absolute abundance of plasma cytokines and soluble receptors during the study period across alleleven VAP patients. Individual cytokines do not have significant changes in abundance during the time course of disease (P . 0.05 for all individualproteins).doi:10.1371/journal.pone.0001564.g002
Development of Riboleukogram
PLoS ONE | www.plosone.org 7 February 2008 | Volume 3 | Issue 2 | e1564
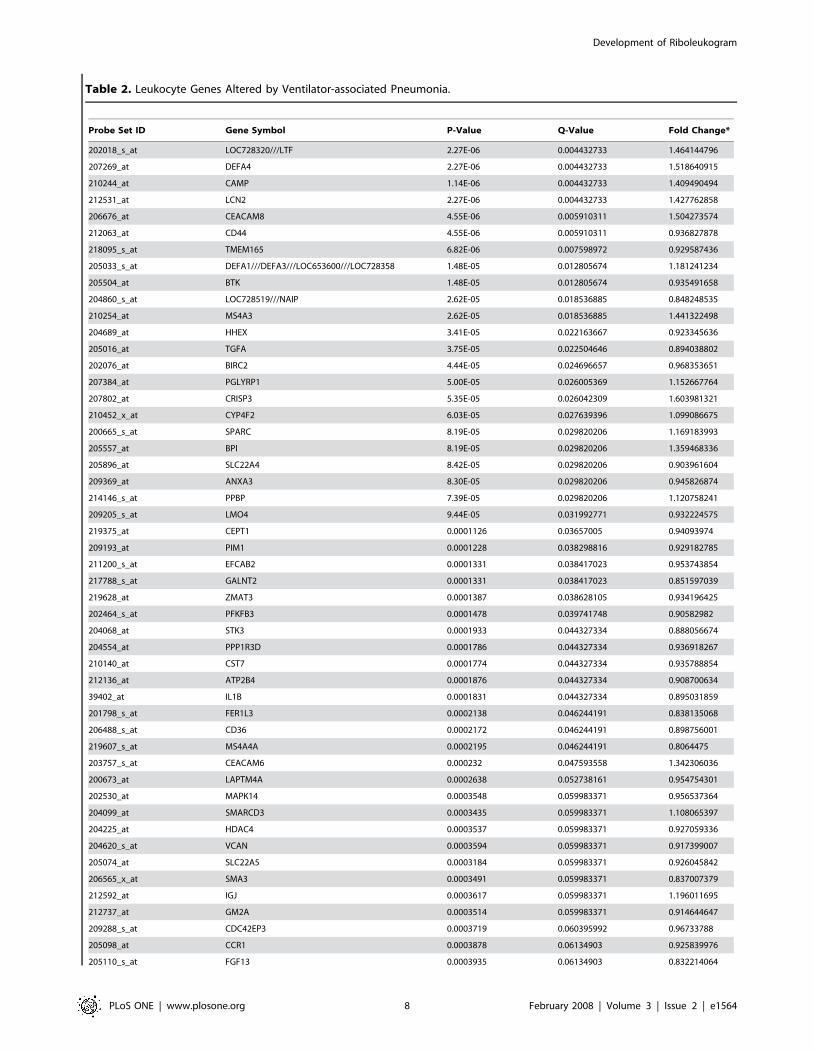
Table 2. Leukocyte Genes Altered by Ventilator-associated Pneumonia.
Probe Set ID Gene Symbol P-Value Q-Value Fold Change*
202018_s_at LOC728320///LTF 2.27E-06 0.004432733 1.464144796
207269_at DEFA4 2.27E-06 0.004432733 1.518640915
210244_at CAMP 1.14E-06 0.004432733 1.409490494
212531_at LCN2 2.27E-06 0.004432733 1.427762858
206676_at CEACAM8 4.55E-06 0.005910311 1.504273574
212063_at CD44 4.55E-06 0.005910311 0.936827878
218095_s_at TMEM165 6.82E-06 0.007598972 0.929587436
205033_s_at DEFA1///DEFA3///LOC653600///LOC728358 1.48E-05 0.012805674 1.181241234
205504_at BTK 1.48E-05 0.012805674 0.935491658
204860_s_at LOC728519///NAIP 2.62E-05 0.018536885 0.848248535
210254_at MS4A3 2.62E-05 0.018536885 1.441322498
204689_at HHEX 3.41E-05 0.022163667 0.923345636
205016_at TGFA 3.75E-05 0.022504646 0.894038802
202076_at BIRC2 4.44E-05 0.024696657 0.968353651
207384_at PGLYRP1 5.00E-05 0.026005369 1.152667764
207802_at CRISP3 5.35E-05 0.026042309 1.603981321
210452_x_at CYP4F2 6.03E-05 0.027639396 1.099086675
200665_s_at SPARC 8.19E-05 0.029820206 1.169183993
205557_at BPI 8.19E-05 0.029820206 1.359468336
205896_at SLC22A4 8.42E-05 0.029820206 0.903961604
209369_at ANXA3 8.30E-05 0.029820206 0.945826874
214146_s_at PPBP 7.39E-05 0.029820206 1.120758241
209205_s_at LMO4 9.44E-05 0.031992771 0.932224575
219375_at CEPT1 0.0001126 0.03657005 0.94093974
209193_at PIM1 0.0001228 0.038298816 0.929182785
211200_s_at EFCAB2 0.0001331 0.038417023 0.953743854
217788_s_at GALNT2 0.0001331 0.038417023 0.851597039
219628_at ZMAT3 0.0001387 0.038628105 0.934196425
202464_s_at PFKFB3 0.0001478 0.039741748 0.90582982
204068_at STK3 0.0001933 0.044327334 0.888056674
204554_at PPP1R3D 0.0001786 0.044327334 0.936918267
210140_at CST7 0.0001774 0.044327334 0.935788854
212136_at ATP2B4 0.0001876 0.044327334 0.908700634
39402_at IL1B 0.0001831 0.044327334 0.895031859
201798_s_at FER1L3 0.0002138 0.046244191 0.838135068
206488_s_at CD36 0.0002172 0.046244191 0.898756001
219607_s_at MS4A4A 0.0002195 0.046244191 0.8064475
203757_s_at CEACAM6 0.000232 0.047593558 1.342306036
200673_at LAPTM4A 0.0002638 0.052738161 0.954754301
202530_at MAPK14 0.0003548 0.059983371 0.956537364
204099_at SMARCD3 0.0003435 0.059983371 1.108065397
204225_at HDAC4 0.0003537 0.059983371 0.927059336
204620_s_at VCAN 0.0003594 0.059983371 0.917399007
205074_at SLC22A5 0.0003184 0.059983371 0.926045842
206565_x_at SMA3 0.0003491 0.059983371 0.837007379
212592_at IGJ 0.0003617 0.059983371 1.196011695
212737_at GM2A 0.0003514 0.059983371 0.914644647
209288_s_at CDC42EP3 0.0003719 0.060395992 0.96733788
205098_at CCR1 0.0003878 0.06134903 0.925839976
205110_s_at FGF13 0.0003935 0.06134903 0.832214064
Development of Riboleukogram
PLoS ONE | www.plosone.org 8 February 2008 | Volume 3 | Issue 2 | e1564

criteria (that is, the translation in PC2 did not begin until the day
the attending physician made the diagnosis). However, by
explicitly accounting for variance over time, a set of 85 genes
were identified subsequently in our first 11 VAP patients whose
microarray expression levels changed consistently before the
clinical diagnosis of VAP.
These 85 genes clustered into four groups with their abundance
either increasing or decreasing throughout the 7-day window
bracketing the onset of infection (Figure 3A). There was a significant
association between genes known to play key roles in defense against
bacterial pathogens and those genes that increased in apparent
abundance (cluster 1 and 2 probes sets) coincident with the diagnosis
of VAP. Consistent with activation of the host response to
pneumonia, all of the genes with the ‘‘defense against bacteria’’
ontology were found in cluster 2 and encode primarily granulocytic,
antimicrobial proteins, and adhesion molecules. In contrast, the
genes that decreased in apparent abundance (clusters 3–4) showed
different behavior depending on whether the patient developed
VAP early or late in the study. Although no consistent biological
theme emerged from this list of the 59 transcripts, this finding
provides some insight into the transcriptional basis of differences in
the critically ill host’s response to early- versus late-onset VAP [29].
Of interest, the RNA abundance of five genes were altered by
pneumonia in both the mouse and human gene sets (Figures 1C and
3B): lactotransferrin (LTF), cathelicidin antimicrobial peptide
(CAMP), phospholipid scramblase 1 (PLSCR1), inhibin beta A
(INHBA), and hydroxyprostaglandin dehydrogenase 15-(NAD)
(HPGD). Pathway analysis indicates that these five genes connect
Probe Set ID Gene Symbol P-Value Q-Value Fold Change*
201432_at CAT 0.0004162 0.062399247 0.96794903
205513_at TCN1 0.0004162 0.062399247 1.301185411
202087_s_at CTSL1 0.0004322 0.062550793 0.935466979
206838_at TBX19 0.0004333 0.062550793 0.940074355
202437_s_at CYP1B1 0.0004515 0.063992551 0.874011817
206493_at ITGA2B 0.0004708 0.065541129 1.140129423
202381_at ADAM9 0.0005061 0.066195485 0.896803767
208881_x_at IDI1 0.0005095 0.066195485 0.919817185
214177_s_at PBXIP1 0.0005004 0.066195485 1.061731802
222033_s_at FLT1 0.0004947 0.066195485 1.03738168
218854_at DSE 0.0005345 0.068307695 0.905149756
210511_s_at INHBA 0.0005493 0.069064846 1.103622639
202187_s_at PPP2R5A 0.0005629 0.069657239 1.041391358
201312_s_at SH3BGRL 0.0006232 0.073610239 0.939968882
219358_s_at CENTA2 0.0006073 0.073610239 0.911233169
220865_s_at PDSS1 0.0006175 0.073610239 0.88394257
218699_at RAB7L1 0.0006403 0.074496385 0.880551181
209396_s_at CHI3L1 0.0006619 0.075877966 1.23586215
204081_at NRGN 0.0007256 0.081973446 1.109969097
202185_at PLOD3 0.0007642 0.085108481 0.94677975
200738_s_at PGK1 0.0008063 0.085779381 0.977196602
202193_at LIMK2 0.0007927 0.085779381 0.920601355
202872_at ATP6V1C1 0.000795 0.085779381 0.900746363
202974_at MPP1 0.0008143 0.085779381 0.963344703
202446_s_at PLSCR1 0.0008348 0.085855047 0.953849782
204490_s_at CD44 0.000837 0.085855047 0.88577208
203895_at PLCB4 0.000953 0.093530674 1.031696261
206851_at RNASE3 0.0009599 0.093530674 1.189718607
211963_s_at ARPC5 0.0009246 0.093530674 0.980350825
215884_s_at UBQLN2 0.0009428 0.093530674 0.906980156
201810_s_at SH3BP5 0.0010099 0.097191784 0.921374384
211548_s_at HPGD 0.0010224 0.097195788 0.755385963
200996_at ACTR3 0.001077 0.099814726 0.97523089
201358_s_at COPB1 0.0010861 0.099814726 0.96732026
203200_s_at MTRR 0.0010884 0.099814726 0.864551148
*Change from day 3 to day 23, relative to the VAP diagnosis at day 0doi:10.1371/journal.pone.0001564.t002
Table 2. Cont.
Development of Riboleukogram
PLoS ONE | www.plosone.org 9 February 2008 | Volume 3 | Issue 2 | e1564
in a network rich with interactions between important mediators of
inflammation, as seen in Figure S2 and Table S2, (Ingenuity
Pathway Analysis, Ingenuity Systems, Redwood, CA). Principal
components analysis of the microarray expression data for the 85
transcripts generated a curve with qualitative similarities to curves
derived from either cytokines or the 109 human orthologs; however,
the patient-to-patient variance in the measured abundance of these
genes was significantly smaller and translation along the second
principal component preceded the diagnosis of VAP by 24 to
72 hours (Figure 3C). In contrast, equivalent analysis of randomly
selected sets of genes provided no information about the host
response to critical illness complicated by pneumonia.
Macroscopically, pneumonia is diagnosed when there are
symptomatic changes in clinical status, as manifested typically by
increased CPIS scores. However, microscopically pneumonia
occurs at the transition from colonization to infection concomitant
with failure of multiple host barriers protecting the bronchoalve-
olar epithelium. These events lead to tissue exposure to bacteria
and bacterial products, and in many cases to toxicosis and
bacteremia. Our data suggest that during VAP, circulating
leukocytes are exposed to bacterial products 24–72 hours prior
to diagnosis by an attending physician. Initiation of antibiotic
therapy earlier during this time window is expected to significantly
improve outcome [16]. These findings were further evaluated in a
Figure 3. Analysis of 85 genes identified as significantly changing over time during the onset of VAP. (A) The time-dependent behaviorof these genes was classified into four clusters. Shown is the normalized abundance of the average cluster member for each of the five microarraysthat bracket the attending physician’s diagnosis of VAP for each patient. (B) Co-expression network analysis of these four clusters was used togenerate the gene expression cartography of the human blood response to acute infection superimposed on critical illness. Clusters 1 and 2 aretightly associated with one another, as are clusters 3 and 4. The red circles identify the 5 genes in common with the mouse coexpression network(Figure 1C). (C) Principal components analysis of the abundance of these 85 genes in the training data set (11 patients with VAP). PC1 (not shown)represents a constant bias term, PC2 and PC3 are shown. The arrow indicates where the attending physician’s diagnosed VAP. The green and redcircles indicate the points where the patients entered and exited the study, respectively. (D) Principal components analysis of microarray datagenerated by 100 iterations of randomly chosen sets of 85 genes, all plotted on the same two axes. The randomly chosen sets are not informationalfor healing from critical illness complicated by VAP. The only set that describes a discernable path is the list of 85 genes derived from EDGE analysis(inset magnified view, same riboleukogram data as in panel C).doi:10.1371/journal.pone.0001564.g003
Development of Riboleukogram
PLoS ONE | www.plosone.org 10 February 2008 | Volume 3 | Issue 2 | e1564

small validation patient cohort, confirming the value of the 85-
gene riboleukogram to quantitate the host response to and
recovery from critical illness. Individual riboleukograms changed
direction coincident with clinical findings of pneumonia or sepsis
(frequently days before the clinical diagnosis and maximal CPIS
scores). Nevertheless, marked heterogeneity was observed in some
patient responses that could not be linked to monitored variables
(e.g., patients 13 and 18, Figure 6A). In these patients, perhaps the
well-described influence of the underlying acute illnesses (pulmo-
nary contusion and intracranial hemorrhage) on host immune
responses could provide part of the explanation [30,31]. As
patients healed from critical illness, the riboleukograms converged,
a finding consistent with the existence of an immunological
‘‘attractor’’ state. Comparison of the aggregate VAP versus critical
illness riboleukograms indicated that a large portion of the signal
for the 85 genes identified is a reflection of recovery from critical
illness (PC2 in Figure 6B). Nevertheless, VAP signal became
evident among the ‘‘noise’’ of critical illness once the individual
riboleukograms were aligned for day of VAP diagnosis, evident as
a deflection of the VAP riboleukogram upward in PC3 (Figure 6B).
Thus, we submit that riboleukograms are a molecular analytical
tool with substantial potential to improve diagnostics, prognostics,
and our understanding of the host response to critical illness
complicated by acute infection.
An important consequence of our observation that patient-
specific riboleukograms converged is that the variance in leukocyte
gene expression for these 85 genes decreased significantly over the
time course in patients with VAP. Studies of physical systems
suggest that the stable states of networks can be represented as
attractors, a set of points in the phase space to which the genetic
network evolves over time [32,33]. In particular, every trajectory
initiated within the bounds of an attractor terminates inside the
attractor. Recently this hypothesis has been confirmed experi-
mentally in vitro [11,34]. Our findings suggest that the immune
system of a critically ill patient who recovers from disease returns
back to a stable state and that the immune response trajectory can
be a considered formally as a dynamic system. Borrowing from
concepts in the physical sciences [35], we hypothesized that an
individual’s baseline immune system is within a basin of attraction
prior to injury, nosocomial infection perturbs that system, and
after the infection cleared the system would return to it’s initial
attractor. In phase space analysis, we found that the patient-
specific trajectories appeared to converge and that the onset of
pneumonia ‘pushes’ the gene expression data away from that
basin—a perturbation that is ameliorated by appropriate antibi-
otic therapy. This result provides what we believe is the first
evidence in patients for a basin of attraction for the genetic
network associated with immunological health.
Because of the heterogeneity of this patient population (for
example, age, gender, pre-existing health status, type and severity
of critical illness), it is not surprising that the error bars on the PC
analysis are initially quite large. The end-points of the trajectories,
however, appear to converge in a smaller space, suggesting that
the patients’ immune systems are returning to a health attractor
(Figures 5 and 6). As observed in the validation cohort, patient-
specific trajectories are not smooth curves, but appear to have
inflection points that may correlate with hospital intervention or
the onset of infection. Our data further suggest that differences in
host ethnic backgrounds and gender are more important than
differences in infecting organism as determinants of the host
leukocyte transcriptional response. These observations are consis-
tent with a recent study comparing GeneChip signal from cells
lines derived from Asians and Caucasians, indicating differences in
the gene expression levels of 25% of the 4000 genes studied in
these two ethnic groups [36]. Moreover, as the rate of sepsis, the
youngest age of sepsis onset, and the sepsis mortality rate are
highest for African-American males [37], our data suggest that
further study of riboleukograms is indicated to gain insight into
these health disparities. These profiles also suggest that there is a
transcriptional component that is conserved across that diversity of
the human population.
In summary, our analysis demonstrates the plasticity of the blood
leukocyte response to bacteria in vivo, extending previous in vitro
studies [10,11] into the clinical realm. For the first time, we provide
evidence that riboleukogram gene expression analysis can be applied
to a heterogeneous clinical population to monitor the host response
to and recovery from critical illness complicated by acute infection.
Moreover, we identify new, conserved gene targets that appear to be
informational for recovery at the transcriptional level, many of
which are involved with granulocyte maturation and chemokine
(not cytokine) responsiveness. This conclusion is supported by the
relative weak diagnostic information provided by the plasma
cytokine data, consistent with conclusions reached at recent a
consensus conference [16]. In particular, plasma procalcitonin levels
were not informational. There are, however, important limitations
to our study, most notably, the preliminary nature of the work, the
small number of patients, and the well-known difficulty of ruling out
false-positive and false-negative diagnoses of VAP based on clinical
parameters. This uncertainty is both the motivation for (and
challenge of) developing novel molecular diagnostics for VAP. In
addition, there is no consensus on how to leverage the dynamic
nature of the clinical, RNA, and protein data collected to build
hybrid models that improve diagnostics and prognostics. Thus, we
conclude that our data demonstrate the technical feasibility and
clinical potential of the riboleukogram approach, but proof of
clinical utility will require further study.
Thus, as graphs of myocardial electrical information (electro-
cardiograms) were tapped over a century ago to provide an
objective means to aid heart diagnostics, we submit that
riboleukograms will aid in the diagnosis and prognosis of acute
infectious and inflammatory disease. The diagnostic potential of
riboleukograms is supported by two very recent independent
reports that corroborate our mouse data (Figure 1D), indicating
Figure 4. Genes informational in distinguishing clinical phe-notypes of interest, including host gender, age, and ethnicbackground, with the caveats that all African-Americans andall middle-aged individuals were female (Table 1). Note that thelargest number of probe sets were associated with differences in ethnicbackground (African-American compared to Caucasian). Of note, asopposed to the mouse response, there we no genes that differentiatedbetween the human response to bacterial cell wall products (Gramnegative versus Gram-positive bacteria), suggesting that signal variancedue to ethnic background, gender, and age is greater than that due toinfecting organism.doi:10.1371/journal.pone.0001564.g004
Development of Riboleukogram
PLoS ONE | www.plosone.org 11 February 2008 | Volume 3 | Issue 2 | e1564

that circulating leukocyte RNA signatures in patients differentiate
between the host responses to sterile versus infectious causes of
systemic inflammation and between the host response to Gram-
negative versus Gram-positive pathogens [38,39]. Prospective
clinical trials are indicated to validate our results and determine
the value of this new technology; to optimize gene selection
methods that account for differences in patient ethnicity, gender,
and age; and to develop computational approaches that integrate
clinical and molecular data to improve diagnostics [40].
Supporting Information
Figure S1 The changes in transcript abundance of selected
genes from Table 2 were validated by quantitative RT-PCR. For
the six genes depicted above, the RT-PCR correlation coefficients
(R2 values) for the microarray expression values are 0.60, 0.67,
0.66, 0.86, 0.85, and 0.43, respectively.
Found at: doi:10.1371/journal.pone.0001564.s001 (0.32 MB TIF)
Figure S2 Hypothetical leukocyte network based on reported
gene-gene interactions. Starting with the 5 genes altered by
pneumonia in both mice and patients (grey shapes), the
Ingenuity Pathway Analysis tool was used to build an interaction
network based upon gene-gene interactions reported in the
literature. Note the rich network of interactions and the
consistent inflammation theme of the genes added by the
software. Table S2 lists the individual genes and their reported
connections.
Figure 5. Phase space analysis of the average ICU patient riboleukogram trajectories as they develop VAP, respond to antibiotics,and recover. (A) Decrease of variance and the convergence of individual trajectories to a common small region in the phase space (‘‘immunologicalattractor’’) associated with health. The green and red circles indicate where the patients entered and exited the study, respectively. (B) Decreases invariance (standard deviation, STD) over time for the phase space trajectory in panel A, consistent with the existence of an attractor. The diagnosis ofVAP was made by the attending physician on Day 0.doi:10.1371/journal.pone.0001564.g005
Development of Riboleukogram
PLoS ONE | www.plosone.org 12 February 2008 | Volume 3 | Issue 2 | e1564

Figure 6. Principal components analysis of 85 leukocyte genes in the training and validation patient cohorts. (A) The solid black curvedepicts the aggregate riboleukogram of the first 11 VAP patients (training cohort, same data as in Figure 3C). The other 7 curves are the individualriboleukograms of the patients in the validation cohort. The inset magnifies the trajectories of patients 13–17 (see Table 1) and demonstrates abruptchanges in riboleukogram course typically coincident with an increase in CPIS score (first occurrence of maximal CPIS value is indicated by thearrows). The paths of patients 13, 18 and 19, are atypical (see text for additional details). (B) The aggregate 11 patient VAP riboleukogram (black curve,same as panel A) is compared to the aggregate riboleukogram of all patients aligned by study day (that is, training and validation cohorts,irrespective of VAP day of diagnosis, dotted blue curve). Note that the VAP riboleukogram deviates from the ‘‘critical illness’’ riboleukogram (blackarrows) prior to VAP diagnosis (lighting bolt), but after treatment, the VAP riboleukogram converges with the critical illness riboleukogram at thepoint of recovery. The green and red circles indicate where the patients entered and exited the study, respectively.doi:10.1371/journal.pone.0001564.g006
Development of Riboleukogram
PLoS ONE | www.plosone.org 13 February 2008 | Volume 3 | Issue 2 | e1564

Found at: doi:10.1371/journal.pone.0001564.s002 (3.24 MB TIF)
Table S1 219 mouse genes: probe/gene mean fold change
Found at: doi:10.1371/journal.pone.0001564.s003 (0.08 MB
XLS)
Table S2 Rich network connections for 5 common mouse/
human genes (Ingenuity Pathway Analysis)
Found at: doi:10.1371/journal.pone.0001564.s004 (0.02 MB
XLS)
Acknowledgments
The authors wish to thank Drs. Daniel G. Remick and Derek C. Angus for
providing cytokine and procalcitonin measurements, respectively. We also
acknowledge the technical and clinical expertise of Sandra MacMillan,
Douglas Oppedal, Diane Salamon, Barbara Anderson, and Sharon Daube.
Author Contributions
Conceived and designed the experiments: JC MC JM CC WD BG.
Performed the experiments: JM KH. Analyzed the data: JC JM KH AP
NL QL AB JR WZ BG DD WS. Contributed reagents/materials/analysis
tools: JM AP NL QL AB JR WZ BG WS. Wrote the paper: JC JM AP AB
WZ CC WS. Other: Designed the study: JC.
References
1. Smith JW, Gamelli RL, Jones SB, Shankar R (2006) Immunologic responses to
critical injury and sepsis. J Intensive Care Med 21: 160–172.2. Ayala A, Chung CS, Grutkoski PS, Song GY (2003) Mechanisms of immune
resolution. Crit Care Med 31: S558–S571.3. Hotchkiss RS, Karl IE (2003) The pathophysiology and treatment of sepsis.
N Engl J Med 348: 138–150.
4. Cobb JP, O’Keefe GE (2004) Injury research in the genomic era. Lancet 363:2076–2083.
5. Osuchowski MF, Welch K, Siddiqui J, Remick DG (2006) Circulating cytokine/inhibitor profiles reshape the understanding of the SIRS/CARS continuum in
sepsis and predict mortality. J Immunol 177: 1967–1974.6. Levy MM, Fink MP, Marshall JC, Abraham E, Angus D, et al. (2003) 2001
SCCM/ESICM/ACCP/ATS/SIS International Sepsis Definitions Conference.
Crit Care Med 31: 1250–1256.7. Vincent JL (2003) Nosocomial infections in adult intensive-care units. Lancet
361: 2068–2077.8. Craven DE (2006) Preventing ventilator-associated pneumonia in adults: sowing
seeds of change. Chest 130: 251–260.
9. Dominguez AA, Arango MV, Torres A (2006) Treatment failure in patients withventilator-associated pneumonia. Semin Respir Crit Care Med 27: 104–114.
10. Nau GJ, Richmond JF, Schlesinger A, Jennings EG, Lander ES, et al. (2002)Human macrophage activation programs induced by bacterial pathogens. Proc
Natl Acad Sci U S A 99: 1503–1508.11. Huang Q, Liu D, Majewski P, Schulte LC, Korn JM, et al. (2001) The plasticity
of dendritic cell responses to pathogens and their components. Science 294:
870–875.12. McDunn JE, Chung TP, Laramie JM, Townsend RR, Cobb JP (2006)
Physiologic genomics. Surgery 139: 133–139.13. Cobb JP, Mindrinos MN, Miller-Graziano C, Calvano SE, Baker HV, et al.
(2005) Application of genome-wide expression analysis to human health and
disease. Proc Natl Acad Sci U S A 102: 4801–4806.14. Calvano SE, Xiao W, Richards DR, Felciano RM, Baker HV, et al. (2005) A
network-based analysis of systemic inflammation in humans. Nature 437:1032–1037.
15. Chung TP, Laramie JM, Meyer DJ, Downey T, Tam LH, et al. (2006)Molecular diagnostics in sepsis: from bedside to bench. J Am Coll Surg 203:
585–598.
16. (2005) Guidelines for the management of adults with hospital-acquired,ventilator-associated, and healthcare-associated pneumonia. Am J Respir Crit
Care Med 171: 388–416.17. Coopersmith CM, Stromberg PE, Dunne WM, Davis CG, Amiot DM, et al.
(2002) Inhibition of intestinal epithelial apoptosis and survival in a murine model
of pneumonia-induced sepsis. JAMA 287: 1716–1721.18. Starke JR, Edwards MS, Langston C, Baker CJ (1987) A mouse model of
chronic pulmonary infection with Pseudomonas aeruginosa and Pseudomonascepacia. Pediatr Res 22: 698–702.
19. Brownstein BH, Logvinenko T, Lederer JA, Cobb JP, Hubbard WJ, et al. (2006)
Commonality and differences in leukocyte gene expression patterns among threemodels of inflammation and injury. Physiol Genomics 24: 298–309.
20. Bolstad BM, Irizarry RA, Astrand M, Speed TP (2003) A comparison ofnormalization methods for high density oligonucleotide array data based on
variance and bias. Bioinformatics 19: 185–193.
21. Calandra T, Cohen J (2005) The international sepsis forum consensus
conference on definitions of infection in the intensive care unit. Crit CareMed 33: 1538–1548.
22. Knight PR, Sreekumar A, Siddiqui J, Laxman B, Copeland S, et al. (2004)Development of a sensitive microarray immunoassay and comparison with
standard enzyme-linked immunoassay for cytokine analysis. Shock 21: 26–30.
23. Leek JT, Monsen E, Dabney AR, Storey JD (2006) EDGE: extraction andanalysis of differential gene expression. Bioinformatics 22: 507–508.
24. Dennis G, Jr, Sherman BT, Hosack DA, Yang J, Gao W, et al. (2003) DAVID:Database for Annotation, Visualization, and Integrated Discovery. Genome Biol
4: 3.25. Ruan J, Zhang W (2007) Identifying network communities with a high
resolution. Phys Rev E, (in press).
26. Ruan J, Zhang W (2006) Identification and evaluation of functional modules ingene co-expression networks. Proceedings of RECOMB Satellite Conferences on
Systems Biology and Computational Proteomics.27. Van-Trees H (1968) Detection, estimation, and modulation theory. Part I.
28. Naderi A, Ahmed AA, Barbosa-Morais NL, Aparicio S, Brenton JD, et al. (2004)
Expression microarray reproducibility is improved by optimising purificationsteps in RNA amplification and labelling. BMC Genomics 5: 9.
29. Giantsou E, Liratzopoulos N, Efraimidou E, Panopoulou M, Alepopoulou E, etal. (2005) Both early-onset and late-onset ventilator-associated pneumonia are
caused mainly by potentially multiresistant bacteria. Intensive Care Med 31:1488–1494.
30. Perl M, Gebhard F, Bruckner UB, Ayala A, Braumuller S, et al. (2005)
Pulmonary contusion causes impairment of macrophage and lymphocyteimmune functions and increases mortality associated with a subsequent septic
challenge. Crit Care Med 33: 1351–1358.31. Kinoshita K, Yamaguchi J, Sakurai A, Ebihara T, Furukawa M, et al. (2007)
Inhibition of lipopolysaccharide stimulated interleukin-1beta production after
subarachnoid hemorrhage. Neurol Res 29: 47–52.32. Kauffman SA (1969) Metabolic stability and epigenesis in randomly constructed
genetic nets. J Theor Biol 22: 437–467.33. Kauffman SA (1993) The origins of order. Oxford University Press.
34. Huang S, Eichler G, Bar-Yam Y, Ingber DE (2005) Cell fates as high-dimensional attractor states of a complex gene regulatory network. Phys Rev
Lett 94: 128701.
35. Bagley RJ, Glass L (1996) Counting and classifying attractors in highdimensional dynamical systems. J Theor Biol 183: 269–284.
36. Spielman RS, Bastone LA, Burdick JT, Morley M, Ewens WJ, et al. (2007)Common genetic variants account for differences in gene expression among
ethnic groups. Nat Genet 39: 226–231.
37. Martin GS, Mannino DM, Eaton S, Moss M (2003) The epidemiology of sepsisin the United States from 1979 through 2000. N Engl J Med 348: 1546–1554.
38. Ramilo O, Allman W, Chung W, Mejias A, Ardura M, et al. (2007) Geneexpression patterns in blood leukocytes discriminate patients with acute
infections. Blood 109: 2066–2077.
39. Johnson SB, Lissauer M, Bochicchio GV, Moore R, Cross AS, et al. (2007) Geneexpression profiles differentiate between sterile SIRS and early sepsis. Ann Surg
245: 611–621.40. Cobb JP, Suffredini AF, Danner RL (2007) Functional Genomics of Critical
Illness and Injury: Fourth NIH Symposium. submitted.
Development of Riboleukogram
PLoS ONE | www.plosone.org 14 February 2008 | Volume 3 | Issue 2 | e1564