Plastic Surgery Statistics Report 2016 · 2016 Plastic Surgery Statistics Report ASPS Public...
25
ASPS Public Relations Phone: 847-228-9900 Fax: 847-981-5482 Email: [email protected] www.PlasticSurgery.org ASPS National Clearinghouse of Plastic Surgery Procedural Statistics
Transcript of Plastic Surgery Statistics Report 2016 · 2016 Plastic Surgery Statistics Report ASPS Public...
ASPS Public Relations Phone: 847-228-9900 Fax: 847-981-5482 Email: [email protected] www.PlasticSurgery.org
ASPS National Clearinghouse of Plastic Surgery Procedural Statistics
2016 Plastic Surgery Statistics Report
ASPS Public RelationsPhone: 847-228-9900Fax: 847-981-5482Email: [email protected] Website: www.plasticsurgery.org
Please credit the AMERICAN SOCIETY OF PLASTIC SURGEONS when citing statistical data or using graphics.
2
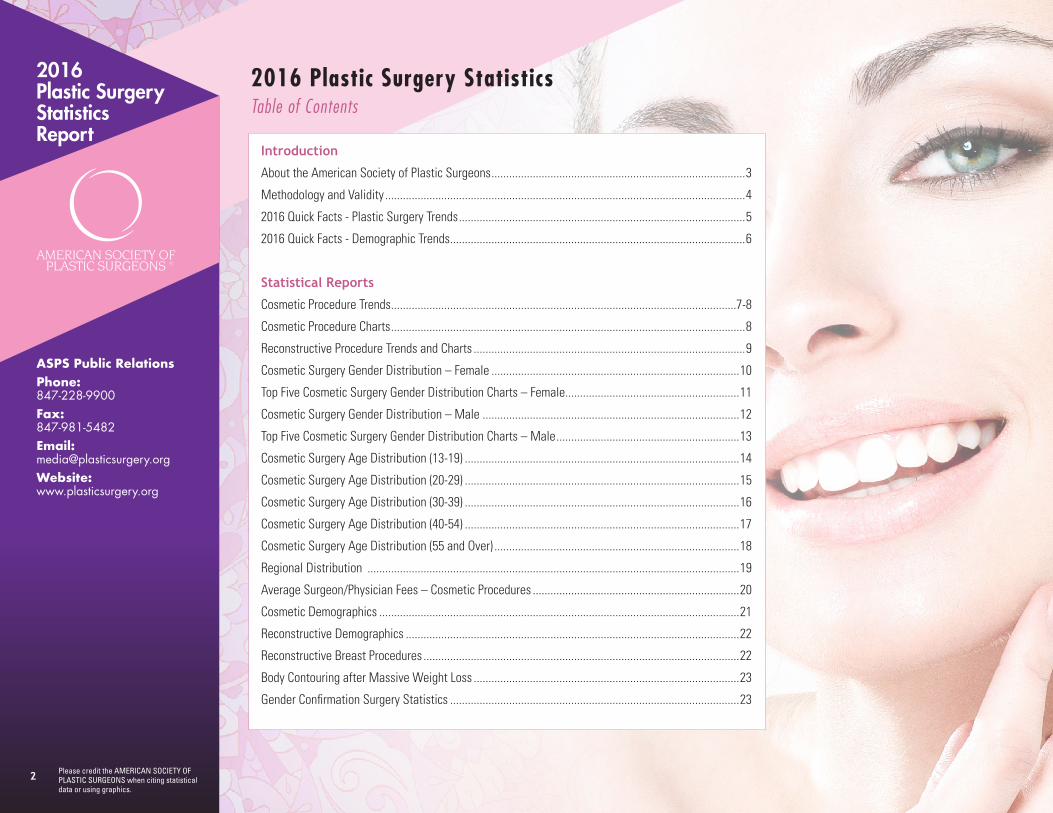
2016 Plastic Surgery StatisticsTable of Contents
Introduction
About the American Society of Plastic Surgeons ......................................................................................3
Methodology and Validity ..........................................................................................................................4
2016 Quick Facts - Plastic Surgery Trends .................................................................................................5
2016 Quick Facts - Demographic Trends ....................................................................................................6
Statistical Reports
Cosmetic Procedure Trends .....................................................................................................................7-8
Cosmetic Procedure Charts ........................................................................................................................8
Reconstructive Procedure Trends and Charts ............................................................................................9
Cosmetic Surgery Gender Distribution – Female ....................................................................................10
Top Five Cosmetic Surgery Gender Distribution Charts – Female ...........................................................11
Cosmetic Surgery Gender Distribution – Male .......................................................................................12
Top Five Cosmetic Surgery Gender Distribution Charts – Male ..............................................................13
Cosmetic Surgery Age Distribution (13-19) .............................................................................................14
Cosmetic Surgery Age Distribution (20-29) .............................................................................................15
Cosmetic Surgery Age Distribution (30-39) .............................................................................................16
Cosmetic Surgery Age Distribution (40-54) .............................................................................................17
Cosmetic Surgery Age Distribution (55 and Over) ...................................................................................18
Regional Distribution ..............................................................................................................................19
Average Surgeon/Physician Fees – Cosmetic Procedures ......................................................................20
Cosmetic Demographics ..........................................................................................................................21
Reconstructive Demographics .................................................................................................................22
Reconstructive Breast Procedures ...........................................................................................................22
Body Contouring after Massive Weight Loss ..........................................................................................23
Gender Confirmation Surgery Statistics ..................................................................................................23
2016 Plastic Surgery Statistics Report
ASPS Public RelationsPhone: 847-228-9900Fax: 847-981-5482Email: [email protected] Website: www.plasticsurgery.org
Please credit the AMERICAN SOCIETY OF PLASTIC SURGEONS when citing statistical data or using graphics.
3
2016 Plastic Surgery StatisticsAbout the American Society of Plastic Surgeons
The American Society of Plastic Surgeons®
ASPS®, a non-profit organization, supports members in their efforts to provide the highest quality patient care through education, research and advocacy. It is the only organization with two decades of plastic surgery statistics – 1992-2015. ASPS is the largest organization of board-certified plastic surgeons in the world. With more than 7,000 members, the Society is recognized as a leading authority and information source on cosmetic and reconstructive plastic surgery. ASPS comprises more than 94 percent of all board-certified plastic surgeons in the United States. Founded in 1931, the Society represents physicians certified by The American Board of Plastic Surgery, Inc.® (ABPS®) or The Royal College of Physicians and Surgeons of Canada.
The ASPS mission is to advance quality care to plastic surgery patients by encouraging high standards of training, ethics, physician practice, and research in plastic surgery.
ASPS Member Surgeons are uniquely qualified to perform cosmetic and reconstructive plastic surgery on the face and all areas of the body.
Consumers can visit the ASPS at PlasticSurgery.org to find ASPS Member Surgeons in their area or learn more about cosmetic and reconstructive plastic surgery, like us on Facebook.com/PlasticSurgeryASPS and follow us at Twitter.com/ASPS_News.
ASPS Spokespersons Network
The ASPS Spokespersons Network is a valuable plastic surgery resource. It comprises more than 100 plastic surgeons from across the United States and Canada trained and available to assist journalists.
These spokespersons provide expert perspectives on a broad range of plastic surgery topics including procedural details, the patient-physician relationship, emerging trends, teens, and minorities.
They are also knowledgeable about the Society’s positions on health care reform, scope of practice and other issues that affect patient care.
To arrange interviews with members of the ASPS Spokespersons Network, contact the ASPS Public Relations Department.
PlasticSurgery.org
The ASPS online newsroom is the most comprehensive site for journalistic research on cosmetic and reconstructive plastic surgery on the Internet. The latest news releases and the online version of the National Clearinghouse of Plastic Surgery Statistics are available.
Full color graphics and statistical graphs can be downloaded or are available by contacting the ASPS Public Relations Department.
Pre- and Postoperative Photos and B-Roll
ASPS has a library of pre- and postoperative images and B-roll available to the media by contacting the ASPS Public Relations Department.
ASPS Member Surgeons have the following qualifications:
✔ Are certified by The American Board of Plastic Surgery and trained specifically in plastic surgery.
✔ Have at least 6 years surgical training, minimum of 3 years plastic surgery training.
✔ Operate only in accredited medical facilities.
✔ Adhere to a strict code of ethics.
✔ Fulfill continuing education requirements, including patient safety techniques.
✔ Are partners with patients in cosmetic and reconstructive plastic surgery.
Please credit the AMERICAN SOCIETY OF PLASTIC SURGEONS when citing statistical data or using graphics.
4
2016 Plastic Surgery Statistics Report
4
ASPS Public RelationsPhone: 847-228-9900Fax: 847-981-5482Email: [email protected] Website: www.plasticsurgery.org
2016 Plastic Surgery StatisticsMethodology and Validity
Methodology
Since 1992, the American Society of Plastic Surgeons® (ASPS®) has been the source of cosmetic and reconstructive plastic surgery statistical trends in the U.S., and this series represents two decades of procedural data. ASPS has partnered with Data Harbor Solutions, a health care industry data management and technology development company, to ensure objectivity in the gathering, analysis and publication of its procedural statistics.
Since 2000, the report represents a universal and comprehensive estimate of cosmetic and reconstructive plastic surgery procedures performed by ASPS Member Surgeons as well as other physicians most likely to perform plastic surgery procedures. These physicians are all certified by American Board of Medical Specialties (ABMS) recognized boards.
ABMS is the umbrella organization for the 24 approved medical specialty boards in the United States. Established in 1933, ABMS serves to provide information concerning issues involving specialization and certification in medicine. The American Board of Plastic Surgery® (ABPS®) represents physicians who are certified by ABPS®, the only ABMS member board that certifies surgeons in plastic surgery of the face and entire body.
ASPS offers the most comprehensive, reliable statistics on cosmetic and reconstructive plastic surgery procedures performed in the United States. The annual questionnaire was distributed to 24,600 ABMS board-certified physicians (An online and faxed version of the questionnaire were made available. A total of 513 active physicians returned questionnaires. Overall, 703 active physicians were included in the final sample). This data is combined with the first online national database for plastic surgery procedures Tracking Operations and Outcomes for Plastic SurgeonsSM (TOPSSM).
All responses are aggregated and extrapolated to the entire population of more than 24,500 board certified physicians most likely to perform cosmetic and reconstructive plastic surgery procedures, resulting in the most accurate census available.
Validity
Results of the survey are based on a 95 percent confidence level with a ±4.28 percent margin of error.
2016 Plastic Surgery Statistics Report
ASPS Public RelationsPhone: 847-228-9900Fax: 847-981-5482Email: [email protected] Website: www.plasticsurgery.org
Please credit the AMERICAN SOCIETY OF PLASTIC SURGEONS when citing statistical data or using graphics.
5
2016 Quick FactsCosmetic and Reconstructive Plastic Surgery Trends
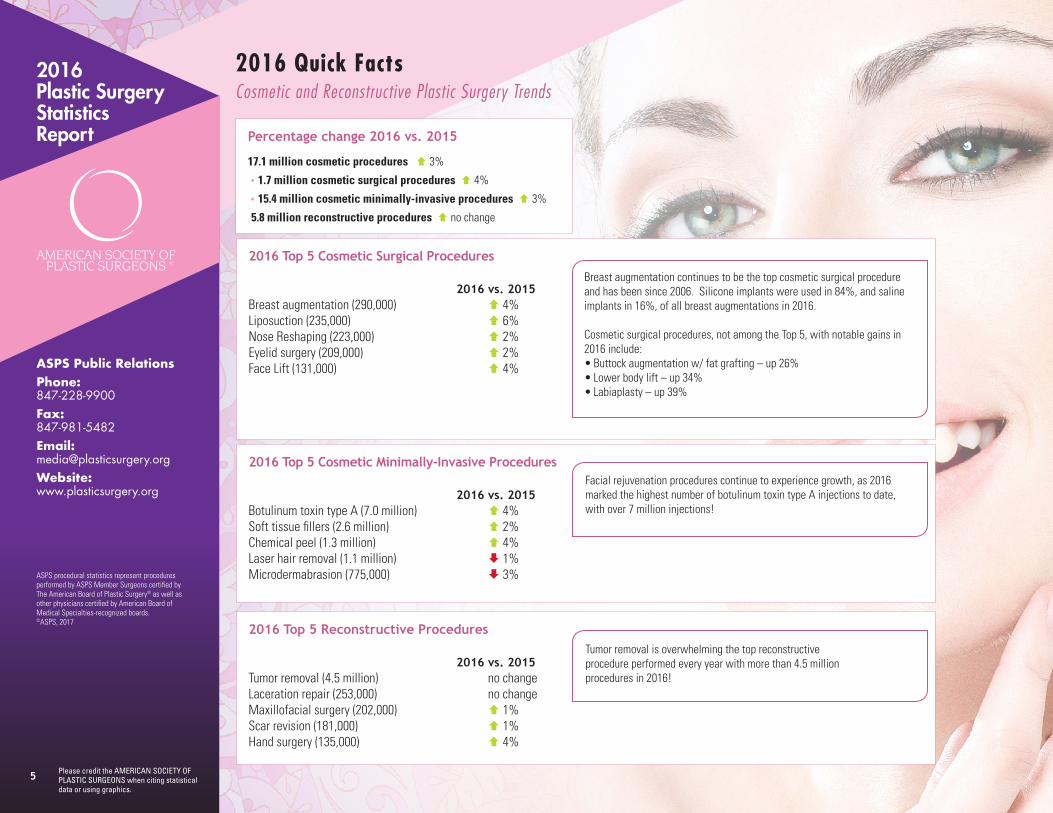
2016 Top 5 Cosmetic Surgical Procedures 2016 vs. 2015Breast augmentation (290,000) 4% Liposuction (235,000) 6% Nose Reshaping (223,000) 2% Eyelid surgery (209,000) 2% Face Lift (131,000) 4%
Percentage change 2016 vs. 2015
17.1 million cosmetic procedures 3%
• 1.7 million cosmetic surgical procedures 4%
• 15.4 million cosmetic minimally-invasive procedures 3%
5.8 million reconstructive procedures no change
2016 Top 5 Cosmetic Minimally-Invasive Procedures
2016 vs. 2015Botulinum toxin type A (7.0 million) 4% Soft tissue fillers (2.6 million) 2% Chemical peel (1.3 million) 4% Laser hair removal (1.1 million) 1% Microdermabrasion (775,000) 3%
2016 Top 5 Reconstructive Procedures
2016 vs. 2015Tumor removal (4.5 million) no change Laceration repair (253,000) no change Maxillofacial surgery (202,000) 1%Scar revision (181,000) 1% Hand surgery (135,000) 4%
Breast augmentation continues to be the top cosmetic surgical procedureand has been since 2006. Silicone implants were used in 84%, and saline implants in 16%, of all breast augmentations in 2016.
Cosmetic surgical procedures, not among the Top 5, with notable gains in 2016 include: • Buttock augmentation w/ fat grafting – up 26%• Lower body lift – up 34%• Labiaplasty – up 39%
Facial rejuvenation procedures continue to experience growth, as 2016 marked the highest number of botulinum toxin type A injections to date, with over 7 million injections!
Tumor removal is overwhelming the top reconstructive procedure performed every year with more than 4.5 million procedures in 2016!
ASPS procedural statistics represent procedures performed by ASPS Member Surgeons certified by The American Board of Plastic Surgery® as well as other physicians certified by American Board of Medical Specialties-recognized boards. ©ASPS, 2017
Please credit the AMERICAN SOCIETY OF PLASTIC SURGEONS when citing statistical data or using graphics.
6
2016 Plastic Surgery Statistics Report
6
ASPS Public RelationsPhone: 847-228-9900Fax: 847-981-5482Email: [email protected] Website: www.plasticsurgery.org
ASPS procedural statistics represent procedures performed by ASPS Member Surgeons certified by The American Board of Plastic Surgery® as well as other physicians certified by American Board of Medical Specialties-recognized boards. ©ASPS, 2017
2016 Quick FactsCosmetic Plastic Surgery Demographic Trends
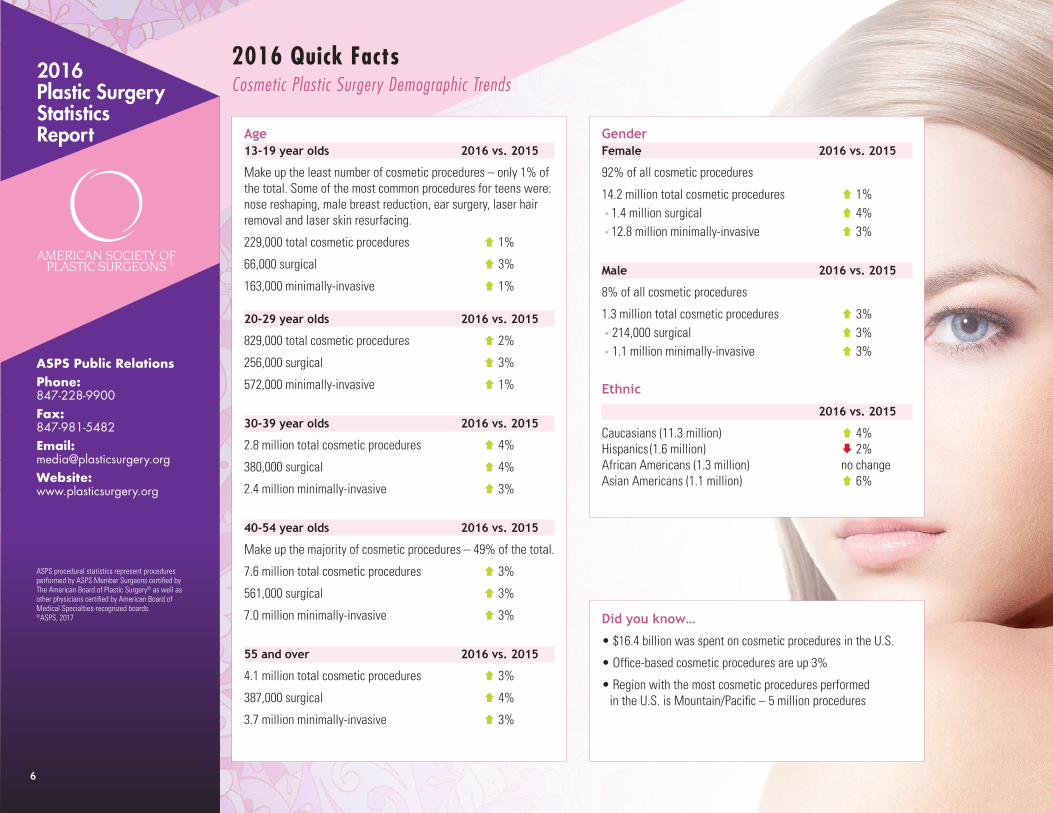
Age13-19 year olds 2016 vs. 2015
Make up the least number of cosmetic procedures – only 1% of the total. Some of the most common procedures for teens were: nose reshaping, male breast reduction, ear surgery, laser hair removal and laser skin resurfacing.
229,000 total cosmetic procedures 1%
66,000 surgical 3%
163,000 minimally-invasive 1%
20-29 year olds 2016 vs. 2015
829,000 total cosmetic procedures 2%
256,000 surgical 3%
572,000 minimally-invasive ↑ 1%
30-39 year olds 2016 vs. 2015
2.8 million total cosmetic procedures 4%
380,000 surgical 4%
2.4 million minimally-invasive 3%
40-54 year olds 2016 vs. 2015
Make up the majority of cosmetic procedures – 49% of the total.
7.6 million total cosmetic procedures 3%
561,000 surgical ↑ 3%
7.0 million minimally-invasive 3%
55 and over 2016 vs. 2015
4.1 million total cosmetic procedures ↑ 3%
387,000 surgical 4%
3.7 million minimally-invasive 3%
Gender Female 2016 vs. 2015
92% of all cosmetic procedures
14.2 million total cosmetic procedures 1% • 1.4 million surgical 4% • 12.8 million minimally-invasive 3%
Male 2016 vs. 2015
8% of all cosmetic procedures
1.3 million total cosmetic procedures 3% • 214,000 surgical 3% • 1.1 million minimally-invasive 3%
Ethnic
2016 vs. 2015
Caucasians (11.3 million) 4% Hispanics (1.6 million) 2% African Americans (1.3 million) no change Asian Americans (1.1 million) 6%
Did you know…
• $16.4 billion was spent on cosmetic procedures in the U.S.
• Office-based cosmetic procedures are up 3%
• Region with the most cosmetic procedures performed in the U.S. is Mountain/Pacific – 5 million procedures
2016 Plastic Surgery Statistics Report
ASPS Public RelationsPhone: 847-228-9900Fax: 847-981-5482Email: [email protected] Website: www.plasticsurgery.org
Please credit the AMERICAN SOCIETY OF PLASTIC SURGEONS when citing statistical data or using graphics.
7
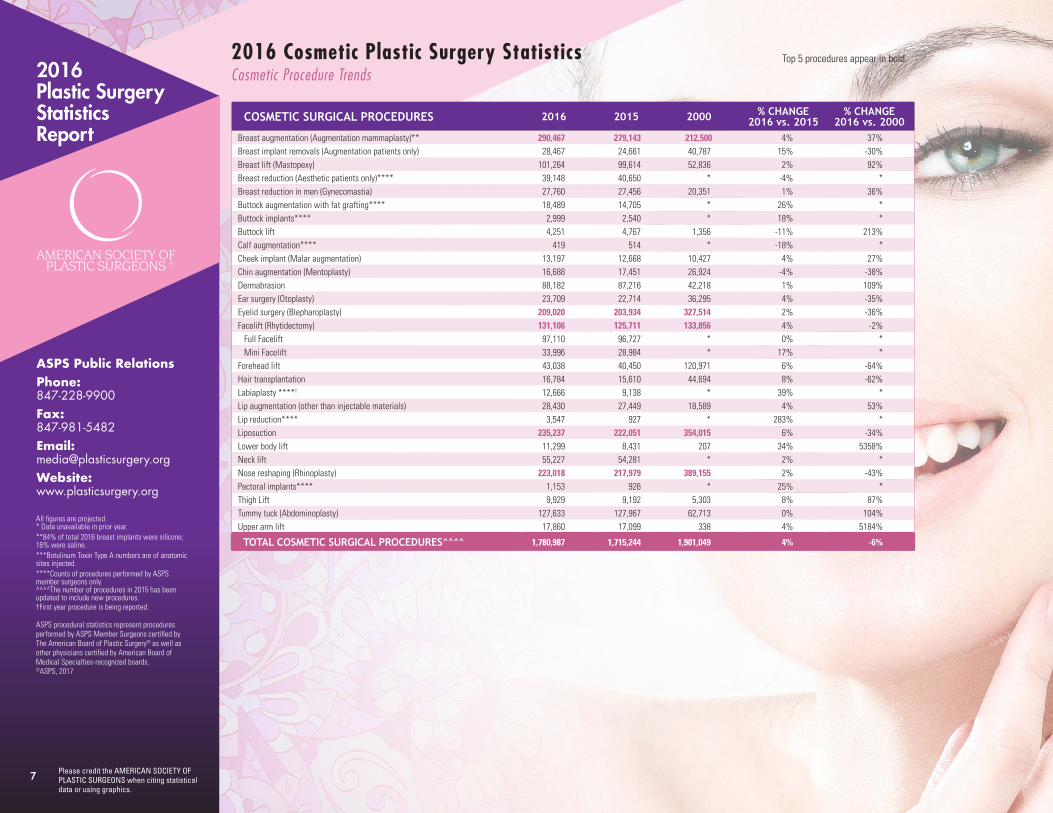
All figures are projected.* Data unavailable in prior year.**84% of total 2016 breast implants were silicone; 16% were saline.***Botulinum Toxin Type A numbers are of anatomic sites injected.****Counts of procedures performed by ASPS member surgeons only. ^^^^The number of procedures in 2015 has been updated to include new procedures. †First year procedure is being reported.
ASPS procedural statistics represent procedures performed by ASPS Member Surgeons certified by The American Board of Plastic Surgery® as well as other physicians certified by American Board of Medical Specialties-recognized boards. ©ASPS, 2017
2016 Cosmetic Plastic Surgery StatisticsCosmetic Procedure Trends
COSMETIC SURGICAL PROCEDURES 2016 2015 2000 % CHANGE2016 vs. 2015
% CHANGE2016 vs. 2000
Breast augmentation (Augmentation mammaplasty)** 290,467 279,143 212,500 4% 37%Breast implant removals (Augmentation patients only) 28,467 24,661 40,787 15% -30%Breast lift (Mastopexy) 101,264 99,614 52,836 2% 92%Breast reduction (Aesthetic patients only)**** 39,148 40,650 * -4% *Breast reduction in men (Gynecomastia) 27,760 27,456 20,351 1% 36%Buttock augmentation with fat grafting**** 18,489 14,705 * 26% *Buttock implants**** 2,999 2,540 * 18% *Buttock lift 4,251 4,767 1,356 -11% 213%Calf augmentation**** 419 514 * -18% *Cheek implant (Malar augmentation) 13,197 12,668 10,427 4% 27%Chin augmentation (Mentoplasty) 16,688 17,451 26,924 -4% -38%Dermabrasion 88,182 87,216 42,218 1% 109%Ear surgery (Otoplasty) 23,709 22,714 36,295 4% -35%Eyelid surgery (Blepharoplasty) 209,020 203,934 327,514 2% -36%Facelift (Rhytidectomy) 131,106 125,711 133,856 4% -2% Full Facelift 97,110 96,727 * 0% * Mini Facelift 33,996 28,984 * 17% *Forehead lift 43,038 40,450 120,971 6% -64%Hair transplantation 16,784 15,610 44,694 8% -62%Labiaplasty ****† ↑ 12,666 9,138 * 39% *Lip augmentation (other than injectable materials) 28,430 27,449 18,589 4% 53%Lip reduction**** 3,547 927 * 283% *Liposuction 235,237 222,051 354,015 6% -34%Lower body lift 11,299 8,431 207 34% 5358%Neck lift 55,227 54,281 * 2% *Nose reshaping (Rhinoplasty) 223,018 217,979 389,155 2% -43%Pectoral implants**** 1,153 926 * 25% *Thigh Lift 9,929 9,192 5,303 8% 87%Tummy tuck (Abdominoplasty) 127,633 127,967 62,713 0% 104%Upper arm lift 17,860 17,099 338 4% 5184%
TOTAL COSMETIC SURGICAL PROCEDURES^^^^ 1,780,987 1,715,244 1,901,049 4% -6%
Top 5 procedures appear in bold.
2016 Plastic Surgery Statistics Report
ASPS Public RelationsPhone: 847-228-9900Fax: 847-981-5482Email: [email protected] Website: www.plasticsurgery.org
Please credit the AMERICAN SOCIETY OF PLASTIC SURGEONS when citing statistical data or using graphics.
8
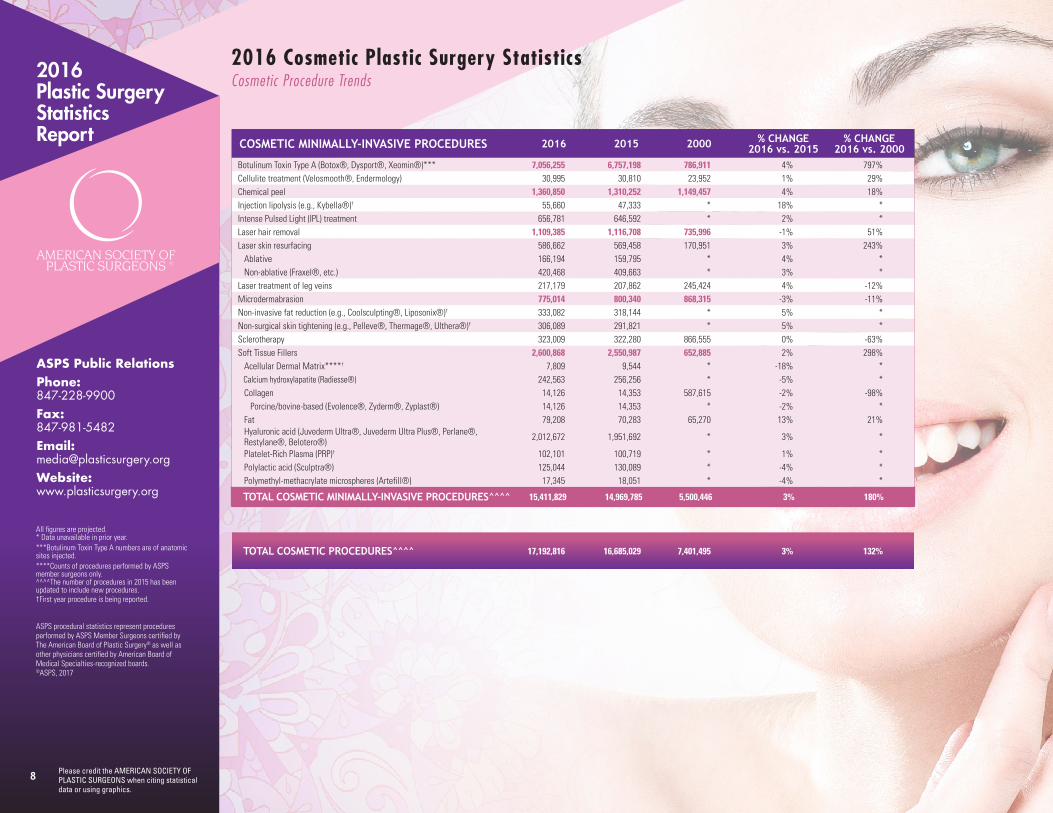
All figures are projected.* Data unavailable in prior year.***Botulinum Toxin Type A numbers are of anatomic sites injected.****Counts of procedures performed by ASPS member surgeons only. ^^^^The number of procedures in 2015 has been updated to include new procedures. †First year procedure is being reported.
ASPS procedural statistics represent procedures performed by ASPS Member Surgeons certified by The American Board of Plastic Surgery® as well as other physicians certified by American Board of Medical Specialties-recognized boards. ©ASPS, 2017
COSMETIC MINIMALLY-INVASIVE PROCEDURES 2016 2015 2000 % CHANGE2016 vs. 2015
% CHANGE2016 vs. 2000
Botulinum Toxin Type A (Botox®, Dysport®, Xeomin®)*** 7,056,255 6,757,198 786,911 4% 797%Cellulite treatment (Velosmooth®, Endermology) 30,995 30,810 23,952 1% 29%Chemical peel 1,360,850 1,310,252 1,149,457 4% 18%Injection lipolysis (e.g., Kybella®)†↑ 55,660 47,333 * 18% *Intense Pulsed Light (IPL) treatment 656,781 646,592 * 2% *Laser hair removal 1,109,385 1,116,708 735,996 -1% 51%Laser skin resurfacing 586,662 569,458 170,951 3% 243% Ablative 166,194 159,795 * 4% * Non-ablative (Fraxel®, etc.) 420,468 409,663 * 3% *Laser treatment of leg veins 217,179 207,862 245,424 4% -12%Microdermabrasion 775,014 800,340 868,315 -3% -11%Non-invasive fat reduction (e.g., Coolsculpting®, Liposonix®)†↑ 333,082 318,144 * 5% *Non-surgical skin tightening (e.g., Pelleve®, Thermage®, Ulthera®)† 306,089 291,821 * 5% *Sclerotherapy 323,009 322,280 866,555 0% -63%Soft Tissue Fillers 2,600,868 2,550,987 652,885 2% 298% Acellular Dermal Matrix****† ↑ 7,809 9,544 * -18% * Calcium hydroxylapatite (Radiesse®) 242,563 256,256 * -5% * Collagen 14,126 14,353 587,615 -2% -98% Porcine/bovine-based (Evolence®, Zyderm®, Zyplast®) 14,126 14,353 * -2% * Fat 79,208 70,283 65,270 13% 21% Hyaluronic acid (Juvederm Ultra®, Juvederm Ultra Plus®, Perlane®, Restylane®, Belotero®) 2,012,672 1,951,692 * 3% *
Platelet-Rich Plasma (PRP)†↑ 102,101 100,719 * 1% * Polylactic acid (Sculptra®) 125,044 130,089 * -4% * Polymethyl-methacrylate microspheres (Artefill®) 17,345 18,051 * -4% *
TOTAL COSMETIC MINIMALLY-INVASIVE PROCEDURES^^^^ 15,411,829 14,969,785 5,500,446 3% 180%
TOTAL COSMETIC PROCEDURES^^^^ 17,192,816 16,685,029 7,401,495 3% 132%
2016 Cosmetic Plastic Surgery StatisticsCosmetic Procedure Trends
2016 Plastic Surgery Statistics Report
ASPS Public RelationsPhone: 847-228-9900Fax: 847-981-5482Email: [email protected] Website: www.plasticsurgery.org
Please credit the AMERICAN SOCIETY OF PLASTIC SURGEONS when citing statistical data or using graphics.
9
ASPS procedural statistics represent procedures performed by ASPS Member Surgeons certified by The American Board of Plastic Surgery® as well as other physicians certified by American Board of Medical Specialties-recognized boards. ©ASPS, 2017
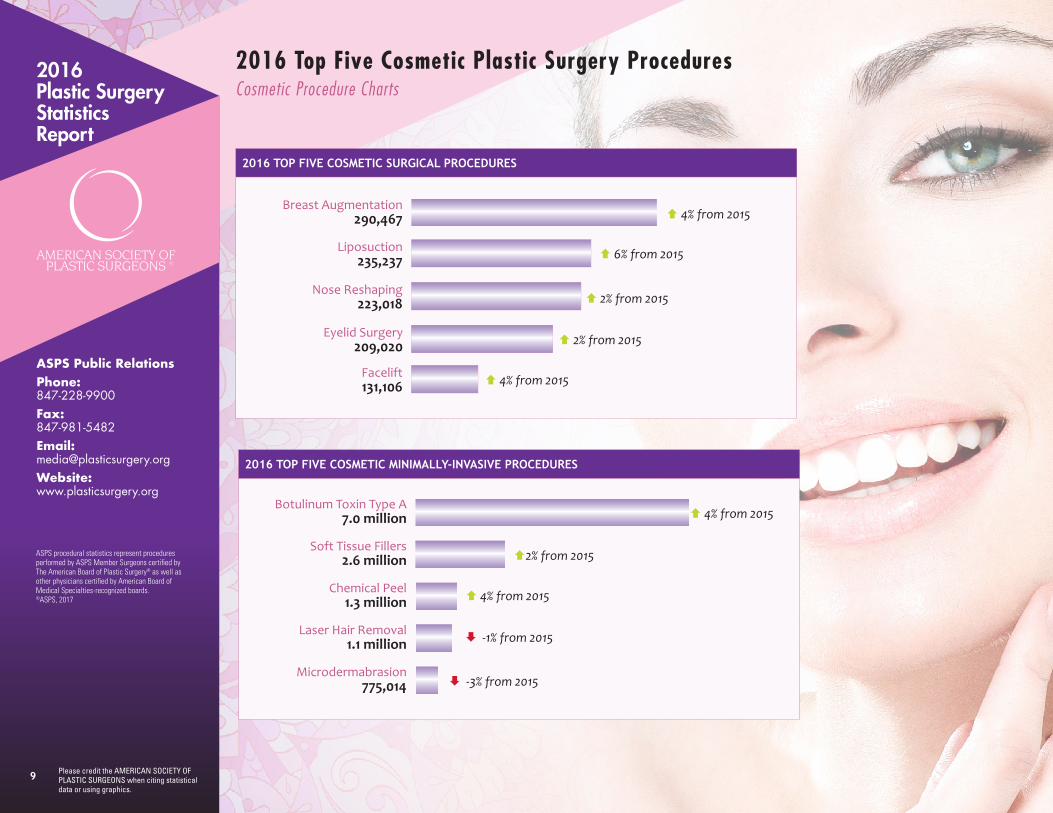
2016 Top Five Cosmetic Plastic Surgery ProceduresCosmetic Procedure Charts
Breast Augmentation290,467
Liposuction235,237
Eyelid Surgery209,020
Facelift131,106
2016 TOP FIVE COSMETIC SURGICAL PROCEDURES
Nose Reshaping223,018 2% from 2015
6% from 2015
2% from 2015
4% from 2015
4% from 2015
Botulinum Toxin Type A 7.0 million
Soft Tissue Fillers2.6 million
Chemical Peel1.3 million
Laser Hair Removal1.1 million
Microdermabrasion775,014
4% from 2015
2% from 2015
4% from 2015
2016 TOP FIVE COSMETIC MINIMALLY-INVASIVE PROCEDURES
-1% from 2015
-3% from 2015
Please credit the AMERICAN SOCIETY OF PLASTIC SURGEONS when citing statistical data or using graphics.
10
2016 Plastic Surgery Statistics Report
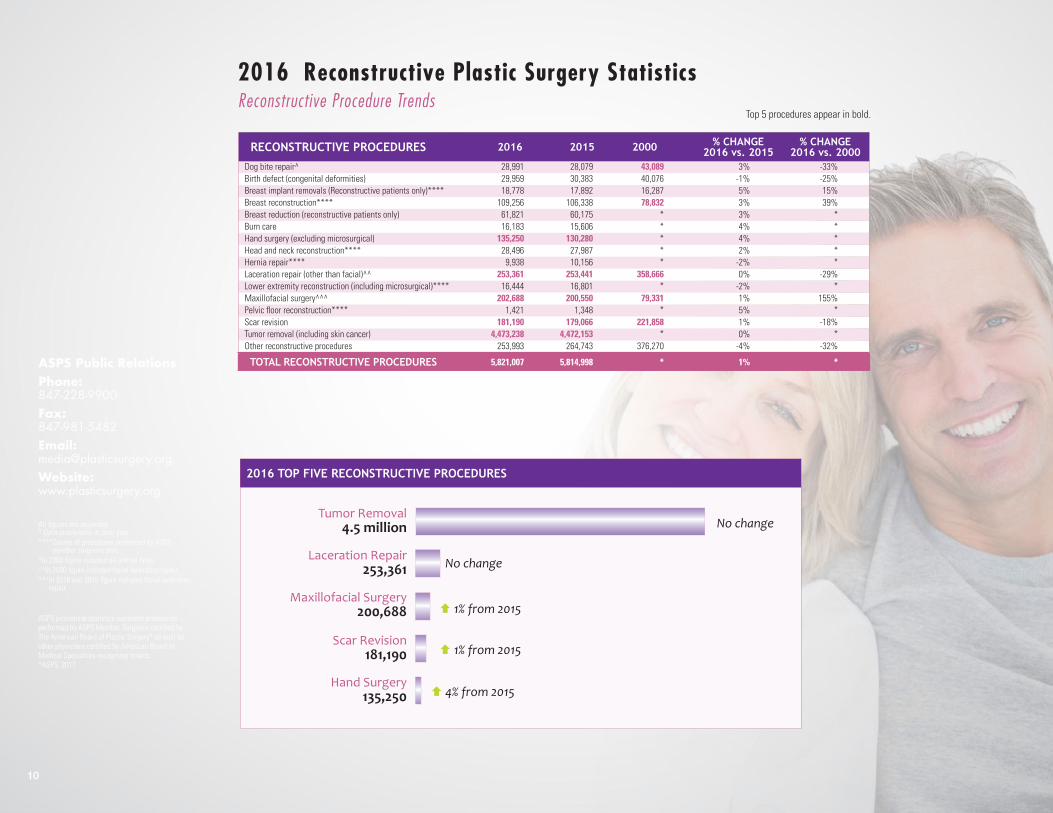
2016 Reconstructive Plastic Surgery StatisticsReconstructive Procedure Trends
RECONSTRUCTIVE PROCEDURES 2016 2015 2000 % CHANGE2016 vs. 2015
% CHANGE2016 vs. 2000
Dog bite repair^ 28,991 28,079 43,089 3% -33%Birth defect (congenital deformities) 29,959 30,383 40,076 -1% -25%Breast implant removals (Reconstructive patients only)**** 18,778 17,892 16,287 5% 15%Breast reconstruction**** 109,256 106,338 78,832 3% 39%Breast reduction (reconstructive patients only) 61,821 60,175 * 3% *Burn care 16,183 15,606 * 4% *Hand surgery (excluding microsurgical) 135,250 130,280 * 4% *Head and neck reconstruction**** 28,496 27,987 * 2% *Hernia repair**** 9,938 10,156 * -2% *Laceration repair (other than facial)^^ 253,361 253,441 358,666 0% -29%Lower extremity reconstruction (including microsurgical)**** 16,444 16,801 * -2% *Maxillofacial surgery^^^ 202,688 200,550 79,331 1% 155%Pelvic floor reconstruction**** 1,421 1,348 * 5% *Scar revision 181,190 179,066 221,858 1% -18%Tumor removal (including skin cancer) 4,473,238 4,472,153 * 0% *Other reconstructive procedures 253,993 264,743 376,270 -4% -32%
TOTAL RECONSTRUCTIVE PROCEDURES 5,821,007 5,814,998 * 1% *
Top 5 procedures appear in bold.
ASPS Public RelationsPhone: 847-228-9900Fax: 847-981-5482Email: [email protected] Website: www.plasticsurgery.org
All figures are projected.* Data unavailable in prior year.****Counts of procedures performed by ASPS member surgeons only.^In 2000 figure included all animal bites.^^In 2000 figure included facial laceration repair.^^^In 2016 and 2015 figure includes facial laceration repair.
ASPS procedural statistics represent procedures performed by ASPS Member Surgeons certified by The American Board of Plastic Surgery® as well as other physicians certified by American Board of Medical Specialties-recognized boards. ©ASPS, 2017
10
Tumor Removal 4.5 million
Laceration Repair253,361
Maxillofacial Surgery200,688
2016 TOP FIVE RECONSTRUCTIVE PROCEDURES
Scar Revision181,190
Hand Surgery135,250
No change
1% from 2015
4% from 2015
No change
1% from 2015
Please credit the AMERICAN SOCIETY OF PLASTIC SURGEONS when citing statistical data or using graphics.
11
2016 Plastic Surgery Statistics Report
ASPS Public RelationsPhone: 847-228-9900Fax: 847-981-5482Email: [email protected] Website: www.plasticsurgery.org
All figures are projected.* Data unavailable in prior year.**84% of total 2016 breast implants were silicone; 16% were saline.***Botulinum Toxin Type A numbers are of anatomic sites injected. ASPS procedural statistics represent procedures performed by ASPS Member Surgeons certified by The American Board of Plastic Surgery® as well as other physicians certified by American Board of Medical Specialties-recognized boards. ©ASPS, 2017
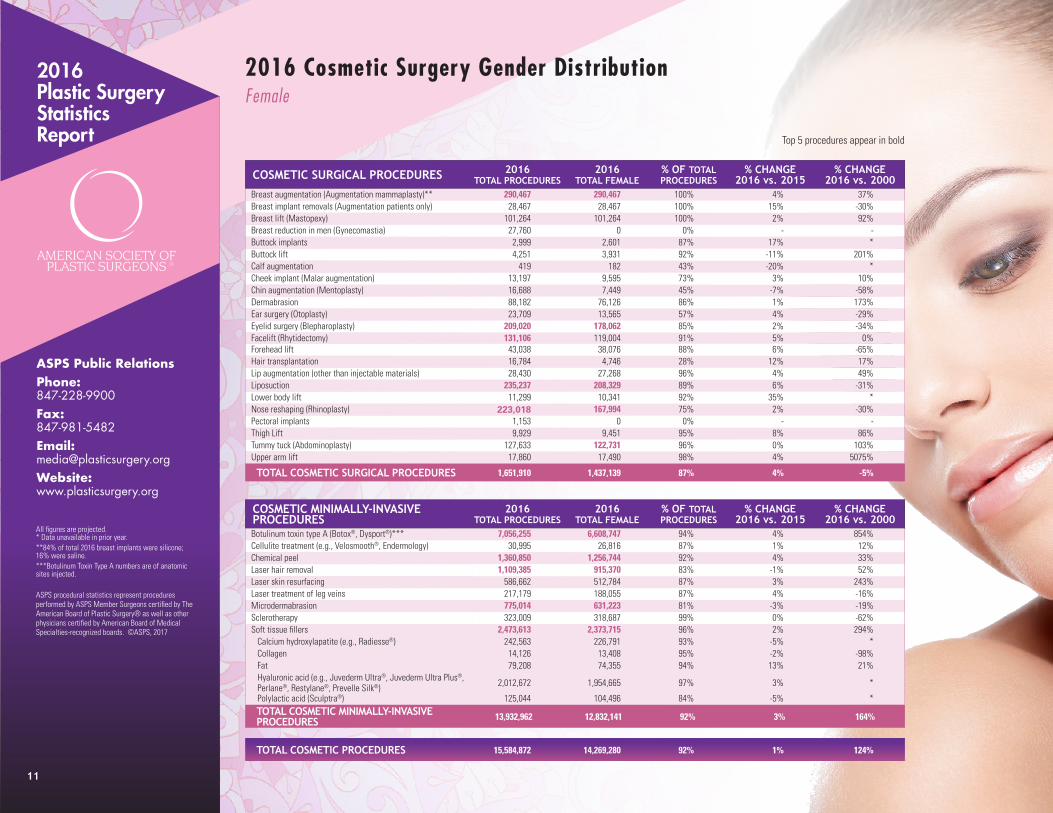
COSMETIC SURGICAL PROCEDURES 2016TOTAL PROCEDURES
2016TOTAL FEMALE
% OF TOTAL PROCEDURES
% CHANGE2016 vs. 2015
% CHANGE2016 vs. 2000
Breast augmentation (Augmentation mammaplasty)** 290,467 290,467 100% 4% 37%Breast implant removals (Augmentation patients only) 28,467 28,467 100% 15% -30%Breast lift (Mastopexy) 101,264 101,264 100% 2% 92%Breast reduction in men (Gynecomastia) 27,760 0 0% - -Buttock implants 2,999 2,601 87% 17% *Buttock lift 4,251 3,931 92% -11% 201%Calf augmentation 419 182 43% -20% *Cheek implant (Malar augmentation) 13,197 9,595 73% 3% 10%Chin augmentation (Mentoplasty) 16,688 7,449 45% -7% -58%Dermabrasion 88,182 76,126 86% 1% 173%Ear surgery (Otoplasty) 23,709 13,565 57% 4% -29%Eyelid surgery (Blepharoplasty) 209,020 178,062 85% 2% -34%Facelift (Rhytidectomy) 131,106 119,004 91% 5% 0%Forehead lift 43,038 38,076 88% 6% -65%Hair transplantation 16,784 4,746 28% 12% 17%Lip augmentation (other than injectable materials) 28,430 27,268 96% 4% 49%Liposuction 235,237 208,329 89% 6% -31%Lower body lift 11,299 10,341 92% 35% *Nose reshaping (Rhinoplasty) 223,018 167,994 75% 2% -30%Pectoral implants 1,153 0 0% - -Thigh Lift 9,929 9,451 95% 8% 86%Tummy tuck (Abdominoplasty) 127,633 122,731 96% 0% 103%Upper arm lift 17,860 17,490 98% 4% 5075%
TOTAL COSMETIC SURGICAL PROCEDURES 1,651,910 1,437,139 87% 4% -5%
COSMETIC MINIMALLY-INVASIVE PROCEDURES
2016TOTAL PROCEDURES
2016TOTAL FEMALE
% OF TOTAL PROCEDURES
% CHANGE2016 vs. 2015
% CHANGE2016 vs. 2000
Botulinum toxin type A (Botox®, Dysport®)*** 7,056,255 6,608,747 94% 4% 854%Cellulite treatment (e.g., Velosmooth®, Endermology) 30,995 26,816 87% 1% 12%Chemical peel 1,360,850 1,256,744 92% 4% 33%Laser hair removal 1,109,385 915,370 83% -1% 52%Laser skin resurfacing 586,662 512,784 87% 3% 243%Laser treatment of leg veins 217,179 188,055 87% 4% -16%Microdermabrasion 775,014 631,223 81% -3% -19%Sclerotherapy 323,009 318,687 99% 0% -62%Soft tissue fillers 2,473,613 2,373,715 96% 2% 294% Calcium hydroxylapatite (e.g., Radiesse®) 242,563 226,791 93% -5% * Collagen 14,126 13,408 95% -2% -98% Fat 79,208 74,355 94% 13% 21% Hyaluronic acid (e.g., Juvederm Ultra®, Juvederm Ultra Plus®, Perlane®, Restylane®, Prevelle Silk®) 2,012,672 1,954,665 97% 3% *
Polylactic acid (Sculptra®) 125,044 104,496 84% -5% *TOTAL COSMETIC MINIMALLY-INVASIVE PROCEDURES 13,932,962 12,832,141 92% 3% 164%
TOTAL COSMETIC PROCEDURES 15,584,872 14,269,280 92% 1% 124%
2016 Cosmetic Surgery Gender DistributionFemale
Top 5 procedures appear in bold
11
Please credit the AMERICAN SOCIETY OF PLASTIC SURGEONS when citing statistical data or using graphics.
12
2016 Plastic Surgery Statistics Report
12
ASPS procedural statistics represent procedures performed by ASPS Member Surgeons certified by The American Board of Plastic Surgery® as well as other physicians certified by American Board of Medical Specialties-recognized boards. ©ASPS, 2017
ASPS Public RelationsPhone: 847-228-9900Fax: 847-981-5482Email: [email protected] Website: www.plasticsurgery.org
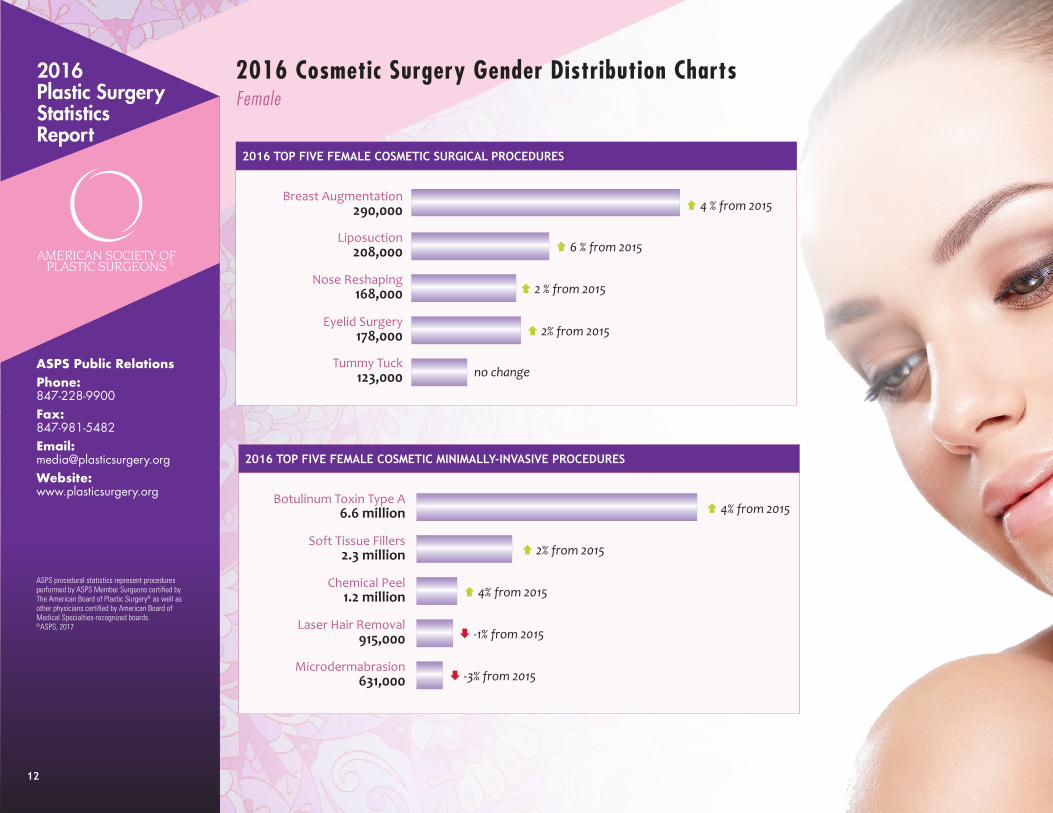
2016 Cosmetic Surgery Gender Distribution ChartsFemale
2016 TOP FIVE FEMALE COSMETIC SURGICAL PROCEDURES
Tummy Tuck123,000
Nose Reshaping168,000
Liposuction208,000
Eyelid Surgery 178,000
Breast Augmentation290,000 4 % from 2015
6 % from 2015
no change
2% from 2015
2 % from 2015
Botulinum Toxin Type A 5.4 million
Soft Tissue Fillers1.8 million
Chemical Peel1.1 million
Laser Hair Removal938,000
Microdermabrasion825,000
2016 TOP FIVE FEMALE COSMETIC MINIMALLY-INVASIVE PROCEDURES
Botulinum Toxin Type A 6.6 million
Soft Tissue Fillers2.3 million
Chemical Peel1.2 million
Laser Hair Removal915,000
Microdermabrasion631,000
4% from 2015
2% from 2015
4% from 2015
-1% from 2015
-3% from 2015
Please credit the AMERICAN SOCIETY OF PLASTIC SURGEONS when citing statistical data or using graphics.
13
2016 Plastic Surgery Statistics Report
13
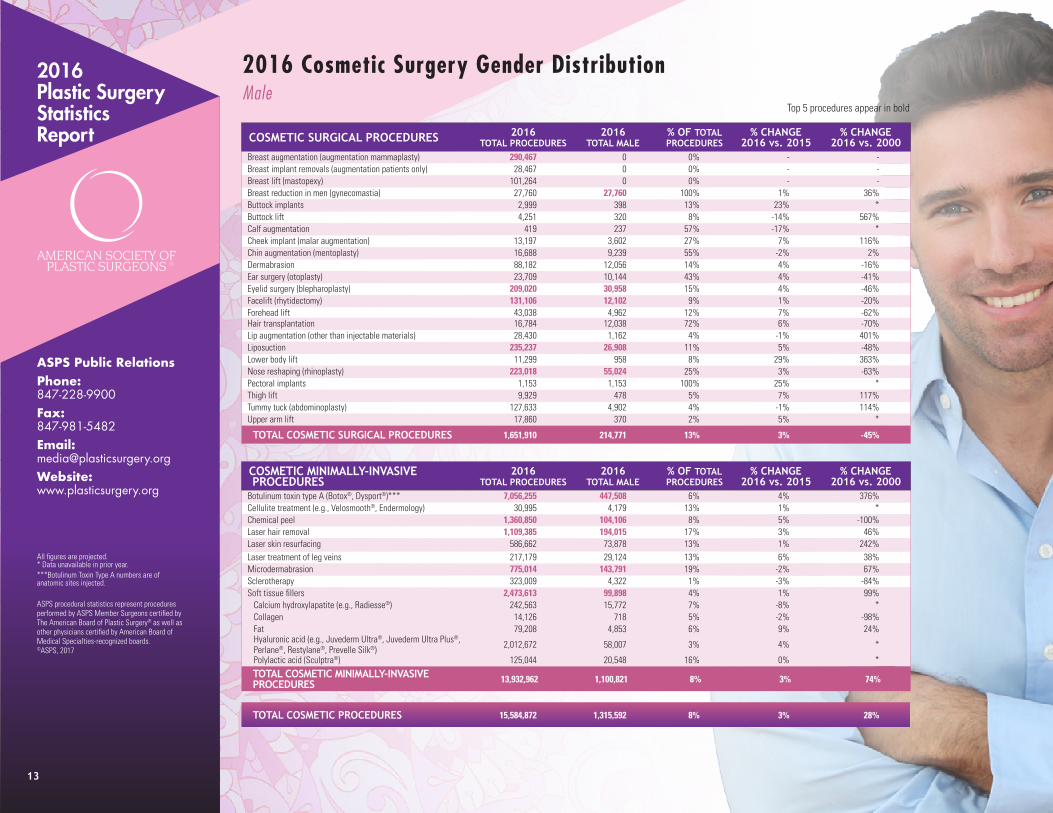
2016 Cosmetic Surgery Gender DistributionMale
Top 5 procedures appear in bold
All figures are projected.* Data unavailable in prior year.***Botulinum Toxin Type A numbers are of anatomic sites injected. ASPS procedural statistics represent procedures performed by ASPS Member Surgeons certified by The American Board of Plastic Surgery® as well as other physicians certified by American Board of Medical Specialties-recognized boards. ©ASPS, 2017
ASPS Public RelationsPhone: 847-228-9900Fax: 847-981-5482Email: [email protected] Website: www.plasticsurgery.org
COSMETIC SURGICAL PROCEDURES 2016TOTAL PROCEDURES
2016TOTAL MALE
% OF TOTAL PROCEDURES
% CHANGE2016 vs. 2015
% CHANGE2016 vs. 2000
Breast augmentation (augmentation mammaplasty) 290,467 0 0% - -Breast implant removals (augmentation patients only) 28,467 0 0% - -Breast lift (mastopexy) 101,264 0 0% - -Breast reduction in men (gynecomastia) 27,760 27,760 100% 1% 36%Buttock implants 2,999 398 13% 23% *Buttock lift 4,251 320 8% -14% 567%Calf augmentation 419 237 57% -17% *Cheek implant (malar augmentation) 13,197 3,602 27% 7% 116%Chin augmentation (mentoplasty) 16,688 9,239 55% -2% 2%Dermabrasion 88,182 12,056 14% 4% -16%Ear surgery (otoplasty) 23,709 10,144 43% 4% -41%Eyelid surgery (blepharoplasty) 209,020 30,958 15% 4% -46%Facelift (rhytidectomy) 131,106 12,102 9% 1% -20%Forehead lift 43,038 4,962 12% 7% -62%Hair transplantation 16,784 12,038 72% 6% -70%Lip augmentation (other than injectable materials) 28,430 1,162 4% -1% 401%Liposuction 235,237 26,908 11% 5% -48%Lower body lift 11,299 958 8% 29% 363%Nose reshaping (rhinoplasty) 223,018 55,024 25% 3% -63%Pectoral implants 1,153 1,153 100% 25% *Thigh lift 9,929 478 5% 7% 117%Tummy tuck (abdominoplasty) 127,633 4,902 4% -1% 114%Upper arm lift 17,860 370 2% 5% *
TOTAL COSMETIC SURGICAL PROCEDURES 1,651,910 214,771 13% 3% -45%
COSMETIC MINIMALLY-INVASIVE PROCEDURES
2016TOTAL PROCEDURES
2016TOTAL MALE
% OF TOTAL PROCEDURES
% CHANGE2016 vs. 2015
% CHANGE2016 vs. 2000
Botulinum toxin type A (Botox®, Dysport®)*** 7,056,255 447,508 6% 4% 376%Cellulite treatment (e.g., Velosmooth®, Endermology) 30,995 4,179 13% 1% *Chemical peel 1,360,850 104,106 8% 5% -100%Laser hair removal 1,109,385 194,015 17% 3% 46%Laser skin resurfacing 586,662 73,878 13% 1% 242%Laser treatment of leg veins 217,179 29,124 13% 6% 38%Microdermabrasion 775,014 143,791 19% -2% 67%Sclerotherapy 323,009 4,322 1% -3% -84%Soft tissue fillers 2,473,613 99,898 4% 1% 99% Calcium hydroxylapatite (e.g., Radiesse®) 242,563 15,772 7% -8% * Collagen 14,126 718 5% -2% -98% Fat 79,208 4,853 6% 9% 24% Hyaluronic acid (e.g., Juvederm Ultra®, Juvederm Ultra Plus®, Perlane®, Restylane®, Prevelle Silk®) 2,012,672 58,007 3% 4% *
Polylactic acid (Sculptra®) 125,044 20,548 16% 0% *
TOTAL COSMETIC MINIMALLY-INVASIVE PROCEDURES 13,932,962 1,100,821 8% 3% 74%
TOTAL COSMETIC PROCEDURES 15,584,872 1,315,592 8% 3% 28%
Please credit the AMERICAN SOCIETY OF PLASTIC SURGEONS when citing statistical data or using graphics.
14
2016 Plastic Surgery Statistics Report
14
ASPS procedural statistics represent procedures performed by ASPS Member Surgeons certified by The American Board of Plastic Surgery® as well as other physicians certified by American Board of Medical Specialties-recognized boards. ©ASPS, 2017
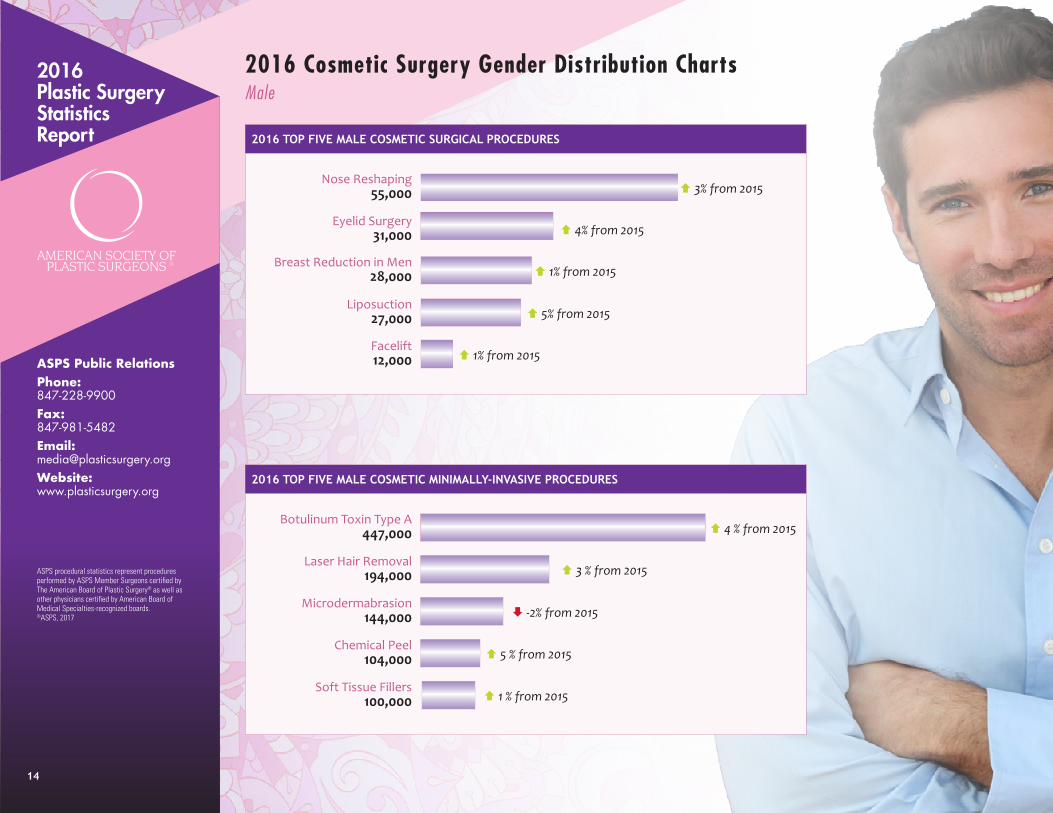
2016 Cosmetic Surgery Gender Distribution ChartsMale
2016 TOP FIVE MALE COSMETIC SURGICAL PROCEDURES
Botulinum Toxin Type A 447,000
Laser Hair Removal194,000
Microdermabrasion144,000
Chemical Peel104,000
Soft Tissue Fillers100,000
2016 TOP FIVE MALE COSMETIC MINIMALLY-INVASIVE PROCEDURES
Facelift12,000
Liposuction27,000
Eyelid Surgery31,000
Nose Reshaping55,000
Breast Reduction in Men28,000
3% from 2015
4% from 2015
5% from 2015
1% from 2015
1% from 2015
4 % from 2015
-2% from 2015
3 % from 2015
5 % from 2015
1 % from 2015
ASPS Public RelationsPhone: 847-228-9900Fax: 847-981-5482Email: [email protected] Website: www.plasticsurgery.org
Please credit the AMERICAN SOCIETY OF PLASTIC SURGEONS when citing statistical data or using graphics.
15
2016 Plastic Surgery Statistics Report
15
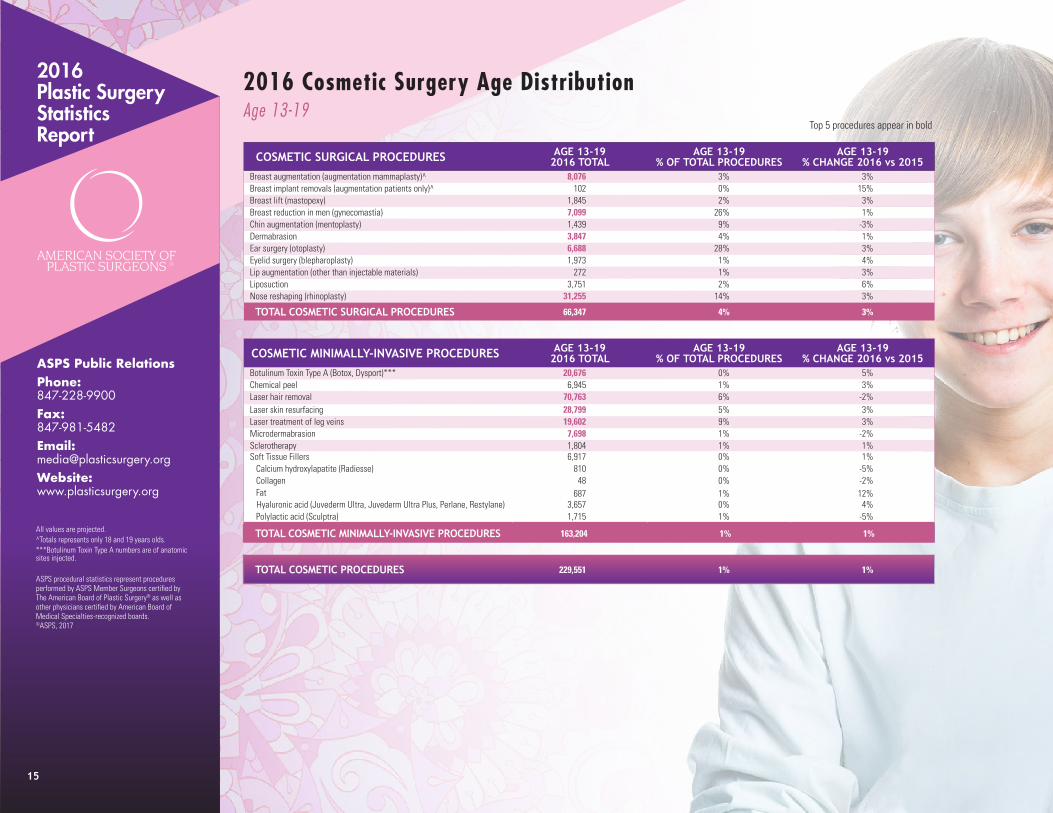
2016 Cosmetic Surgery Age DistributionAge 13-19
Top 5 procedures appear in bold
ASPS Public RelationsPhone: 847-228-9900Fax: 847-981-5482Email: [email protected] Website: www.plasticsurgery.org
COSMETIC SURGICAL PROCEDURES AGE 13-192016 TOTAL
AGE 13-19% OF TOTAL PROCEDURES
AGE 13-19% CHANGE 2016 vs 2015
Breast augmentation (augmentation mammaplasty)^ 8,076 3% 3%Breast implant removals (augmentation patients only)^ 102 0% 15%Breast lift (mastopexy) 1,845 2% 3%Breast reduction in men (gynecomastia) 7,099 26% 1%Chin augmentation (mentoplasty) 1,439 9% -3%Dermabrasion 3,847 4% 1%Ear surgery (otoplasty) 6,688 28% 3%Eyelid surgery (blepharoplasty) 1,973 1% 4%Lip augmentation (other than injectable materials) 272 1% 3%Liposuction 3,751 2% 6%Nose reshaping (rhinoplasty) 31,255 14% 3%
TOTAL COSMETIC SURGICAL PROCEDURES 66,347 4% 3%
COSMETIC MINIMALLY-INVASIVE PROCEDURES AGE 13-192016 TOTAL
AGE 13-19% OF TOTAL PROCEDURES
AGE 13-19% CHANGE 2016 vs 2015
Botulinum Toxin Type A (Botox, Dysport)*** 20,676 0% 5%Chemical peel 6,945 1% 3%Laser hair removal 70,763 6% -2%Laser skin resurfacing 28,799 5% 3%Laser treatment of leg veins 19,602 9% 3%Microdermabrasion 7,698 1% -2%Sclerotherapy 1,804 1% 1%Soft Tissue Fillers 6,917 0% 1% Calcium hydroxylapatite (Radiesse) 810 0% -5% Collagen 48 0% -2% Fat 687 1% 12%
Hyaluronic acid (Juvederm Ultra, Juvederm Ultra Plus, Perlane, Restylane) 3,657 0% 4% Polylactic acid (Sculptra) 1,715 1% -5%
TOTAL COSMETIC MINIMALLY-INVASIVE PROCEDURES 163,204 1% 1%
TOTAL COSMETIC PROCEDURES 229,551 1% 1%
All values are projected.^Totals represents only 18 and 19 years olds.***Botulinum Toxin Type A numbers are of anatomic sites injected. ASPS procedural statistics represent procedures performed by ASPS Member Surgeons certified by The American Board of Plastic Surgery® as well as other physicians certified by American Board of Medical Specialties-recognized boards. ©ASPS, 2017
Please credit the AMERICAN SOCIETY OF PLASTIC SURGEONS when citing statistical data or using graphics.
16
2016 Plastic Surgery Statistics Report
16
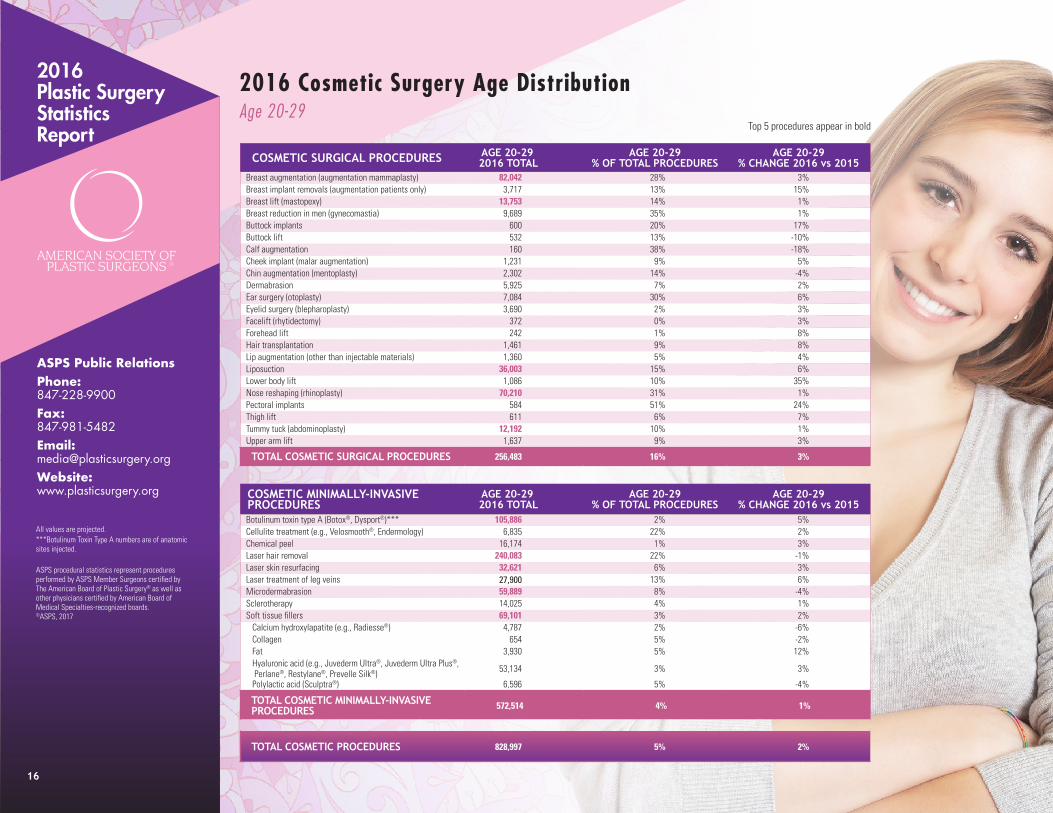
2016 Cosmetic Surgery Age DistributionAge 20-29
Top 5 procedures appear in bold
ASPS Public RelationsPhone: 847-228-9900Fax: 847-981-5482Email: [email protected] Website: www.plasticsurgery.org
All values are projected.***Botulinum Toxin Type A numbers are of anatomic sites injected. ASPS procedural statistics represent procedures performed by ASPS Member Surgeons certified by The American Board of Plastic Surgery® as well as other physicians certified by American Board of Medical Specialties-recognized boards. ©ASPS, 2017
COSMETIC SURGICAL PROCEDURES AGE 20-29 2016 TOTAL
AGE 20-29% OF TOTAL PROCEDURES
AGE 20-29% CHANGE 2016 vs 2015
Breast augmentation (augmentation mammaplasty) 82,042 28% 3%Breast implant removals (augmentation patients only) 3,717 13% 15%Breast lift (mastopexy) 13,753 14% 1%Breast reduction in men (gynecomastia) 9,689 35% 1%Buttock implants 600 20% 17%Buttock lift 532 13% -10%Calf augmentation 160 38% -18%Cheek implant (malar augmentation) 1,231 9% 5%Chin augmentation (mentoplasty) 2,302 14% -4%Dermabrasion 5,925 7% 2%Ear surgery (otoplasty) 7,084 30% 6%Eyelid surgery (blepharoplasty) 3,690 2% 3%Facelift (rhytidectomy) 372 0% 3%Forehead lift 242 1% 8%Hair transplantation 1,461 9% 8%Lip augmentation (other than injectable materials) 1,360 5% 4%Liposuction 36,003 15% 6%Lower body lift 1,086 10% 35%Nose reshaping (rhinoplasty) 70,210 31% 1%Pectoral implants 584 51% 24%Thigh lift 611 6% 7%Tummy tuck (abdominoplasty) 12,192 10% 1%Upper arm lift 1,637 9% 3%
TOTAL COSMETIC SURGICAL PROCEDURES 256,483 16% 3%
COSMETIC MINIMALLY-INVASIVE PROCEDURES
AGE 20-29 2016 TOTAL
AGE 20-29% OF TOTAL PROCEDURES
AGE 20-29% CHANGE 2016 vs 2015
Botulinum toxin type A (Botox®, Dysport®)*** 105,886 2% 5%Cellulite treatment (e.g., Velosmooth®, Endermology) 6,835 22% 2%Chemical peel 16,174 1% 3%Laser hair removal 240,083 22% -1%Laser skin resurfacing 32,621 6% 3%Laser treatment of leg veins 27,900 13% 6%Microdermabrasion 59,889 8% -4%Sclerotherapy 14,025 4% 1%Soft tissue fillers 69,101 3% 2% Calcium hydroxylapatite (e.g., Radiesse®) 4,787 2% -6% Collagen 654 5% -2% Fat 3,930 5% 12% Hyaluronic acid (e.g., Juvederm Ultra®, Juvederm Ultra Plus®, Perlane®, Restylane®, Prevelle Silk®) 53,134 3% 3%
Polylactic acid (Sculptra®) 6,596 5% -4%
TOTAL COSMETIC MINIMALLY-INVASIVE PROCEDURES 572,514 4% 1%
TOTAL COSMETIC PROCEDURES 828,997 5% 2%
17
2016 Plastic Surgery Statistics Report
17
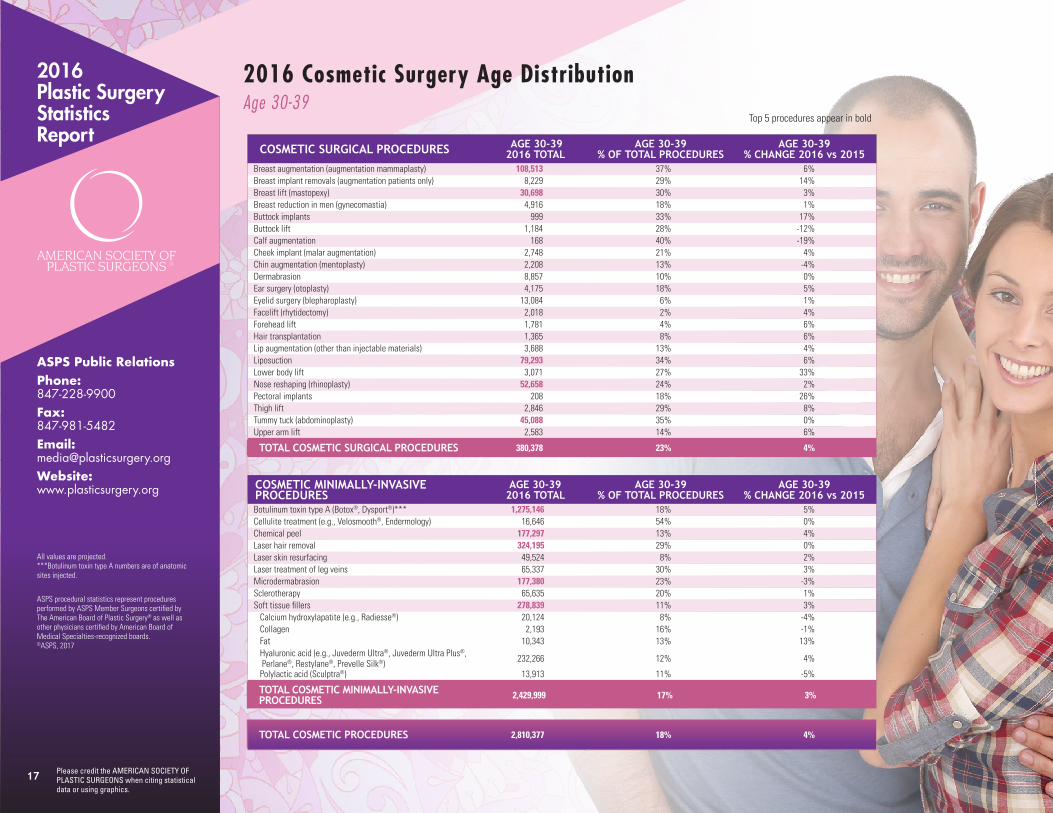
2016 Cosmetic Surgery Age DistributionAge 30-39
Top 5 procedures appear in bold
ASPS Public RelationsPhone: 847-228-9900Fax: 847-981-5482Email: [email protected] Website: www.plasticsurgery.org
All values are projected.***Botulinum toxin type A numbers are of anatomic sites injected.
ASPS procedural statistics represent procedures performed by ASPS Member Surgeons certified by The American Board of Plastic Surgery® as well as other physicians certified by American Board of Medical Specialties-recognized boards. ©ASPS, 2017
COSMETIC SURGICAL PROCEDURES AGE 30-392016 TOTAL
AGE 30-39% OF TOTAL PROCEDURES
AGE 30-39% CHANGE 2016 vs 2015
Breast augmentation (augmentation mammaplasty) 108,513 37% 6%Breast implant removals (augmentation patients only) 8,229 29% 14%Breast lift (mastopexy) 30,698 30% 3%Breast reduction in men (gynecomastia) 4,916 18% 1%Buttock implants 999 33% 17%Buttock lift 1,184 28% -12%Calf augmentation 168 40% -19%Cheek implant (malar augmentation) 2,748 21% 4%Chin augmentation (mentoplasty) 2,208 13% -4%Dermabrasion 8,857 10% 0%Ear surgery (otoplasty) 4,175 18% 5%Eyelid surgery (blepharoplasty) 13,084 6% 1%Facelift (rhytidectomy) 2,018 2% 4%Forehead lift 1,781 4% 6%Hair transplantation 1,365 8% 6%Lip augmentation (other than injectable materials) 3,688 13% 4%Liposuction 79,293 34% 6%Lower body lift 3,071 27% 33%Nose reshaping (rhinoplasty) 52,658 24% 2%Pectoral implants 208 18% 26%Thigh lift 2,846 29% 8%Tummy tuck (abdominoplasty) 45,088 35% 0%Upper arm lift 2,583 14% 6%
TOTAL COSMETIC SURGICAL PROCEDURES 380,378 23% 4%
COSMETIC MINIMALLY-INVASIVE PROCEDURES
AGE 30-392016 TOTAL
AGE 30-39% OF TOTAL PROCEDURES
AGE 30-39% CHANGE 2016 vs 2015
Botulinum toxin type A (Botox®, Dysport®)*** 1,275,146 18% 5%Cellulite treatment (e.g., Velosmooth®, Endermology) 16,646 54% 0%Chemical peel 177,297 13% 4%Laser hair removal 324,195 29% 0%Laser skin resurfacing 49,524 8% 2%Laser treatment of leg veins 65,337 30% 3%Microdermabrasion 177,380 23% -3%Sclerotherapy 65,635 20% 1%Soft tissue fillers 278,839 11% 3% Calcium hydroxylapatite (e.g., Radiesse®) 20,124 8% -4% Collagen 2,193 16% -1% Fat 10,343 13% 13% Hyaluronic acid (e.g., Juvederm Ultra®, Juvederm Ultra Plus®, Perlane®, Restylane®, Prevelle Silk®) 232,266 12% 4%
Polylactic acid (Sculptra®) 13,913 11% -5%
TOTAL COSMETIC MINIMALLY-INVASIVE PROCEDURES 2,429,999 17% 3%
TOTAL COSMETIC PROCEDURES 2,810,377 18% 4%
Please credit the AMERICAN SOCIETY OF PLASTIC SURGEONS when citing statistical data or using graphics.
18
2016 Plastic Surgery Statistics Report
18
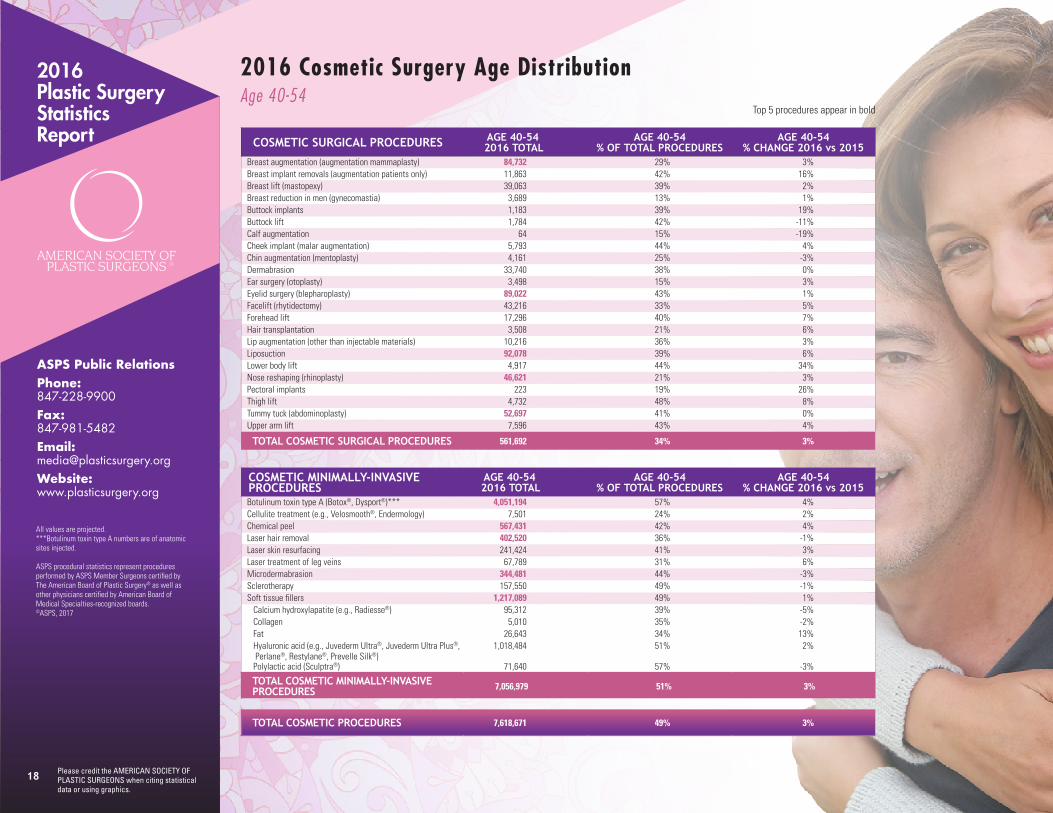
2016 Cosmetic Surgery Age DistributionAge 40-54
Top 5 procedures appear in bold
ASPS Public RelationsPhone: 847-228-9900Fax: 847-981-5482Email: [email protected] Website: www.plasticsurgery.org
All values are projected.***Botulinum toxin type A numbers are of anatomic sites injected.
ASPS procedural statistics represent procedures performed by ASPS Member Surgeons certified by The American Board of Plastic Surgery® as well as other physicians certified by American Board of Medical Specialties-recognized boards. ©ASPS, 2017
COSMETIC SURGICAL PROCEDURES AGE 40-54 2016 TOTAL
AGE 40-54% OF TOTAL PROCEDURES
AGE 40-54% CHANGE 2016 vs 2015
Breast augmentation (augmentation mammaplasty) 84,732 29% 3%Breast implant removals (augmentation patients only) 11,863 42% 16%Breast lift (mastopexy) 39,063 39% 2%Breast reduction in men (gynecomastia) 3,689 13% 1%Buttock implants 1,183 39% 19%Buttock lift 1,784 42% -11%Calf augmentation 64 15% -19%Cheek implant (malar augmentation) 5,793 44% 4%Chin augmentation (mentoplasty) 4,161 25% -3%Dermabrasion 33,740 38% 0%Ear surgery (otoplasty) 3,498 15% 3%Eyelid surgery (blepharoplasty) 89,022 43% 1%Facelift (rhytidectomy) 43,216 33% 5%Forehead lift 17,296 40% 7%Hair transplantation 3,508 21% 6%Lip augmentation (other than injectable materials) 10,216 36% 3%Liposuction 92,078 39% 6%Lower body lift 4,917 44% 34%Nose reshaping (rhinoplasty) 46,621 21% 3%Pectoral implants 223 19% 26%Thigh lift 4,732 48% 8%Tummy tuck (abdominoplasty) 52,697 41% 0%Upper arm lift 7,596 43% 4%
TOTAL COSMETIC SURGICAL PROCEDURES 561,692 34% 3%
COSMETIC MINIMALLY-INVASIVE PROCEDURES
AGE 40-54 2016 TOTAL
AGE 40-54% OF TOTAL PROCEDURES
AGE 40-54% CHANGE 2016 vs 2015
Botulinum toxin type A (Botox®, Dysport®)*** 4,051,194 57% 4%Cellulite treatment (e.g., Velosmooth®, Endermology) 7,501 24% 2%Chemical peel 567,431 42% 4%Laser hair removal 402,520 36% -1%Laser skin resurfacing 241,424 41% 3%Laser treatment of leg veins 67,789 31% 6%Microdermabrasion 344,481 44% -3%Sclerotherapy 157,550 49% -1%Soft tissue fillers 1,217,089 49% 1% Calcium hydroxylapatite (e.g., Radiesse®) 95,312 39% -5% Collagen 5,010 35% -2% Fat 26,643 34% 13% Hyaluronic acid (e.g., Juvederm Ultra®, Juvederm Ultra Plus®, Perlane®, Restylane®, Prevelle Silk®)
1,018,484 51% 2%
Polylactic acid (Sculptra®) 71,640 57% -3%
TOTAL COSMETIC MINIMALLY-INVASIVE PROCEDURES 7,056,979 51% 3%
TOTAL COSMETIC PROCEDURES 7,618,671 49% 3%
Please credit the AMERICAN SOCIETY OF PLASTIC SURGEONS when citing statistical data or using graphics.
Please credit the AMERICAN SOCIETY OF PLASTIC SURGEONS when citing statistical data or using graphics.
19
2016 Plastic Surgery Statistics Report
19
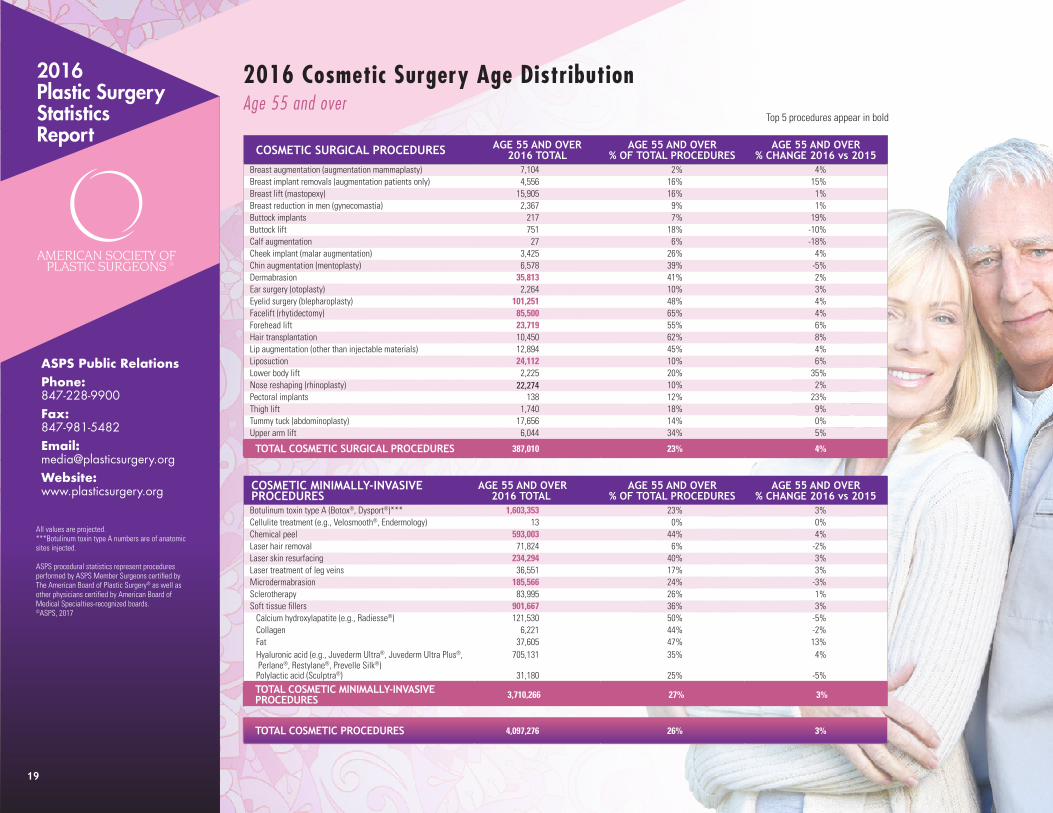
2016 Cosmetic Surgery Age DistributionAge 55 and over
Top 5 procedures appear in bold
ASPS Public RelationsPhone: 847-228-9900Fax: 847-981-5482Email: [email protected] Website: www.plasticsurgery.org
All values are projected.***Botulinum toxin type A numbers are of anatomic sites injected.
ASPS procedural statistics represent procedures performed by ASPS Member Surgeons certified by The American Board of Plastic Surgery® as well as other physicians certified by American Board of Medical Specialties-recognized boards. ©ASPS, 2017
COSMETIC SURGICAL PROCEDURES AGE 55 AND OVER2016 TOTAL
AGE 55 AND OVER% OF TOTAL PROCEDURES
AGE 55 AND OVER% CHANGE 2016 vs 2015
Breast augmentation (augmentation mammaplasty) 7,104 2% 4%Breast implant removals (augmentation patients only) 4,556 16% 15%Breast lift (mastopexy) 15,905 16% 1%Breast reduction in men (gynecomastia) 2,367 9% 1%Buttock implants 217 7% 19%Buttock lift 751 18% -10%Calf augmentation 27 6% -18%Cheek implant (malar augmentation) 3,425 26% 4%Chin augmentation (mentoplasty) 6,578 39% -5%Dermabrasion 35,813 41% 2%Ear surgery (otoplasty) 2,264 10% 3%Eyelid surgery (blepharoplasty) 101,251 48% 4%Facelift (rhytidectomy) 85,500 65% 4%Forehead lift 23,719 55% 6%Hair transplantation 10,450 62% 8%Lip augmentation (other than injectable materials) 12,894 45% 4%Liposuction 24,112 10% 6%Lower body lift 2,225 20% 35%Nose reshaping (rhinoplasty) 22,274 10% 2%Pectoral implants 138 12% 23%Thigh lift 1,740 18% 9%Tummy tuck (abdominoplasty) 17,656 14% 0%Upper arm lift 6,044 34% 5%
TOTAL COSMETIC SURGICAL PROCEDURES 387,010 23% 4%
COSMETIC MINIMALLY-INVASIVE PROCEDURES
AGE 55 AND OVER 2016 TOTAL
AGE 55 AND OVER% OF TOTAL PROCEDURES
AGE 55 AND OVER% CHANGE 2016 vs 2015
Botulinum toxin type A (Botox®, Dysport®)*** 1,603,353 23% 3%Cellulite treatment (e.g., Velosmooth®, Endermology) 13 0% 0%Chemical peel 593,003 44% 4%Laser hair removal 71,824 6% -2%Laser skin resurfacing 234,294 40% 3%Laser treatment of leg veins 36,551 17% 3%Microdermabrasion 185,566 24% -3%Sclerotherapy 83,995 26% 1%Soft tissue fillers 901,667 36% 3% Calcium hydroxylapatite (e.g., Radiesse®) 121,530 50% -5% Collagen 6,221 44% -2% Fat 37,605 47% 13% Hyaluronic acid (e.g., Juvederm Ultra®, Juvederm Ultra Plus®, Perlane®, Restylane®, Prevelle Silk®)
705,131 35% 4%
Polylactic acid (Sculptra®) 31,180 25% -5%
TOTAL COSMETIC MINIMALLY-INVASIVE PROCEDURES 3,710,266 27% 3%
TOTAL COSMETIC PROCEDURES 4,097,276 26% 3%
2016 Plastic Surgery Statistics Report
ASPS Public Relations Phone: 847-228-9900 | Fax: 847-981-5482 | Email: [email protected] | Website: www.plasticsurgery.org
All values are projected.↑†First year procedure is being reported
ASPS procedural statistics represent procedures performed by ASPS Member Surgeons certified by The American Board of Plastic Surgery® as well as other physicians certified by American Board of Medical Specialties-recognized boards. ©ASPS, 2017
% OF TOTAL PROCEDURES
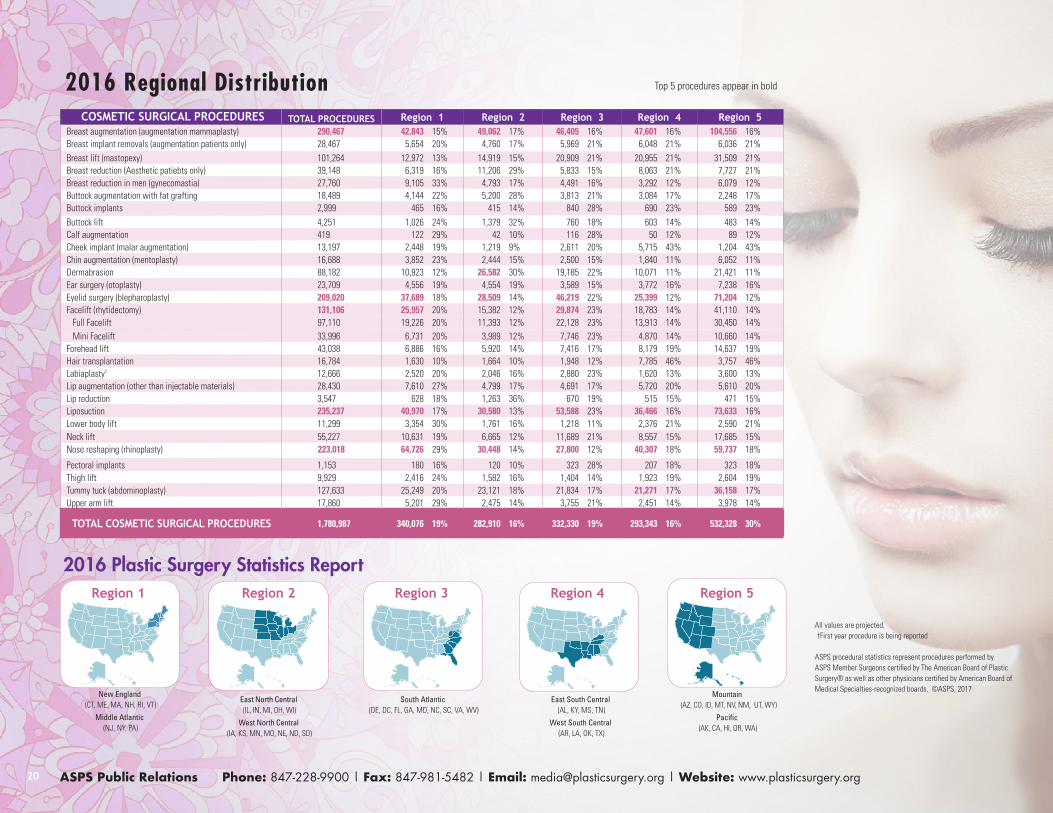
Top 5 procedures appear in bold
New England (CT, ME, MA, NH, RI, VT)
Middle Atlantic (NJ, NY, PA)
East North Central (IL, IN, MI, OH, WI)
West North Central (IA, KS, MN, MO, NE, ND, SD)
Mountain (AZ, CO, ID, MT, NV, NM, UT, WY)
Pacific (AK, CA, HI, OR, WA)
Region 3 Region 4 Region 5Region 2Region 1
South Atlantic (DE, DC, FL, GA, MD, NC, SC, VA, WV)
East South Central (AL, KY, MS, TN)
West South Central (AR, LA, OK, TX)
COSMETIC SURGICAL PROCEDURES TOTAL PROCEDURES Region 1 Region 2 Region 3 Region 4 Region 5Breast augmentation (augmentation mammaplasty) 290,467 42,843 15% 49,062 17% 46,405 16% 47,601 16% 104,556 16%Breast implant removals (augmentation patients only) 28,467 5,654 20% 4,760 17% 5,969 21% 6,048 21% 6,036 21%Breast lift (mastopexy) 101,264 12,972 13% 14,919 15% 20,909 21% 20,955 21% 31,509 21%Breast reduction (Aesthetic patiebts only) 39,148 6,319 16% 11,206 29% 5,833 15% 8,063 21% 7,727 21%Breast reduction in men (gynecomastia) 27,760 9,105 33% 4,793 17% 4,491 16% 3,292 12% 6,079 12%Buttock augmentation with fat grafting 18,489 4,144 22% 5,200 28% 3,813 21% 3,084 17% 2,248 17%Buttock implants 2,999 465 16% 415 14% 840 28% 690 23% 589 23%
Buttock lift 4,251 1,026 24% 1,379 32% 760 18% 603 14% 483 14%Calf augmentation 419 122 29% 42 10% 116 28% 50 12% 89 12%Cheek implant (malar augmentation) 13,197 2,448 19% 1,219 9% 2,611 20% 5,715 43% 1,204 43%Chin augmentation (mentoplasty) 16,688 3,852 23% 2,444 15% 2,500 15% 1,840 11% 6,052 11%Dermabrasion 88,182 10,923 12% 26,582 30% 19,185 22% 10,071 11% 21,421 11%Ear surgery (otoplasty) 23,709 4,556 19% 4,554 19% 3,589 15% 3,772 16% 7,238 16%Eyelid surgery (blepharoplasty) 209,020 37,689 18% 28,509 14% 46,219 22% 25,399 12% 71,204 12%Facelift (rhytidectomy) 131,106 25,957 20% 15,382 12% 29,874 23% 18,783 14% 41,110 14% Full Facelift 97,110 19,226 20% 11,393 12% 22,128 23% 13,913 14% 30,450 14% Mini Facelift 33,996 6,731 20% 3,989 12% 7,746 23% 4,870 14% 10,660 14%Forehead lift 43,038 6,886 16% 5,920 14% 7,416 17% 8,179 19% 14,637 19%Hair transplantation 16,784 1,630 10% 1,664 10% 1,948 12% 7,785 46% 3,757 46%Labiaplasty† ↑ 12,666 2,520 20% 2,046 16% 2,880 23% 1,620 13% 3,600 13%Lip augmentation (other than injectable materials) 28,430 7,610 27% 4,799 17% 4,691 17% 5,720 20% 5,610 20%Lip reduction 3,547 628 18% 1,263 36% 670 19% 515 15% 471 15%Liposuction 235,237 40,970 17% 30,580 13% 53,588 23% 36,466 16% 73,633 16%Lower body lift 11,299 3,354 30% 1,761 16% 1,218 11% 2,376 21% 2,590 21%Neck lift 55,227 10,631 19% 6,665 12% 11,689 21% 8,557 15% 17,685 15%Nose reshaping (rhinoplasty) 223,018 64,726 29% 30,448 14% 27,800 12% 40,307 18% 59,737 18%
Pectoral implants 1,153 180 16% 120 10% 323 28% 207 18% 323 18%Thigh lift 9,929 2,416 24% 1,582 16% 1,404 14% 1,923 19% 2,604 19%Tummy tuck (abdominoplasty) 127,633 25,249 20% 23,121 18% 21,834 17% 21,271 17% 36,158 17%Upper arm lift 17,860 5,201 29% 2,475 14% 3,755 21% 2,451 14% 3,978 14%
TOTAL COSMETIC SURGICAL PROCEDURES 1,780,987 340,076 19% 282,910 16% 332,330 19% 293,343 16% 532,328 30%
20
2016 Regional Distribution
ASPS Public Relations Phone: 847-228-9900 | Fax: 847-981-5482 | Email: [email protected] | Website: www.plasticsurgery.org
All values are projected.***Botulinum toxin type A numbers are of anatomic sites injected.↑†First year procedure is being reported
ASPS procedural statistics represent procedures performed by ASPS Member Surgeons certified by The American Board of Plastic Surgery® as well as other physicians certified by American Board of Medical Specialties-recognized boards. ©ASPS, 2017
% OF TOTAL PROCEDURES
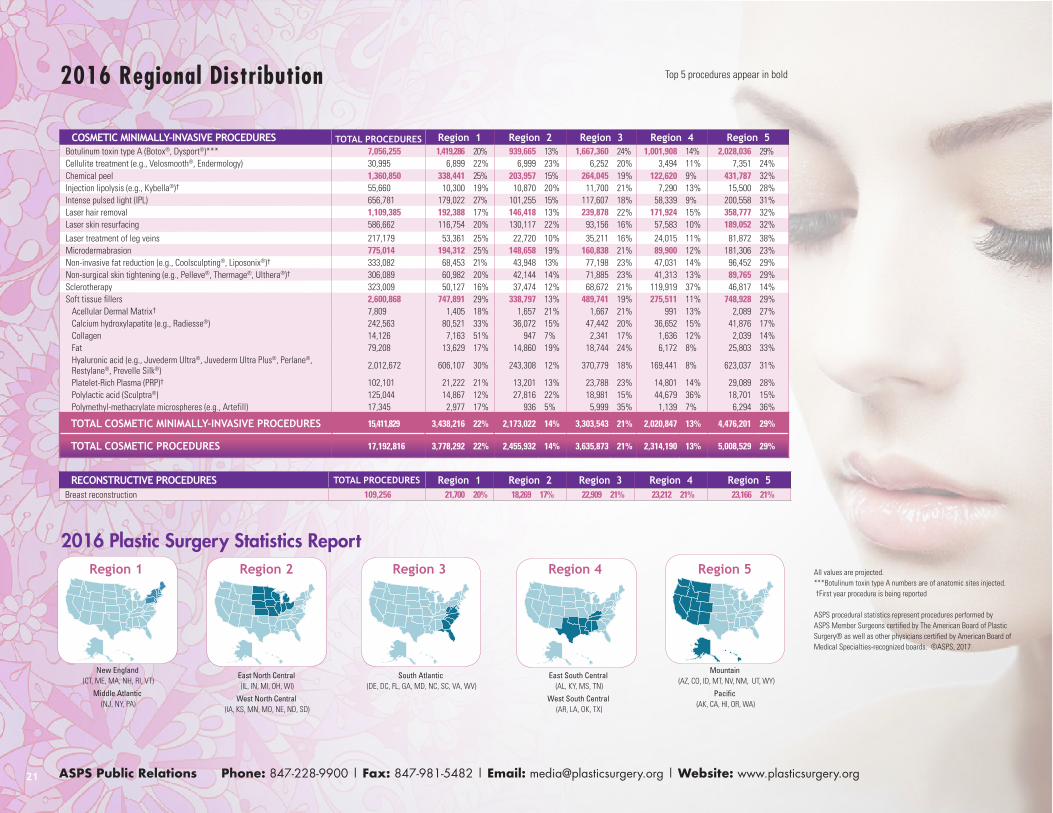
Top 5 procedures appear in bold
COSMETIC MINIMALLY-INVASIVE PROCEDURES TOTAL PROCEDURES Region 1 Region 2 Region 3 Region 4 Region 5Botulinum toxin type A (Botox®, Dysport®)*** 7,056,255 1,419,286 20% 939,665 13% 1,667,360 24% 1,001,908 14% 2,028,036 29%Cellulite treatment (e.g., Velosmooth®, Endermology) 30,995 6,899 22% 6,999 23% 6,252 20% 3,494 11% 7,351 24%Chemical peel 1,360,850 338,441 25% 203,957 15% 264,045 19% 122,620 9% 431,787 32%Injection lipolysis (e.g., Kybella®)† 55,660 10,300 19% 10,870 20% 11,700 21% 7,290 13% 15,500 28%Intense pulsed light (IPL) 656,781 179,022 27% 101,255 15% 117,607 18% 58,339 9% 200,558 31%Laser hair removal 1,109,385 192,388 17% 146,418 13% 239,878 22% 171,924 15% 358,777 32%Laser skin resurfacing 586,662 116,754 20% 130,117 22% 93,156 16% 57,583 10% 189,052 32%
Laser treatment of leg veins 217,179 53,361 25% 22,720 10% 35,211 16% 24,015 11% 81,872 38%Microdermabrasion 775,014 194,312 25% 148,658 19% 160,838 21% 89,900 12% 181,306 23%Non-invasive fat reduction (e.g., Coolsculpting®, Liposonix®)† 333,082 68,453 21% 43,948 13% 77,198 23% 47,031 14% 96,452 29%Non-surgical skin tightening (e.g., Pelleve®, Thermage®, Ulthera®)† 306,089 60,982 20% 42,144 14% 71,885 23% 41,313 13% 89,765 29%Sclerotherapy 323,009 50,127 16% 37,474 12% 68,672 21% 119,919 37% 46,817 14%Soft tissue fillers 2,600,868 747,891 29% 338,797 13% 489,741 19% 275,511 11% 748,928 29% Acellular Dermal Matrix† ↑ 7,809 1,405 18% 1,657 21% 1,667 21% 991 13% 2,089 27% Calcium hydroxylapatite (e.g., Radiesse®) 242,563 80,521 33% 36,072 15% 47,442 20% 36,652 15% 41,876 17% Collagen 14,126 7,163 51% 947 7% 2,341 17% 1,636 12% 2,039 14% Fat 79,208 13,629 17% 14,860 19% 18,744 24% 6,172 8% 25,803 33% Hyaluronic acid (e.g., Juvederm Ultra®, Juvederm Ultra Plus®, Perlane®, Restylane®, Prevelle Silk®) 2,012,672 606,107 30% 243,308 12% 370,779 18% 169,441 8% 623,037 31%
Platelet-Rich Plasma (PRP)† 102,101 21,222 21% 13,201 13% 23,788 23% 14,801 14% 29,089 28% Polylactic acid (Sculptra®) 125,044 14,867 12% 27,816 22% 18,981 15% 44,679 36% 18,701 15% Polymethyl-methacrylate microspheres (e.g., Artefill) 17,345 2,977 17% 936 5% 5,999 35% 1,139 7% 6,294 36%
TOTAL COSMETIC MINIMALLY-INVASIVE PROCEDURES 15,411,829 3,438,216 22% 2,173,022 14% 3,303,543 21% 2,020,847 13% 4,476,201 29%
TOTAL COSMETIC PROCEDURES 17,192,816 3,778,292 22% 2,455,932 14% 3,635,873 21% 2,314,190 13% 5,008,529 29%
RECONSTRUCTIVE PROCEDURES TOTAL PROCEDURES Region 1 Region 2 Region 3 Region 4 Region 5Breast reconstruction 109,256 21,700 20% 18,269 17% 22,909 21% 23,212 21% 23,166 21%
21
2016 Regional Distribution
2016 Plastic Surgery Statistics Report
New England (CT, ME, MA, NH, RI, VT)
Middle Atlantic (NJ, NY, PA)
East North Central (IL, IN, MI, OH, WI)
West North Central (IA, KS, MN, MO, NE, ND, SD)
Mountain (AZ, CO, ID, MT, NV, NM, UT, WY)
Pacific (AK, CA, HI, OR, WA)
Region 3 Region 4 Region 5Region 2Region 1
South Atlantic (DE, DC, FL, GA, MD, NC, SC, VA, WV)
East South Central (AL, KY, MS, TN)
West South Central (AR, LA, OK, TX)
Please credit the AMERICAN SOCIETY OF PLASTIC SURGEONS when citing statistical data or using graphics.
22
2016 Plastic Surgery Statistics Report
22
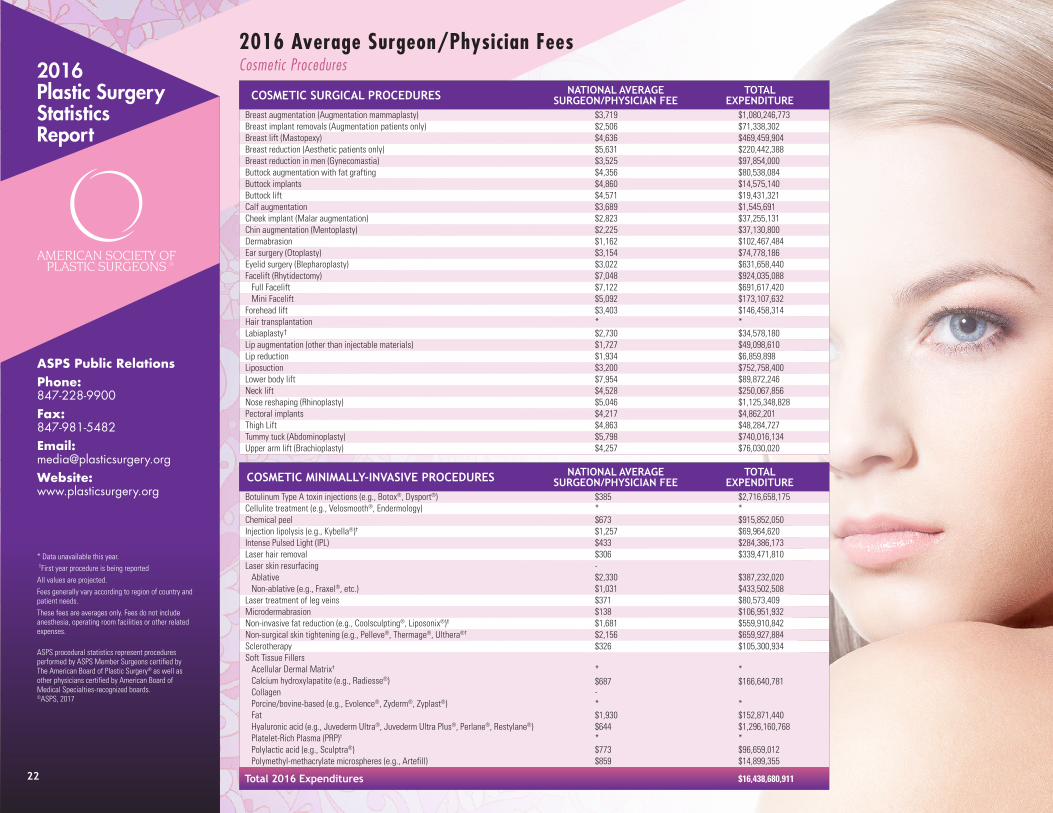
2016 Average Surgeon/Physician FeesCosmetic Procedures
ASPS Public RelationsPhone: 847-228-9900Fax: 847-981-5482Email: [email protected] Website: www.plasticsurgery.org
* Data unavailable this year.↑†First year procedure is being reportedAll values are projected.Fees generally vary according to region of country and patient needs.These fees are averages only. Fees do not include anesthesia, operating room facilities or other related expenses.
ASPS procedural statistics represent procedures performed by ASPS Member Surgeons certified by The American Board of Plastic Surgery® as well as other physicians certified by American Board of Medical Specialties-recognized boards. ©ASPS, 2017
COSMETIC SURGICAL PROCEDURES NATIONAL AVERAGESURGEON/PHYSICIAN FEE
TOTALEXPENDITURE
Breast augmentation (Augmentation mammaplasty) $3,719 $1,080,246,773Breast implant removals (Augmentation patients only) $2,506 $71,338,302Breast lift (Mastopexy) $4,636 $469,459,904Breast reduction (Aesthetic patients only) $5,631 $220,442,388Breast reduction in men (Gynecomastia) $3,525 $97,854,000Buttock augmentation with fat grafting $4,356 $80,538,084Buttock implants $4,860 $14,575,140Buttock lift $4,571 $19,431,321Calf augmentation $3,689 $1,545,691Cheek implant (Malar augmentation) $2,823 $37,255,131Chin augmentation (Mentoplasty) $2,225 $37,130,800Dermabrasion $1,162 $102,467,484Ear surgery (Otoplasty) $3,154 $74,778,186Eyelid surgery (Blepharoplasty) $3,022 $631,658,440Facelift (Rhytidectomy) $7,048 $924,035,088 Full Facelift $7,122 $691,617,420 Mini Facelift $5,092 $173,107,632Forehead lift $3,403 $146,458,314Hair transplantation * *Labiaplasty†↑ $2,730 $34,578,180Lip augmentation (other than injectable materials) $1,727 $49,098,610Lip reduction $1,934 $6,859,898Liposuction $3,200 $752,758,400Lower body lift $7,954 $89,872,246Neck lift $4,528 $250,067,856Nose reshaping (Rhinoplasty) $5,046 $1,125,348,828Pectoral implants $4,217 $4,862,201Thigh Lift $4,863 $48,284,727Tummy tuck (Abdominoplasty) $5,798 $740,016,134Upper arm lift (Brachioplasty) $4,257 $76,030,020
COSMETIC MINIMALLY-INVASIVE PROCEDURES NATIONAL AVERAGESURGEON/PHYSICIAN FEE
TOTALEXPENDITURE
Botulinum Type A toxin injections (e.g., Botox®, Dysport®) $385 $2,716,658,175Cellulite treatment (e.g., Velosmooth®, Endermology) * *Chemical peel $673 $915,852,050Injection lipolysis (e.g., Kybella®)† ↑ $1,257 $69,964,620Intense Pulsed Light (IPL) $433 $284,386,173Laser hair removal $306 $339,471,810Laser skin resurfacing - Ablative $2,330 $387,232,020 Non-ablative (e.g., Fraxel®, etc.) $1,031 $433,502,508Laser treatment of leg veins $371 $80,573,409Microdermabrasion $138 $106,951,932Non-invasive fat reduction (e.g., Coolsculpting®, Liposonix®)† ↑ $1,681 $559,910,842Non-surgical skin tightening (e.g., Pelleve®, Thermage®, Ulthera®† ↑ $2,156 $659,927,884Sclerotherapy $326 $105,300,934Soft Tissue Fillers Acellular Dermal Matrix† ↑ * * Calcium hydroxylapatite (e.g., Radiesse®) $687 $166,640,781 Collagen - Porcine/bovine-based (e.g., Evolence®, Zyderm®, Zyplast®) * * Fat $1,930 $152,871,440 Hyaluronic acid (e.g., Juvederm Ultra®, Juvederm Ultra Plus®, Perlane®, Restylane®) $644 $1,296,160,768 Platelet-Rich Plasma (PRP)† * * Polylactic acid (e.g., Sculptra®) $773 $96,659,012 Polymethyl-methacrylate microspheres (e.g., Artefill) $859 $14,899,355
Total 2016 Expenditures $16,438,680,911
2016 Plastic Surgery Statistics Report
ASPS Public RelationsPhone: 847-228-9900Fax: 847-981-5482Email: [email protected] Website: www.plasticsurgery.org
Please credit the AMERICAN SOCIETY OF PLASTIC SURGEONS when citing statistical data or using graphics.
23
All values are projected.
ASPS procedural statistics represent procedures performed by ASPS Member Surgeons certified by The American Board of Plastic Surgery® as well as other physicians certified by American Board of Medical Specialties-recognized boards. ©ASPS, 2017
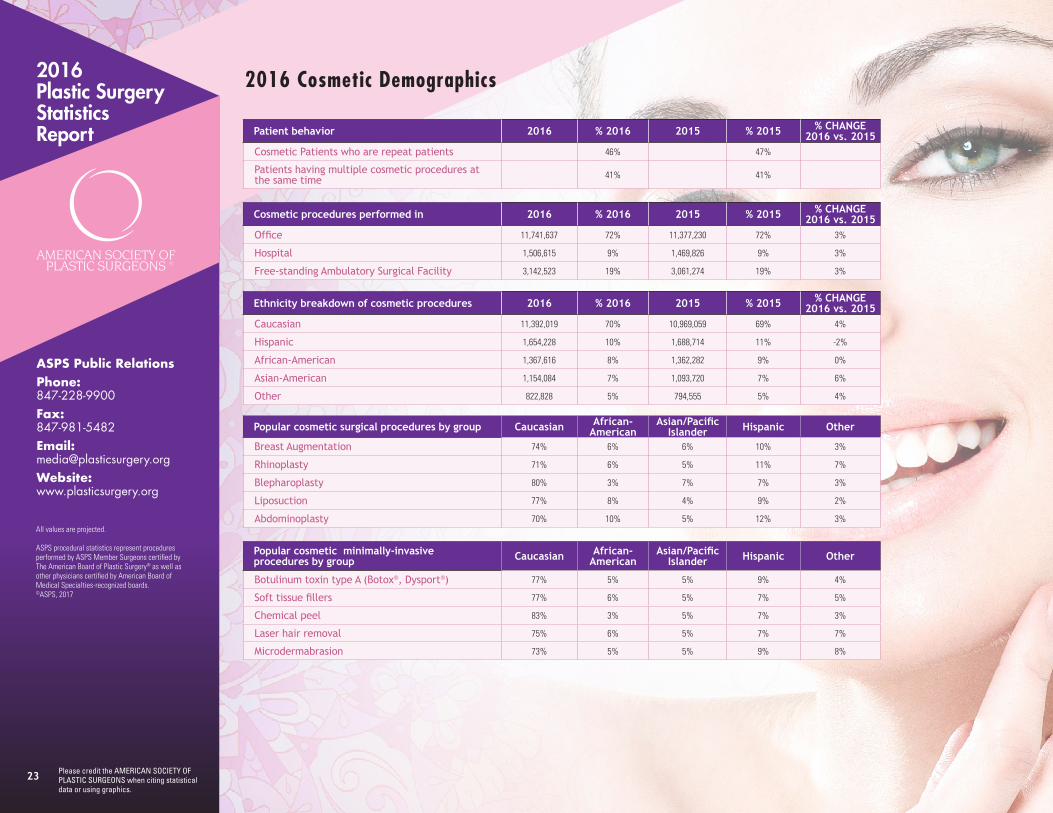
2016 Cosmetic Demographics
Popular cosmetic minimally-invasive procedures by group Caucasian African-
AmericanAsian/Pacific
Islander Hispanic Other
Botulinum toxin type A (Botox®, Dysport®) 77% 5% 5% 9% 4%
Soft tissue fillers 77% 6% 5% 7% 5%
Chemical peel 83% 3% 5% 7% 3%
Laser hair removal 75% 6% 5% 7% 7%
Microdermabrasion 73% 5% 5% 9% 8%
Popular cosmetic surgical procedures by group Caucasian African- American
Asian/Pacific Islander Hispanic Other
Breast Augmentation 74% 6% 6% 10% 3%
Rhinoplasty 71% 6% 5% 11% 7%
Blepharoplasty 80% 3% 7% 7% 3%
Liposuction 77% 8% 4% 9% 2%
Abdominoplasty 70% 10% 5% 12% 3%
Ethnicity breakdown of cosmetic procedures 2016 % 2016 2015 % 2015 % CHANGE2016 vs. 2015
Caucasian 11,392,019 70% 10,969,059 69% 4%
Hispanic 1,654,228 10% 1,688,714 11% -2%
African-American 1,367,616 8% 1,362,282 9% 0%
Asian-American 1,154,084 7% 1,093,720 7% 6%
Other 822,828 5% 794,555 5% 4%
Cosmetic procedures performed in 2016 % 2016 2015 % 2015 % CHANGE2016 vs. 2015
Office 11,741,637 72% 11,377,230 72% 3%
Hospital 1,506,615 9% 1,469,826 9% 3%
Free-standing Ambulatory Surgical Facility 3,142,523 19% 3,061,274 19% 3%
Patient behavior 2016 % 2016 2015 % 2015 % CHANGE2016 vs. 2015
Cosmetic Patients who are repeat patients 46% 47%
Patients having multiple cosmetic procedures at the same time 41% 41%
Please credit the AMERICAN SOCIETY OF PLASTIC SURGEONS when citing statistical data or using graphics.
24
2016 Plastic Surgery Statistics Report
24
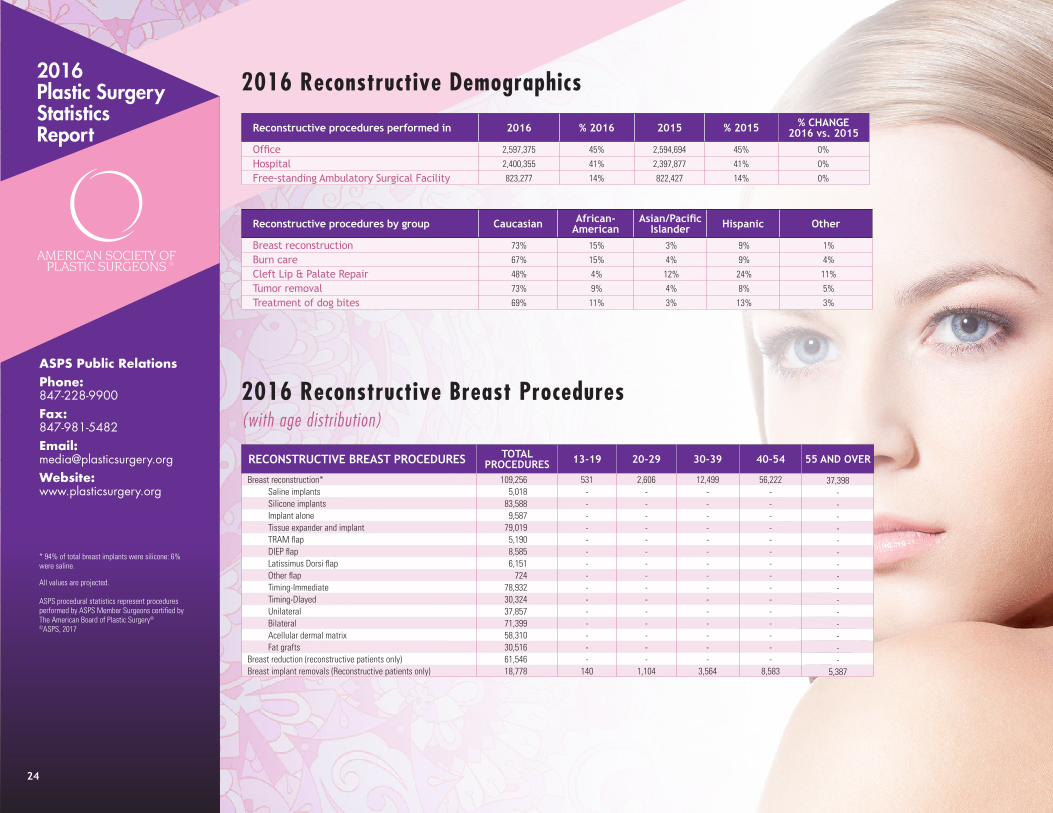
2016 Reconstructive Demographics
Reconstructive procedures performed in 2016 % 2016 2015 % 2015 % CHANGE2016 vs. 2015
Office 2,597,375 45% 2,594,694 45% 0%
Hospital 2,400,355 41% 2,397,877 41% 0%
Free-standing Ambulatory Surgical Facility 823,277 14% 822,427 14% 0%
ASPS Public RelationsPhone: 847-228-9900Fax: 847-981-5482Email: [email protected] Website: www.plasticsurgery.org
Reconstructive procedures by group Caucasian African- American
Asian/Pacific Islander Hispanic Other
Breast reconstruction 73% 15% 3% 9% 1%
Burn care 67% 15% 4% 9% 4%
Cleft Lip & Palate Repair 48% 4% 12% 24% 11%
Tumor removal 73% 9% 4% 8% 5%
Treatment of dog bites 69% 11% 3% 13% 3%
RECONSTRUCTIVE BREAST PROCEDURES TOTAL PROCEDURES 13-19 20-29 30-39 40-54 55 AND OVER
Breast reconstruction* 109,256 531 2,606 12,499 56,222 37,398 Saline implants 5,018 - - - - - Silicone implants 83,588 - - - - - Implant alone 9,587 - - - - - Tissue expander and implant 79,019 - - - - - TRAM flap 5,190 - - - - - DIEP flap 8,585 - - - - - Latissimus Dorsi flap 6,151 - - - - - Other flap 724 - - - - - Timing-Immediate 78,932 - - - - - Timing-Dlayed 30,324 - - - - - Unilateral 37,857 - - - - - Bilateral 71,399 - - - - - Acellular dermal matrix 58,310 - - - - - Fat grafts 30,516 - - - - -Breast reduction (reconstructive patients only) 61,546 - - - - -Breast implant removals (Reconstructive patients only) 18,778 140 1,104 3,564 8,583 5,387
2016 Reconstructive Breast Procedures (with age distribution)
* 94% of total breast implants were silicone: 6% were saline.
All values are projected.
ASPS procedural statistics represent procedures performed by ASPS Member Surgeons certified by The American Board of Plastic Surgery® ©ASPS, 2017
2016 Plastic Surgery Statistics Report
ASPS Public RelationsPhone: 847-228-9900Fax: 847-981-5482Email: [email protected] Website: www.plasticsurgery.org
Please credit the AMERICAN SOCIETY OF PLASTIC SURGEONS when citing statistical data or using graphics.
25
All values are projected.
†↑First year procedure is being reported
****Counts of procedures performed by ASPS member surgeons only
ASPS procedural statistics represent procedures performed by ASPS Member Surgeons certified by The American Board of Plastic Surgery® as well as other physicians certified by American Board of Medical Specialties-recognized boards. ©ASPS, 2017
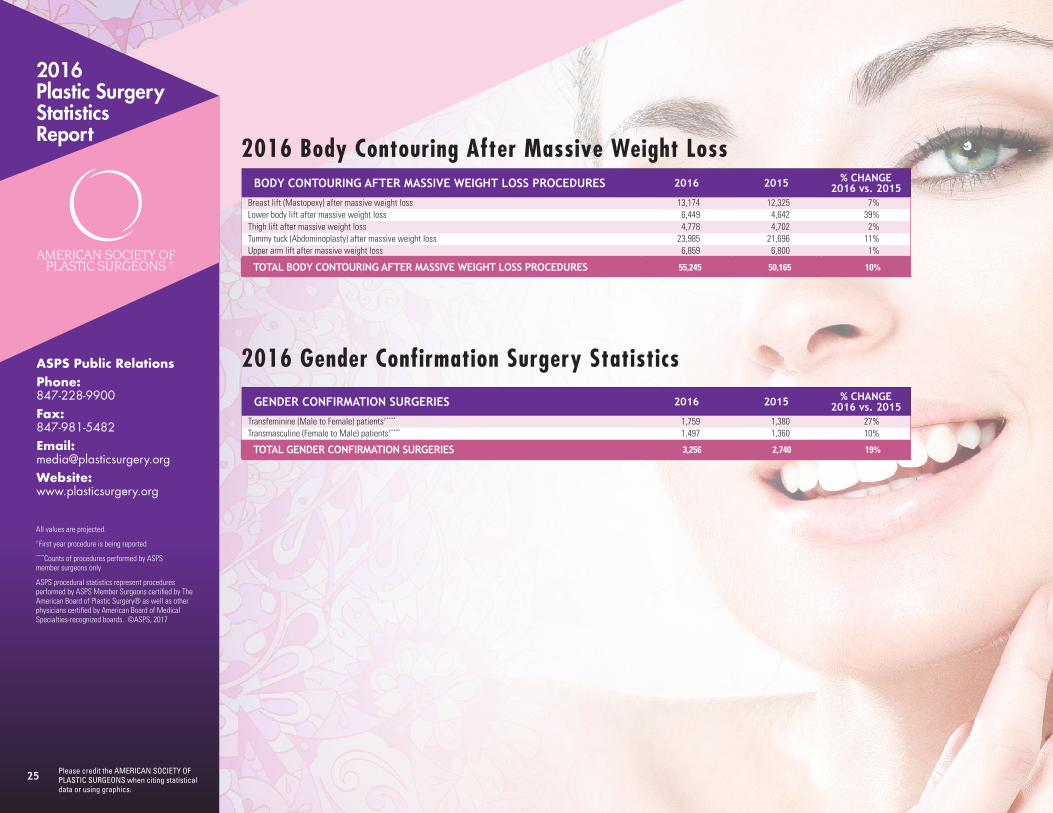
BODY CONTOURING AFTER MASSIVE WEIGHT LOSS PROCEDURES 2016 2015 % CHANGE2016 vs. 2015
Breast lift (Mastopexy) after massive weight loss 13,174 12,325 7%Lower body lift after massive weight loss 6,449 4,642 39%Thigh lift after massive weight loss 4,778 4,702 2%Tummy tuck (Abdominoplasty) after massive weight loss 23,985 21,696 11%Upper arm lift after massive weight loss 6,859 6,800 1%
TOTAL BODY CONTOURING AFTER MASSIVE WEIGHT LOSS PROCEDURES 55,245 50,165 10%
GENDER CONFIRMATION SURGERIES 2016 2015 % CHANGE2016 vs. 2015
Transfeminine (Male to Female) patients†**** 1,759 1,380 27%Transmasculine (Female to Male) patients†****↑ 1,497 1,360 10%
TOTAL GENDER CONFIRMATION SURGERIES 3,256 2,740 19%
2016 Body Contouring After Massive Weight Loss
2016 Gender Confirmation Surgery Statistics