
Plastic Manufacturing Company - Business Plan
61
Arpana Pradhan Ayush Man Tamrakar Jashmina Pradhananaga Kathmandu College of Management
-
Upload
ayush-tamrakar -
Category
Education
-
view
275 -
download
4
Transcript of Plastic Manufacturing Company - Business Plan
Arpana PradhanAyush Man Tamrakar
Jashmina Pradhananaga
Kathmandu College of Management
Acknowledgement
We would like to express our sincere gratitude towards Kathmandu College of Management, for providing us with the opportunity to prepare this business plan and also for guiding us throughout the project. We are also thankful to Mr. Shree Ranjan Wasti, Lecturer of Entrepreneurship and New Business Foundation for helping us conduct the research. We would like to acknowledge his valuable guidance and support that motivated us to contribute tremendously to this report. The success of this report also depends on the encouragement and guidelines of many others. So, we would like to take this opportunity to thank all of them who have helped us through this report.
We conducted a research on the bottle manufacturing process and via this research we have been able to envision ourselves with ideas regarding the scope and challenges of business opportunities in Nepal. We believe that it will really help us get our dreams come true in the near future.
Through this project we have gained a lot of experience in finding out more about the subject matter and the entrepreneurship concepts as well as the financial and business concepts. Moreover we have gained the knowledge of the process and how this subject actually helps is to be and entrepreneur. After the project, we realize that setting up a new business requires a lot of thought and hard work.
Last but not the least, we would also like to thank all the friends who were always supporting and there when needed.
Thank you.
Arpana Pradhan
Ayush Man Tamrakar
Jashmina Pradhananaga

Signature Page
I hereby certify that I have read this document and, in my opinion it is satisfactory in scope and quality as a business plan project held during third year sixth semester for the under graduate course of Entrepreneurship and New Business Foundations held at Kathmandu College of Management.
.
Date: __________________________
Remarks:
…………………………………………………………………………………………………………………………………………………………………………………………………………………………………………………………………………………...…………………………………………………………………………………………………………………………………………………………………………
________________________________
Mr. Shree Ranjan WastiEntrepreneurship and NBF InstructorCourse FacilitatorKathmandu College of Management

Copyright
All rights of this report are reserved. No part of it may be reproduced or transmitted in any form without the prior notice and permission by the authors. No patent liability is assumed with respect to the use of the information content there in.
Authors:
Arpana PradhanAyush Man TamrakarJashmina Pradhananaga
Kathmandu College of ManagementGwarko, Lalitpur
Date: 20th May 2013
Disclaimer
The objective of this report was to gain insight in the field of making business plan and analyzing the financial situation and feasibility of a bottle manufacturing company in Nepal.
The authors are confident that the results of the analysis and the results presented in this report will be taken as guidance for a comprehensive study at the future date. The authors are not responsible or liable legally and morally against the results and consequent decisions based on the responses received from the analysis. The views expressed in this report are those of the group members only.
Table of Contents

Executive Summary
1.0 Company Description
1.1 Company History
1.2 Missions Statement
1.3 Products
1.4 Current Status
1.5 Legal Status and Ownership
2.0 Industry Analysis
2.1 Industry Size Growth Rate and Sales Projections
2.2 Industry Structure
2.3 Nature of Participants
2.4 Key Success Factors
2.5 Industry Trends
2.6 Long Term Prospective
3.0 Market Analysis
3.1 Market Segmentation
3.2 Buyer Behavior
3.3 Total Market Demand
3.4 Competitors Analysis
3.5 Market Share
3.6 Sales Forecasting
4.0Marketing Plan

4.1Overall Marketing Strategy
4.2Product Price Place Promotion
4.3Marketing Expense
5.0 Production Plan
5.1 General Approach to Production
5.2 Fixed Asset Requirement
5.3 Life of Fixed Assets
5.4 Planned Capacity and Future Capacity
5.5 Factory Location and Layout
5.6 Raw Material Requirement and cost
5.7 Labor Requirement and Cost
5.8 Labor Motivation
5.9 Indirect Factory Overhead
5.10 Per Unit Cost of Production
6.0 Product Design and Development Plan
6.1 Development Stats and Tasks
6.2Challenges and Risks

6.3 Intellectual Property
7.0 Management Team and Company Structure
7.1Management Team
7.2Company Structure
7.3Preoperatibng Activities and Cost
7.4 Fixed Asset Requirement
7.5Administrative Office
8.0 Financial Plan and Projections
8.1 Assumptions Sheet
8.2 Sources and Uses of Funds Statement
8.2.1.0Total Capital Requirement
8.2.1.1Fixed Capital
8.2.1.2Working Capital
8.2.1.3Preoperating Expenses
8.2.1.4 Others
8.2.2 Capital Structure
8.3Loan Repayment Schedule
8.4Selling Price
8.5Income Statement
8.6Cash Flow Statement
8.7 Balance Sheet
8.8Return on Investment
8.9 Break Even Point
Executive Summary

Plastic is the basic need of our day to day life. During recent years the plastic industry has grown with a substantial growth rate. This growth is driven by 3 sectors viz. packaging, infrastructure and agriculture. PET bottles have become highly popular packaging for many kinds of liquid products such as soft drinks, drinking water, cooking oil because o f i t s s t r e n g t h , l i g h t w e i g h t , a n d s a t i s f a c t o r y resistance to acids and almost all organic solvents.
We, the Care plastics provide a wide range of plastic bottles solutions for household and raw material for packaging of various companies. Care Plastics Company is planning to start its way with a view to manufacture plastic bottles in Nepal. Our main focus is our industrial customer whom we will sell PET bottles and PET flakes. It will contribute more than 90% of our sales. We will also support on the household plastic business which is the part of our portfolio. The pre operating cost will be Rs 131000.
Since plastic material does not carry any brand name so it will give us an additional benefit in long term to establish our brand name. To exploit the market we willu s e p e n e t r a t i o n p r i c i n g a s o u r m a r k e t i n g s t r a t e g y a n d u t i l i z e o u r s t r i n g e n t distribution network and strong industrial relationship.
1.0 Company Description

1.1 Company Description
The company will provide a wide range of plastic bottles for both producers and consumers. The products for consumers can be suitable for household water refilling purposes and portable water carriage purposes. However, our potential customers are business producers who will be producing soft drinks and juice. The market will be favorable for us as the prices have been set at a reasonable level. The company after a stable start off will apply a sustainable green approach and use recycled materials.
The company has its production set up in Dhulikhel where a positive advantage will exist as the sector has sufficient manpower and resources and it has a direct link with transportation and communication. The administrative decisions will be centralized from the capital of the country, Kathmandu. The office will be set up in Bagbazar. This location is best favorable with the potential market and will benefit at its
best.
1.2 Mission Statement

Care Plastics Pvt. Ltd. is a manufacturing company dedicated to manufacture plastic bottles, utilizing environmentally friendly manufacturing methods. We intend to make enough profit to generate a significant return for our investors and to finance continued growth and continued development in quality products. We will also maintain a friendly, fair, and creative work environment, which respects diversity, new ideas and hard work.
Care Plastics Pvt. Ltd.
Strives to provide the excellent plastic bottle solution to the customers at competitive prices.
Continually expands our range of products. Is poised to service both large and small customers
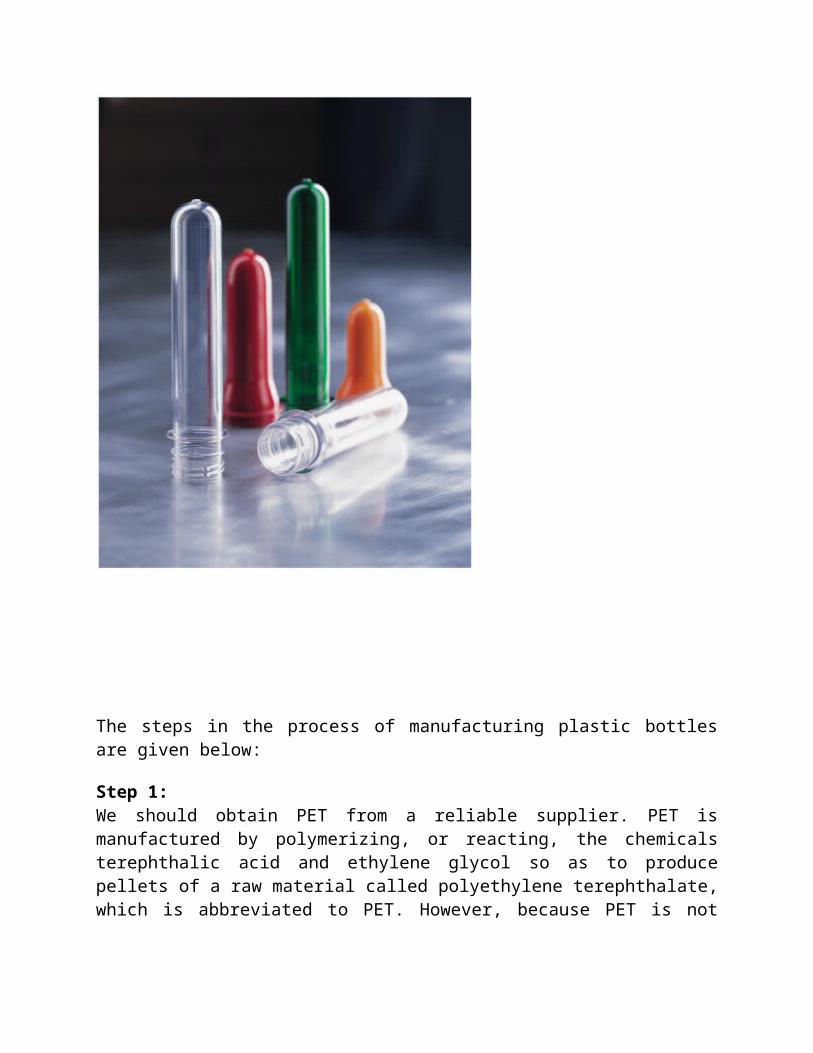
1.3 Products

Product no.: 901 Product Code: AGYRProduct Name: PET Orange
Product Color: Transparent/Brown/GreenProduct Description: Bottle for Juice and Medical UseProduct Size: 8 inchesProduct Weight: 30 gm
Product no.:902 Product Code: KLRHProduct Name: PET Blue
Product Color: Transparent/Blue/Brown/RedProduct Description: Bottle for Household use Product Size: 12 inchesProduct Weight: 70gm
Product no.: 903Product Code: GTWYProduct Name: PET Glass
Product Color: 904Product Description: Bottle for Mineral WaterProduct Size: 10 inchesProduct Weight: 30 gm
Product no.: 904Product Code: TSGFProduct Name: PET Cola
Product Color: Transparent/GreenProduct Description: Bottle for Cola and Soda

Product Size: 7 inchesProduct Weight: 60 gm
1.4 Current Status
Total Assets: Nrs. 1,93,07,974Total Capital: Nrs. 73,07,974Total Liabilities: Nrs. 1,20,00,000
Office Address: Bagbazar, Kathmandu, NepalFactory Location: Dhulikhel, Kabhre, NepalWarehouse Location: Dhulikhel, Kabhre, Nepal
No. of Employees in the Office: 10No. of workers in the Factory: 19
1.5 Legal Status and Ownership (As on 2013)
Company Name: Care Plastics Pvt. Ltd.
PAN no. 121291235

Established year: 2013
Company Share: 1/3 ownership of Arpana Pradhan1/3 ownership of Ayush Man Tamrakar1/3 ownership of JashminaPradhananga
2.0 Industry Analysis
2.1 Industry Size Growth Rate and Sales Projections
The plastic bottle manufacturing industry has had a steady growth rate in the past decade in Nepal. However, the recent years have brought an increase in various brands and companies that have created an increased demand for bottle manufacturing in Nepal. The

plastic products manufacturing industry has players who produce not only packaging bottles, but also plastic utensils, plastic buckets, plastic water tanks, plastic plumbing products etc. the bottle manufacturing companies have received high demands lately due to the increase in mineral water production. Demands are also placed by other small to large food industries such as pickles, mayonnaise, jam, honey, coffee, tea, etc.
2.2 Industry StructureThe following pattern is likely to be general but there will be some variation from country to country. Raw Material ProducersThese are chemical and petroleum companies who produce "virgin" plastic (sometimes called resin or polymer) in huge quantities. Virgin material is delivered in powder or pellet form, in plastic or paper sacks of around20 kilos weight, in large cardboard drums that hold many times that quantity or even by road tanker. CompoundersThese specialist companies, usually small, stock various polymers and provide the manufacturers of plastic goods with technical advice and the most suitable materials or mixtures for each individual need. StockistsThese warehouses stock polymers and compounds but neither manufacture themse lves , nor p rov ide a compounding se rv ice . They may be agen t s o r subsidiaries of the producer companies or departments of companies concerned with the supply of other materials such as chemical, rubber or paper. They may be willing to stock reclaim alongside virgin materials, especially if these are in short supply.
Specialist Manufacturers or MoldersT h e s e b u y t h e i r r a w m a t e r i a l s f r o m c o m p o u n d e r s . I f t h e y d o t h e i r o w n compounding , o r i f the mate r ia l i s used as p roduced and does no t needcompounding , they may buy d i rec t f rom s tock i s t s o r p roducers . They a respecialists in plastics and do not perform other types of manufacturing. They may be an attractive market to the manufacturer because they operate at high volume, but rarely have as much flexibility to vary product quality as molders who know, accurately, the final market for the product.
Other ManufacturersMany companies are not plastics specialists but employ molding operations in the manufacture of some other product. For example shoe and boot makers use plastics extensively and may carry out the various plastics molding operations in the same

production sequence as the work in leather, canvas, rubber etc. Manymanufacturers use plastic packaging machinery at the end of a productionoperation.
FabricatorsThese firms cut and join sheet, rod or extrusion to manufacture a variety of products. They have no opportunity to use reclaim. Machinery and Tool Makers one other sector of the plastics industry justifies mention although not customers for reclaim. The makers and suppliers of plastics manufacturing machinery, tools, moulds and dies are well informed about who does what, who makes what and who uses what within the local plastics industry. They may advise who is likely to buy material
2.4 Key Success Factors
The main keys to the success of the Company are:•Secure Supply- Contract for supply of post-consumer bottles and post-industrial manufacturing waste for PET raw material feed stock.•Satisfy our customer so that we can retain them•Maintain low overhead and operating costs•Provide better prices than all our competitors
2.5 Long Term ProspectiveThe development of Care Plastics required to accomplish a series of action and formalities. Since we are new in the market we kept our production low initially, as demand will increase the production will be enhanced respectively. Now we are manufacturing only two types of plastic bottles i.e. PVC and PET, as we grow we will produce a wide the range of plastic bottles. The development process involves following steps:•Legal formalities

•Office/business setup•Future offerings and expansion planDevelopment strategyIn future we are looking for the production of a variety of plastic bottles. These plastic bottles will be•LDPE ( Low density polyethylene)•HDPE ( High density polyethylene) Our long term strategy will base on timely completion of the establishment of the business centre with low execution cost. Our strategy will focus not only the current uninterrupted production of PVC and PET bottles and acquisition of customer as fast as we can, but we will also look for the future expansion plan and execution strategy. Our future development strategy will focus on to chart out a careful plan for the future expansion and growth of our business. The development strategy will address following issue:•How will we expand our services?•Which are the new areas we will include to provide our services?•What will be the format of the business? Our development strategy will address all those above mentioned point. As we will grow and our earning will increase, we will produce more of PVC and PET bottles as well as expand in new area. We have a development strategy to expand our facility size in order to meet the production size
3.0 Market Analysis
3.1 Market Segmentation
Strong demand for plastic bottles is working in the industry's favor. Major users of plastic packaging, apparently responding to consumer desires, have begun incorporating at least some recycled plastic content in their products as part of the growing interest in recycling. Resin demand is on the rise as prices for the two major recycled resins, PET and HDPE, continue to hold value or appreciate against their virgin counterparts.
The Company has chosen its target markets because PET is in high demand as flake resin by converters, as roll stock sheet used to produce high visibility packaging and as

high strength strapping for the lumber industry. Sales are price-sensitive, so that proximity to markets and feed stock source provide a competitive edge.
3.2 Buyer Behavior
Since we a re new p layer in the marke t so we need to make some s t r ingen t strategies to penetrate market and grab customers. The customers of the plastic bottles industry are scattered due to lack well known brand names. So our first priority will be to accumulate the defused customers. The d i r ec t cus tomers a re the cus tomers whom we a re se l l ing our p roduc t regu la r ly . So fo r us househo lds whom we a re se l l i ng p la s t i c goods andcompanies who are getting raw materials for packaging are direct customers (PET bo t t l e s ) . So on ly in Ka thmandu , in terms of business to business market around 20small and medium scale companies are our direct customers. Apart from them there are few small companies which are giving compounding services. They use to collect various types of plastics flakes along with the virgin plastic and suggest customer (companies) in choosing appropriate plastic. An Asha enterprise is one compounder whom we will sell our plastics.
3.3 Total Market Demand
Demand can be defined as the quantity which consumer is willing to purchase at a given price during a certain time period. In our case, demand will be determined by the individual demand of the shops selling plastic bottles. The estimation of the demand of the bottles is shown as follows:
Monthly demand (in Shop Number(in sample)

quantity)1 2 3 4 5
Bottles 1120 965 1050 1035 930
Total Market Demand = 5100 units per month
Number of Competitors (Manufacturers) = 3
No. of shops selling bottles = 24
Average Market Demand = (5100 / 5) units= 1020 units per month
Actual Total Market Demand = (1020 * 24) units = 24480 units per month
3.4 Competitors Analysis
In plastic bottles manufacturing market there is no specific brand name existing so the market is flooded by small companies which are in this business. So they are our biggest direct competitors. As we are also not alone as a supplier of PET to the companies as raw materials there are many companies in this region which are supplying PET. Om Plastic Industries is one of them who is currently selling all types of plastic bottles. So in case of business to business market they are our direct competitors.
3.5 Market Share
Market share will help us determine our competitors, total market share of different competitors and how we plan to make sure that we grab more of the market share in the

future. Our market share will be estimated on the basis of number of competitors. The industry has only 3 known competitors. Therefore, the market share of our company is:
Market share = (24480 / 4) units= 6120 units per month
3.6 Sales ForecastingThe next important factor for success is planning. Planning involves the forecasting of sales; that is, determining the amount of sales in advance. It helps to estimate the amount of production to be done. Forecasting of the sales depends on the market share of the product. Uncertain environment becomes a barrier to effective forecasting of sales. Sales can be forecasted through:
1. Conservative estimation (60% - 70%)2. Moderate estimation (70% - 80%)3. Aggressive estimation (80% and above)
The sales forecast for the first five years is as follows:
Year Sales (in qty) Sales (in amt)(Rs.)2014 55080 1,28,33,6402015 58752 1,36,89,2162016 62424 1,45,44,7922017 66096 1,54,00,3682018 73440 1,71,11,520
4.0Marketing Plan
4.1Overall Marketing Strategy
The Company has chosen to focus on the p roduc t ion o f p la s t i c bo t t l e s packag ing materials from recycled post-consumer beverage bottles. We have identified a significant available market in the eastern part of Kathmandu. All of our

initial marketing s t r a tegy wi l l be to secure con t rac t s in tha t segment , and a f t e r reach ing fu l l planned capacity, we look to grow in concert with that segment and related markets. We see little need at present for further market research and development, and will focus on continually updating our production technology in an effort to remaining the forefront of our chosen marketplace.
4.2Product Price Place Promotion
Product/Service StrategyThe packaging companies require high quality and highly transparent PET bottles. The companies which are producing mineral water will reject PET bottles with even a small impurity/ opaqueness. So we the Care Plastics provide high end PET flakes for the perfect packaging. The company will apply recycling and extrusion technology managed by decades of industry specific expertise to create a competitive advantage for its clients. These processes will produce clean, cost-efficient, recycled raw material for manufacturers of thermoform, laminate and other high value-added products, and high strength packaging strapping for shippers of large products and pallets, t h e r e b y r e d u c i n g c o s t s a n d c r e a t i n g a c l e a r p r i c i n g e d g e a m o n g t h e i r competitors.Plastic bottles are now in high demand. And this demand is driven by continuously increasing promotional activities.
Pricing strategy
As plastic products do not carry any brand name so only pricing and distribution strategies will work to achieve competitive edge. The pricing strategy we will use is penetration pricing. The price of the plastic bottles we will sell will be lower than the market price. Also for the PET flakes and bottles the price will be lower than the competitors. A lower price enables us to get contracts of PET bottles and sheets from various companies .
Place strategyFirstly we will target Kathmandu, Bhaktapur and Lalitpur areas. We will have a distribution center in Kathmandu which continuously maintains the supply of the bottles. PET bottles will be stored in warehouse which is close to the facility itself. The sales people will directly contact to the

companies which require these bottles for packaging and look for the contracts. In city as stated above that we will have a distribution center, from that center we will distribute to whole sellers.
Promotion strategyWewillp romote th rough on l ine soc ia l media and we wi l l a l so deve lop our webs i t e which enables us to widely spread our contact among various companies. The site will have full details of product which are available for companies as well as end user.
5.0 Production Plan
5.1 General Approach to ProductionPlastic bottles are the preferred containers for most soft drinks as well as for light household cleaners and other consumer goods. Small manufacturers can make custom plastic bottles using virgin or recycled Polyethylene Terephthalate (PET) flakes and a simple, easy-to-obtain manufacturing apparatus. With more and more specialty consumer products manufacturers launching new products, the need for custom-designed PET bottles is increasing. Therefore, we are going for small packaging manufacturer to obtain these bottles. Since the cost of entry is not great and the process is relatively simple, PET bottle manufacturing represents an exciting small business opportunity.


The steps in the process of manufacturing plastic bottles are given below:
Step 1:We should obtain PET from a reliable supplier. PET is manufactured by polymerizing, or reacting, the chemicals terephthalic acid and ethylene glycol so as to produce pellets of a raw material called polyethylene terephthalate, which is abbreviated to PET. However, because PET is not biodegradable, it is possible to obtain raw PET for bottlemanufacturing from shredded recycled plastic bottles.
Step 2:Secondly, we should mold the raw PET pellets or recycled shredded PET into a preform, which resembles a test tube in appearance.This is done using either a separate preform

molding machine or a combined one-step apparatus that includes the preform and final molding within one machine. We are using a combined one-step apparatus.
Step 3:Thirdly, the mold is to be stretched. The preform is placed into a mold that corresponds to the shape of the bottle and is contained within the injection molding device. In some cases the original preform tube is cut into shorter lengths before being placed in the stretch-molding device. Hot, pressurized air is blown through a steel tube that pushes the heated preform tube against the mold so that crystallization takes place as the heated preformed PET is forced to take the shape of the inside of the mold.
Step 4:The bottles are then trimmed as necessary to remove excess PET, and then cooled with compressed air before they are either filled on-site or shipped to the location where they will be filled. Hot filling bottles are only possible when they will be used for the sale of foods of a certain degree of acidity, and this should be done only with proper equipment.
Step 5:Finally the bottles are labeled as necessary once they are filled. Labels are produced with separate equipment and are not usually provided by PET bottle manufacturers unless the manufacturer also fills the bottles. Therefore, we are not labeling the product in the factory.
5.2 Fixed Asset Requirement
S no. Description Unit Quantity
Rate(Rs) Amount(Rs)
1. Land Ropani 1 48,00,000 48,00,0002. Building Sq. ft. 7316 956.81 70,00,0003. Plant and Machinery
a) Extrusion lineb) Cap Making Machinec) Combination Mixerd) Generator
SetSetSetSet
1111
12,00,0007,00,00010,00,0002,00,000
12,00,0007,00,00010,00,0002,00,000

4. Furniturea) Big tableb) Small tablec) Chair
PcsPcsPcs
4215
7,0004,0001,500
28,0008,00022,500
5. Vehicle Set 1 30,00,000 30,00,000Total 1,79,58,500
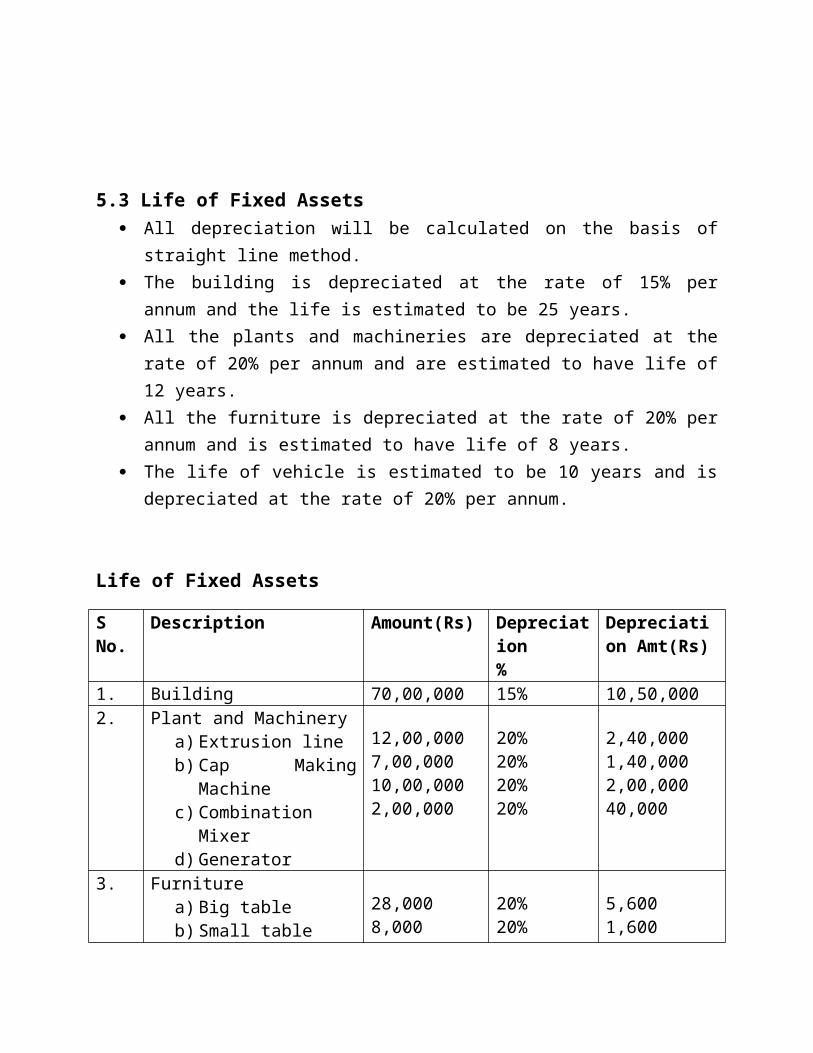
5.3 Life of Fixed Assets All depreciation will be calculated on the basis of straight line method. The building is depreciated at the rate of 15% per annum and the life is estimated
to be 25 years. All the plants and machineries are depreciated at the rate of 20% per annum and
are estimated to have life of 12 years. All the furniture is depreciated at the rate of 20% per annum and is estimated to
have life of 8 years. The life of vehicle is estimated to be 10 years and is depreciated at the rate of 20%
per annum.
Life of Fixed Assets
S No. Description Amount(Rs) Depreciation%
Depreciation Amt(Rs)
1. Building 70,00,000 15% 10,50,0002. Plant and Machinery
a) Extrusion lineb) Cap Making Machinec) Combination Mixerd) Generator
12,00,0007,00,00010,00,0002,00,000
20%20%20%20%
2,40,0001,40,0002,00,00040,000
3. Furniturea) Big tableb) Small tablec) Chair
28,0008,00022,500
20%20%20%
5,6001,6004,500
4. Vehicle 30,00,000 20% 6,00,000Total 1,31,58,500 22,81,700Monthly Depreciation 1,90,142

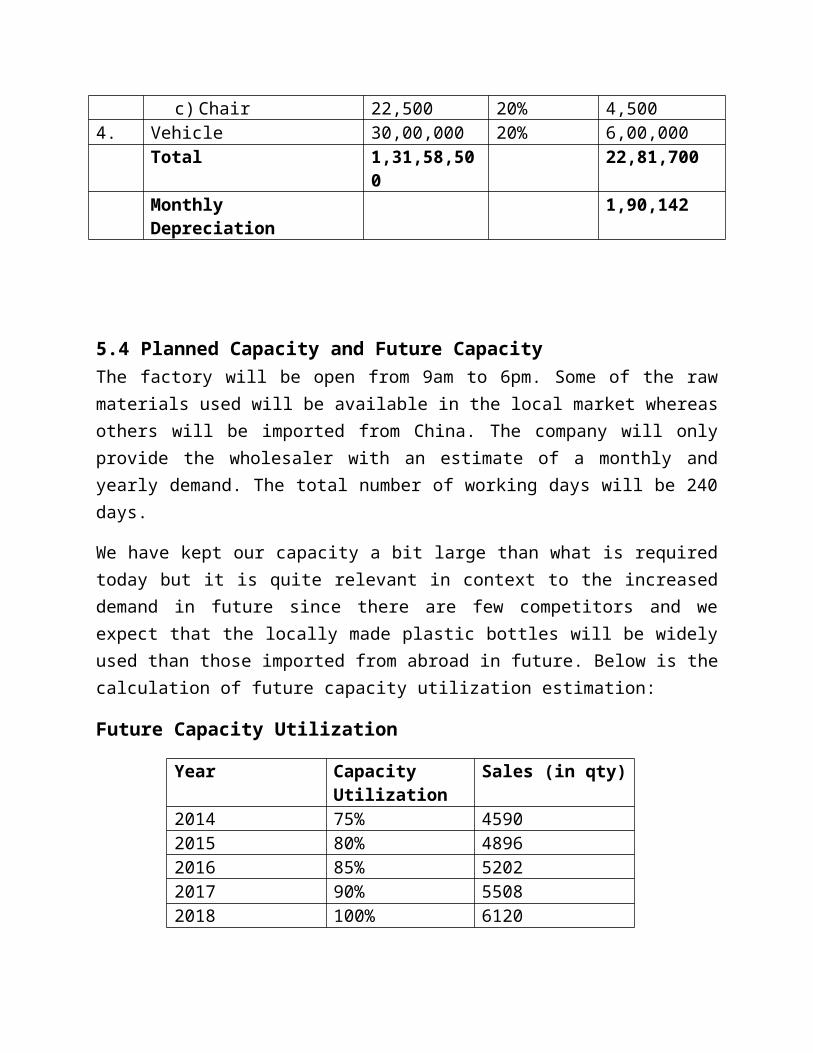
5.4 Planned Capacity and Future CapacityThe factory will be open from 9am to 6pm. Some of the raw materials used will be available in the local market whereas others will be imported from China. The company will only provide the wholesaler with an estimate of a monthly and yearly demand. The total number of working days will be 240 days.
We have kept our capacity a bit large than what is required today but it is quite relevant in context to the increased demand in future since there are few competitors and we expect that the locally made plastic bottles will be widely used than those imported from abroad in future. Below is the calculation of future capacity utilization estimation:
Future Capacity Utilization
Year Capacity Utilization
Sales (in qty)
2014 75% 45902015 80% 48962016 85% 52022017 90% 55082018 100% 6120
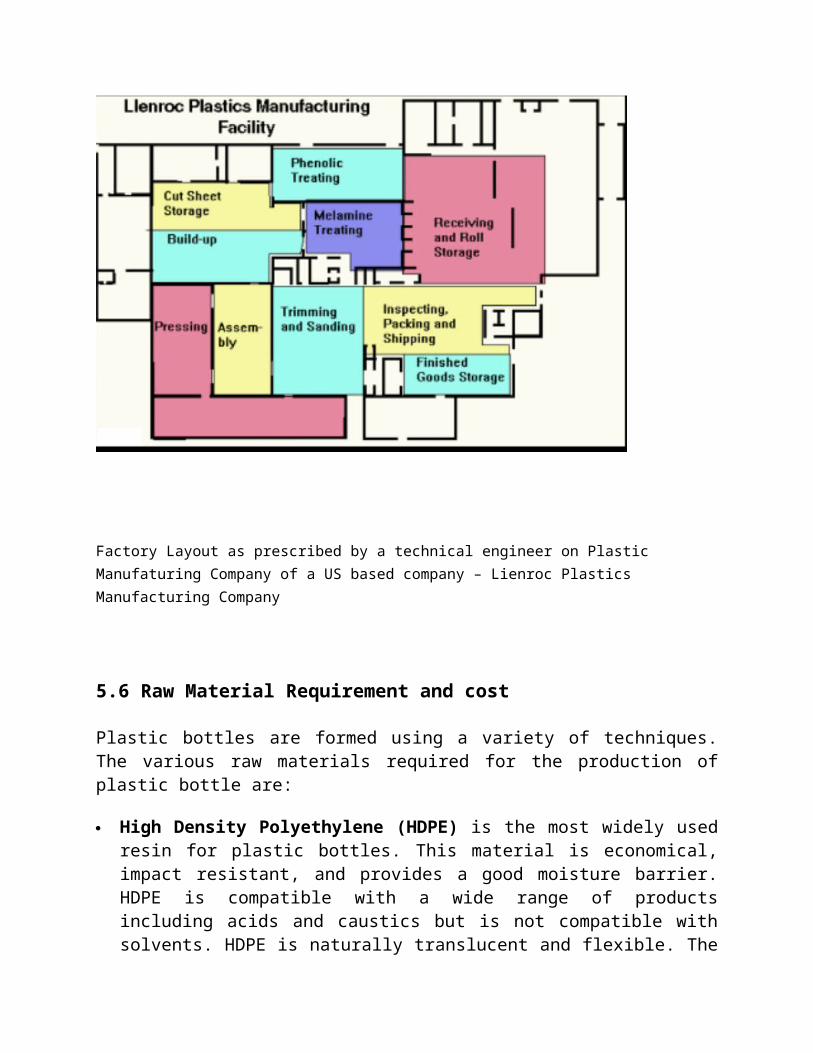
5.5 Factory Location and Layout

Location of the Factory – Dhulikhel, Kabhre
Factory Layout as prescribed by a technical engineer on Plastic Manufaturing Company of a US based company – Lienroc Plastics Manufacturing Company
5.6 Raw Material Requirement and cost
Plastic bottles are formed using a variety of techniques. The various raw materials required for the production of plastic bottle are:
High Density Polyethylene (HDPE) is the most widely used resin for plastic bottles. This material is economical, impact resistant, and provides a good moisture barrier. HDPE is compatible with a wide range of products including acids and caustics but is not compatible with solvents. HDPE is naturally translucent and flexible. The addition of color will make HDPE opaque although not glossy. HDPE lends itself readily to silk screen decoration. While HDPE provides good protection at below freezing temperatures, it cannot be used with products filled at over 160 °F (71 °C) or products requiring a hermetic (vacuum) seal.
Low Density Polyethylene (LDPE) is similar to HDPE in composition. It is less rigid and generally less chemically resistant than HDPE, but is more translucent. LDPE is

used primarily for squeeze applications. LDPE is significantly more expensive than HDPE.
Polyethylene Terephthalate (PET, PETE or polyester) is commonly used for carbonated beverage, water bottles and many food products. PET provides very good alcohol and essential oil barrier properties, generally good chemical resistance and a high degree of impact resistance and tensile strength. The orienting process serves to improve gas and moisture barrier properties and impact strength. This material does not provide resistance to very high temperature applications—max. temp. 200 °F (93 °C).
Polyvinyl Chloride (PVC) is naturally clear, has extremely good resistance to oils, and has very low oxygen transmission. It provides an excellent barrier to most gases and its drop impact resistance is also very good. This material is chemically resistant, but it is vulnerable to solvents. PVC is an excellent choice for salad oil, mineral oil, and vinegar. It is also commonly used for shampoos and cosmetic products. PVC exhibits poor resistance to high temperatures and will distort at 160 °F (71 °C), making it incompatible with hot filled products.
Polypropylene (PP) is used primarily for jars and closures and provides a rigid package with excellent moisture barrier. One major advantage of polypropylene is its stability at high temperatures, up to 220 °F (104 °C). Polypropylene is autoclavable and offers the potential for steam sterilization. The compatibility of PP with high filling temperatures is responsible for its use with hot fill products. PP has excellent chemical resistance, but provides poor impact resistance in cold temperatures.
Polystyrene (PS) offers excellent clarity and stiffness at an economical cost. It is commonly used with dry products including vitamins, petroleum jellies, and spices. Styrene does not provide good barrier properties, and exhibits poor impact resistance.
Post Consumer Resin (PCR) is a blend of reclaimed natural HDPE (primarily from milk and water containers) and virgin resin. The recycled material is cleaned, ground and recompounded into uniform pellets along with prime virgin material especially designed to build up environmental stress crack resistance. PCR has no odor but exhibits a slight yellow tint in its natural state. This tint can be hidden by the addition of color. PCR is easily processed and inexpensive. However, it cannot come into direct contact with food or pharmaceutical products. PCR can be produced in a variety of recycled content percentages up to 100%.
Bioplastic- polymer structures based on processed biological materials rather than petrochemicals.

We have decided to choose the supplier low cost without compromising on the quality. The table below shows the total monthly raw material costs and estimated requirement for the company. The raw material quotation is forwarded to the wholesaler who stocks the goods according to the company’s requirement.
Raw Material Requirement and Cost
S No. Description Quantity Rate (Rs) Amount (Rs)1. Polyethylene Terephthalate 765 pound 50 38,2502. High Density Polyethylene 700 pound 46.75 32,7253. Low Density Polyethylene 650 pound 45 29,2504. Polyvinyl Chloride 675 pound 55 37,1255. Polypropylene 500 pound 50 25,0006. Polystyrene 500 pound 55 27,5007. Post Consumer Resin 475 pound 55 26,1258. Bioplastic 400 pound 60 24,0009. Others 25,000
Total 2,64,975
5.7 Labor Requirement and CostThe business requires various types of laborers – skilled, semi-skilled and unskilled as well. Skilled laborers are required so that the plants and machineries can be handled properly and the production process can go smoothly. Semi skilled laborers are also required to assist the skilled ones in the minor activities. Similarly, unskilled laborers are also required to carry out other minor activities like gate keeping, security, etc. However, finding these various types of laborers would be difficult.
Since the factory location is Dhulikhel, we plan to employ local laborers and if required, we will hire few from the valley as well.
The laborers will be given a proper work schedule which is to be followed strictly. One week training program will be conducted for the laborers. They are required to inform the management at least one month in advance before quitting the job.
Labor Requirement and Cost
S No.
Description No. Rate(Rs) Amount(Rs)
Total Amt (Rs)
1. Direct labora) Skilled
-Factory head-Technician-Others
b) Semi-skilledc) Unskilled
11285
12,00015,00010,0006,0004,000
12,00015,00020,00048,00020,000
1,15,000
2. Indirect Labora) Production Managerb) Logistics Manager
11
20,00012,000
20,00012,000
32,000
Total 1,47,000
5.8 Labor MotivationThe laborers will be given a proper work schedule which is to be followed strictly. One week training program will be conducted for the laborers. They are required to inform the management at least one month in advance before quitting the job. we will develop effective labor packages that will be designed by proffessional HR firms to motivate the workers. we will take careful measure regarding employee safety in the workplace, and equip our workers with all necessary materials and equipment.
Extrinsic rewards will be our basic motivation factor under which we will provide enough monetary compensation to our workers. other benefits will also be provided. we will employ proper work schedules, taking consideration to workers breaks to create a healthy working envoirnment within the factory
5.9 Indirect Factory Overhead
Indirect Factory Overhead Expenses (Monthly)
S No. Description Amount (Rs)
1. Indirect labor 32,000
2. Refreshment 34,200
3. Electricity and Water 20,000
4. Repair and Maintenance 10,000
5. Transportation 15,000
6. Stationery 2,000
7. Warehouse expense 10,000
8. Others 10,000
9. Depreciation 1,90,142
Total 3,23,342
5.10 Per Unit Cost of Production
S No. Description Amount (Rs)
1. Monthly Raw Material Cost 2,64,975
2. Monthly Direct Labor Cost 1,15,000
3. Monthly Factory Overhead Expense 3,23,342
Monthly Total Cost of Production 7,03,317
Monthly Production 4590 units
Cost of Production per Unit 153.23
6.0 Product Design and Development Plan

6.1 Development Stats and Tasks
6.2Challenges and Risks
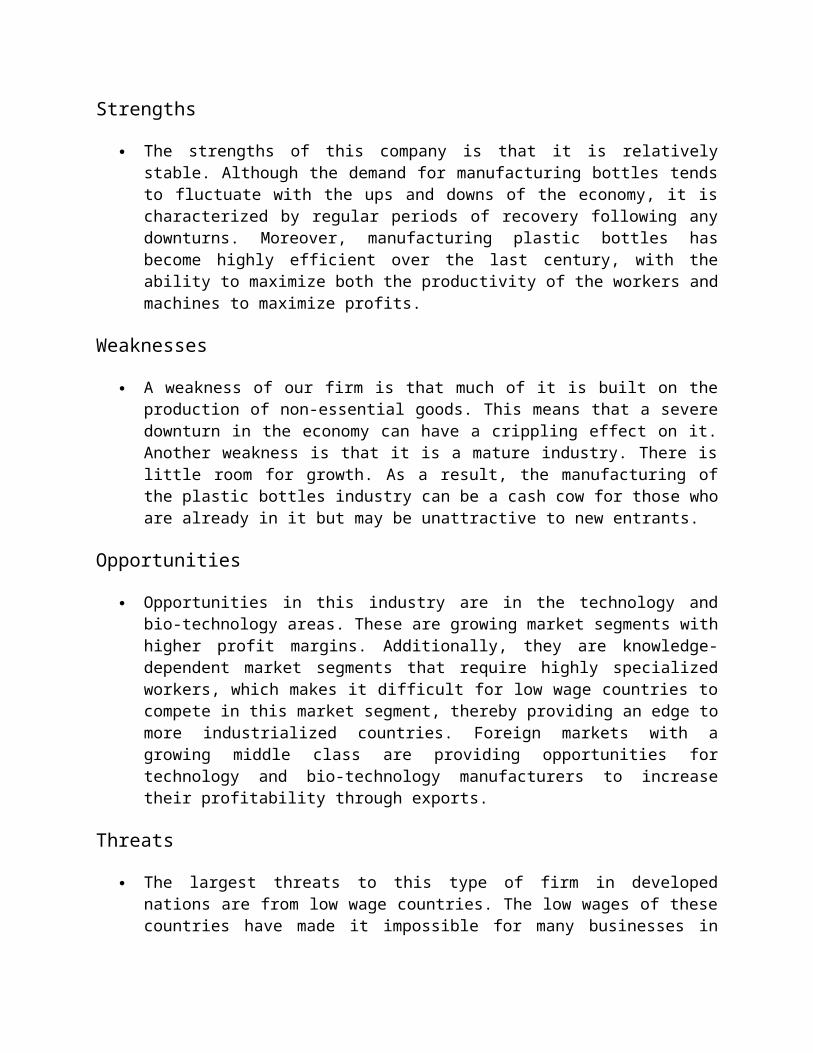
Strengths
The strengths of this company is that it is relatively stable. Although the demand for manufacturing bottles tends to fluctuate with the ups and downs of the economy, it is characterized by regular periods of recovery following any downturns. Moreover, manufacturing plastic bottles has become highly efficient over the last century, with the ability to maximize both the productivity of the workers and machines to maximize profits.
Weaknesses
A weakness of our firm is that much of it is built on the production of non-essential goods. This means that a severe downturn in the economy can have a crippling effect on it. Another weakness is that it is a mature industry. There is little room for growth. As a result, the manufacturing of the plastic bottles industry can be a cash cow for those who are already in it but may be unattractive to new entrants.
Opportunities
Opportunities in this industry are in the technology and bio-technology areas. These are growing market segments with higher profit margins. Additionally, they are knowledge-dependent market segments that require highly specialized workers, which makes it difficult for low wage countries to compete in this market segment, thereby providing an edge to more industrialized countries. Foreign markets with a growing middle class are providing opportunities for technology and bio-technology manufacturers to increase their profitability through exports.
Threats
The largest threats to this type of firm in developed nations are from low wage countries. The low wages of these countries have made it impossible for many businesses in developed nations to compete, requiring them to either close or move overseas to find cheap labor.
6.3 Intellectual Property
7.0 Management Team and Company Structure
7.1Management Team
This company will be managed under the partnership venture of Mr. Ayush Man Tamrakar, Ms. Jashmina Pradhananga and Ms. Arpana Pradhan. These three partners will be contributing on equal proportions.
Ayush Man Tamrakar, President, has a 20 year history of experience encompassing all aspects of Polymer Raw material, Plastic Conversion Methods, and Venture Development. He has founded successful ventures in plastic converting industry, and assisted in the launch of five plastic converting manufacturing plants.
Jashmina Pradhananga, Executive VP and COO, is a graduate Engineer with over 20 years and experience in the post- consumer plastics recycling industry and is the inventor of the primary cleaning and refining technology used in the process for this project. She has received a patent for her technology and has been directly involved in over twenty-five major post consumer plastics recycling projects.
Arpana Pradhan, CFO, has over 30 years investment and merchant banking and management experience. She has assisted in raising over $500 million and served as board member in over 40 public and private companies.

7.2Company Structure
The organization will be managed by Ms. Jashmina Pradhananga, Mr. Ayush Man Tamrakar and Ms. Arpana Pradhan. Under them there will be different managers who will be directly reporting to them. Each manager will have their own department and will be responsible for their work. The organization chart is shown below:
Central Office
Production Department
Sales and Marketing Department
Accounting Department

7.3Preoperating Activities and Cost
The following activities need to be done before the business can be operated:
Registering the business ½ week
Preparing the business plan 4 weeks
Applying for the loan and approval 8 weeks
Contacting equipment suppliers 2 weeks
Constructing the factory 18 weeks
Hiring the labor 2 weeks
Executive Director
Production Manager
Factory Head
Assistant Factory Head Technical Head
Logistics Head Warehouse Supervisor
Sales and Marketing Manager
Sales Supervisor
Regional Sales Officer 1
Regional Sales Officer 2
Regional Sales Officer 3
MaketingOfficer
Account Head
Assistant Accountant 1
Assistant Accountant 2

Installing the equipment 3 weeks
Purchasing the materials 2 weeks
Trial production 2 weeks
The trail production has to be done to see how good the product comes out and whether there is any problem with the plan and the machinery or not. Moreover, we have to come out with the sample product in the market to see the response. All these costs are included in the pre operating cost. They are as follows:
Description AmountRegistration cost 7000Trial Production 100000Market Survey 10000Transportation cost 5000Telephone registration 4000Others 5000Total 13100010% amortization 13100Monthly Amortization 1091.67
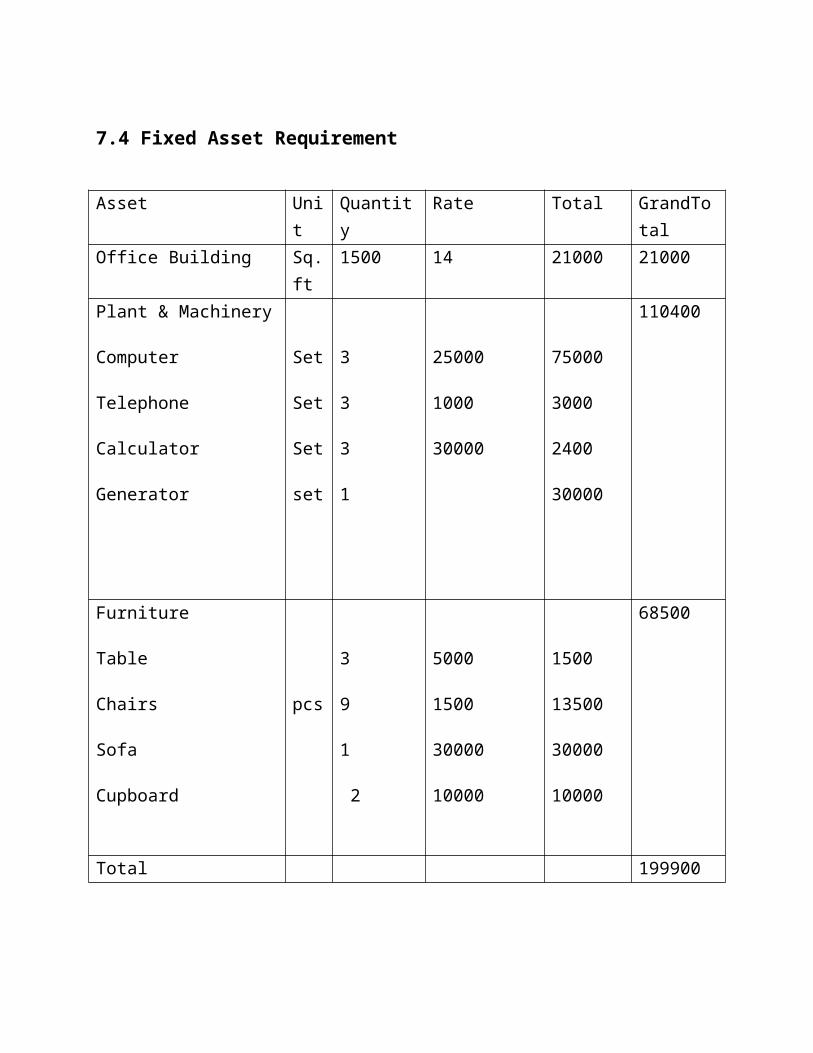
7.4 Fixed Asset Requirement
Asset Unit Quantity Rate Total GrandTotalOffice Building Sq.f
t1500 14 21000 21000
Plant & Machinery
Computer Set 3 25000 75000
110400

Telephone
Calculator
Generator
Set
Set
set
3
3
1
1000
30000
3000
2400
30000
Furniture
Table
Chairs
Sofa
Cupboard
pcs
3
9
1
2
5000
1500
30000
10000
1500
13500
30000
10000
68500
Total 199900
Life of Fixed Assets for Office
Assets Amount Depreciation % Depreciated amountBuilding 210000 15 3150Plant and machinery
Computer
Telephone
Calculator
Generator
75000
3000
2400
30000
20
20
20
20
15000
600
480
6000

Furniture
Table
Chairs
Sofa
Cupboard
15000
13500
30000
10000
20
20
20
20
3000
2700
6000
20000 38930
Monthly 3244
7.5Administrative Office
Description AmountTelephone Bill 2000Refreshment 30000Accountant Salary 7000Others 5000Depreciation 3244Amortization 1091.67Total 48335.67

8.0 Financial Plan and Projections
8.1 Assumptions Sheet Raw material stock for ½ month Production time is 2 days Finished goods stock is 5 days Credit facility for debtors is for 10 day Monthly marketing expense is Rs. 30,000/- Cash management is one month expense on direct labour, factory overhead,
marketing expense, and administrative expense Bank loan of Rs. 1,20,00,000 at 15% interest rate per annum. The loan payback
installment is Rs. 24,00,000 each year till 5 years. Mark up is 15% and the tax rate is 25%
Total Capital Requirement
The total capital requirement refers to the amount of money a business needs for its normal operations and also the amount of cash and easily liquidated assets that a broker/dealer or bank needs to meet SEC regulations, usually expressed as a proportion of total liabilities. In general, the kinds of assets that can make up the broker-dealer capital requirement are strictly defined.
8.2 Sources and Uses of Funds Statement8.2.1.0Total Capital RequirementThe total fixed assets requirement is:
S No. Description Amount (Rs)1. Fixed Assets for Factory 1,79,58,5002. Fixed Assets for Office 1,99,900
Total Fixed Capital 1,81,58,400
8.2.1.1 Fixed Capital
S No. Description Amt (Rs)
1. Raw material stock (for ½ month) 1,32,487.5
2. Work-in-process stock(153.23/2 * 2 days * 230 units)
35,243
3. Finished Goods stock(153.23 * 5 days* 230 units)
1,76,214.50
4. Credit Sales(153.23 * 10 days* 230 units)
3,52,429
5. Cash Management(1,15,000+30,000+(48,335.67-3,244-1,091.67)+(323342-190142))
3,22,200
Total 10,18,574
Cash Management = Monthly Direct Labor expense + Monthly Marketing expense + Monthly factory Overhead Expense + Monthly Administrative Expense
Working Capital
8.2.1.2Working Capital1. Working Capital 10,18,574
8.2.1.3 Pre-operating ExpensesThe trail production has to be done to see how good the product comes out and whether there is any problem with the plan and the machinery or not. Moreover, we have to come

out with the sample product in the market to see the response. All these costs are included in the pre operating cost. They are as follows:
S. No. Description Amount(Rs)
1. Registration cost 7,000
2. Trial Production 1,00,000
3. Market Survey 10,000
4. Transportation cost 5,000
5. Telephone registration 4,000
6. Others 5,000
Total 1,31,000
10% amortization 13,100
Monthly Amortization 1091.67
The pre-operating expense as previously calculated is Rs. 1,31,000. Thus, the total amount required to start the business is Rs. 1,31,000.
Now the total project cost is:
Total Capital Requirement
S No. Description Amount (Rs)
1. Fixed Capital 1,81,58,400
2. Working Capital 10,18,574
3. Pre-Operating expense 1,31,000
Total Capital Requirement 1,93,07,974
8.2.2 Capital StructureWe have planned to take loan of Rs. 1,20,00,000 from Nepal Investment Bank Limited. This makes the loan constitute 62.15% of the total capital requirement. And the rest 37.85% will be invested by the three owners in equal proportion (that is Rs. 24,35.991.33 each). The capital structure is given below:

Owner’s Equity 73,07,974
Loan 1,20,00,000
Total 1,93,07,974
8.3 Loan Repayment ScheduleThe loan is to be pain over period of 5years at an interest rate of 15% per annum. For the security of loan, the owners have a land and building with a valuation of Rs. 1,75,00,000 which will be kept as collateral for the loan from the bank.
The loan repayment schedule is given as below:
Year Loan Amount Payable Interest (15%) Principle Total Payment
1 1,20,00,000 18,00,000 24,00,000 42,00,000
2 96,00,000 14,40,000 24,00,000 38,40,000
3 72,00,000 10,80,000 24,00,000 34,80,000
4 48,00,000 7,20,000 24,00,000 31,20,000
5 24,00,000 3,60,000 24,00,000 27,60,000
8.4 Selling Price
S No. Description Amount (Rs) Amount (Rs)1. Unit Cost of Production 153.232. Monthly Administrative Expense 48,335.67
3. Monthly Marketing Expense 30,000
4. Monthly Interest on Loan(15% of 1,20,00,000)/12
1,50,000
Total 2,28,335.67
Monthly Production Units 4590 unitsPer Unit Cost (2,28,335.67/4590) 49.75
Final Cost 202.98
15% Mark-up 30.45
Selling price per Unit 233.43~ 233
8.5 Income Statement
Description Amt (Rs) Amt (Rs)Income from Sales(233 * 55080 units)
1,28,33,640
Less: Raw Materials (2,64,975 * 12) 31,79,700Direct Labor (1,15,000 * 12) 13,80,000
Indirect Factory Overhead(1,33,200 * 12) + 22,81,700
38,80,100
Total 84,39,800 (84,39,800)
Gross Profit 43,93,840Less: Marketing Expense (30,000 * 12) 3,60,000
Administrative Expense(44,000 * 12) + 38930 + 13100
5,80,030
Total 9,40,030 (9,40,030)
Earning Before Interest and Tax 34,53,810
Less: Interest expense (15%) (18,00,000)Earning Before Tax 16,53,810
Less: Tax (25%) (4,13,452.5)Earning After Tax 12,40,357.5
8.6 Cash Flow Statement
Description Pre-operating 1st year

Cash InflowEquity 73,07,974Loan 1,20,00,000Sales 1,28,33,640Cash Sales 1,22,98,905Total Cash Inflow 1,93,07,974 1,22,98,905
Cash OutflowPre-operating expense 1,31,000Purchase of Fixed Assets 1,81,58,400Raw Material Cost 31,79,700Direct Labor Cost 13,80,000Factory Overhead Expense 15,98,400Marketing Expense 3,60,000Administrative expense 5,28,000Increase in Inventory 3,43,945Interest expense 18,00,000Repayment of Loan 24,00,000Tax 4,13,452.5Total Cash Outflow 1,82,89,400 1,20,03497.5
Net Cash Flow 10,18,574 2,95,407.5Cash balance in the beginning - 10,18,574Cash balance at the end 10,18,574 13,13,981.5
8.7 Balance Sheet
Description Pre-Operating 1st Year
ASSETS
Current Assets
Cash 10,18,574 13,13,981.5
Inventory - 3,43,945
Account Receivables - 5,34,735
Total Current Assets 10,18,574 21,92,661.5

Fixed Assets 1,81,58,400 1,81,58,400
Less: Depreciation - (23,20,630)
Net Fixed Assets 1,81,58,400 1,58,37,770
Pre-Operating Expense 1,31,000 1,17,900
Total Assets 1,93,07,974 1,81,48,331.5
CAPITAL AND LIABILITIES
Long term loan 1,20,00,000 96,00,000
Owner’s equity 73,07,974 73,07,974
Accumulated profit - 12,40,357.5
Total Owner’s Equity 73,07,974 85,48,331.5
Total Capital and Liabilities 1,93,07,974 1,81,48,331.5
8.8Return on Investment8.9 Break Even Point
8.10 Projected Income Statement for 5 years
Description 1st Year 2nd Year 3rd Year 4th Year 5th Year
Capacity Utilization 75% 80% 85% 90% 100%
Sales Forecast (in units)
Total Sales Volume (Rs)Direct Cost(Raw Material and Direct Labour) (Rs)Indirect factory overhead(Rs)Total Production Cost(Rs)Gross Profit(Rs)
Administrative Expense(Rs)Marketing Expense(Rs)
Total Administrative and Marketing Expenses(Rs)EBIT(Rs)
Interest expense(Rs)
EBT(Rs)
25% Tax (Rs)
EAT/ Net Profit (Rs)
Accumulated Profit (Rs)

![Glossary Plastic Injection Molding Engineering Manufacturing[1]](https://static.fdocuments.net/doc/165x107/577d2ea21a28ab4e1eaf94c3/glossary-plastic-injection-molding-engineering-manufacturing1.jpg)


