Plasmon and compositional mapping of plasmonic...
10
Plasmon and compositional mapping of plasmonic nanostructures Emilie Ringe, a Sean M. Collins, b Christopher J. DeSantis, c Sara E. Skrabalak, c Paul A. Midgley b a Department of Materials Science and Nanoengineering, Rice University, 6100 Main Street MS 325, Houston, TX 77005 US b Department of Materials Science and Metallurgy, Cambridge University, 27 Charles Babbage Road, Cambridge CB3 0FS, UK c Department of Chemistry, Indiana University, 800 E. Kirkwood Ave., Bloomington, IN 47405, US ABSTRACT Recently, co-reduction of Au and Pd has allowed the synthesis of complex Au core/AuPd shell nanoparticles with elongated tips and cubic-like symmetry. Optical studies have shown strong plasmonic behavior and high refractive index sensitivities. In this paper, we describe the composition and the near-field plasmonic behavior of those complex structures. Monochromated STEM-EELS, Cathodoluminescence, and EDS mapping reveals the different resonant modes in these particles, and shows that Pd, a poor plasmonic metal, does not prevent strong resonances and could actually be extremely helpful for plasmon-enhanced catalysis. Keywords: LSPR, alloy nanoparticles, electron-energy loss spectroscopy, plasmon mapping, cathodoluminescence, electron microscopy 1. INTRODUCTION In the last decades, the optical properties of nanoparticles have been increasingly well controlled and utilized, leading to the burgeoning of a variety of fields including plasmon-based chemical and biological sensors, optical logic elements, and nanoparticle-enabled diagnosis and therapeutics. 1-6 These applications rely on localized surface plasmon resonance (LSPR), a light-driven electron oscillation at a metal-dielectric boundary leading to wavelength-dependent absorption, scattering, and enhancement of the electric field near the interface. Several metals can sustain LSPRs, at different frequencies depending on their dielectric function. Noble metals such as silver and gold typically have LSPRs in the visible range, lending them bright colors such as those used in medieval stained glass. Another early application of metal nanoparticles is in catalysis: nanoparticles have been recognized for nearly a century as more efficient and active than bulk counterparts, due not only to the increased surface-to-volume ratio but also to the availability of coordination sites rare or unavailable in large structures. Recently, the combination of plasmonics and catalysis has generated much interest, given the potential realization of controlled plasmon-enhanced catalysis, 7 the nascent field of plasmon sensing of catalytic reactions, 8,9 as well as the new reports on hot electron injection from plasmonic to catalytic structures. 10-12 In this paper, we present a study of Au core Au/Pd shell nanoparticles, a promising multifunctional nanostructure offering a strong plasmonic response due to the Au core, in addition to a surface rich in Pd, a well-known catalytic metal. After a brief overview of current structures and techniques, the composition and crystallography of Au/Pd nanoparticles is discussed, followed by the detailed characterization of their plasmonic behavior with electron-energy loss spectroscopy (EELS) and cathodoluminescence (CL). The observation of strong plasmon resonances in particles coated with a poor plasmonic metal such as Pd suggest that the Au plasmon is only minimally damped, opening the door for multifunctional plasmonic-catalytic architectures. 1.1 Plasmonic nanostructures Materials with a negative real and a small positive imaginary dielectric constant in a given wavelength range, such as quasi- free electron metals, Ag, Au, etc., can support surface plasmon resonances (SPRs) when submitted to electromagnetic *[email protected], phone: 1-713-348-2582 Invited Paper Plasmonics, edited by Xing Zhu, Satoshi Kawata, David J. Bergman, Proc. of SPIE Vol. 9278, 92780J © 2014 SPIE · CCC code: 0277-786X/14/$18 · doi: 10.1117/12.2073886 Proc. of SPIE Vol. 9278 92780J-1 DownloadedFrom:http://proceedings.spiedigitallibrary.org/on10/09/2015TermsofUse:http://spiedigitallibrary.org/ss/TermsOfUse.aspx
-
Upload
nguyentuyen -
Category
Documents
-
view
248 -
download
2
Transcript of Plasmon and compositional mapping of plasmonic...
Plasmon and compositional mapping of plasmonic nanostructures Emilie Ringe,a Sean M. Collins,b Christopher J. DeSantis,c Sara E. Skrabalak,c Paul A. Midgleyb
aDepartment of Materials Science and Nanoengineering, Rice University, 6100 Main Street MS 325, Houston, TX 77005 US
bDepartment of Materials Science and Metallurgy, Cambridge University, 27 Charles Babbage Road, Cambridge CB3 0FS, UK
cDepartment of Chemistry, Indiana University, 800 E. Kirkwood Ave., Bloomington, IN 47405, US
ABSTRACT
Recently, co-reduction of Au and Pd has allowed the synthesis of complex Au core/AuPd shell nanoparticles with elongated tips and cubic-like symmetry. Optical studies have shown strong plasmonic behavior and high refractive index sensitivities. In this paper, we describe the composition and the near-field plasmonic behavior of those complex structures. Monochromated STEM-EELS, Cathodoluminescence, and EDS mapping reveals the different resonant modes in these particles, and shows that Pd, a poor plasmonic metal, does not prevent strong resonances and could actually be extremely helpful for plasmon-enhanced catalysis.
Keywords: LSPR, alloy nanoparticles, electron-energy loss spectroscopy, plasmon mapping, cathodoluminescence, electron microscopy
1. INTRODUCTIONIn the last decades, the optical properties of nanoparticles have been increasingly well controlled and utilized, leading to the burgeoning of a variety of fields including plasmon-based chemical and biological sensors, optical logic elements, and nanoparticle-enabled diagnosis and therapeutics.1-6 These applications rely on localized surface plasmon resonance (LSPR), a light-driven electron oscillation at a metal-dielectric boundary leading to wavelength-dependent absorption, scattering, and enhancement of the electric field near the interface. Several metals can sustain LSPRs, at different frequencies depending on their dielectric function. Noble metals such as silver and gold typically have LSPRs in the visible range, lending them bright colors such as those used in medieval stained glass.
Another early application of metal nanoparticles is in catalysis: nanoparticles have been recognized for nearly a century as more efficient and active than bulk counterparts, due not only to the increased surface-to-volume ratio but also to the availability of coordination sites rare or unavailable in large structures. Recently, the combination of plasmonics and catalysis has generated much interest, given the potential realization of controlled plasmon-enhanced catalysis,7 the nascent field of plasmon sensing of catalytic reactions,8,9 as well as the new reports on hot electron injection from plasmonic to catalytic structures.10-12 In this paper, we present a study of Au core Au/Pd shell nanoparticles, a promising multifunctional nanostructure offering a strong plasmonic response due to the Au core, in addition to a surface rich in Pd, a well-known catalytic metal. After a brief overview of current structures and techniques, the composition and crystallography of Au/Pd nanoparticles is discussed, followed by the detailed characterization of their plasmonic behavior with electron-energy loss spectroscopy (EELS) and cathodoluminescence (CL). The observation of strong plasmon resonances in particles coated with a poor plasmonic metal such as Pd suggest that the Au plasmon is only minimally damped, opening the door for multifunctional plasmonic-catalytic architectures.
1.1 Plasmonic nanostructures
Materials with a negative real and a small positive imaginary dielectric constant in a given wavelength range, such as quasi-free electron metals, Ag, Au, etc., can support surface plasmon resonances (SPRs) when submitted to electromagnetic
*[email protected], phone: 1-713-348-2582
Invited Paper
Plasmonics, edited by Xing Zhu, Satoshi Kawata, David J. Bergman, Proc. of SPIE Vol. 9278, 92780J © 2014 SPIE · CCC code: 0277-786X/14/$18 · doi: 10.1117/12.2073886
Proc. of SPIE Vol. 9278 92780J-1
Downloaded From: http://proceedings.spiedigitallibrary.org/ on 10/09/2015 Terms of Use: http://spiedigitallibrary.org/ss/TermsOfUse.aspx
radiation; in small particles SPR are trapped rather than propagating, and are referred to as localized surface plasmon resonances (LSPRs). The plasmonic response of a nanostructure can be described by its energy, its decay (the width of the resonance), the spatial distribution of the electric field, its polarization behavior, and its sensitivity to the surrounding environment. The latter is the basis of plasmon sensing, as a binding event at the surface of the particle results in a change in environment and induces an optically readable resonance frequency shift. The electric field distribution has a strong effect on the magnitude of the enhancement in surface enhanced spectroscopies,13-15 photoelectric emission,16 and likely plays a major role in hot electron generation.12 Understanding the electric field around a nanostructure is thus critical to understanding and optimizing nanostructures for applications relying on field enhancement, such as spectroscopic sensing and plasmonic catalysis.
1.2 Alloys and heterostructures in plasmonics
In plasmonics, as in many areas of nanoscience, controlling the nanoscale structure of materials provide an exquisite control over properties. Unlike the bulk, size and shape affect the (optical) properties of metals at the nanoscale: a large cube does not behave in the same fashion as a small cube, and assembling particles lead to complex mode hybridizing, for example.17,18 Advances in the field of synthesis and characterization has provided much insight about those effects for simple as well as increasingly complex structures. Novel multi-step reactions now also allow multicomponent and alloy materials, which are promising for multifunctional particles, bringing together properties including magnetism, catalytic activity, optical properties, and biocompatibility, to name a few.19-23 Such nanoparticles have interesting plasmonic responses from the simple nearly linear mixing of dielectric functions for Ag and Au alloys, to the strong enhancement of the Pd resonance in presence of Au.24-26 Studies of alloy systems are rather limited, however, and mostly rely on optical, far-field techniques inadequate for directly probing the field distribution and enhancement that is critical for plasmonic catalysis and surface-enhanced spectroscopies.
1.3 Electron beam studies of plasmonics
In order to study the field enhancement around plasmonic nanoparticles, it is critical to overcome the diffraction limit imposed by far-field optical spectroscopy techniques. Near-field probe spectroscopies and electron-based imaging have proven useful and have recently been used for a variety of systems.27-30 The emergence of improved electron monochromators and aberration correctors has furthered the applicability of electron-energy loss spectroscopy (EELS) to plasmonic systems. Two EELS approaches are available to probe the field intensity and distribution in supported plasmonic particles: energy-filtered transmission electron microscopy (EFTEM) generates a stack of images, each formed by electrons of a narrow energy loss range, while in scanning transmission electron microscopy-EELS (STEM-EELS), a full energy loss spectrum is acquired at each pixel by scanning a focused probe across a sample. These methods have advantages and disadvantages, discussed at length elsewhere.31 For complex plasmonic structures, one of the most prominent advantage of STEM-EELS over EFTEM is the ability to deconvolve overlapping plasmon modes, albeit potentially at the expense of spatial resolution. Electron beams can not only lose energy, they can also induce luminescence in plasmonic particles, a phenomenon called cathodoluminescence (CL). This technique has been used in scanning EM, and more recently in STEM for plasmonic studies.27,32,33 CL methods can be used to probe the total emission (panchromatic-CL) or the energy of emission (by using a spectrometer) due to this electron-plasmon interaction, providing information about the field distribution and plasmon energy.
2. MATERIALS AND METHODS
2.1 Nanoparticle synthesis
The seed-mediated, aqueous o-reduction synthesis was performed according to previously published protocols.34,35 In brief, Au seeds were synthesized from HAuCl4 reduction with NaBH4 in the presence of CTAB (cetyltrimethylammonium bromide). The seeds were grown into larger cubes and other structures by the room temperature reduction of HAuCl4 with ascorbic acid in the presence of CTAB, and finally to branched nanoparticles by the co-reduction of H2PdCl4 and HAuCl4
Proc. of SPIE Vol. 9278 92780J-2
Downloaded From: http://proceedings.spiedigitallibrary.org/ on 10/09/2015 Terms of Use: http://spiedigitallibrary.org/ss/TermsOfUse.aspx
by ascorbic acid in the presence of CTAB. This reaction was not yet optimized for single crystal growth, as was done later,19,36,37 such that several star-shaped structures were present.
2.2 Electron spectroscopy
Electron microscopy samples were prepared by drop-casting the Au/Pd nanoparticle solution onto 20 nm thick Si3N4 membrane grids (for all EELS studies, membranes), a silicon wafer (for composition and diffraction analysis) or onto carbon-coated formvar substrates (for cathodoluminescence studies). The micrographs reported in Fig. 1 were obtained in high-angle annular dark field (HAADF) mode on a FEI Tecnai F20 operated at 200 kV. The spectrum images, micrographs, and diffraction patterns reported in Fig. 2 were obtained from a focused ion beam (FIB) milled cross-section of a deposited sample covered with amorphous carbon and transferred to an cold FEG aberration corrected STEM operated at 200kV (FIB: Hitachi NB-5000, STEM: Hitachi HD-2700). STEM-EELS maps and HAADF images in Fig. 3-5 were obtained on a monochromated, probe-corrected FEI Titan3 XFEG equipped with a Gatan 865 Tridiem electron spectrometer, operated at 300 kV. The cathodoluminescence data presented in Fig. 6 was acquired with a Gatan Vulcan holder model 465.N, installed in a JEOL 2100F thermal FEG operated at 200 kV. Statistical analysis were performed in the open-source software HYPERSPY following established protocols.38
3. STRUCTURE AND COMPOSITION OF AU/PD NANOPARTICLES
3.1 Size and shape
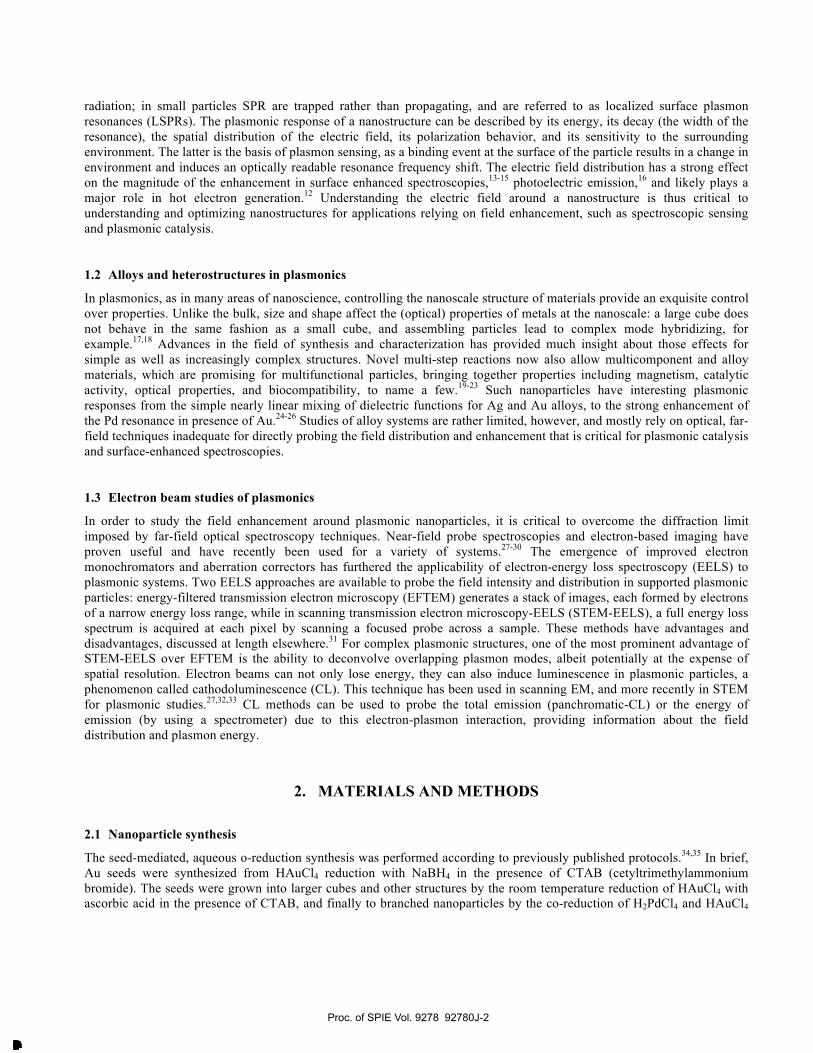
The reaction mixture obtained from a 3-step, seed-mediated synthesis contains mostly Au/Pd octopods, a cube-like structure featuring overgrowth of the eight corners due to the final co-reduction of Au and Pd onto Au cubes. Octopod side length ranges from 100 to 200 nm, as can be seen in Fig. 1. Other shapes are present, likely products of twinned rather than single crystal seeds; such shapes represent about 10% of the reaction products and are typically larger, from 150 to 350 nm.
Figure 1. STEM-HAADF images of Au/Pd octopods and stars. A) Elongated stars as well as small and large octopods. B) A distribution of octopods and larger branched structures. Scalebars, 100 nm.
3.2 Octopod crystallography and composition
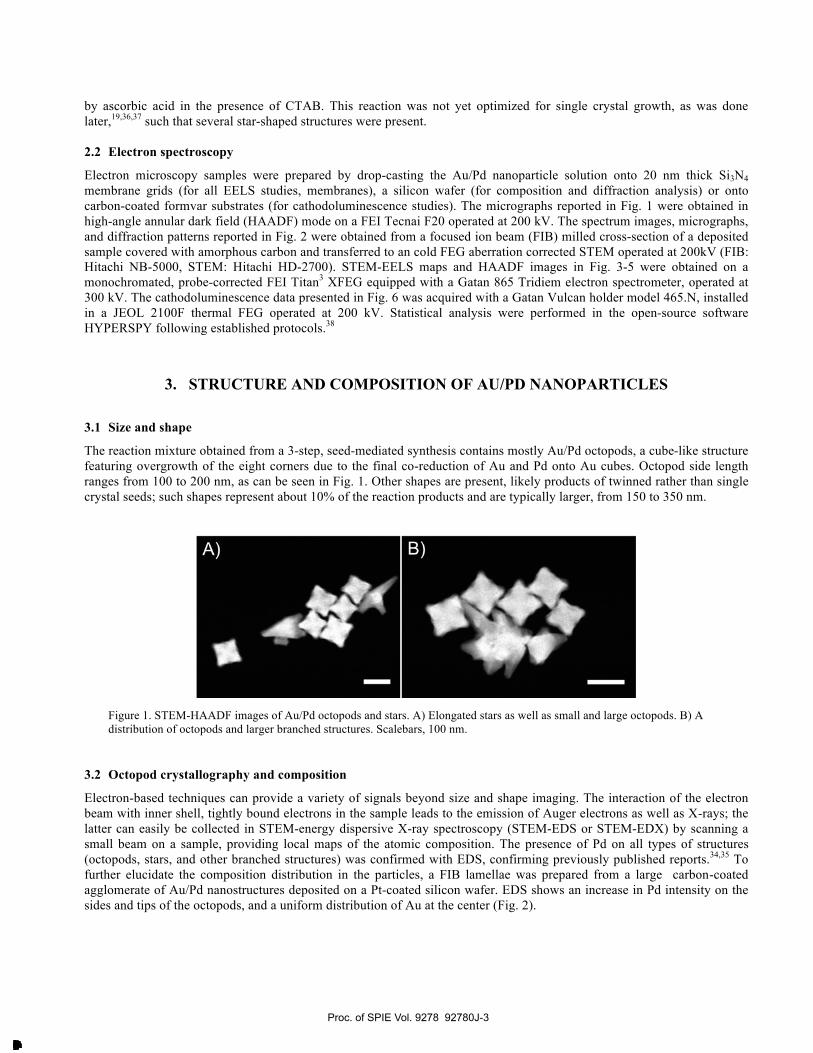
Electron-based techniques can provide a variety of signals beyond size and shape imaging. The interaction of the electron beam with inner shell, tightly bound electrons in the sample leads to the emission of Auger electrons as well as X-rays; the latter can easily be collected in STEM-energy dispersive X-ray spectroscopy (STEM-EDS or STEM-EDX) by scanning a small beam on a sample, providing local maps of the atomic composition. The presence of Pd on all types of structures (octopods, stars, and other branched structures) was confirmed with EDS, confirming previously published reports.34,35 To further elucidate the composition distribution in the particles, a FIB lamellae was prepared from a large carbon-coated agglomerate of Au/Pd nanostructures deposited on a Pt-coated silicon wafer. EDS shows an increase in Pd intensity on the sides and tips of the octopods, and a uniform distribution of Au at the center (Fig. 2).
Proc. of SPIE Vol. 9278 92780J-3
Downloaded From: http://proceedings.spiedigitallibrary.org/ on 10/09/2015 Terms of Use: http://spiedigitallibrary.org/ss/TermsOfUse.aspx
Figure 2. Structure and composition of Au/Pd octopods cut approximately in half with a focused ion beam (FIB). A) HAADF of the octopod and a neighboring star-shaped particle. B)-C) Au and Pd EDS maps; overlapping of the Pt and Au emission results in artifacts in the Au map due to the Pt adhesion layer deposited on the silicon wafer. D) Annular bright field image and diffraction mapping and showing constant crystallographic orientation, signature of a single crystal material, adapted from ref.39
Further, the crystallography of the octopod nanoparticle was investigated using electron diffraction mapping. Given the thickness (100-200 nm) of the nanostructures, the FIB lamellae provided easier to interpret results than from entire particles. When observed with the electron beam parallel to four of the cube-like facets, the diffraction patterns appears as a near-[100] orientation. More importantly, its orientation is constant through the sample, indicating that octopods are a single crystalline structure like their parent cubes.
4. PLASMONIC RESPONSE OF AU/PD NANOSTARS4.1 Mode distribution and energy obtained with electron-energy loss spectroscopy
The optical response of nanostars has generated much interest due to their high field enhancement and record refractive index sensitivity.40,41 Indeed, sharp tips concentrate the electric field generated by the light-driven electron oscillation, yielding smaller regions of intense fields when compared to a blunter object such as a sphere.42 The importance of unraveling the electric fields around the current particle is two-fold. First, we are interested in fundamental questions, in particular how do complex compositions, in this case an inhomogeneous, segregated Au/Pd, affect the electric field density and distribution in plasmonic particles. Second, Au/Pd particles are of much promise for catalysis, such that understanding the field distribution and the energy at which the fields are highest is critical for applications in light-driven catalysis. To this end, the plasmonic response of multiple nanostars was investigated, one of which is shown in detail here.
Proc. of SPIE Vol. 9278 92780J-4
Downloaded From: http://proceedings.spiedigitallibrary.org/ on 10/09/2015 Terms of Use: http://spiedigitallibrary.org/ss/TermsOfUse.aspx
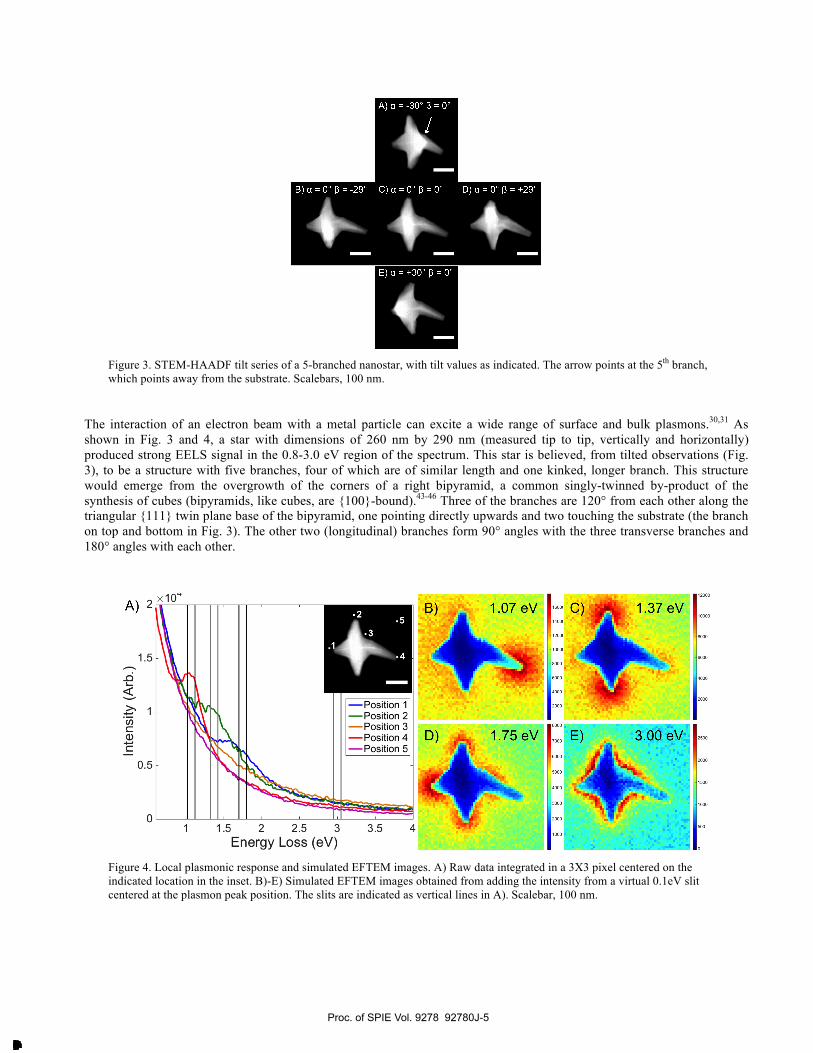
Figure 3. STEM-HAADF tilt series of a 5-branched nanostar, with tilt values as indicated. The arrow points at the 5th branch, which points away from the substrate. Scalebars, 100 nm.
The interaction of an electron beam with a metal particle can excite a wide range of surface and bulk plasmons.30,31 As shown in Fig. 3 and 4, a star with dimensions of 260 nm by 290 nm (measured tip to tip, vertically and horizontally) produced strong EELS signal in the 0.8-3.0 eV region of the spectrum. This star is believed, from tilted observations (Fig. 3), to be a structure with five branches, four of which are of similar length and one kinked, longer branch. This structure would emerge from the overgrowth of the corners of a right bipyramid, a common singly-twinned by-product of the synthesis of cubes (bipyramids, like cubes, are {100}-bound).43-46 Three of the branches are 120° from each other along the triangular {111} twin plane base of the bipyramid, one pointing directly upwards and two touching the substrate (the branch on top and bottom in Fig. 3). The other two (longitudinal) branches form 90° angles with the three transverse branches and 180° angles with each other.
Figure 4. Local plasmonic response and simulated EFTEM images. A) Raw data integrated in a 3X3 pixel centered on the indicated location in the inset. B)-E) Simulated EFTEM images obtained from adding the intensity from a virtual 0.1eV slit centered at the plasmon peak position. The slits are indicated as vertical lines in A). Scalebar, 100 nm.
Proc. of SPIE Vol. 9278 92780J-5
Downloaded From: http://proceedings.spiedigitallibrary.org/ on 10/09/2015 Terms of Use: http://spiedigitallibrary.org/ss/TermsOfUse.aspx
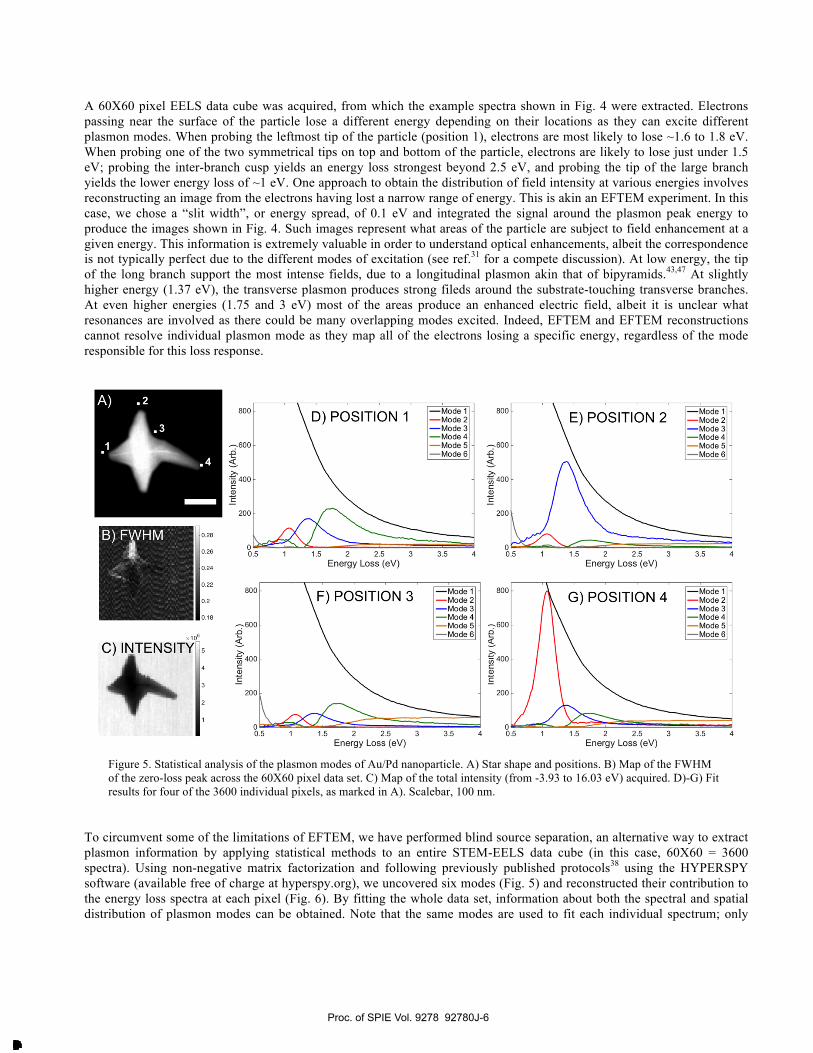
A 60X60 pixel EELS data cube was acquired, from which the example spectra shown in Fig. 4 were extracted. Electrons passing near the surface of the particle lose a different energy depending on their locations as they can excite different plasmon modes. When probing the leftmost tip of the particle (position 1), electrons are most likely to lose ~1.6 to 1.8 eV. When probing one of the two symmetrical tips on top and bottom of the particle, electrons are likely to lose just under 1.5 eV; probing the inter-branch cusp yields an energy loss strongest beyond 2.5 eV, and probing the tip of the large branch yields the lower energy loss of ~1 eV. One approach to obtain the distribution of field intensity at various energies involves reconstructing an image from the electrons having lost a narrow range of energy. This is akin an EFTEM experiment. In this case, we chose a “slit width”, or energy spread, of 0.1 eV and integrated the signal around the plasmon peak energy to produce the images shown in Fig. 4. Such images represent what areas of the particle are subject to field enhancement at a given energy. This information is extremely valuable in order to understand optical enhancements, albeit the correspondence is not typically perfect due to the different modes of excitation (see ref.31 for a compete discussion). At low energy, the tip of the long branch support the most intense fields, due to a longitudinal plasmon akin that of bipyramids.43,47 At slightly higher energy (1.37 eV), the transverse plasmon produces strong fileds around the substrate-touching transverse branches. At even higher energies (1.75 and 3 eV) most of the areas produce an enhanced electric field, albeit it is unclear what resonances are involved as there could be many overlapping modes excited. Indeed, EFTEM and EFTEM reconstructions cannot resolve individual plasmon mode as they map all of the electrons losing a specific energy, regardless of the mode responsible for this loss response.
Figure 5. Statistical analysis of the plasmon modes of Au/Pd nanoparticle. A) Star shape and positions. B) Map of the FWHM of the zero-loss peak across the 60X60 pixel data set. C) Map of the total intensity (from -3.93 to 16.03 eV) acquired. D)-G) Fit results for four of the 3600 individual pixels, as marked in A). Scalebar, 100 nm.
To circumvent some of the limitations of EFTEM, we have performed blind source separation, an alternative way to extract plasmon information by applying statistical methods to an entire STEM-EELS data cube (in this case, 60X60 = 3600 spectra). Using non-negative matrix factorization and following previously published protocols38 using the HYPERSPY software (available free of charge at hyperspy.org), we uncovered six modes (Fig. 5) and reconstructed their contribution to the energy loss spectra at each pixel (Fig. 6). By fitting the whole data set, information about both the spectral and spatial distribution of plasmon modes can be obtained. Note that the same modes are used to fit each individual spectrum; only
Proc. of SPIE Vol. 9278 92780J-6
Downloaded From: http://proceedings.spiedigitallibrary.org/ on 10/09/2015 Terms of Use: http://spiedigitallibrary.org/ss/TermsOfUse.aspx
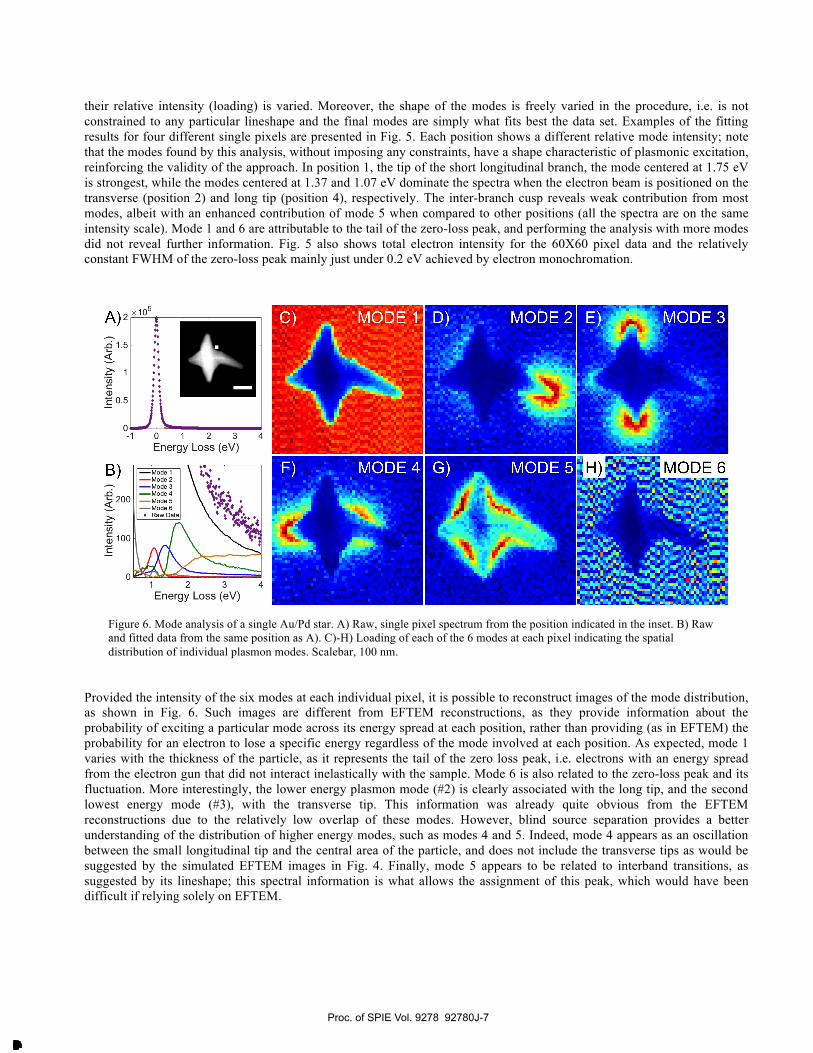
their relative intensity (loading) is varied. Moreover, the shape of the modes is freely varied in the procedure, i.e. is not constrained to any particular lineshape and the final modes are simply what fits best the data set. Examples of the fitting results for four different single pixels are presented in Fig. 5. Each position shows a different relative mode intensity; note that the modes found by this analysis, without imposing any constraints, have a shape characteristic of plasmonic excitation, reinforcing the validity of the approach. In position 1, the tip of the short longitudinal branch, the mode centered at 1.75 eV is strongest, while the modes centered at 1.37 and 1.07 eV dominate the spectra when the electron beam is positioned on the transverse (position 2) and long tip (position 4), respectively. The inter-branch cusp reveals weak contribution from most modes, albeit with an enhanced contribution of mode 5 when compared to other positions (all the spectra are on the same intensity scale). Mode 1 and 6 are attributable to the tail of the zero-loss peak, and performing the analysis with more modes did not reveal further information. Fig. 5 also shows total electron intensity for the 60X60 pixel data and the relatively constant FWHM of the zero-loss peak mainly just under 0.2 eV achieved by electron monochromation.
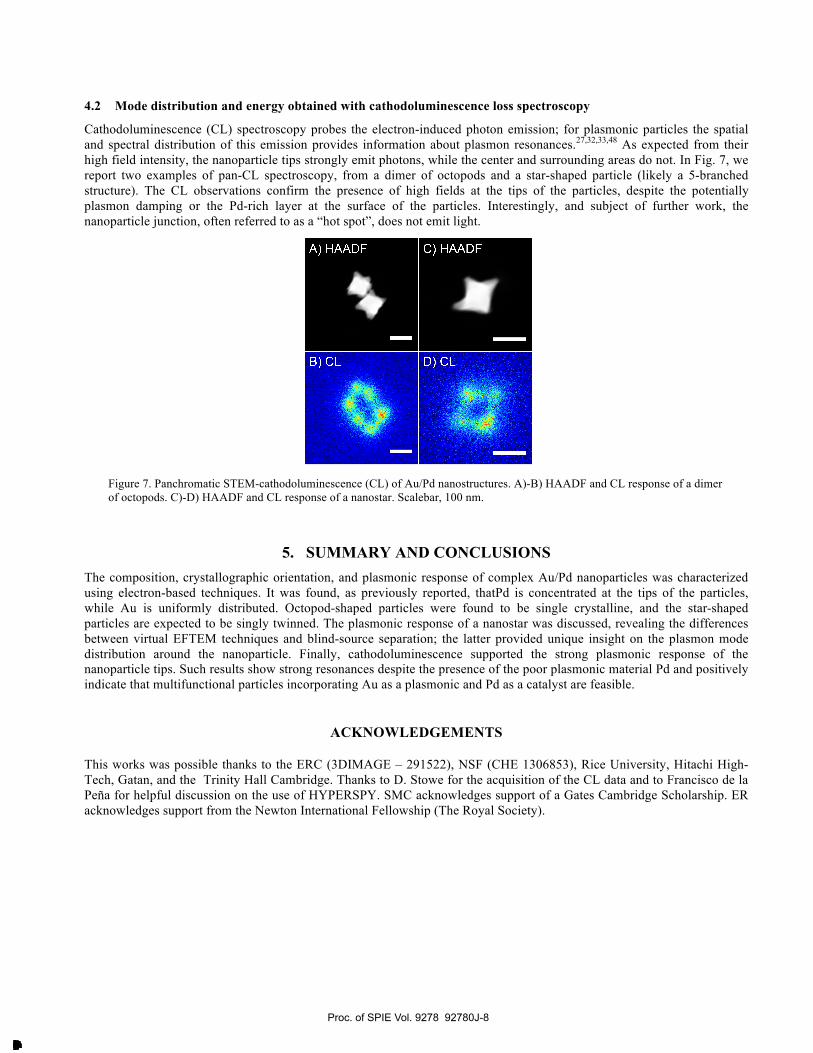
Figure 6. Mode analysis of a single Au/Pd star. A) Raw, single pixel spectrum from the position indicated in the inset. B) Raw and fitted data from the same position as A). C)-H) Loading of each of the 6 modes at each pixel indicating the spatial distribution of individual plasmon modes. Scalebar, 100 nm.
Provided the intensity of the six modes at each individual pixel, it is possible to reconstruct images of the mode distribution, as shown in Fig. 6. Such images are different from EFTEM reconstructions, as they provide information about the probability of exciting a particular mode across its energy spread at each position, rather than providing (as in EFTEM) the probability for an electron to lose a specific energy regardless of the mode involved at each position. As expected, mode 1 varies with the thickness of the particle, as it represents the tail of the zero loss peak, i.e. electrons with an energy spread from the electron gun that did not interact inelastically with the sample. Mode 6 is also related to the zero-loss peak and its fluctuation. More interestingly, the lower energy plasmon mode (#2) is clearly associated with the long tip, and the second lowest energy mode (#3), with the transverse tip. This information was already quite obvious from the EFTEM reconstructions due to the relatively low overlap of these modes. However, blind source separation provides a better understanding of the distribution of higher energy modes, such as modes 4 and 5. Indeed, mode 4 appears as an oscillation between the small longitudinal tip and the central area of the particle, and does not include the transverse tips as would be suggested by the simulated EFTEM images in Fig. 4. Finally, mode 5 appears to be related to interband transitions, as suggested by its lineshape; this spectral information is what allows the assignment of this peak, which would have been difficult if relying solely on EFTEM.
Proc. of SPIE Vol. 9278 92780J-7
Downloaded From: http://proceedings.spiedigitallibrary.org/ on 10/09/2015 Terms of Use: http://spiedigitallibrary.org/ss/TermsOfUse.aspx
4.2 Mode distribution and energy obtained with cathodoluminescence loss spectroscopy
Cathodoluminescence (CL) spectroscopy probes the electron-induced photon emission; for plasmonic particles the spatial and spectral distribution of this emission provides information about plasmon resonances.27,32,33,48 As expected from their high field intensity, the nanoparticle tips strongly emit photons, while the center and surrounding areas do not. In Fig. 7, we report two examples of pan-CL spectroscopy, from a dimer of octopods and a star-shaped particle (likely a 5-branched structure). The CL observations confirm the presence of high fields at the tips of the particles, despite the potentially plasmon damping or the Pd-rich layer at the surface of the particles. Interestingly, and subject of further work, the nanoparticle junction, often referred to as a “hot spot”, does not emit light.
Figure 7. Panchromatic STEM-cathodoluminescence (CL) of Au/Pd nanostructures. A)-B) HAADF and CL response of a dimer of octopods. C)-D) HAADF and CL response of a nanostar. Scalebar, 100 nm.
5. SUMMARY AND CONCLUSIONSThe composition, crystallographic orientation, and plasmonic response of complex Au/Pd nanoparticles was characterized using electron-based techniques. It was found, as previously reported, thatPd is concentrated at the tips of the particles, while Au is uniformly distributed. Octopod-shaped particles were found to be single crystalline, and the star-shaped particles are expected to be singly twinned. The plasmonic response of a nanostar was discussed, revealing the differences between virtual EFTEM techniques and blind-source separation; the latter provided unique insight on the plasmon mode distribution around the nanoparticle. Finally, cathodoluminescence supported the strong plasmonic response of the nanoparticle tips. Such results show strong resonances despite the presence of the poor plasmonic material Pd and positively indicate that multifunctional particles incorporating Au as a plasmonic and Pd as a catalyst are feasible.
ACKNOWLEDGEMENTS
This works was possible thanks to the ERC (3DIMAGE – 291522), NSF (CHE 1306853), Rice University, Hitachi High-Tech, Gatan, and the Trinity Hall Cambridge. Thanks to D. Stowe for the acquisition of the CL data and to Francisco de la Peña for helpful discussion on the use of HYPERSPY. SMC acknowledges support of a Gates Cambridge Scholarship. ER acknowledges support from the Newton International Fellowship (The Royal Society).
Proc. of SPIE Vol. 9278 92780J-8
Downloaded From: http://proceedings.spiedigitallibrary.org/ on 10/09/2015 Terms of Use: http://spiedigitallibrary.org/ss/TermsOfUse.aspx
REFERENCES
[1] Doane, T. L. and Burda, C. "The unique role of nanoparticles in nanomedicine: Imaging, drug delivery and therapy," Chem. Soc. Rev. 41, 2885-2911 (2012).
[2] Khlebtsov, N. G. and Dykman, L. A. "Optical properties and biomedical applications of plasmonic nanoparticles," J. Quant. Spectrosc. Ra. 111, 1-35 (2010).
[3] Mayer, K. M. and Hafner, J. H. "Localized surface plasmon resonance sensors," Chem. Rev. 111, 3828-3857 (2011).
[4] Sepúlveda, B., Angelomé, P. C., Lechuga, L. M. and Liz-Marzán, L. M. "Lspr-based nanobiosensors," Nano Today 4, 244-251 (2009).
[5] Anker, J. N., Hall, W. P., Lyandres, O., Shah, N. C., Zhao, J. and Van Duyne, R. P. "Biosensing with plasmonic nanosensors," Nat. Mater. 7, 442-453 (2008).
[6] Ozbay, E. "Plasmonics: Merging photonics and electronics at nanoscale dimensions," Science 311, 189-193 (2006). [7] Hou, W. and Cronin, S. B. "A review of surface plasmon resonance-enhanced photocatalysis," Adv. Funct. Mater.
23, 1612-1619 (2013). [8] Novo, C., Funston, A. M., Gooding, A. K. and Mulvaney, P. "Electrochemical charging of single gold nanorods,"
J. Am. Chem. Soc. 131, 14664-14666 (2009). [9] Larsson, E. M., Langhammer, C., Zorić, I. and Kasemo, B. "Nanoplasmonic probes of catalytic reactions," Science
326, 1091-1094 (2009). [10] Knight, M. W., Wang, Y., Urban, A. S., Sobhani, A., Zheng, B. Y., Nordlander, P. and Halas, N. J. "Embedding
plasmonic nanostructure diodes enhances hot electron emission," Nano Lett. 13, 1687-1692 (2013). [11] Lee, Y. K., Jung, C. H., Park, J., Seo, H., Somorjai, G. A. and Park, J. Y. "Surface plasmon-driven hot electron
flow probed with metal-semiconductor nanodiodes," Nano Lett. 11, 4251-4255 (2011). [12] Mukherjee, S., Libisch, F., Large, N., Neumann, O., Brown, L. V., Cheng, J., Lassiter, J. B., Carter, E. A.,
Nordlander, P. and Halas, N. J. "Hot electrons do the impossible: Plasmon-induced dissociation of h2 on au," Nano Lett. 13, 240-247 (2012).
[13] Stiles, P. L., Dieringer, J. A., Shah, N. C. and Van Duyne, R. P. "Surface-enhanced raman spectroscopy," Annu. Rev. Anal. Chem. 1, 601-626 (2008).
[14] Fort, E. and Grésillon, S. "Surface enhanced fluorescence," J. Phys. D: Appl. Phys. 41, 013001 (2008). [15] Brown, L. V., Zhao, K., King, N., Sobhani, H., Nordlander, P. and Halas, N. J. "Surface-enhanced infrared
absorption using individual cross antennas tailored to chemical moieties," J. Am. Chem. Soc. 135, 3688-3695 (2013).
[16] Grubisic, A., Ringe, E., Cobley, C., Xia, Y., Marks, L. D., Van Duyne, R. P. and Nesbitt, D. J. "Plasmonic near-electric field enhancement effects in ultrafast photoelectron emission: Correlated spatial and laser polarization microscopy studies of individual ag nanocubes," Nano Lett. 12, 4823-4829 (2012).
[17] Ringe, E., McMahon, J. M., Sohn, K., Cobley, C. M., Xia, Y., Huang, J., Schatz, G. C., Marks, L. D. and Van Duyne, R. P. "Unraveling the effects of size, composition, and substrate on the localized surface plasmon resonance frequencies of gold and silver nanocubes: A systematic single-particle approach," J. Phys. Chem. C 114, 12511-12516 (2010).
[18] Nordlander, P., Oubre, C., Prodan, E., Li, K. and Stockman, M. I. "Plasmon hybridization in nanoparticle dimers," Nano Lett. 4, 899-903 (2004).
[19] Motl, N. E., Smith, A. F., DeSantis, C. J. and Skrabalak, S. E. "Engineering plasmonic metal colloids through composition and structural design," Chem. Soc. Rev. 43, 3823-3834 (2014).
[20] X. Lu, M. Rycenga, S. E. Skrabalak, B. Wiley and Xia, Y. "Chemical synthesis of novel plasmonic nanoparticles," Ann. Rev. Phys. Chem. 60, 167-192 (2009).
[21] Gole, A. and Murphy, C. J. "Seed-mediated synthesis of gold nanorods: Role of the size and nature of the seed," Chem. Mater. 16, 3622-3640 (2004).
[22] Liu and Guyot-Sionnest, P. "Synthesis and optical characterization of au/ag core/shell nanorods," J. Phys. Chem. B 108, 5882-5888 (2004).
[23] Sun, Y. and Xia, Y. "Shape-controlled synthesis of gold and silver nanoparticles," Science 298, 2176-2179 (2002). [24] Shegai, T., Johansson, P., Langhammer, C. and Käll, M. "Directional scattering and hydrogen sensing by bimetallic
pd–au nanoantennas," Nano Lett. 12, 2464-2469 (2012).
Proc. of SPIE Vol. 9278 92780J-9
Downloaded From: http://proceedings.spiedigitallibrary.org/ on 10/09/2015 Terms of Use: http://spiedigitallibrary.org/ss/TermsOfUse.aspx
[25] Liu, N., Tang, M. L., Hentschel, M., Giessen, H. and Alivisatos, A. P. "Nanoantenna-enhanced gas sensing in a
single tailored nanofocus," Nat. Mater. 10, 631-636 (2011). [26] Link, S., Wang, Z. L. and El-Sayed, M. A. "Alloy formation of gold-silver nanoparticles and the dependence of the
plasmon absorption on their composition," J. Phys. Chem. B 103, 3529-3533 (1999). [27] Myroshnychenko, V., Nelayah, J., Adamo, G., Geuquet, N., Rodríguez-Fernández, J., Pastoriza-Santos, I.,
MacDonald, K. F., Henrard, L., Liz-Marzán, L. M., Zheludev, N. I., Kociak, M. and García de Abajo, F. J. "Plasmon spectroscopy and imaging of individual gold nanodecahedra: A combined optical microscopy, cathodoluminescence, and electron energy-loss spectroscopy study," Nano Lett. 12, 4172-4180 (2012).
[28] O. Nicoletti, M. Wubs, N. A. Mortensen, W. Sigle, P. A. van Aken and Midgley, P. A. "Surface plasmon modes of a single silver nanorod: An electron energy loss study," Opt. Express 19, 15371-15379 (2011).
[29] Hohenester, U., Ditlbacher, H. and Krenn, J. R. "Electron-energy-loss spectra of plasmonic nanoparticles," Phys. Rev. Lett. 103, 106801 (2009).
[30] García de Abajo, F. J. and Kociak, M. "Probing the photonic local density of states with electron energy loss spectroscopy," Phys. Rev. Lett. 100, 106804 (2008).
[31] García de Abajo, F. J. "Optical excitations in electron microscopy," Rev. Mod. Phys. 82, 209-275 (2010). [32] P. Chaturvedi, K. H. Hsu, A. Kumar, K. H. Fung, J. C. Mabon and Fang, N. X. "Imaging of plasmonic modes of
silver nanoparticles using high-resolution cathodoluminescence spectroscopy," ACS Nano 3, 1965-2974 (2009). [33] E. J. R. Vesseur, R. de Waele, M. Kuttge and Polman, A. "Direct observation of plasmonic modes in au nanowires
using high-resolution cathodoluminescence spectroscopy," Nano Lett. 7, 2843-2846 (2007). [34] DeSantis, C. J. and Skrabalak, S. E. "Size-controlled synthesis of au/pd octopods with high refractive index
sensitivity," Langmuir 28, 9055-9062 (2012). [35] DeSantis, C. J., Sue, A. C., Bower, M. M. and Skrabalak, S. E. "Seed-mediated co-reduction: A versatile route to
architecturally controlled bimetallic nanostructures," ACS Nano 6, 2617-2628 (2012). [36] DeSantis, C. J. and Skrabalak, S. E. "Manipulating the optical properties of symmetrically branched au/pd
nanocrystals through interior design," Chem. Comm. 50, 5367-5369 (2014). [37] DeSantis, C. J., Sue, A. C., Radmilovic, A., Liu, H., Losovyj, Y. B. and Skrabalak, S. E. "Shaping the synthesis
and assembly of symmetrically stellated au/pd nanocrystals with aromatic additives," Nano Lett. 14, 4145-4150 (2014).
[38] Nicoletti, O., de la Pena, F., Leary, R. K., Holland, D. J., Ducati, C. and Midgley, P. A. "Three-dimensional imaging of localized surface plasmon resonances of metal nanoparticles," Nature 502, 80-84 (2013).
[39] Ringe, E. "Nanocrystalline materials: Recent advances in crystallographic characterization techniques," IUCrJ 1, In Press (2014).
[40] Nehl, C. L., Liao, H. and Hafner, J. H. "Optical properties of star-shaped gold nanoparticles," Nano Lett. 6, 683-688 (2006).
[41] Guerrero-Martínez, A., Barbosa, S., Pastoriza-Santos, I. and Liz-Marzán, L. M. "Nanostars shine bright for you: Colloidal synthesis, properties and applications of branched metallic nanoparticles," Current Opin. Colloid In. 16, 118-127 (2011).
[42] Kelly, K. L., Coronado, E., Zhao, L. L. and Schatz, G. C. "The optical properties of metal nanoparticles: The influence of size, shape, and dielectric environment," J. Phys. Chem. B 107, 668-677 (2003).
[43] Zhang, J., Li, S., Wu, J., Schatz, G. C. and Mirkin, C. A. "Plasmon-mediated synthesis of silver triangular bipyramids," Angew. Chem. Int. Ed. 48, 8878-7791 (2009).
[44] Wiley, B. J., Xiong, Y., Li, Z.-Y., Yin, Y. and Xia, Y. "Right bipyramids of silver: A new shape derived from single twinned seeds," Nano Lett. 6, 765-768 (2006).
[45] DeSantis, C. J. and Skrabalak, S. E. "Core values: Elucidating the role of seed structure in the synthesis of symmetrically branched nanocrystals," Journal of the American Chemical Society 135, 10-13 (2012).
[46] Liu and Guyot-Sionnest, P. "Mechanism of silver(i)-assisted growth of gold nanorods and bipyramids," J. Phys. Chem. B 109, 22192-22200 (2005).
[47] Ringe, E., Zhang, J., Langille, M. R., Mirkin, C. A., Marks, L. D. and Duyne, R. P. V. "Correlating the structure and localized surface plasmon resonance of single right bipyramids," Nanotechnology 23, 444005 (2012).
[48] T. Coenen, E. J. R. Vesseur, A. Polman and Koenderink, A. F. "Directional emission from plasmonic yagi-uda antennas probed by angle-resolved cathodoluminescence spectroscopy," Nano Lett. 11, 3779-3784 (2011).
Proc. of SPIE Vol. 9278 92780J-10
Downloaded From: http://proceedings.spiedigitallibrary.org/ on 10/09/2015 Terms of Use: http://spiedigitallibrary.org/ss/TermsOfUse.aspx