Plasma charge sensor for monitoring keyhole plasma arc ...ymzhang/Papers/EffluxSensor.pdf ·...
21
Efflux Plasma Charge Sensor for Weld Joint Penetration in Keyhole Plasma Arc Welding S. B. Zhang and Y. M. Zhang Welding Research Laboratory Center for Robotics and Manufacturing Systems and Department of Electrical Engineering College of Engineering University of Kentucky Lexington, KY 40506 Abstract. An efflux plasma charge sensor is proposed to monitor weld joint penetration in keyhole plasma arc welding. For convenience of application, the sensor is integrated as part of the fixture. Based on experimental data, a linear model is fit to estimate the joint penetration from the output of the sensor. To understand the principle of the proposed sensor, the physical process associated with plasma jet and space charge is analyzed. Experiments have also been conducted to examine the potential of the proposed sensor in monitoring burn-through and keyhole collapse. Introduction Robustness, economy, and accuracy are among the major criteria to evaluate sensors for automated welding systems. Due to its robustness with respect to the harsh environment during arc welding and its great economy, through-the-arc sensing has found applications in arc length control and seam tracking (Refs. 1-6). It has also been used to analyze the oscillation of the weld pool for monitoring weld joint penetration in gas tungsten arc welding (GTAW) (Ref. 7) due to the relationship between the oscillation of the weld pool and its penetration. Keyhole plasma arc welding (PAW) is one of the primary arc welding processes for precision joining of critical metal components (Refs. 8-9). To ensure weld quality, the penetration must be monitored and controlled. It is known that the weld pool is subject to the impact of the high speed
Transcript of Plasma charge sensor for monitoring keyhole plasma arc ...ymzhang/Papers/EffluxSensor.pdf ·...

Efflux Plasma Charge Sensor for Weld JointPenetration in Keyhole Plasma Arc Welding
S. B. Zhang and Y. M. Zhang
Welding Research LaboratoryCenter for Robotics and Manufacturing Systems and
Department of Electrical EngineeringCollege of EngineeringUniversity of KentuckyLexington, KY 40506
Abstract. An efflux plasma charge sensor is proposed to monitor weld joint penetration in keyhole
plasma arc welding. For convenience of application, the sensor is integrated as part of the fixture.
Based on experimental data, a linear model is fit to estimate the joint penetration from the output of the
sensor. To understand the principle of the proposed sensor, the physical process associated with
plasma jet and space charge is analyzed. Experiments have also been conducted to examine the
potential of the proposed sensor in monitoring burn-through and keyhole collapse.
Introduction
Robustness, economy, and accuracy are among the major criteria to evaluate sensors for automated
welding systems. Due to its robustness with respect to the harsh environment during arc welding and
its great economy, through-the-arc sensing has found applications in arc length control and seam
tracking (Refs. 1-6). It has also been used to analyze the oscillation of the weld pool for monitoring
weld joint penetration in gas tungsten arc welding (GTAW) (Ref. 7) due to the relationship between
the oscillation of the weld pool and its penetration.
Keyhole plasma arc welding (PAW) is one of the primary arc welding processes for precision
joining of critical metal components (Refs. 8-9). To ensure weld quality, the penetration must be
monitored and controlled. It is known that the weld pool is subject to the impact of the high speed

plasma jet in keyhole PAW and that no studies have disclosed relationships, if any, between pool
oscillation and weld penetration. Hence, although utilization of the arc has great advantages in terms
of robustness and economy, highly desired by welding industry, through-the-arc methods have not
found applications in penetration control for keyhole PAW. If an arc based robust, economical
penetration sensor can be developed for keyhole PAW, its potential in application could be quite
positive.
During keyhole PAW, the plasma jet penetrates through the workpiece, forming a funnel-shape
cavity referred to as keyhole, as shown in Fig 1 (Ref. 10-11). To determine possible correlation
between penetration and plasma arc, characteristics associated with the keyhole should be taken
advantage of. In an early study, the light of the plasma efflux from the keyhole was measured for
maintaining the keyhole (Ref. 12). Another example involved detecting specific spectral lines of metal
vapor for keeping the keyhole through which the vapor of base metal escapes (Ref. 13). Recently, the
authors studied the possibility of using the diameter of the keyhole to monitor penetration (Ref. 14).
Experimental results showed that, after the keyhole is established, increasing/decreasing the welding
current/welding speed increases joint penetration until burn-through. Similarly, decreasing/increasing
the welding current/welding speed decreases the joint penetration until the keyhole collapses.
However, experiments also revealed that the diameter of the keyhole does not change with the heat
input which alters the joint penetration (Ref. 14) after the keyhole is established. This implies that the
existence of or the diameter of the keyhole does not provide sufficient information for monitoring joint
penetration.
This study aims at developing a penetration sensor, referred to as efflux plasma charge sensor
(EPCS), for keyhole PAW based on the residual of the energy of the plasma jet exiting from the
keyhole. This idea is understandable because, for a given material of base metal, the stronger the

residual energy is, the more energy the bottom of the workpiece should absorb from the plasma jet;
thus the wider the back-side width of the weld pool should be. For possible practical applications, the
sensor has been integrated as a part of the fixture. It is expected that the results of this study would
provide foundations to develop a cost effective, robust, and accurate sensor for joint penetration in
keyhole PAW.
Experimental Apparatus and Procedure
Keyhole mode is used in most PAW applications. Chill clamping and gas backup shown in Fig. 2
(Ref.11) provide an underside shield which is necessary for metals such as stainless steel, titanium.
For weld joints which require or allow gas backup, the proposed sensor can be applied with a minor
modification of the backing bar. Fig. 3 shows the proposed sensor built into the backing bar by using
an insulator, a capacitor, and a resistor. The insulator is used to prevent the voltage, caused by the
space charge of the plasma jet, from being short-circuited so that it can establish a voltage drop across
the resistor. The voltage drop serves as the output of the sensor. The capacitor, 0.01 Fµ in this study,
is used to form a filter with the resistor. A computer data acquisition with high input impedance of
measurement circuit and software program was used to sample the output voltage of the sensor.
Because the sensor measures the space charge generated by the efflux plasma jet, it is referred to an
efflux plasma charge sensor.
In the proposed method, the backup bar can be either moving or fixed. In this study, a fixed design
as shown in Fig. 4 was used. The distance between the workpiece and the detection plate, referred to
as measurement height h, was 1 inch (25.4 mm). Pure argon was used as shielding gas for both the
top-side and the back-side. To identify the model of the sensor, the resistance of the output resistor of
the sensor, eR , was adjustable. The output signal of the sensor was recorded by a data acquisition

system. The back-side width of the weld was measured off-line after experiment using a vision sensor
developed earlier (Ref. 15).
Bead-on-plate welds were made on stainless steel (304) plates using a constant current (CC)
inverter. The current ranged from 10 A to 200 A. The dimensions of the workpiece were 260×65×3.2
mm(10.2×2.55×0.125 in. ). Welding current and welding speed were changed in order to change the
joint penetration and the process mode (keyhole or non-keyhole). Other welding parameters shown in
Table 1 were constant during experiments.
Table 1 Constant Welding Parameters
Orifice diameter 1.57 mm (0.062 in.)Flow rate of plasma gas 1.4 L/min (3 /hft 3 )Flow rate of shielding gas 11.5 L/min (25 /hft 3 )Flow rate of backing gas 9.2 L/min (20 /hft 3 )Stand-off 6 mm (0.24 in.)
Results and Discussion
Penetration Prediction
Experiments have been conducted by using various welding currents and speeds to change the joint
penetration. Figs. 5 and 6 plot the experimental data. It can be seen that no matter the cause of
penetration change, whether varying the welding current or the welding speed, the output of the sensor
gives us a very good idea of the back-side width of the weld pool.
To further verify the correlation between joint penetration and sensor output, the experimental data
in Figs. 5 and 6 are plotted as , v we b pair in Fig. 7. It can be seen that if the sensor output is used to
predict the back-side width of the weld pool based on the following equation:
w v vb e e V V)= + ≤ ≤0 55 0 8 2 6 5. . ( . (1)

where ve and wb are measured by volt and mm respectively, the maximum error is approximately
±0 5. mm . Such an accuracy should be sufficient for weld penetration control in most applications.
Process Diagnosis
In addition to the joint penetration, the proposed sensor may also monitor the collapse of the
keyhole. Fig. 8 shows an experiment in which keyhole collapse occurred. During the initial period,
the output from the sensor was zero. The weld penetration corresponding to this period is partial.
When the current increased to 70A from 65 A, the sensor output rose to a significant level which
indicated the establishment of the keyhole. However, the back-side width of the weld pool then
decreased gradually due to process disturbances. At approximately t = 20s , the output of the sensor
suddenly oscillated between zero and 2 V. The keyhole oscillated between collapsing and opening.
When the current was increased to 75 A, the output of the sensor became stable and so did the keyhole.
At t s= 42 , the current was decreased to 65 A and the keyhole closed. The resultant output of the
sensor was zero. It can be seen that, when the keyhole closes, no plasma jet exits from the keyhole.
The output of the sensor is zero. Hence, the sensor output provides information to monitor the
existence of the keyhole.
Similarly, if burn-through occurs, a strong plasma jet will exit from the workpiece. The resultant
output of the sensor will be much higher than in a normal keyhole process. In the experiment shown in
Fig. 9, the welding speed was decreased from 2.7 mm/s to 0.8 mm/s at t s= 35 . Before the change, the
output of the sensor was approximately 3.5 V. After the change, the output of the sensor suddenly
increased to above 8 V. Burn-through occurred immediately. Hence, the output of the sensor provides
information to monitor the burn-through.
Sensor Fundamentals
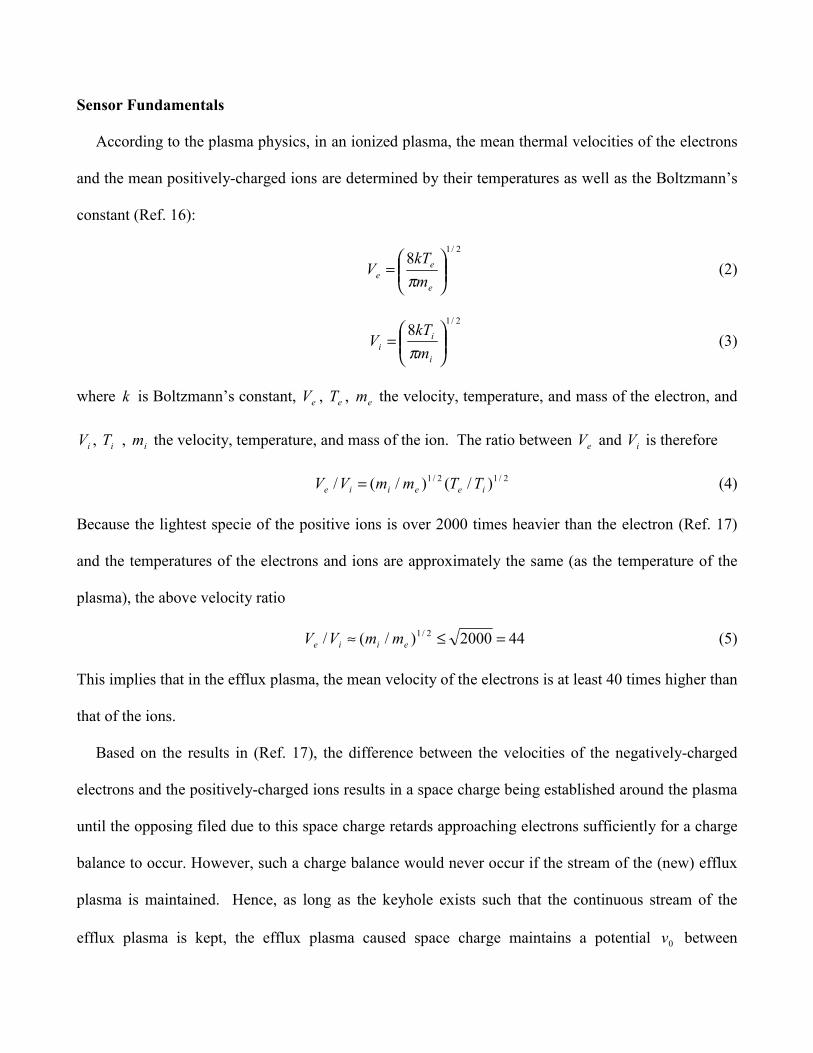
According to the plasma physics, in an ionized plasma, the mean thermal velocities of the electrons
and the mean positively-charged ions are determined by their temperatures as well as the Boltzmann’s
constant (Ref. 16):
2/18
=
e
ee m
kTV
π (2)
2/18
=
i
ii m
kTV
π (3)
where k is Boltzmann’s constant, eV , eT , em the velocity, temperature, and mass of the electron, and
iV , iT , im the velocity, temperature, and mass of the ion. The ratio between eV and iV is therefore
2/12/1 )/()/(/ ieeiie TTmmVV = (4)
Because the lightest specie of the positive ions is over 2000 times heavier than the electron (Ref. 17)
and the temperatures of the electrons and ions are approximately the same (as the temperature of the
plasma), the above velocity ratio
442000)/(/ 2/1 =≤≈ eiie mmVV (5)
This implies that in the efflux plasma, the mean velocity of the electrons is at least 40 times higher than
that of the ions.
Based on the results in (Ref. 17), the difference between the velocities of the negatively-charged
electrons and the positively-charged ions results in a space charge being established around the plasma
until the opposing filed due to this space charge retards approaching electrons sufficiently for a charge
balance to occur. However, such a charge balance would never occur if the stream of the (new) efflux
plasma is maintained. Hence, as long as the keyhole exists such that the continuous stream of the
efflux plasma is kept, the efflux plasma caused space charge maintains a potential 0v between

workpiece and detection plate. As derived in (Refs. 17, 18), such potential can be determined by the
following equation:
e
kTv p5.2
0 ≈ (6)
where e is the charge of the electron, and pT is the temperature of the efflux plasma.
In the equivalent circuit of the sensor shown in Fig. 10, a voltage source 0v and an interval resistor
0R are used to approximate the efflux plasma. The voltage drop on the output resistor eR , denoted as
ev , is measured as the output of the sensor. (Note that the potential of the detection plate is negative in
relation to the workpiece ground.) Disregarding the capacitor which is used to filter the noise, the
sensor’s model can be written as:
e
ee RR
Rvv
+=
0
0 (7)
In Eq. (7), eR is exactly known, ev is the measurement, and 0R and 0v are unknown. The following
qualitative analysis will show that 0v can be used as the critical parameter for determining joint
penetration.
The essence of the proposed method lies in a possible relationship between joint penetration,
measured by the back-side width of the weld pool, and the residual energy of the plasma jet, i.e. the
energy of the efflux plasma. In fact, for keyhole PAW, the width of the weld pool varies slightly along
the thickness direction of the workpiece. This suggests that the radial-axis heat transfer from the
plasma jet, rather than the heat transfer along the thickness direction, is dominant in the workpiece.
This implies that the width of the weld pool in a particular layer during keyhole PAW may be mainly
determined by the heat absorbed in this layer from the plasma jet. On the other hand, the heat transfer
rate, thus the heat absorption, in general increases when the local temperature gradient between the

heating source and the object being heated increases. When the temperature of the object being heated
is insignificant in comparison with the temperature of the heating source, the local temperature
gradient is determined by the temperature of the heating source. Hence, the residual energy of the
efflux plasma controls the local temperature gradient, thus the heat absorption and the width of the
weld pool, on the bottom layer of the workpiece. Such residual energy may be used to determine the
back-side width of the weld pool:
)( rb Qfw = (8)
where rQ denotes the residual thermal energy of the plasma jet. Further, the thermal energy of the
efflux plasma can be determined by its temperature (Ref. 19):
pkTQ ∝ (9)
On the other hand, the temperature determines the voltage of the space charge 0v equation (6). Hence,
)( 0vgwb = (10)
That is, the back-side width of the weld pool can be determined by the voltage of the space charge of
the efflux plasma. We should therefore determine 0v based on the measurement ev to monitor the
joint penetration.
Eq. (7) gives
ee
e vR
RRv
+= 00 (11)
It can be seen that in order to calculate 0v based on Eq. (11), 0R must be known. The electrical
resistivity of encounters between charged particles (Ref. 20) can be expressed as:
ohm/cmln
1053.62/3
3
pT
Λ×=η (12)

where Λln is a constant determined by the electron density of the plasma and the plasma temperature.
Because 0R is determined by both the measurement height h and the electrical resistivity η , 0R
varies with the temperature of the plasma.
To learn more about 0R , the authors have conducted experiments to determine it. Suppose two
measurements, )1(ev and )2(
ev , are available. If they are caused by the same 0v under the same 0R , but
two different eR ( )1(eR and )2(
eR ), we will have
+=
+=
)2(
)2(
)2(0
0
)1(
)1(
)1(0
0
e
e
e
e
e
e
vR
RRv
vR
RRv
(13)
It is evident that the two unknown parameters 0v and 0R can be exactly determined from equation
system (13). Hence, if we can accurately control the welding parameters and conditions to perform
keyhole plasma arc welding, we will be able to repeat the time-varying processes of 0v and 0R :
)( ..., ),2( ),1( 000 Nvvv and )( ..., ),2( ),1( 000 NRRR . When the time-varying processes of 0v and 0R are
repeated, we can use different eR ( )1(eR and )2(
eR ); thus the respective measurements will be
)( ..., ),2( ),1( )1()1()1( Nvvv eee and )( ..., ),2( ),1( )2()2()2( Nvvv eee :
v iR i R
Rv i
v iR i R
Rv i
i N
e
ee
e
ee
00
1)
1)1)
00
2
22
1 2
( )( )
( )
( )( )
( )
( , , ... , )
(
((
( )
( )( )
=+
=+
= (14)
Hence, each pair of ) ..., ,2 ,1( )( ),( 00 NiiRiv = can be determined from equation system (14).
Based on the above principle, two different eR s, 10 K and 350 K, were used to conduct experiments
using the exact the same conditions and sequence of welding parameters. The experimental data are

shown in Fig. 11. Fig. 12 plots the resultant )( ..., ),2( ),1( 000 Nvvv and )( ..., ),2( ),1( 000 NRRR . It can
be seen that 0R significantly varies with welding conditions and parameters.
The variation of 0R complicates the determination of v0 from the measurement ve . Fig. 12 shows
Ω≤≤Ω k80k10 0R . If we choose a very large R Re ≥ 0 ,
vR R
Rve
ee0
0≈+*
(15)
where Ω= k45*0R is an estimate of R0 . In this study, Ω= k 360eR , the maximum error is
± = ±35 360 10%/ . Hence, Ω= k 360eR can ensure that v0 be determined based on ve with an
acceptable accuracy. Because of this mapping relationship between v0 and ve , it is reasonable to
determine the weld penetration based on ve .
Conclusions
Efflux plasma charge sensor technology for joint penetration has been developed for the keyhole
plasma arc welding process. To understand the proposed sensor, efforts have been made to analyze the
sensing fundamentals. Experimental results showed that joint penetration can be monitored by the
proposed sensor with ±0 5. mm accuracy. The proposed sensor may also be used to monitor the
existence of the keyhole and the burn-through.
Acknowledgement
The authors thank Dr. Arthur B. Nunes, Jr. for his valuable suggestions.
References
1. Cook, G. E., 1983. "Robotic arc welding: research in sensory feedback control," IEEETransactions on Industrial Electronics, IE-30(3): 252-268.
2. Cook, G. E. and Wells, A. Michael, 1984. "Sidewall-matching adaptive control system forwelding," U. S. Patent # 4,477,713.

3. Richardson, R. W. 1986. "Robotic weld joint tracking systems – theory and implementationmethods," Welding Journal 65 (11): 43-51.
4. Hunright, J. 1986. "Robotic arc welding under adaptive control- a survey of current technology,"Welding Journal 65(11): 19-24.
5. Sugitani, Y. and Mao, W. 1996. "Automatic simultaneous control of bead height and back beadshape using an arc sensor in one-sided welding with a backing plate," Welding Research Abroad,42(12): 9-17.
6. Ohshima, K., etc., 1995. "Controlling of torch attitude and seam tracking using neuro arc sensor,"IECON Proceedings of the 1995 IEEE 21st International Conference on Industrial Electronics,Control, and Instrumentation, Part 2, pp. 1185-1189, Los Alamitos, CA.
7. Xiao, Y. H. and den Ouden, G., 1993. "Weld pool oscillation during GTA welding of mild steel,"Welding Journal, 72(8): 428s-434s.
8. Martikaimen, J. K. and Moiso, T. J. I., 1993. "Investigation of the effect of welding parameters onweld quality of plasma arc keyhole welding of structural steels," Welding Journal, 72(7): 329s-340s.
9. Nunes, A. C., Jr. and Bayless, E. O., 1984. "Variable polarity plasma arc welding on the spaceshuttle external tank," Welding Journal, 63(9): 27-35.
10. Russell, G. K. and Rubinsky, B., 1993. "Three-dimensional simulation of the plasma arc weldingprocess," International Journal of Heat and Mass Transfer, 36(13): 3283 - 3298.
11. O’Brien, R. L., 1991. Welding Handbook, Vol. 2, pp. 330-349. American Welding Society,Miami, FL.
12. Metcalfe, J. C. and Quigley, M. B. C., 1975. "Keyhole stability in plasma arc welding," WeldingJournal, 54 (11): 401s-404s.
13. Martinez, L. F., Marques, R. E., Mcclure, J. C. and Nunes, A. C., Jr., 1993. "Front side keyholedetection in aluminum alloys," Welding Journal, 72(5): 49-51.
14. Zhang, Y. M. and Zhang, S. B., 1999. "Observation of keyhole during plasma arc welding,"Welding Journal, 78(2): 53s-58s.
15. Zhang, Y. M. and Kovacevic, R. 1997. "Real-time sensing of sag geometry during GTA welding,"ASME Journal of Manufacturing Science and Engineering, 119(2): 151-160.
16. Lochte Holtgreven, W. 1968, Plasma Diagnostics, pp732-739, North Holland Publishing Company,New York.
17. Li, L., Brookfield, D. J., and Steen, W. M., 1996. "Plasma charge sensor for in-process, non-contact monitoring of the laser welding process," Measurement Science & Technology, 7(4): 615-626.
18. Finke, B. R., Kapadia, B. D., and Dowden, J. M., 1990. "A fundamental plasma based model forenergy transfer in laser material processing," Journal of Physics, Part D: Applied Physics, Vol. 23,pp. 643-654.
19. Hower, S., 1963. Plasma Physics and Magnetofluid-Mechanics, pp. 104-149. McGraw-Hill BookCompany, Inc., New York.
20. Spitzer, L., Jr., 1962. Physics of Fully Ionized Gas, pp. 136 -143. Interscience Publishers, NewYork.

Fig. 1 Keyhole in plasma arc welding.

Fig. 3 Integrated sensor and fixture.
Fig.2 Typical backing bar for keyhole plasma arcwelding [11].

Fig. 4 Schematic of clamping apparatus.

0
1
2
3
4
5
Welding current I
EPCS signal ve
65A75A70A
543414
EP
CS
out
put s
igna
l ve
(v)
and
wel
ding
cur
rent
I (
A)
Time (s)
0
1
2
3
4
14
wb
Bac
k-si
de w
idth
wb
(mm
)
Fig. 5 Penetration prediction (a) Sensor output and weldin(b) Back-side width of weld p(c) Weld back-side photo.
(a)
5434
Time (s)
(c
expeg cuool
(b)
)
riment 1. Travel speed: 2.5mm/s.rrent..

0
1
2
3
4
5
6
7
2.5mm/s 2.9mm/s
70A 75A
Welding current I
EPCS signal ve
543414
EP
CS
out
put
sig
nal v
e (v
)an
d w
eld
ing
cur
rent
I (
A)
Time (s)
0
1
2
3
4
5
543414
wb
Bac
k-si
de w
idth
wb
(mm
)
Time (s)
(a)
(b)
(c)
Fig. 6 Penetration prediction experiment 2.(a) Sensor output and welding parameters.(b) Back-side width of weld pool.(c) Weld back-side photo.

1 2 3 4 5 6 71
2
3
4
5
Bac
k-si
de w
idth
wb
(mm
)
EPCS output signal ve (v)
Fig. 7 Prediction of penetration.

0
1
2
3
4
5
No keyhole
Unstable keyhole
65A 70A 75A 65A
Welding currnet I
EPCS signal ve
604020
EP
CS
out
put s
igna
l ve
(v)
and
we
ldin
g c
urre
nt I (
A)
Time (s)
0 20 40 600
1
2
3
4
wb
Bac
k-si
de w
idth
wb
(mm
)
Time (s)
(a)
(b)
(c)
Fig. 8 Keyhole collapse monitoring. Travel speed:2.9mm/s.(a) Sensor output and welding current.(b) Back-side width of weld pool.(c) Weld back-side photo.

0
2
4
6
8
Burn-through
604020
Welding cureent I
65A70A 75A
EPCS signal ve
Travel speed 0.8mm/sTravel speed 2.7mm/s
EP
CS
out
put s
igna
l ve
(v)
and
we
ldin
g c
urre
nt I (
A)
Time (s)
Fig. 9 Burn-through monitoring.

0
1
2
3
4
5
6
7
15 604530
65A75A70A65A
ve (R
e: 10k)
ve (R
e: 350k)
EP
CS
out
put
sig
nal v
e (v
) an
d w
eld
ing
cure
nt I
(A
)
Time (s)
Fig. 11 Sensor output with different load resistors.
Fig. 10 Sensor equivalent circuit.

0
2
4
6
8v
0
65A75A70A
4236302418126
Sou
rce
volta
ge v
0 (v
) an
d w
eld
ing
curr
ent
I (A
)
Time (s)
(a) Source voltage.
0
20
40
60
80
100
4236302418126
R0
65A75A70A
Sou
rce
resi
stan
ce R
0 (k
) an
d w
eldi
ng c
urre
nt I (
A)
Time (s)
(b) Source resistance.
Fig. 12 Identified space charge voltage and source resistance.