Plant Protein-Based Nanocomposite Materials: Modification ...
187
University of Tennessee, Knoxville University of Tennessee, Knoxville TRACE: Tennessee Research and Creative TRACE: Tennessee Research and Creative Exchange Exchange Doctoral Dissertations Graduate School 5-2012 Plant Protein-Based Nanocomposite Materials: Modification of Plant Protein-Based Nanocomposite Materials: Modification of Layered Nanoclay by Surface Coating and Enhanced Interactions Layered Nanoclay by Surface Coating and Enhanced Interactions by Enzymatic and Chemical Cross-linking by Enzymatic and Chemical Cross-linking Minfeng Jin The University of Tennessee, Knoxville, [email protected] Follow this and additional works at: https://trace.tennessee.edu/utk_graddiss Part of the Food Chemistry Commons Recommended Citation Recommended Citation Jin, Minfeng, "Plant Protein-Based Nanocomposite Materials: Modification of Layered Nanoclay by Surface Coating and Enhanced Interactions by Enzymatic and Chemical Cross-linking. " PhD diss., University of Tennessee, 2012. https://trace.tennessee.edu/utk_graddiss/1312 This Dissertation is brought to you for free and open access by the Graduate School at TRACE: Tennessee Research and Creative Exchange. It has been accepted for inclusion in Doctoral Dissertations by an authorized administrator of TRACE: Tennessee Research and Creative Exchange. For more information, please contact [email protected].
Transcript of Plant Protein-Based Nanocomposite Materials: Modification ...
University of Tennessee, Knoxville University of Tennessee, Knoxville
TRACE: Tennessee Research and Creative TRACE: Tennessee Research and Creative
Exchange Exchange
Doctoral Dissertations Graduate School
5-2012
Plant Protein-Based Nanocomposite Materials: Modification of Plant Protein-Based Nanocomposite Materials: Modification of
Layered Nanoclay by Surface Coating and Enhanced Interactions Layered Nanoclay by Surface Coating and Enhanced Interactions
by Enzymatic and Chemical Cross-linking by Enzymatic and Chemical Cross-linking
Minfeng Jin The University of Tennessee, Knoxville, [email protected]
Follow this and additional works at: https://trace.tennessee.edu/utk_graddiss
Part of the Food Chemistry Commons
Recommended Citation Recommended Citation Jin, Minfeng, "Plant Protein-Based Nanocomposite Materials: Modification of Layered Nanoclay by Surface Coating and Enhanced Interactions by Enzymatic and Chemical Cross-linking. " PhD diss., University of Tennessee, 2012. https://trace.tennessee.edu/utk_graddiss/1312
This Dissertation is brought to you for free and open access by the Graduate School at TRACE: Tennessee Research and Creative Exchange. It has been accepted for inclusion in Doctoral Dissertations by an authorized administrator of TRACE: Tennessee Research and Creative Exchange. For more information, please contact [email protected].

To the Graduate Council:
I am submitting herewith a dissertation written by Minfeng Jin entitled "Plant Protein-Based
Nanocomposite Materials: Modification of Layered Nanoclay by Surface Coating and Enhanced
Interactions by Enzymatic and Chemical Cross-linking." I have examined the final electronic copy
of this dissertation for form and content and recommend that it be accepted in partial
fulfillment of the requirements for the degree of Doctor of Philosophy, with a major in Food
Science and Technology.
Qixin Zhong, Major Professor
We have read this dissertation and recommend its acceptance:
Federico Harte, Svetlana Zivanovic, Bin Zhao
Accepted for the Council:
Carolyn R. Hodges
Vice Provost and Dean of the Graduate School
(Original signatures are on file with official student records.)

To the Graduate Council: I am submitting herewith a dissertation written by Minfeng Jin entitled “Plant Protein-Based Nanocomposite Materials: Exfoliation of Layered Nanoclay by Surface Coating and Enhanced Interactions by Enzymatic and Chemical Cross-linking.” I have examined the final electronic copy of this dissertation for form and content and recommend that it be accepted in partial fulfillment of the requirements for the degree of Doctor of Philosophy, with a major in Food Science and Technology. Qixin Zhong, Major Professor
We have read this dissertation and recommend its acceptance: Federico Harte Svetlana Zivanovic Bin Zhao
Accepted for the Council:
Carolyn R. Hodges Vice Provost and Dean of Graduate School
Plant Protein-Based Nanocomposite Materials: Exfoliation of Layered Nanoclay by Surface Coating and
Enhanced Interactions by Enzymatic and Chemical Cross-linking
A Dissertation Presented for the Doctor of Philosophy
Degree The University of Tennessee, Knoxville
Minfeng Jin May 2012
ii
Copyright © 2012 by Minfeng Jin All rights reserved.

iii
Dedication
I would like to dedicate this dissertation to my mother, Jinfang Shen, and my sister
Weihong Jin and her family, my relatives and my friends, and especially in loving memory of
my dearest father, Mingzu Jin, for always believing in me, inspiring me, supporting me and
encouraging me to pursue my goals.

iv
Acknowledgements
I would like to thank all the support and people who helped me in my pursuit of this
Doctor of Philosophy Degree in Food Science and Technology. I would like to thank Dr. Qixin
Zhong for kindly funding me for three years and patiently guiding me throughout the whole
project as my advisor. I would also like to thank my committee members, Drs. Federico Harte,
Svetlana Zivanovic, and Bin Zhao for enthusiastically encouraging, generously supporting, and
always being ready to help my project and studies; thank you so much for showing me different
ways of critical thinking as scientists in my qualifying oral exams.
I appreciate the entire faculty and graduate students in our department, which is “small”
enough to make it like close family. You are not only my instructors, co-workers or labmates,
but also my wonderful friends here. Thank you Ray for making me stay here for another three
and a half years in such a great place, thanks to Sutida and Bhavini for cheering each other up in
the lab, thank you to Dr. Shinya for revising my dissertation, and thanks to my cute roommate
Stella as well as so many names who have already left UTK, Zhixiong Hu, Ye Liu, Jiajie Li,
Shan Xu, who kidnapped me to the Smokey Mountain from my depression, etc., and so many
faces who are still here around and share your moments with me.
And a special thank to all the students, postdocs and professors, who helped me with this
project. From this project, I hereby understand doctoral study is not only an intelligent work but
also a physical work, which really needs great muscles to finish so many “missions impossible”
for me, such as pressing the KBr pellets to be translucent, as well as other physically hard work.
Thank all the guys who ever helped me and showed me your strong muscles. In other aspects,
here named are Drs. Juan Luis Jurat-Fuentes and Cristopher Jon Oppert, and Dr. Carl Sams and

v
his student from Plant Science Department, who helped me with Two-dimensional Gel
Electrophoresis and Na+ ion concentration determination, Dr. Joseph E. Spruiell from
Department of Materials Science and Engineering for the training and permission on my
operation of the instrument – XRD, Dr. Jimmy Mays from Chemistry Department for generous
permission for me to use the freeze-dryer in his laboratory when ours was down for an entire
year, and Dr. John Dunlap for all the information and trials on TEM. Without all their help, I
couldn’t finish just by myself. Also I want to thank all my Chinese friends throughout the UTK,
who offered me plenty of information about everything, e.g. life information and research
equipments, etc. Special appreciations to Lu Wang and Xiaojun for helping me a lot on
equipment hunting, and Ximin for the rebooting of my computers from time by time. And I
appreciate all other colleagues and lab members who were always there and ready to help me.
Your suggestions and help were invaluable in completing this task.
Finally, I would like to thank my family and relatives for always caring about me, giving
me freedom to pursue my interested life and supporting me without doubt when I need them.

vi
Abstract
Highly intercalated or exfoliated nanoclay montmorillonite (MMT) has promises to
improve mechanical and barrier properties of nanocomposite materials that may be further
improved by strengthening interactions between matrix polymers and nanofillers. In this work,
water-soluble proteins extracted from hominy feed and soy flour were utilized to modify the
structures of MMT layers by surface-coating. Following coating at 60 C using different
MMT:protein mass ratios (49:1-2:1) and pH (2.0-10.0), the nanoclay was triple-washed for zeta
potential analysis and lyophilized for X-ray diffraction and Fourier transform infrared
spectroscopy analyses. Results showed that protein adsorption on MMT occurred at all pH
conditions by coulumbic and/or non-coulumbic forces. With a sufficient amount of protein,
highly intercalated or fully exfoliated MMT structures were achieved. MMT coated by soy
protein was incorporated in soy protein dispersions for enzymatic and chemical cross-linking.
Dynamic rheological tests were applied as a non-destructive method to illustrate the gel network
formation and the interactions between protein-coated MMT and matrix proteins. Variables in
enzymatic cross-linking included concentrations of NaCl and microbial transglutaminase
(mTGase), and the absence or presence of protein-coated-MMT at pH 6.5. Without MMT, the
maximum storage modulus was achieved at 100 mM NaCl and stronger gels with shorter gelling
times were observed at higher mTGase concentrations. Conversely, the incorporation of coated-
MMT inhibited the effect of ionic strength on soy protein gelation, and further shortened the
gelation time and increased synergistic development of storage modulus with the combined
treatments of 100 mM NaCl and mTGase. For chemical cross-linking, glutaradehyde was used as
a cross-linker and studied for the impacts of pH, temperature and cross-linker concentration on
vii
dynamic rheological properties. Without MMT, storage moduli gradually increased with
increasing glutaradehyde concentration; while the increase of storage modulus was in a higher
order of magnitude in the presence of MMT. The practical approach and established parameters
from this work can be used to manufacture nanocomposite materials with improved properties.
viii
TABLE OF CONTENTS
Chapter 1 . Introduction........................................................................................1
1.1. Food Packaging and Plastics................................................................................................ 2
1.2. Progresses, Opportunities and Challenges of Food Packaging Materials Based on
Natrually-occurring Bio-Polymers.............................................................................................. 3
1.3. Scope of the Work ............................................................................................................... 6
List of References ....................................................................................................................... 8
Chapter 2 . Literature Review ............................................................................ 11
2.1. Recent Research of Biodegradable Sillicate Nanocomposite in Protein-based Food
Packaging.................................................................................................................................. 12
2.1.1. Soy Protein-based Packaging Materials ................................................................ 13
2.1.2. Nanotechnology and Soy Protein-Based Nanocomposites ..................................... 16
2.1.3. Nanocomposites Based on MMT ............................................................................ 17
2.1.4. Soy Protein-Based Nanocomposite......................................................................... 19
2.2. Crosslinking as A Potential Method to Enhance the Properties of Protein-Based
Nanocomposites........................................................................................................................ 20
2.2.1. Chemical Crosslinking............................................................................................ 21
2.2.2. Enzymatic Crosslinking .......................................................................................... 22
2.3. Conclusions and Outlook................................................................................................... 24
List of References ..................................................................................................................... 25
Appendix................................................................................................................................... 34
Chapter 3 . Surface-Coating of Montmorillonite Nanoclays by Water Soluble
Proteins Extracted from Hominy Feed ..............................................................41
3.1. Abstract .............................................................................................................................. 42
3.2. Introduction........................................................................................................................ 43
3.3. Materials and Methods....................................................................................................... 45
3.3.1. Materials ................................................................................................................. 45
3.3.2. Extraction of Water Soluble Hominy Protein ......................................................... 45
3.3.3. Characterization of Hominy Protein by Two-dimensional Gel Electrophoresis (2D-
GE).................................................................................................................................... 47

ix
3.3.4. Determination of Protein Solubility........................................................................ 48
3.3.5. Surface Coating of MMT ........................................................................................ 48
3.3.6. Determination of Amount of Protein Coated on MMT ........................................... 49
3.3.7. Zeta Potential of MMT............................................................................................ 49
3.3.8. Wide-angle X-Ray Diffraction (WXRD).................................................................. 50
3.3.9. Fourier Transform Infrared Spectroscopy (FTIR) ................................................. 50
3.3.10. Statistical Data Analysis ....................................................................................... 51
3.4. Results And Discussion ..................................................................................................... 51
3.4.1. Protein Extracted from Hominy Feed..................................................................... 51
3.4.2. Coating of MMT at pH 2.0 Using Proteins Precipitated at Different pH Conditions
........................................................................................................................................... 52
3.4.2.1. XRD patterns........................................................................................................ 52
3.4.2.2. FTIR ..................................................................................................................... 53
3.4.3. Effect of MMT:protein Mass Ratio on Surface-coating at pH 2.0.......................... 55
3.4.4. Effect of pH on Surface Coating ............................................................................. 56
3.4.4.1. Effect of pH on the structure of bare MMT.......................................................... 56
3.4.4.2. Structure of protein-coated MMT at different pH conditions.............................. 56
3.5. Conclusion ......................................................................................................................... 58
List of References ..................................................................................................................... 60
Appendix................................................................................................................................... 64
Chapter 4 . Structure Modification of Montmorillonite Nanoclays by Surface-
Coating with Soy Protein.....................................................................................76
4.1. Abstract .............................................................................................................................. 77
4.2. Introduction........................................................................................................................ 78
4.3. Materials and Methods....................................................................................................... 80
4.3.1. Materials ................................................................................................................. 80
4.3.2. Extraction of Soy Protein........................................................................................ 80
4.3.3. Surface Coating of MMT ........................................................................................ 81
4.3.4. Determination of Amount of Protein Coated on MMT ........................................... 82
4.3.5. Determination of Protein Solubility........................................................................ 83
x
4.3.6. Zeta Potential.......................................................................................................... 83
4.3.7. Wide-angle X-ray Diffraction (WXRD) .................................................................. 83
4.3.8. Fourier Transform Infrared Spectroscopy (FTIR) ................................................. 84
4.3.9. Statistical Analyses ................................................................................................. 84
4.4. Results and discussion ....................................................................................................... 85
4.4.1. Structures of MMT Coated by SPP at Different pH Conditions............................. 85
4.4.1.1. XRD...................................................................................................................... 85
4.4.1.2. FTIR ..................................................................................................................... 86
4.4.1.3. Total protein coated on MMT.............................................................................. 87
4.4.1.4. Zeta potential ....................................................................................................... 88
4.4.2. Effect of MMT:SPP Mass Ratio on MMT Structure Coated by SPP at pH 9.0...... 89
4.5. Conclusion ......................................................................................................................... 90
List of References ..................................................................................................................... 92
Appendix................................................................................................................................... 97
Chapter 5 . Transglutaminase Cross-linking of Soy Protein in the Continuous
Phase and on Intercalated Montmorillonite Nanoclay Probed by Dynamic
Rheology ............................................................................................................. 108
5.1. Abstract ............................................................................................................................ 109
5.2. Introduction...................................................................................................................... 110
5.3. Materials and Methods..................................................................................................... 112
5.3.1. Materials ............................................................................................................... 112
5.3.2. Extraction of SP .................................................................................................... 112
5.3.3. Determination of Total Protein Content of SPI .................................................... 113
5.3.4. Preparation of Protein-coated MMT.................................................................... 113
5.3.5. Determination of mTGase Activity........................................................................ 114
5.3.6. Dynamic Rheological Tests................................................................................... 114
5.3.6.1. Sample preparation............................................................................................ 114
5.3.6.2. Rheological tests ................................................................................................ 115
5.4. Results and Discussion .................................................................................................... 115
xi
5.4.1. Representative Rheological Profiles Showing Impacts of NaCl, MMT, and mTGase
......................................................................................................................................... 115
5.4.2. Effects of Ionic Strength and MMT on Rheological Properties of SPI Dispersions
without mTGase Cross-linking ....................................................................................... 118
5.4.3. Rheological Properties of SPI Dispersions Cross-linked by mTGase at 0 mM NaCl
......................................................................................................................................... 120
5.4.4. Rheological Properties of SPI Dispersions Cross-linked by mTGase at 100 mM
NaCl ................................................................................................................................ 121
5.4.5. Rheological Interpretation of Hydrogel Network Impacted by MMT .................. 122
5.5. Conclusion ....................................................................................................................... 123
List of References ................................................................................................................... 124
Appendix................................................................................................................................. 129
Chapter 6 . Effects of Glutaraldehyde Concentration, pH and Temperature on
Rheological Properties of Nanocomposites Consisting of Intercalated
Montmorillonite Dispersed in Soy Protein Matrix.......................................... 140
6.1. Abstract ............................................................................................................................ 141
6.2. Introduction...................................................................................................................... 142
6.3. Materials and Methods..................................................................................................... 144
6.3.1. Materials ............................................................................................................... 144
6.3.2. Extraction of Soy Protein...................................................................................... 145
6.3.3. Preparation of Protein-coated MMT.................................................................... 146
6.3.4. Sample Preparation for Rheological Measurement ............................................. 146
6.3.5. Dynamic Rheological Analyses............................................................................. 146
6.4. Results and Discussion .................................................................................................... 147
6.4.1. Effects of Glutaraldehyde Concentration and MMT ............................................ 147
6.4.2. Effects of pH and MMT......................................................................................... 149
6.4.3. Effects of Temperature and MMT......................................................................... 150
6.5. Conclusion ....................................................................................................................... 152
List of References ................................................................................................................... 154
Appendix................................................................................................................................. 159

xii
Chapter 7 . Conclusions and Future Work...................................................... 164
VITA....................................................................................................................................... 167
xiii
LIST OF TABLES Table 2. 1 Examples of biopolymer films and their barrier and mechanical properties. ............. 34
Table 2. 2 Functional properties performed by soy protein preparations in actual food systems.35
Table 2. 3 Approximate amounts and molecular weights of components of soybean protein
fractions......................................................................................................................................... 36
Table 3. 1 Basal spacing of MMT coated with protein at MMT:protein mass ratios of 9:1, 4:1
and 2:1 at pH 2.0........................................................................................................................... 64
Table 3. 2 Basal spacing of MMT coated with hominy protein precipitated at pH 5.5 at an
MMT:protein mass ratio of 3:1 and pH 2.0-10.0.......................................................................... 64
Table 3. 3 Impact of pH on hominy protein solubility and coating on MMT1. ........................... 65
Table 4. 1. Basal spacing of MMT after coating by soy protein at an MMT:soy protein powder
mass ratio of 4:1 and pH 2.0-10.0................................................................................................. 97
Table 4. 2. Impact of pH on soy protein solubility and binding onto MMT at an MMT:soy
protein powder mass ratio of 4:1. ................................................................................................. 98
Table 4. 3. XRD characteristics of MMT coated by soy protein at pH 9.0 using different
MMT:soy protein powder (SPP) mass ratios, with comparison to simple mixtures of MMT and
SPP................................................................................................................................................ 99

xiv
LIST OF FIGURES Figure 2. 1. Structure of montmorillonite clay............................................................................. 37
Figure 2. 2. Types of composites derived from interaction between clays and polymers: (a)
phase-separated microcomposite; (b) intercalated nanocomposite and (c) exfoliated
nanocomposite. ............................................................................................................................. 38
Figure 2. 3. List of chemicals containing aldehyde group. .......................................................... 39
Figure 2. 4. A schematic of cross-linking reaction between proteins in enzyme crosslinking
induced by TGase. ........................................................................................................................ 40
Figure 3. 1. Two-dimension gel electrophoresis analysis of hominy protein precipitated at (A)
pH 6.0, (B) pH 5.5, and (C) pH 4.3. ............................................................................................. 66
Figure 3. 2. XRD patterns of protein extracts precipitated at pH 4.3 (PP4.3), 5.5 (PP5.5) and 6.0
(PP6.0). ......................................................................................................................................... 67
Figure 3. 3. XRD patterns of pristine MMT (black) after coating by hominy protein precipitated
at pH 4.3 (MP-4.3, red), 5.5 (MP-5.5, blue) and 6.0 (MP-6.0, green). Coating was conducted at
pH 2.0 and an MMT:protein powder mass ratio of 2:1. ............................................................... 68
Figure 3. 4. XRD patterns of simple mixtures with different mass ratios of pristine MMT and
lyophilized powder of hominy protein precipitated at (A) pH 4.3 and (B) pH 5.5. ..................... 69
Figure 3. 5. Comparison of FTIR spectra of pristine MMT (blue), protein (purple), and protein-
coated MMT (red). Coating was perormed at pH 2.0 and an MMT:protein powder mass ratio of
2:1 using proteins precipitated at pH (A) 4.3, (B) 5.5 and (C) 6.0. Arrows are used to highlight
the peaks discussed in the text. ..................................................................................................... 70
Figure 3. 6. XRD patterns of MMT coated by hominy protein precipitated at pH (A) 4.3 (PP4.3)
and (B) 5.5 (PP5.5). Coating was perfomed at pH 2.0 and MMT:protein mass ratios of 9:1
(green), 4:1 (blue) and 2:1 (red). Data in Figure 3 (at a ratio of 2:1) are repeated here for
convenience of comparison........................................................................................................... 71
Figure 3. 7. XRD patterns of MMT powder freeze-dried from MMT suspensions in 10 mM
NaH2PO4 buffer adjusted to pH 3.0, 5.0, 7.0, and 9.0 and mixed at 60C for 3 h. 2θ =7.11. D-
spacing = 1.24 nm. ........................................................................................................................ 72
xv
Figure 3. 8. XRD patterns of MMT coated with hominy protein at varied pH conditions: (A) pH
2.0-4.0, (B) pH 5.0-7.0, and (C) pH 8.0-10.0 with an MMT:protein mass ratio of 3:1 using
hominy protein precipitated at pH 5.5. ......................................................................................... 73
Figure 3. 9. FTIR spectra of MMT coated by hominy protein precipitated at pH 5.5. Coating was
perfomed at an MMT:protein mass ratio of 3:1 and (A) pH 2.0 (blue), 3.0 (purple), and 4.0 (red),
(B) pH 5.0 (blue), 6.0 (purple), and 7.0 (red) and (C) pH 8.0 (blue), 9.0 (purple), and 10.0 (red).
....................................................................................................................................................... 74
Figure 3. 10. Comparison of zeta potential of bare MMT and protein-coated MMT at pH 2.0-
10.0. Coating was conducted at an MMT:protein powder mass ratio of 3:1 using protein
precipitated at pH 5.5.................................................................................................................... 75
Figure 4. 1. XRD patterns of pristine MMT (red) and soy protein powder (blue). ................... 100
Figure 4. 2. XRD patterns of MMT coated by soy protein powder (SPP) using an MMT:SPP
mass ratio of 4:1at (A) pH 2.0-4.0, (B) pH 5.0-7.0, and (C) pH 8.0-10.0. ................................. 101
Figure 4. 3. FTIR spectra of pristine MMT (red) and soy protein powder (blue). .................... 102
Figure 4. 4. FTIR spectra of MMT coated by soy protein at an MMT:soy protein powder mass
ratio of 4:1 and (A) pH 2.0 (blue), 3.0 (purple), and 4.0 (red), (B) pH 5.0 (blue), 6.0 (purple), and
7.0 (red) and (C) pH 8.0 (blue), 9.0 (purple), and 10.0 (red)...................................................... 103
Figure 4. 5. Comparison of zeta potential of bare MMT dispersions in 10mM NaH2PO4 buffer
and soy protein-coated MMT at pH 2.0-10.0. Coating was conducted at an MMT:SPP mass ratio
of 4:1. .......................................................................................................................................... 104
Figure 4. 6. XRD patterns of pristine MMT (brown) and MMT coated by soy protein power
(SPP) at MMT:SPP mass ratios of 2:1 (red), 4:1 (blue), 9:1 (green) and 49:1 (pink) at pH 9.0.105
Figure 4. 7. XRD patterns of simple mixtures of MMT and soy protein powder (SPP) at
MMT:SPP mass ratios of 2:1 (red), 4:1 (blue), 9:1 (green) and 49:1 (pink). The data at the 4:1
mass ratio is repeated here for convenience of comparison. ...................................................... 106
Figure 4. 8. Zeta potential of MMT coated by soy protein powder (SPP) at pH 9.0 using various
MMT:SPP mass ratios. ............................................................................................................... 107
Figure 5. 1. Rheological profiles demonstrated for dispersions containing 6% w/v SPI with 100
mM NaCl, (A) without and (B) with 1%w/v protein-coated MMT during (1) a holding step at 45
xvi
°C for 10 min; (2) a heating step from 45 to 90 °C at 2 C/min; (3) a holding step at 90 °C for 1 h;
(4) a cooling step from 90 to 25 °C at 3 C/min. ........................................................................ 129
Figure 5. 2. Rheological profiles demonstrated for dispersions containing 6% w/v SPI with (A)
0.3%w/v mTGase, (B) 0.3%w/v mTGase and 1%w/v protein-coated MMT, (C) 0.4%w/v
mTGase and 100 mM NaCl, and (D) 0.4%w/v mTGase, 100 mM NaCl and 1%w/v protein-
coated MMT during (1) a holding step at 45 °C for 2 h; (2) a heating step from 45 to 90 °C at 2
C/min; (3) a holding step at 90 °C for 1 h; (4) a cooling step from 90 to 25 °C at 3 C/min. .. 131
Figure 5. 3. The storage moduli (G) of 6%w/v dispersions, containing 50-1000 mM NaCl, (A)
without and (B) with 1%w/v protein-coated MMT after 10-min holding at 45 C (P1), heating to
90 C at 2 C/min (P2), 1-h holding at 90 C (P3), and cooling to 25 C at 3 C/min (P4)....... 132
Figure 5. 4. The storage moduli (G) of 6%w/v SPI dispersions, containing varied mTGase
concentrations, (A) without and (B) with 1%w/v protein-coated MMT after 2-h holding at 45 C
(P1), heating to 90 C at 2 C/min (P2), 1-h holding at 90 C (P3), and cooling to 25 C at 3
C/min (P4). ................................................................................................................................ 133
Figure 5. 5. Effects of mTGase concentration on gelation time during crosslinking 6%w/v SPI
dispersions with and without 1%w/v protein-coated MMT. ...................................................... 134
Figure 5. 6. The storage moduli (G) of 6%w/v SPI dispersions, containing 100 mM NaCl and
varied mTGase concentrations, (A) without and (B) with 1%w/v protein-coated MMT after 2-h
holding at 45 C (P1), heating to 90 C at 2 C/min (P2), 1-h holding at 90 C (P3), and cooling
to 25 C at 3 C/min (P4)............................................................................................................ 135
Figure 5. 7. Effects of mTGase concentration on gelation time during crosslinking 6%w/v SPI
dispersions with and without 1%w/v protein-coated MMT. ...................................................... 136
Figure 5. 8. Strain sweep profiles at 25 C, after a heating-cooling cycle as in Figure 1, for SPI
gels formed with 100 mM NaCl and the absence (circles) or presence (squares) of 1%w/v
protein-coated MMT................................................................................................................... 137
Figure 5. 9. Strain sweep profiles at 25 C, after a heating-cooling cycle as in Figure 2, for SPI
gels cross-linked by 0.30%w/v TGase in the absence (circles) or presence (squares) of 1%w/v
protein-coated MMT................................................................................................................... 138

xvii
Figure 5. 10. Strain sweep profiles at 25 C, after a heating-cooling cycle as in Figure 2, for SPI
gels cross-linked by 0.40%w/v TGase at 100 mM NaCl in the absence (circles) or presence
(squares) of 1%w/v protein-coated MMT. Filled and open symbols represent storage (G) and
loss (G) moduli, respectively. ................................................................................................... 139
Figure 6. 1. Effects of the glutaraldehyde (GA) concentration on developments of G and G of
8%w/v SPI dispersions (A) without and (B) with containing 1%w/v surface-modified MMT
during isothermal treatments at 23 C and pH 10.0 for 5 hours. ................................................ 159
Figure 6. 2. Strain sweep profiles of 8%w/v SPI dispersions (A) without and (B) with containing
1%w/v surface-modified MMT after isothermal treatments at 23 C and pH 10.0 for 5 hours. The
glutaraldehyde concentrations were 2.0% (circles), 4.0% (square), and 10.0% (diamond) mass of
SPI............................................................................................................................................... 160
Figure 6. 3. G (filled symbol) and G (open symbol) of 8%w/v SPI dispersions without (circle)
and with (square) 1%w/v surface-modified MMT at the end of the isothermal treatment at 23 C
and pH 10.0 for 5 hours. ............................................................................................................. 161
Figure 6. 4. Effects of pH on the storage modulus (G) and loss modulus (G) of 8%w/v SPI
dispersions without (circle) and with (square) 1%w/v surface-modified MMT at 10.0%
glutaraldehyde after 5-h crosslinking at 23 C and varied pH conditions. ................................. 162
Figure 6. 5. Effects of crosslinking temperature on the storage modulus (G) and loss modulus
(G) of 8%w/v SPI dispersions without (circle) and with (square) 1%w/v surface-modified MMT
at (A) 2.0% and (B) 10.0% glutaraldehyde after 5-h crosslinking at pH 5.5 and different
temperatures................................................................................................................................ 163
1
CHAPTER 1 . INTRODUCTION
2
1.1. FOOD PACKAGING AND PLASTICS
Food packaging is utilized in order to prevent the negative changes to the safety and
quality of the food against chemical, physical, enzymatic, and microbiological hazards, and to
maintain foods in an appropriate condition for retail or consumption. Metal, glass, paper,
cardboard, and petroleum-derived plastics are the traditional packaging materials utilized in the
food industry. However, although the application of food packaging enhances food safety,
quality and convenience in distribution and consumption, the solid waste from food packaging
negatively impacts the environment with the increased popularity of food packaging applications.
It is reported that the overall municipal solid waste increased by 37% from 179.6 million tons in
1988 to 245.7 million tons in 2005. Packaging waste consists of up to 31.2% total solid wastes,
of which food packaging waste accounts for approximately two-thirds by volume (Marsh &
Bugusu, 2007).
Plastic packages, due to the advantages of low cost, light weight, and chemical inertness,
have been greatly used in food applications (Kumar, 2009) since the first plastic bag was
invented in 1957. In 2010, the global production of plastics reached 300 million tons, almost the
same amount as that produced in the first decade of the 21st century and that produced during the
entire 1900s. Since petroleum derived plastics are non-degradable, the consumption of large
amounts of petro-plastics has resulted in a big environment issue of disposing plastics waste.
Additionally, the production of petro-plastics consumes valuable and non-renewable natural
fossil resources (de Azeredo, 2009).
The concerns of negative environmental impacts of persistent petro-plastic wastes, fossil
fuel depletion, and increase of petroleum prices have been driving forces in using plant-based
degradable polymers to produce economical, biodegradable, and renewable bio-plastic

3
packaging materials. The demand for biodegradable plastic packaging has been continuously
increasing from both consumers and the food industry in order to alleviate the waste problem to
some extent.
1.2. PROGRESSES, OPPORTUNITIES AND CHALLENGES OF FOOD
PACKAGING MATERIALS BASED ON NATRUALLY-OCCURRING
BIO-POLYMERS
Naturally-occurring biopolymers, including thermoplastic starch, cellulose, chitosan,
gelatin and plant oils, have been studied extensively as possible bio-packaging material resources
in the past two decades because of their renewable and bio-degradable properties (Cao, Fu, & He,
2007; Krochta & DeMulderJohnston, 1997; Le Corre, Bras, & Dufresne, 2010; Tang, Alavi, &
Herald, 2008a). Synthesized bio-degradable packaging materials will have the potential to
replace or partially replace petroleum-based plastics and foams predominantly in use today
(Krochta & DeMulderJohnston, 1997), thereby potentially alleviating environmental pollution
concerns.
Commercialization of some biopolymer-based food packages has already been attempted
to some extent. Disposable “green” paper and bio-synthetic polylactide (PLA) are the most
popular new advances. Bio-degradable dishware from sugar cane pulp fiber has been widely
used in the dining system at Massachusetts Institute of Technology (MIT). Natureworks, LLC
(Minnetonka, MN) manufactures biodegradable spring water bottles from biodegradable
polylactide that is synthesized from lactic acid produced by fermentation of carbohydrates
derived from resources such as corn stach. Frito-Lay, Inc. had replaced traditional Sunchips®
4
bags with bio-degradable bags for more than a year although finally moves back to the normal
ones. Wal-Mart stores, Inc. is using polylactide to package fresh-cut produce (Marsh & Bugusu,
2007). As released in the “Food & Beverage Packaging” website in July 2011, the annual growth
of bio-plastics has been ca. 17-20% since 2006, and the global demand for bio-plastics is
estimated to quadruple by 2013 (Markets, 2011).
According to “The Global Outlook for Biodegradable Packaging” report (Markets, 2011),
“PLA dominates bioplastics use, but more new materials are being developed from algae and
microbacterial sources and advances in nanotechnology offer potential for interesting
developments in smart packaging.” Proteins, due to their good film forming properties, moderate
cost, and biodegradable nature, have been extensively studied in forming biopolymer films.
When comparing to whey protein, casein, collagen, corn zein, and gelatin, soy protein and gluten
have the advantage of the low cost in order to develop affordable packaging materials (Krochta
& DeMulderJohnston, 1997). Soy protein isolate (SPI), consisting of more than 90% protein, is a
cheaper source than whey protein isolate (WPI) and corn zein (Fishman, 1997; Krochta &
DeMulderJohnston, 1997). However, when compared to conventional plastic products,
packaging films prepared from proteins have poor mechanical and barrier properties such as
brittleness, rigidity, low elongation percentage, and relatively low moisture resistance due to its
hydrophilic nature (Kim, Ko, & Park, 2002; Krochta & DeMulderJohnston, 1997; Paetau, Chen,
& Jane, 1994). These challenges are to be overcome before realistic applications in the food
packaging industry.
With the emerging nanotechnology, nanocomposite packaging materials have received
great interests in overcoming the property shortages of these natural biopolymer-based
packaging materials. Nanotechnology uses and studies materials at a scale that normally ranges
5
from 1 to 100 nanometers. Materials composed of building blocks with different scales, e.g.
micrometer (μm) versus nanometer (nm), have significantly different properties, with much
improved for an ultra-small level (nm), even when these building blocks have same chemical
compositions. In comparison to the micro scale materials, the nano scale materials are endowed
with much better mechanical and barrier properties due to their ultra-small size and huge reactive
surface area (Kumar, 2009). A nanocomposite consists of a biopolymer matrix incorporated with
nanofillers. The composition, dimension, and shape of the nanofillers, as well as their spatial
distribution in the matrix, are important factors that impact the properties of nanocomposite
products (Capek, 2006).
Polymer-clay-nanocomposite (PCN) is a group of nanocomposites, in which nanoclays
are the nanoscale fillers dispersed in a polymer matrix. The inorganic nanoclays have at least one
dimension in the nanometer range. Due to the high aspect ratio and high surface area of
incorporated nanoclays and their uniform distribution in and enhance the interfacial interaction
with the biopolymer matrix, PCN works effectively to enhance the mechanical (tensile strength,
tensile modulus and percent elongation at break) and the barrier (resistance against gas, moisture,
and volatiles) properties for bio-degradable and renewable natural raw materials. Four possible
arrangements of layered clays dispersed in a polymer matrix have been established, i.e.,
microcomposite (phase separated or immiscible), intercalated, disordered intercalated (partially
exfoliated), and exfoliated nanocomposite (Kumar, 2009; Tang, Alavi, & Herald, 2008a). The
structure-property relationship illustrates that the final structure of nanocomposite materials
greatly impacts the properties and performance of the final products. Therefore, achieving either
intercalation or exfoliation of layered nanoclay is critical to improve the properties of
nanocomposite materials. (Le Corre, Bras, & Dufresne, 2010; Tang, Alavi, & Herald, 2008a).
6
As a naturally-existing clay, montmorillonite (MMT) is one of the most widely studied
layered silicates in developing bio-polymer nanocomposites due to its low cost, abundant supply,
large surface area, large specific aspect ratio (ratio of length to thickness), and very high elastic
modulus (Arora & Padua, 2010; de Azeredo, 2009; Essington, 2003; Gunister, Pestreli, Unlu,
Atici, & Gungor, 2007; Zhao, Torley, & Halley, 2008). MMT behaves as rigid fillers in a
nanocomposite to enhance the mechanical properties. Highly intercalated or exfoliated MMT has
repeatedly been shown to improve mechanical and barrier properties of bionanocomposite
materials (Chen & Zhang, 2006; Kumar, Sandeep, Alavi, Truong, & Gorga, 2010a, 2010b). Well
dispersed MMT in SPI matrix resulted in significant improvements in thermal-stability and
mechanical strength. Disordered intercalation or exfoliation is the desired arrangement for
enhancing the properties of PCN, and the authors only obtained this at a low MMT concentration.
Generally speaking, because a bigger d-spacing (distance between clay layer platelets) helps the
polymer chains enter into the galleries more easily, the intercalation, even further the exfoliation
of nanocomposites would be much more easily obtained by modified MMT with enlarged d-
spacing than pristine MMT. Thus, modification of MMT structures with enlarged basal spacing
and intercalated and/or exfoliated structures prior to incorporation into the polymer matrix is a
viable approach in improving the structure and properties of final nanocomposite materials.
1.3. SCOPE OF THE WORK
The overall goals of this work were to investigate the potential modification of MMT
structures by surface-coating with water soluble plant proteins and the strengthening of
interactions between the matrix biopolymer and protein-coated MMT by enzymatic and chemical
crosslinking.
7
Hominy protein and soy protein, widely available plant-sourced proteins, were utilized to
modify the ordered structure of MMT parallel layers by surface coating with a goal to obtain
intercalated and/or exfoliated platelets prior to nanocomposite production. Different pH (2.0-10.0)
and MMT:protein mass ratios (from 49:1 to 2:1) were investigated for the impact on MMT
structures studied by using X-ray diffraction (XRD), Fourier transform infrared spectroscopy
(FTIR), and ζ (zeta)-potential analysis.
The modified MMT was then incorporated in soy protein dispersions for enzymatic and
chemical crosslinking by utilizing transglutaminase (TGase) and glutaraldehyde, respectively.
Dynamic rheological measurements were performed to illustrate the gel network formation and
strength. Variables in enzymatic crosslinking included concentrations of sodium chloride and
TGase in the absence or presence of modified MMT. Chemical crosslinking was studied for the
impacts of pH, temperature and glutaraldehyde concentration, with or without modified MMT.
8
LIST OF REFERENCES
Arora, A., & Padua, G. W. (2010). Review: nanocomposites in food packaging. Journal of Food
Science, 75(1), R43-R49.
Cao, N., Fu, Y. H., & He, J. H. (2007). Preparation and physical properties of soy protein isolate
and gelatin composite films. Food Hydrocolloids, 21(7), 1153-1162.
Capek, I. (2006). Nanocomposite structures and dispersions : science and nanotechnology--
fundamental principles and colloidal particles
Chen, P., & Zhang, L. (2006). Interaction and properties of highly exfoliated soy
protein/montmorillonite nanocomposites. Biomacromolecules, 7(6), 1700-1706.
de Azeredo, H. M. C. (2009). Nanocomposites for food packaging applications. Food Research
International, 42(9), 1240-1253.
Essington, M. E. (2003). Soil and water chemistry: an intergrative approach CRC Press, p58, 65,
68.
Fishman, M. L. (1997). Edible and biodegradable polymer films: challenges and opportunities.
Food Technology, 51(2), 16-16.
Gunister, E., Pestreli, D., Unlu, C. H., Atici, O., & Gungor, N. (2007). Synthesis and
characterization of chitosan-MMT biocomposite systems. Carbohydrate Polymers, 67(3),
358-365.
Kim, K. W., Ko, C. J., & Park, H. J. (2002). Mechanical properties, water vapor permeabilities
and solubilities of highly carboxymethylated starch-based edible films. Journal of Food
Science, 67(1), 218-222.
9
Krochta, J. M., & DeMulderJohnston, C. (1997). Edible and biodegradable polymer films:
challenges and opportunities. Food Technology, 51(2), 61-74.
Kumar, P. (2009). Development of bio-nanocomposite films with enhanced mechanical and
barrier properties using extrusion processing. North Carolina State University. Ph.D
dissertation.
Kumar, P., Sandeep, K. P., Alavi, S., Truong, V. D., & Gorga, R. E. (2010a). Effect of type and
content of modified montmorillonite on the structure and properties of bio-
nanocomposite films based on soy protein isolate and montmorillonite. Journal of Food
Science, 75(5), N46-N56.
Kumar, P., Sandeep, K. P., Alavi, S., Truong, V. D., & Gorga, R. E. (2010b). Preparation and
characterization of bio-nanocomposite films based on soy protein isolate and
montmorillonite using melt extrusion. Journal of Food Engineering, 100(3), 480-489.
Le Corre, D., Bras, J., & Dufresne, A. (2010). Starch nanoparticles: a review.
Biomacromolecules, 11(5), 1139-1153.
Markets, R. a. (2011). The global outlook for biodegradable packaging. Accessed by website:
http://www.researchandmarkets.com/research/5e27e0/the_global_outlook. Business
Insights, June, 110.
Marsh, K., & Bugusu, B. (2007). Food packaging - Roles, materials, and environmental issues.
Journal of Food Science, 72(3), R39-R55.
Paetau, I., Chen, C. Z., & Jane, J. L. (1994). Biodegradable plastics made from soybean
products.1. effect of preparation and processings on mechanical-properties and water-
absorption. Industrial & Engineering Chemistry Research, 33(7), 1821-1827.
10
Tang, X. Z., Alavi, S., & Herald, T. J. (2008). Barrier and mechanical properties of starch-clay
nanocomposite films. Cereal Chemistry, 85(3), 433-439.
Zhao, R. X., Torley, P., & Halley, P. J. (2008). Emerging biodegradable materials: starch- and
protein-based bio-nanocomposites. Journal of Materials Science, 43(9), 3058-3071.

11
CHAPTER 2 . LITERATURE REVIEW
12
2.1. RECENT RESEARCH OF BIODEGRADABLE SILLICATE
NANOCOMPOSITE IN PROTEIN-BASED FOOD PACKAGING
Concerns of fossil fuel depletion, increase of petroleum prices, and negative
environmental impacts of persistent petro-plastic wastes have been the driving forces behind the
investigation of bio-plastic packaging based on renewable, low-cost, and degradable biopolymers
(Jahangir, & Leber, 2007; Sorrentino, Gorrasi, & Vittoria, 2007; Zhao, Torley, & Halley, 2008).
Since 2006, the annual growth of bio-plastics has been reported as ca. 17-20%, and the global
demand for bio-plastics is estimated to quadruple by 2013 (Markets, 2011). Companies like
Coca-Cola, Frito-Lay, and Walmart have already adopted bio-plastic bottles, pouches and wraps
(Marsh & Bugusu, 2007).
Natural biopolymers, like thermoplastic starch, cellulose, chitosan, gelatin, gluten, soy
protein and whey protein, as listed in Table 2.1, have been studied extensively as bio-packaging
material resources in the past two decades due to their renewable and bio-degradable nature (Cao,
Fu, & He, 2007; Krochta & DeMulderJohnston, 1997; Le Corre, Bras, & Dufresne, 2010; Tang,
Alavi, & Herald, 2008a). Poly-lactic-acid (PLA), synthesized from monomers derived from corn
starch, has been a dominating polymer in manufacturing bioplastics (Ahmed & Varshney, 2011).
As seen in Table 2.1, the films made from PLA showed good mechanical properties, moderate
water barrier property, but poor oxygen barrier property. Materials from other sources and
advanced technologies such as nanotechnology are emerging in the bioplastic industry (Markets,
2011) to improve the material properties. Therefore, the emerging renewable and bio-degradable
packaging materials have the potential to replace or partially replace the dominant petroleum-
based plastics and foams (Krochta & DeMulderJohnston, 1997), thereby potentially alleviating
environmental pollution derived from non-degradable petroleum-based plastic products.
13
2.1.1. Soy Protein-based Packaging Materials
Due to good film forming properties, low cost, renewable and biodegradable nature,
proteins have been intensively studied as renewable film-forming biopolymers (Cuq, Gontard, &
Guilbert, 1998; Kumar, Sandeep, Alavi, Truong, & Gorga, 2010a, 2010b; Paetau, Chen, & Jane,
1994; Xiang, Tang, Cao, Wang, Wang, Zhang, et al., 2009). Among plant and animal-derived
proteins, soy protein and gluten have the advantage of low cost to develop affordable packaging
materials. As illustrated in Table 2.1, the unit price (dollars per pound) of soy protein isolate (SPI)
and gluten was 1.30-1.70 and 0.80-0.90, respectively, which was much lower than 6.00-12.00
and 10.25-15.50 for whey protein isolate (WPI) and corn zein, respectively, in 1997 (Fishman,
1997; Krochta & DeMulderJohnston, 1997). In the middle of 2011, from the Food Expo of
Institute of Food Technologist Annual Meeting, the unit price for SPI was ca. $2/lb. in
comparison to ca. $14/lb. for WPI. Therefore, soy protein still has the advantage to develop
competitive bio-packaging materials.
Soy protein ingredients used in the food industry are classified as three groups based on
the protein content, i.e. soy flours and grits, soy protein concentrate (SPC), and SPI. Soy flour
contains 50-59% protein and is obtained by grinding defatted soy flakes, SPC has 65-72%
protein and is produced by aqueous extraction or acid leaching process, SPI is manufactured by
aqueous or mild alkali extraction followed by isoelectric precipitation and contains more than
90% protein (Council, 1987). Soy proteins are widely applied in the food industry because of
their excellent functional properties. Functional properties of soy proteins important to food
systems include solubility, viscosity, gelation, cohesion/adhesion, water absorption and binding,
emulsification, forming, fat adsorption, flavor-binding, etc., as shown in Table 2.2 (Kinsella,
14
1979). The mode of action for each function is also listed in Table 2.2, as well as the potential
applicable food systems and the form of soy proteins. (Kinsella, 1979)
Soy proteins are composed of a complex mixture of proteins with the minimum solubility
near pH 4.5 (isoelectric point, pI) and have molecular weights ranging from 8000 to 600,000 Da
(Wolf, 1970). Soy proteins are classified into four fractions (2S, 7S, 11S, and 15S) based on their
sedimentation values, as shown in Table 2.3. The β-conglycinin (7S, about 35%) and glycinin
(11S, about 52%) are the two major components in SPC and SPI; while 2S is the fraction of a
small molecular weight that is degraded to some extent during heat treatment, which causes its
limited presence in SPC and SPI (Wolf, 1970). β-conglycinin is a trimeric glycoprotein with a
molecular weight of 180 kDa, consisting of three types of subunits, i.e., α’, α and β subunits,
corresponding to 60, 67 and 71 kDa (Maruyama, Katsube, Wada, Oh, Barba De La Rosa, Okuda,
et al., 1998), while glycinin, having a molecular weight of ca. 360 kDa, is composed of an acidic
and a basic polypeptide, linked by a disulfide bond (Koshiyam.I, 1968; Renkema, Knabben, &
van Vliet, 2001; Thanh & Shibasaki, 1976a, 1976b). Badley et al. (Badley, Atkinson, Hauser,
Oldani, Green, & Stubb, 1975) also reported that glycinin has 6 acidic subunits of ca. 35 kDa and
6 basic units of ~20 kDa. β-conglycinin and glycinin have a peak denaturation temperature of
76.7 and 94.1 C, respectively (Tang, Choi, & Ma, 2007). The onset and peak denaturation
temperatures are highly dependent on pH, with higher onset and peak denaturation temperatures
at higher pH conditions. Since glycinin has 3-4 times more –SH than β-conglycinin, glycinin has
a higher tendency to form disulfide bonds than β-conglycinin. Therefore, the films formed from
11S had a higher tensile strength than those from 7S (Okamoto, 1978).
The association and dissociation of soy protein subunits are dependent on temperature
and pH (Badley, Atkinson, Hauser, Oldani, Green, & Stubb, 1975; Maruyama, et al., 1998),
15
which in turn affect most of their physicochemical properties (Kinsella, 1979). Concentrated
dispersions of SPI increase in viscosity and form gels when heated. Soy protein dispersions form
pro-gels during heating, while forming gels after cooling. The concentration of the SPI in
dispersions, normally, should be at least 8%w/v to form a pro-gel. Excess heating strengthens gel
elasticity, further solution again when the temperature is above 120 °C. As for the effect of pH,
concentrated SPI dispersions form firm and turbid gels at low pH, called “coagulum gel”, but
form translucent and weak gels at high pH. Under alkaline conditions, β-conglycinin trimers
dissociate into individual subunits and glycinin is denatured, dissociating into acidic and basic
polypeptide components (Petruccelli & Anon, 1995). The denaturation of β-conglycinin results
in the decrease in viscosity. When a mixture of glycinin and β-conglycinin are treated at alkaline
conditions at elevated temperatures, the dissociated basic polypeptides from glycicin react with
β-conglycinin subunits to form soluble aggregates, more actively than acid polypeptides do.
Upon cooling the soluble aggregates become highly organized complexes. (Utsumi & Kinsella,
1985)
Various chemical treatments have shown significant impacts on soy protein films (Kumar,
2009). The addition of plasticizers improves the water resistance and decreases the brittleness of
soy protein polymers. Water and glycerol, behaving as typical plasticizers, greatly enhance the
flexibility of soy protein polymers (Mo, Sun, & Wang, 1999). Cross-linked protein films have
lower solubility and less soluble mass than the controls. Other factors, such as pH, heating, and
blending, also played important roles in the formation and properties of soy protein films (Song,
Tang, Wang, & Wang, 2011). Besides to the chemical treatments, the molecular weight of the
SPI fraction also have an effect on the moisture barrier and physical properties of soy protein
films (Cho & Rhee, 2004).
16
In comparison to starch films, protein films have moderate mechanical properties, lower
water vapor permeability and better oxygen barrier properties (Cao, Fu, & He, 2007; de Azeredo,
2009; Zhao, Torley, & Halley, 2008). However, when comparing to petro-plastics, protein films
have poorer mechanical properties such as brittleness, rigidness, and lower elongation percentage
and relatively lower moisture and gas resistance due to their hydrophilic nature. This, in turn,
limits the realistic applications of protein films in the food packaging industry. These drawbacks
can be potentially lessened by the application of nanotechnology (Arora & Padua, 2010; Krochta
& DeMulderJohnston, 1997; Song, Tang, Wang, & Wang, 2011).
2.1.2. Nanotechnology and Soy Protein-Based Nanocomposites
Nanotechnology uses and studies materials with at least one dimension between 1 and
100 nanometers. At different scales, i.e. micro versus nano, materials possess significantly
different properties, even for identical compositions. Nanoscale materials have frequently
demonstrated much better mechanical and barrier properties than those at the micro scale.
Composites consist of fillers dispersed in the matrix polymers. As for the nanocomposite
materials, at least one dimension of the incorporated fillers is in the nanometer range.
Nanocomposites have much improved mechanical and barrier properties than conventional
composite materials containing fillers dispersed as micrometer-sized structures (Le Corre, Bras,
& Dufresne, 2010; Tang, Alavi, & Herald, 2008a).
Bio-nanocomposite consists of inorganic nanoparticles dispersed in a biopolymer matrix,
and has the promise to improve mechanical, barrier, and thermo-resistance properties of natural
biopolymer-based packaging films (Arora & Padua, 2010; Dang, Lu, Yu, Sun, & Yuan, 2010; de
Azeredo, 2009). These properties are currently technological challenges of developing bio-
packaging to replace conventional petro-plastics dominantly in use now. Clay-based

17
nanocomposite effectively enhances the tensile strength and the barrier resistance against gas,
moisture, and volatiles for products derived from bio-degradable and renewable natural raw
materials (Arora & Padua, 2010; Chang, Yang, Huang, Xia, Feng, & Wu, 2009; Weiss,
Takhistov, & McClements, 2006). Thus, biopolymer-based nanocomposites as novel packaging
materials have the potential to be substitutes for petroleum-derived plastics due to their
renewability and bio-degradability.
2.1.3. Nanocomposites Based on MMT
Researchers proposed different nano-particles based on their physical shapes, including
spheres, rods, palates, particles, etc. The composition, dimension, and shape of nanofillers, as
well as their spatial distribution in the matrix, are important factors impacting the properties of
nanocomposite products (Capek, 2006).
MMT, as a naturally-existing clay, has been one of the intensively studied nanofillers in
developing bio-polymer nanocomposites (Arora & Padua, 2010; Capek, 2006). As depicted in
Figure 2.1, the structure of MMT is composed of a layer of octahedral sheet sandwiched with
two silica tetrahedral parallel layers (Figure 2.1). The surfaces of MMT are highly negatively
charged and the different layers are attracted with a weak electrostatic force (Essington, 2003;
Kumar, 2009; Tang, Alavi, & Herald, 2008a). The extensive usage of MMT for developing
nanocomposites is due to its abundance in supply, easy availability at a low cost, and physical
characteristics, including high elastic modulus (178 GPa), high surface area (750 m2/g), and high
specific aspect ratio (50-1000). These physical characteristics contribute to both enhanced
mechanical and barrier properties of nanocomposite materials (de Azeredo, 2009; Essington,
2003; Gunister, Pestreli, Unlu, Atici, & Gungor, 2007; Le Corre, Bras, & Dufresne, 2010).
18
There are four proposed structures of silicate layers dispersing in a composite polymer
matrix (Tang, Alavi, & Herald, 2008b). Basically, three identical arrangements, i.e.,
microcomposite (phase separated or immiscible), intercalated, and exfoliated nanocomposite,
have been well accepted (Alexandre & Dubois, 2000), and the fourth one is an intermediate
status between intercalated and exfoliated structures, called “disordered intercalation”. As shown
in Figure 2.2, phase separated structures exist in conventional composites, referred as
microcomposites, in which clay platelets are stacked and exist as tactoids, encapsulated by the
polymer matrix. Intercalation of silicate platelets occurs once a monolayer of extended polymer
chains penetrates into the galleries between clay layers. The intercalation leads to finite
expansion of clay layers to ca. 2-3 nm. In this category of intercalation, clay platelets remain
parallel to each other. Exfoliation or delamination of silicate platelets occurs when polymer
chains extensively penetrate into the galleries, causing the separation of layers by ca. 10 nm or
more. Exfoliation of nanocomposite reveals the homogeneous distribution of nanoclays
throughout the polymer matrix. The disordered intercalation is the structure with regards to non-
parallel intercalation. (Alexandre & Dubois, 2000; Kumar, 2009; Tang, Alavi, & Herald, 2008a;
Zeng, Yu, Lu, & Paul, 2005)
Several studies illustrated that the structures of nanocomposite materials greatly impact
properties and performances (Chen & Zhang, 2006; Kumar, Sandeep, Alavi, Truong, & Gorga,
2010a). Studies correlating structures and properties have repeated demonstrated that achieving
either intercalation or exfoliation of layered nanoclay is critical to improve the properties of
nanocomposite materials (Le Corre, Bras, & Dufresne, 2010; Tang, Alavi, & Herald, 2008a).
Toward this direction, modification of nanoclays by increasing basal spacing (distance between
clay layer platelets, d-spacing) with intercalated and/or exfoliated structures, prior to
19
incorporation into the polymer matrix, is a viable approach in improving the structure and
properties of the final nanocomposite materials (Feng, Zhao, Gong, & Yang, 2004; Lin, Wei,
Juang, & Tsai, 2007; Mallakpour & Dinari, 2011). Physically, the enlarged d-spacing makes it
easier for polymer chains to enter the galleries between clay layers.
To enlarge d-spacing, strategies have been developed by chemically modifying surface
properties of MMT or physically coating MMT with molecules (Feng, Zhao, Gong, & Yang,
2004; Lin, Wei, Juang, & Tsai, 2007; Mallakpour & Dinari, 2011; Yang, Zhu, Yin, Wang, & Qi,
1999). Yang et al. (Yang, Zhu, Yin, Wang, & Qi, 1999) surface-modified MMT by using three
types of intercalation agents – amino acids, primary aliphatic amines, and quaternary ammonium
salt, and found that the dispersion behavior of MMT in organic solvents depended on the type of
the functional group and the bulky group of the intercalation agent. Also, d-spacing was found to
increase with the length of the alkyl group of an intercalation agent, which makes it possible for
modification by molecules with large molecular weight. Ion exchange was applied to modify the
Na+-MMT by hydrochloric acid to enlarge the d-spacing from 1.2 nm to 1.5 nm, followed by
intercalation of MMT with bovine serum albumin (BSA), resulting in a further enlarged d-
spacing of 3.2 nm (Lin, Wei, Juang, & Tsai, 2007). The above studies show that chemical and
physical modification could increase the d-spacing.
2.1.4. Soy Protein-Based Nanocomposite
Soy proteins have been extensively studied for bio-derived packaging materials, with
several recent studies investigating the improvement of mechanical and barrier properties of
nanocomposite films after incorporating nanoclays such as montmorillonite (MMT) (Arora &
Padua, 2010; Chang, Yang, Huang, Xia, Feng, & Wu, 2009; Chen & Zhang, 2006; Guilherme,
Mattoso, Gontard, Guilbert, & Gastaldi, 2010; Kumar, Sandeep, Alavi, Truong, & Gorga, 2010a,
20
2010b; Lee & Kim, 2010; Martucci & Ruseckaite, 2010). SPI/MMT nanocomposite films have
been reported for decreased water vapor and oxygen permeabilites and increased elastic modulus
and tensile strength (Lee & Kim, 2010). Chen & Zhang (Chen & Zhang, 2006) developed SPI-
based nanocomposite bioplastics with highly exfoliated MMT that demonstrated significantly
improved mechanical strengths and thermal-stabilities when compared to the control without
MMT. Kumar et al. (2010a, 2010b) applied melt extrusion to achieve intercalation/exfoliation of
MMT, and the resultant SPI/MMT cast films were greatly improved for tensile strength, storage
modulus, glass transition temperature, water barrier property, and thermal stability. Exfoliation
of nanocomposite was achieved with modified MMT at MMT content lower than 5%, while
intercalated to disorderly intercalated structures were developed at higher MMT content (15%).
The studies above indicate that both mechanical and barrier properties of soy protein films could
be improved when nanoclays are incorporated to form soy protein-based nanocomposite
materials and films.
2.2. CROSSLINKING AS A POTENTIAL METHOD TO ENHANCE THE
PROPERTIES OF PROTEIN-BASED NANOCOMPOSITES
The highly intercalated or exfoliated MMT nanoclay has repeatedly been shown to
improve the mechanical and barrier properties of bio-nanocomposite materials, which may be
further improved by strengthening the interactions between matrix polymers and MMT.
Crosslinking is a potential method for improving the interaction among the protein-based
nanocomposite system since crosslinking could form the strong covalent bondings between
protein molecules, and enhance the interactions of the nanocomposite system. In addition,
crosslinking decreases the solubility of protein and enhances the hydrophobic effect (Mohamed,
21
Hojilla-Evangelista, Peterson, & Biresaw, 2007). Enzymatic and chemical cross-linking
approaches have been studied for soy proteins to enhance the gel or polymer properties (Caillard,
Remondetto, & Subirade, 2009, 2010; de Carvalho & Grosso, 2004; Gan, Latiff, Cheng, & Easa,
2009; Jiang, Tang, Wen, Li, & Yang, 2007; Yildirim & Hettiarachchy, 1998).
2.2.1. Chemical Crosslinking
Chemical crosslinking of soy protein includes crosslinking induced by chemicals
containing aldehyde groups (Song, Tang, Wang, & Wang, 2011). Chemical crosslinkers
containing aldehyde groups include glutaraldehyde, formaldehyde, glyxoal, dialdehyde starch,
hexanedial, biacetyl, and cyclopentane-dione (Figure 2.3) and have been widely utilized for
crosslinking proteins (Gerrard, Meade, Millera, Brown, Yasir, Sutton, et al., 2005).
Glutaraldehyde was observed to be more reactive than formaldehyde and glyceraldehyde in
crosslinking wheat protein (Gerrard, Brown, & Fayle, 2003).
Crosslinking of proteins via aldehyde groups formed covalent bonds, i.e., amide (CO-
NH) bonds, between protein chains by crosslinking the amino residues of lysine on protein
molecules and aldehyde groups on cross-linkers, resulting in the loss of lysine residues on
proteins (Gerrard, et al., 2005; Gonzalez, Strumia, & Igarzabal, 2011; Song, Tang, Wang, &
Wang, 2011). This type of crosslinking reaction is called “Maillard-type” crosslinking because of
the covalent amide bonds formed (Caillard, Remondetto, & Subirade, 2009, 2010).
In the presence of NaCl, cross-linking soy protein led to the formation of a less porous
network, consisting of smaller flocs and/or smaller particles, and formed stronger gels (Caillard,
Remondetto, & Subirade, 2009). Soy protein crosslinkd by glutaraldehyde had a lower solubility,
lower emulsifying properties and higher foaming stabilities than original SPI. Conversely,
glutaraldehyde treatment enhanced tensile strength and elongation at break of SPI films, more
22
significantly at increased glutaraldehyde concentrations (Park, Bae, & Rhee, 2000). Increased
tensile properties and improved processability as a resin of SPC were obtained by crosslinking
with glutaraldehyde to manufacture flax fabric-reinforced composites (Chabba & Netravali,
2005).
2.2.2. Enzymatic Crosslinking
Enzymes showing the capability of cross-linking proteins include transglutaminase (EC
2.3.2.13, protein-glutamine γ-glutamyltransferase, TGase), lipoxygenase, lysyl oxidase,
polyphenol oxidase and peroxidase. TGase is the most used enzyme, with the capability of
catalyzing crosslinking reactions between protein molecules, peptides, and primary amines
through acyl transfer reactions to form inter- or intramolecular ε-(γ-glutamyl)lysine isopeptidic
bonds (Seguro, Nio, & Motoki, 1996; Zhu, Bol, Rinzema, Tramper, & Wijngaards, 1999). The
enzymatic crosslinking reaction is presented in Figure 2.4 for the formation of an isopeptide
bond between two protein molecules. TGase is ubiquitous, and modern biotechnology has made
it possible to produce microbial TGase (mTGase) for commercial applications. The mTGase has
been studied extensively to improve functional properties of food proteins and protein-containing
products such as meat (Motoki & Seguro, 1998; Seguro, Nio, & Motoki, 1996). The studied
functionalities include hydration ability, emulsifying activities, thermal properties, and gel or
film-forming ability (Jiang, Tang, Wen, Li, & Yang, 2007a).
Enzyme activity of TGase is effectively affected by pH and temperature. In one study, the
catalyzing activity of TGase from Streptoverticillium ladakanum was observed to be optimum at
pH 6.0 and 50 °C and stable at pH 5.0-7.0 (Tsai, Lin, & Jiang, 1996). Another group claimed the
best enzyme activity at pH 5.5 and 40 °C (Ho, Leu, Hsieh, & Jiang, 2000). Both groups agreed
that TGase activity was high and stable at the pH range of 5.0-7.0. The deactivation of TGase
23
was observed after treatment at 55°C for ca. 30 min and was more noticeable at increased
temperatures, e.g., at 65 °C for 2-3 min (Nury, Meunier, & Mouranche, 1989). However, soy
proteins treated by mTGase at pH 6.0 did not form films by casting. At pH 7.0, TGase with high
enzyme activity might catalyze the initial protein aggregates in film-forming dispersions to
achieve more gigantic aggregates, leading to a remarkable decrease in tensile strength and the
percentage of elongation at break for formed films (Jiang, Tang, Wen, Li, & Yang, 2007). The
slower cross-linking reaction forms a more compact network for SPI film with higher
mechanical properties.
Besides pH and temperature, enzyme concentration is critical for generating TGase-
treated protein films with enhanced properties. Treatment with a relatively low concentration of
mTGase (4 U/g), compared up to 60 U/g SPI, significantly increased the tensile strength and
surface hydrophobicity of enzyme-treated SPI films, indicating that approximate 4U/g SPP is an
optimum concentration for obtaining improved mechanical and barrier properties from TGase-
crosslinked soy protein films (Jiang, Tang, Wen, Li, & Yang, 2007; Tang & Jiang, 2007). Slow
cross-linking reactions by mTGase, corresponding to relatively low TGase addition, favored the
formation of a more compact network for SPI films (Jiang, Tang, Wen, Li, & Yang, 2007). At
higher concentration of mTGase, mTGase-treated protein films had decreased mechanical
properties. In addition, Gan et al. (Gan, Latiff, Cheng, & Easa, 2009) reported that reduced
solubility and increased surface hydrophobicity of soy protein was observed after treatment by
mTGase, and the films prepared from mTGase-treated soy protein had decreased solubility and
improved mechanical properties such as tensile strength and elongation at break .
24
2.3. CONCLUSIONS AND OUTLOOK
Bio-nanocomposites, consisting of inorganic nanoclays dispersed in a biopolymer matrix,
have the potential to improve the mechanical, barrier, and thermo-resistance properties of
naturally renewable and degradable biopolymer-based packaging films. The properties of
nanocomposite materials are highly impacted by their structure, and the present review suggests
that modification of nanoclays by increasing basal spacing with intercalated and/or exfoliated
structures prior to its incorporation into the polymer matrix is a viable approach. Further, for
protein-based nanocomposites, crosslinking has the potential to improve the structures and thus
mechanical and barrier properties. This dissertation research was thus conducted based on these
two directions, with Chapters 3 and 4 probing modification of MMT structures by surface-
coating with plant proteins and Chapters 5 and 6 investigating enzymatic and chemical
approaches in improving interactions in soy protein-based nanocomposite systems. The study
may provide a feasible approach to develop new nanocomposites with enhanced mechanical and
barrier properties.
25
LIST OF REFERENCES
Ahmed, J., & Varshney, S. K. (2011). Polylactides-chemistry, properties and green packaging
technology: a review. International Journal of Food Properties, 14(1), 37-58.
Alexandre, M., & Dubois, P. (2000). Polymer-layered silicate nanocomposites: preparation,
properties and uses of a new class of materials. Materials Science & Engineering R-
Reports, 28(1-2), 1-63.
Arora, A., & Padua, G. W. (2010). Review: nanocomposites in food packaging. Journal of Food
Science, 75(1), R43-R49.
Badley, R. A., Atkinson, D., Hauser, H., Oldani, D., Green, J. P., & Stubb, J. M. (1975). The
structure, physical and chemical properties of the soy bean protein glycinin. Biochim
Biophys Acta, 412, 214-428.
Caillard, R., Remondetto, G. E., & Subirade, M. (2009). Physicochemical properties and
microstructure of soy protein hydrogels co-induced by Maillard type cross-linking and
salts. Food Research International, 42(1), 98-106.
Caillard, R., Remondetto, G. E., & Subirade, M. (2010). Rheological investigation of soy protein
hydrogels induced by Maillard-type reaction. Food Hydrocolloids, 24(1), 81-87.
Cao, N., Fu, Y. H., & He, J. H. (2007). Preparation and physical properties of soy protein isolate
and gelatin composite films. Food Hydrocolloids, 21(7), 1153-1162.
Capek, I. (2006). Nanocomposite structures and dispersions : science and nanotechnology--
fundamental principles and colloidal particles
26
Chabba, S., & Netravali, A. N. (2005). 'Green' composites Part 1: Characterization of flax fabric
and glutaraldehyde modified soy protein concentrate composites. Journal of Materials
Science, 40(23), 6263-6273.
Chang, P. R., Yang, Y., Huang, J., Xia, W. B., Feng, L. D., & Wu, J. Y. (2009). Effects of
layered silicate structure on the mechanical properties and structures of protein-based
bionanocomposites. Journal of Applied Polymer Science, 113(2), 1247-1256.
Chen, P., & Zhang, L. (2006). Interaction and properties of highly exfoliated soy
protein/montmorillonite nanocomposites. Biomacromolecules, 7(6), 1700-1706.
Cho, S. Y., & Rhee, C. (2004). Mechanical properties and water vapor permeability of edible
films made from fractionated soy proteins with ultrafiltration. Lebensmittel-Wissenschaft
Und-Technologie-Food Science and Technology, 37(8), 833-839.
Council, S. P. (1987). Soy protein products: characteristics, nutritional aspects, and utilization.
Washington, DC.
Cuq, B., Gontard, N., & Guilbert, S. (1998). Proteins as agricultural polymers for packaging
production. Cereal Chemistry, 75(1), 1-9.
Dang, Q. Q., Lu, S. D., Yu, S., Sun, P. C., & Yuan, Z. (2010). Silk fibroin/montmorillonite
nanocomposites: effect of pH on the conformational transition and clay dispersion.
Biomacromolecules, 11(7), 1796-1801.
de Azeredo, H. M. C. (2009). Nanocomposites for food packaging applications. Food Research
International, 42(9), 1240-1253.
de Carvalho, R. A., & Grosso, C. R. F. (2004). Characterization of gelatin based films modified
with transglutaminase, glyoxal and formaldehyde. Food Hydrocolloids, 18(5), 717-726.
27
Essington, M. E. (2003). Soil and water chemistry: an intergrative approach CRC Press, p58, 65,
68.
Feng, M., Zhao, C. G., Gong, F. L., & Yang, M. S. (2004). Study on the modification of sodium
montmorillonite with amino silanes. Acta Chimica Sinica, 62(1), 83-87.
Fishman, M. L. (1997). Edible and biodegradable polymer films: challenges and opportunities.
Food Technology, 51(2), 16-16.
Gan, C.Y., Latiff, A. A., Cheng, L.H., & Easa, A. M. (2009). Gelling of microbial
transglutaminase cross-linked soy protein in the presence of ribose and sucrose. Food
Research International, 42(10), 1373-1380.
Gerrard, J. A., Brown, P. K., & Fayle, S. E. (2003). Maillard crosslinking of food proteins II: the
reactions of glutaraldehyde, formaldehyde and glyceraldehyde with wheat proteins in
vitro and in situ. Food Chemistry, 80(1), 35-43.
Gerrard, J. A., Meade, S. J., Millera, A. G., Brown, P. K., Yasir, S. B. M., Sutton, K. H., &
Newberry, M. P. (2005). Protein cross-linking in food. In J. W. Baynes, V. M. Monnier, J.
M. Ames & S. R. Thorpe (Eds.), Maillard Reaction: Chemistry at the Interface of
Nutrition, Aging, and Disease, vol. 1043 (pp. 97-103).
Gonzalez, A., Strumia, M. C., & Igarzabal, C. I. A. (2011). Cross-linked soy protein as material
for biodegradable films: Synthesis, characterization and biodegradation. Journal of Food
Engineering, 106(4), 331-338.
Guilherme, M. R., Mattoso, L. H. C., Gontard, N., Guilbert, S., & Gastaldi, E. (2010). Synthesis
of nanocomposite films from wheat gluten matrix and MMT intercalated with different
quaternary ammonium salts by way of hydroalcoholic solvent casting. Composites Part
a-Applied Science and Manufacturing, 41(3), 375-382.
28
Gunister, E., Pestreli, D., Unlu, C. H., Atici, O., & Gungor, N. (2007). Synthesis and
characterization of chitosan-MMT biocomposite systems. Carbohydrate Polymers, 67(3),
358-365.
Ho, M. L., Leu, S. Z., Hsieh, J. F., & Jiang, S. T. (2000). Technical approach to simplify the
purification method and characterization of microbial transglutaminase produced from
Streptoverticillium ladakanum. Journal of Food Science, 65(1), 76-80.
Jahangir, S., & Leber, M. J. . (2007). Biodegradable good packaging: an environmental
imperative. Industry Report, 1-20.
Jiang, Y., Tang, C.H., Wen, Q.B., Li, L., & Yang, X.Q. (2007). Effect of processing parameters
on the properties of transglutaminase-treated soy protein isolate films. Innovative Food
Science & Emerging Technologies, 8(2), 218-225.
Kinsella, J. E. (1979). Functional properties of soy proteins. J. Am. Oil Chem. Soc., 56(3), 242-
258.
Koshiyam.I. (1968). Factors influencing conformation changes in a 7S protein of soybean
globulins by ultracentrifugal investigations. Agricultural and Biological Chemistry, 32(7),
879-&.
Krochta, J. M., & DeMulderJohnston, C. (1997). Edible and biodegradable polymer films:
challenges and opportunities. Food Technology, 51(2), 61-74.
Kumar, P. (2009). Development of bio-nanocomposite films with enhanced mechanical and
barrier properties using extrusion processing. North Carolina State University. Ph.D
dissertation.
Kumar, P., Sandeep, K. P., Alavi, S., Truong, V. D., & Gorga, R. E. (2010a). Effect of type and
content of modified montmorillonite on the structure and properties of bio-

29
nanocomposite films based on soy protein isolate and montmorillonite. Journal of Food
Science, 75(5), N46-N56.
Kumar, P., Sandeep, K. P., Alavi, S., Truong, V. D., & Gorga, R. E. (2010b). Preparation and
characterization of bio-nanocomposite films based on soy protein isolate and
montmorillonite using melt extrusion. Journal of Food Engineering, 100(3), 480-489.
Le Corre, D., Bras, J., & Dufresne, A. (2010). Starch nanoparticles: a review.
Biomacromolecules, 11(5), 1139-1153.
Lee, J. E., & Kim, K. M. (2010). Characteristics of Soy Protein Isolate-Montmorillonite
Composite Films. Journal of Applied Polymer Science, 118(4), 2257-2263.
Lin, J. J., Wei, J. C., Juang, T. Y., & Tsai, W. C. (2007). Preparation of protein-silicate hybrids
from polyamine intercalation of layered montmorillonite. Langmuir, 23(4), 1995-1999.
Mallakpour, S., & Dinari, M. (2011). Preparation and characterization of new organoclays using
natural amino acids and Cloisite Na(+). Applied Clay Science, 51(3), 353-359.
Markets, R. a. (2011). The global outlook for biodegradable packaging. Accessed by website:
http://www.researchandmarkets.com/research/5e27e0/the_global_outlook. Business
Insights, June, 110.
Marsh, K., & Bugusu, B. (2007). Food packaging - Roles, materials, and environmental issues.
Journal of Food Science, 72(3), R39-R55.
Martucci, J. F., & Ruseckaite, R. A. (2010). Biodegradable three-layer film derived from bovine
gelatin. Journal of Food Engineering, 99(3), 377-383.
Maruyama, N., Katsube, T., Wada, Y., Oh, M. H., Barba De La Rosa, A. P., Okuda, E.,
Nakagawa, S., & Utsumi, S. (1998). The roles of the N-linked glycans and extension
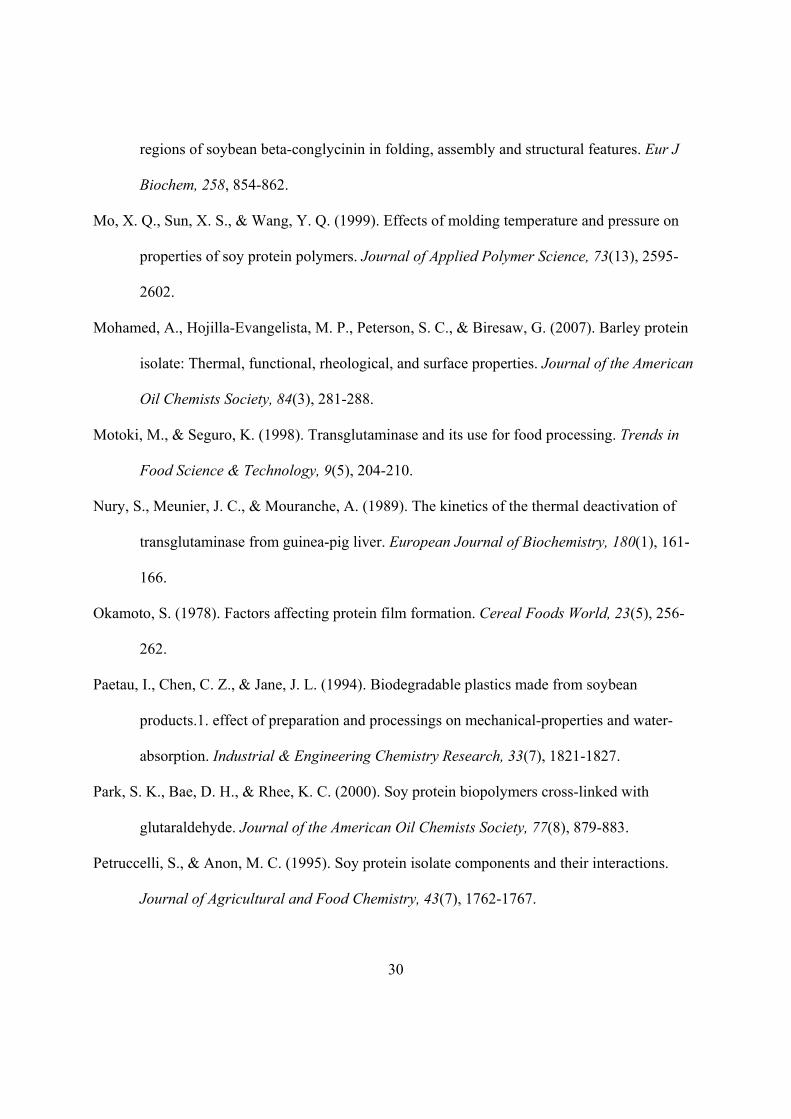
30
regions of soybean beta-conglycinin in folding, assembly and structural features. Eur J
Biochem, 258, 854-862.
Mo, X. Q., Sun, X. S., & Wang, Y. Q. (1999). Effects of molding temperature and pressure on
properties of soy protein polymers. Journal of Applied Polymer Science, 73(13), 2595-
2602.
Mohamed, A., Hojilla-Evangelista, M. P., Peterson, S. C., & Biresaw, G. (2007). Barley protein
isolate: Thermal, functional, rheological, and surface properties. Journal of the American
Oil Chemists Society, 84(3), 281-288.
Motoki, M., & Seguro, K. (1998). Transglutaminase and its use for food processing. Trends in
Food Science & Technology, 9(5), 204-210.
Nury, S., Meunier, J. C., & Mouranche, A. (1989). The kinetics of the thermal deactivation of
transglutaminase from guinea-pig liver. European Journal of Biochemistry, 180(1), 161-
166.
Okamoto, S. (1978). Factors affecting protein film formation. Cereal Foods World, 23(5), 256-
262.
Paetau, I., Chen, C. Z., & Jane, J. L. (1994). Biodegradable plastics made from soybean
products.1. effect of preparation and processings on mechanical-properties and water-
absorption. Industrial & Engineering Chemistry Research, 33(7), 1821-1827.
Park, S. K., Bae, D. H., & Rhee, K. C. (2000). Soy protein biopolymers cross-linked with
glutaraldehyde. Journal of the American Oil Chemists Society, 77(8), 879-883.
Petruccelli, S., & Anon, M. C. (1995). Soy protein isolate components and their interactions.
Journal of Agricultural and Food Chemistry, 43(7), 1762-1767.

31
Renkema, J. M. S., Knabben, J. H. M., & van Vliet, T. (2001). Gel formation by beta-
conglycinin and glycinin and their mixtures. Food Hydrocolloids, 15(4-6), 407-414.
Seguro, K., Nio, N., & Motoki, M. (1996). Some characteristics of a microbial protein cross-
linking enzyme: Transglutaminase. In N. K. A. C. L. K. P. J. Parris (Ed.),
Macromolecular Interactions in Food Technology, vol. 650 (pp. 271-280).
Song, F., Tang, D. L., Wang, X. L., & Wang, Y. Z. (2011). Biodegradable soy protein isolate-
based materials: a review. Biomacromolecules, 12(10), 3369-3380.
Song, F., & Zhang, L. M. (2008). Enzyme-catalyzed formation and structure characteristics of a
protein-based hydrogel. Journal of Physical Chemistry B, 112(44), 13749-13755.
Sorrentino, A., Gorrasi, G., & Vittoria, V. (2007). Potential perspectives of bio-nanocomposites
for food packaging applications. Trends in Food Science & Technology, 18(2), 84-95.
Tang, C.H., & Jiang, Y. (2007). Modulation of mechanical and surface hydrophobic properties of
food protein films by transglutaminase treatment. Food Research International, 40(4),
504-509.
Tang, C. H., Choi, S. M., & Ma, C. Y. (2007). Study of thermal properties and heat-induced
denaturation and aggregation of soy proteins by modulated differential scanning
calorimetry. International Journal of Biological Macromolecules, 40(2), 96-104.
Tang, X. Z., Alavi, S., & Herald, T. J. (2008a). Barrier and mechanical properties of starch-clay
nanocomposite films. Cereal Chemistry, 85(3), 433-439.
Tang, X. Z., Alavi, S., & Herald, T. J. (2008b). Effects of plasticizers on the structure and
properties of starch-clay nanocomposite films. Carbohydrate Polymers, 74(3), 552-558.
Thanh, V. H., & Shibasaki, K. (1976a). Heterogeneity of beta-conglycinin. Biochimica Et
Biophysica Acta, 439(2), 326-338.

32
Thanh, V. H., & Shibasaki, K. (1976b). Major proteins of soybean seeds - straightforward
fractionation and their characterization. Journal of Agricultural and Food Chemistry,
24(6), 1117-1121.
Tsai, G. J., Lin, S. M., & Jiang, S. T. (1996). Transglutaminase from Streptoverticillium
ladakanum and application to minced fish product. Journal of Food Science, 61(6), 1234-
1238.
Utsumi, S., & Kinsella, J. E. (1985). Function relationships in food proteins: subunit interactions
in heat-induced gelation of 7S, 11S, and soy isolate proteins. Journal of Agricultural and
Food Chemistry, 33(2), 297-303.
Weiss, J., Takhistov, P., & McClements, D. J. (2006). Functional materials in food
nanotechnology. Journal of Food Science, 71(9), R107-R116.
Wolf, W. J. (1970). Soybean protiens - their functional, chemical, and physical properties.
Journal of Agricultural and Food Chemistry, 18(6), 969-&.
Xiang, L. X., Tang, C. Y., Cao, J., Wang, C. Y., Wang, K., Zhang, Q., Fu, Q., & Zhao, S. G.
(2009). Preparation and characterization of soy protein isolate (SPI)/montmorillonite
(MMT) bionanocomposites. Chinese Journal of Polymer Science, 27(6), 843-849.
Yang, Y., Zhu, Z. K., Yin, J., Wang, X. Y., & Qi, Z. E. (1999). Preparation and properties of
hybrids of organo-soluble polyimide and montmorillonite with various chemical surface
modification methods. Polymer, 40(15), 4407-4414.
Yildirim, M., & Hettiarachchy, N. S. (1998). Properties of films produced by cross-linking whey
proteins and 11S globulin using transglutaminase. Journal of Food Science, 63(2), 248-
252.

33
Zeng, Q. H., Yu, A. B., Lu, G. Q., & Paul, D. R. (2005). Clay-based polymer nanocomposites:
Research and commercial development. Journal of Nanoscience and Nanotechnology,
5(10), 1574-1592.
Zhao, R. X., Torley, P., & Halley, P. J. (2008). Emerging biodegradable materials: starch- and
protein-based bio-nanocomposites. Journal of Materials Science, 43(9), 3058-3071.
Zhu, Y., Bol, J., Rinzema, A., Tramper, J., & Wijngaards, G. (1999). Transglutaminase as a
potential tool in developing novel protein foods. Agro Food Industry Hi-Tech, 10(1), 8-
10.
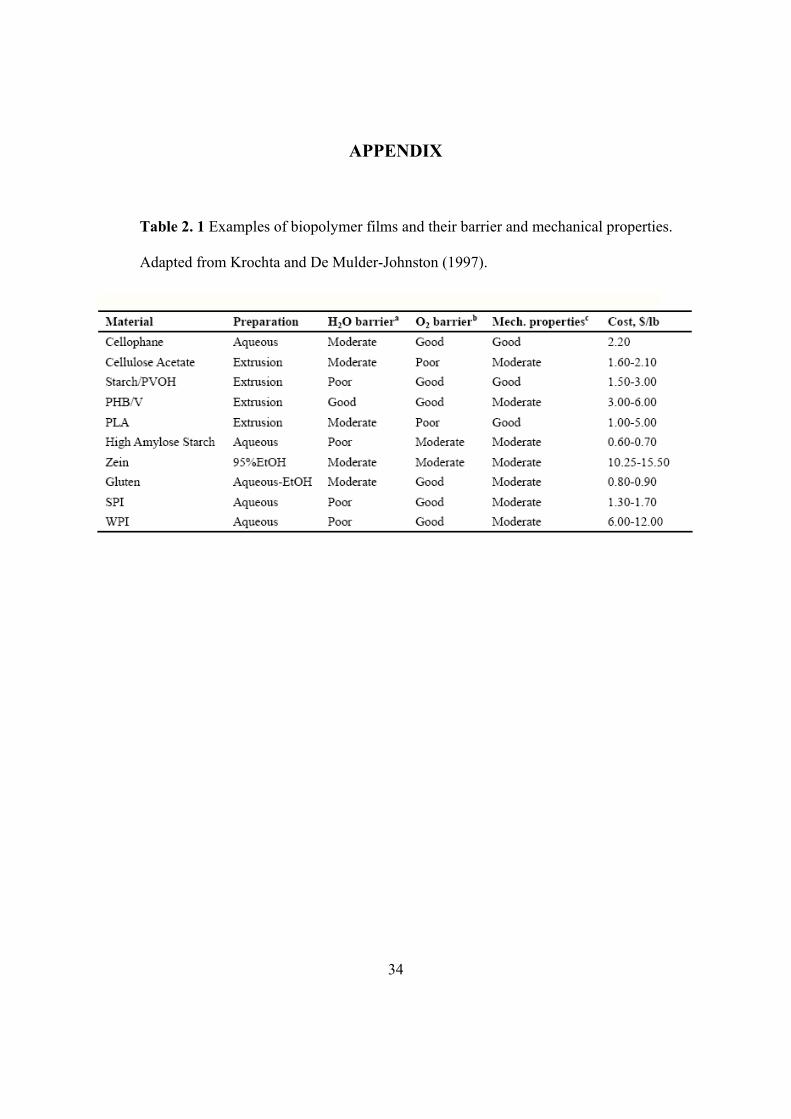
34
APPENDIX
Table 2. 1 Examples of biopolymer films and their barrier and mechanical properties.
Adapted from Krochta and De Mulder-Johnston (1997).

35
Table 2. 2 Functional properties performed by soy protein preparations in actual food
systems.
Adapted from Kinsella (1979).
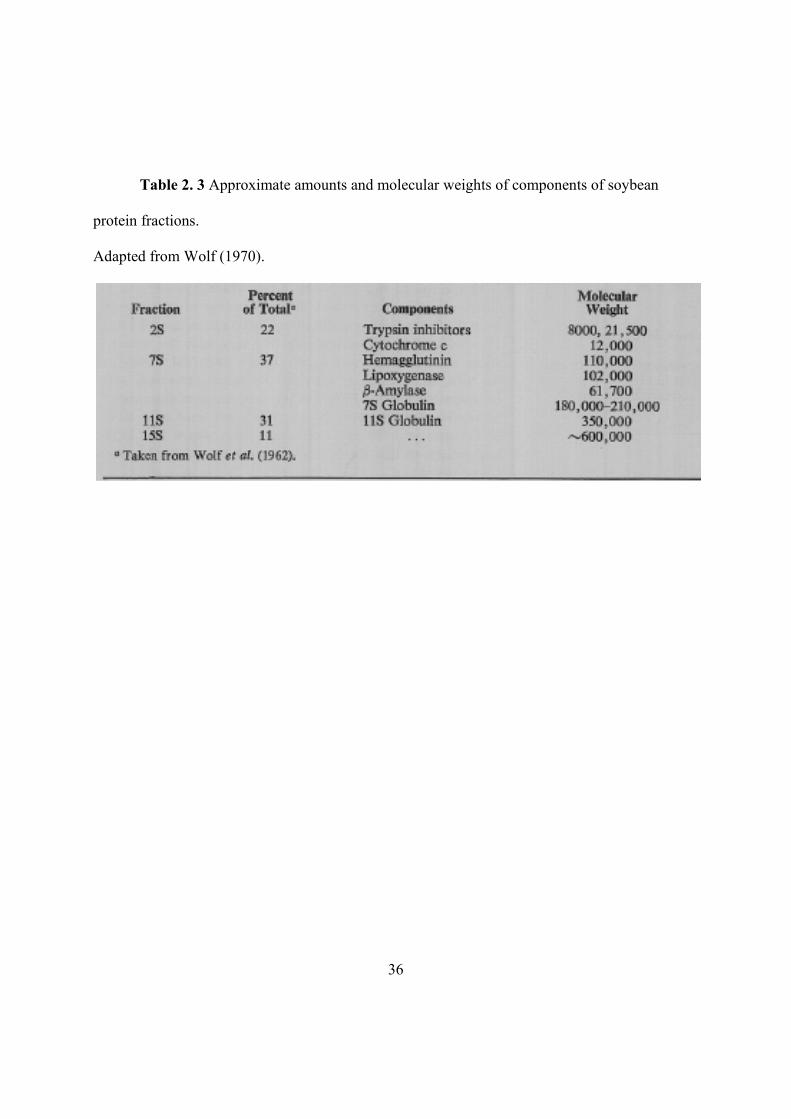
36
Table 2. 3 Approximate amounts and molecular weights of components of soybean
protein fractions.
Adapted from Wolf (1970).

37
Figure 2. 1. Structure of montmorillonite clay.
Adapted from Kumar (2009).

38
Figure 2. 2. Types of composites derived from interaction between clays and polymers:
(a) phase-separated microcomposite; (b) intercalated nanocomposite and (c) exfoliated
nanocomposite.
Adapted from Alexandre & Dubois (2000).
39
Figure 2. 3. List of chemicals containing aldehyde group.
Adapted from (Gerrard, et al., 2005).
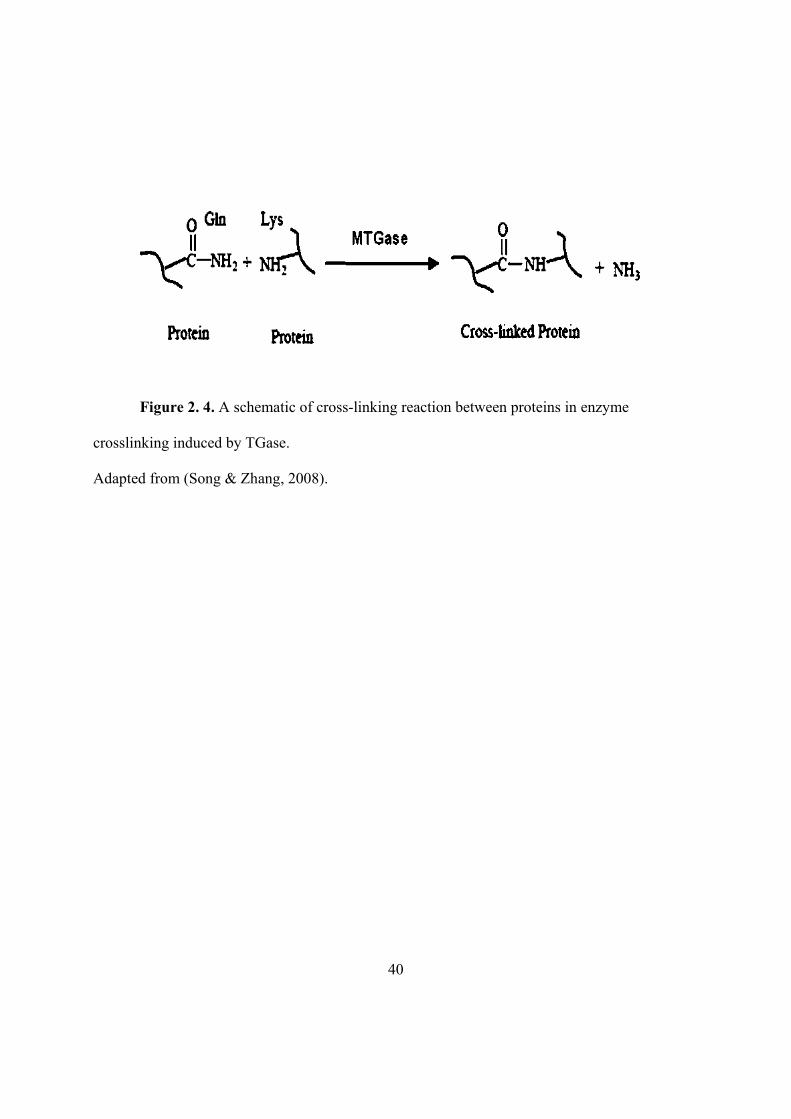
40
Figure 2. 4. A schematic of cross-linking reaction between proteins in enzyme
crosslinking induced by TGase.
Adapted from (Song & Zhang, 2008).
41
CHAPTER 3 . SURFACE-COATING OF MONTMORILLONITE NANOCLAYS BY WATER
SOLUBLE PROTEINS EXTRACTED FROM HOMINY FEED
42
3.1. ABSTRACT
Montmorillonite (MMT) nanoclay was surface-coated by water-soluble proteins,
precipitated from hominy feed extract at pH 6.0, 5.5, and 4.3, to modify its native structure.
Surface-coating was performed at 60 C, pH 2.0-10.0, and MMT:protein mass ratios from 49:1
to 2:1, followed by lyophilizing the triple-washed precipitate for characterization. Proteins
precipitated at pH 5.5 were most effective in developing intercalated and/or exfoliated MMT
structures that were also impacted by the protein level and pH during coating. At pH 2.0, X-ray
diffraction peaks of pristine MMT were no longer observed at an MMT:protein mass ratio of 4:1
or lower, while different degrees of intercalation were achieved at other pH conditions. The
adsorptions of proteins on MMT at all studied pH conditions were confirmed by FTIR, analysis
of adsorbed proteins, and zeta-potential. These results suggest that interactions involved in
coating MMT include coulombic and non-coulombic forces.
Keywords: layered montmorillonite nanoclay, surface-coating, hominy protein, pH, intercalation,
X-ray diffraction
43
3.2. INTRODUCTION
Natural biopolymers, including starches and proteins, have been studied extensively as
packaging materials in the past two decades because they are renewable and bio-degradable (Cao,
Fu, & He, 2007; Krochta & DeMulderJohnston, 1997; Le Corre, Bras, & Dufresne, 2010; Tang,
Alavi, & Herald, 2008a), thereby potentially alleviating environmental pollution derived from
non-degradable petroleum-based plastic products (Jahangir & Leber, 2007; Rimdusit, Jingjid,
Damrongsakkul, Tiptipakorn, & Takeichi, 2008). However, when compared to the petro-plastic
products, packaging films prepared from natural biopolymers have poor mechanical and barrier
properties such as rigidness, brittleness and high water vapor and gas permeabilities (Kim, Ko, &
Park, 2002; Krochta & DeMulderJohnston, 1997; Paetau, Chen, & Jane, 1994).
Nanocomposite materials recently have shown promises to improve mechanical and
barrier properties because nanometer-sized fillers with high surface area facilitate the uniform
distribution in and enhance the interfacial interaction with the biopolymer matrix (Adame &
Beall, 2009; Le Corre, Bras, & Dufresne, 2010; Zhao, Torley, & Halley, 2008). The composition,
dimension, and shape of nanofillers, as well as their spatial distribution in the matrix, are
important factors impacting the properties of nanocomposite products (Capek, 2006).
Layered nanoclays have been extensively investigated to improve mechanical and barrier
properties of biopolymer materials because of their availability, abundance and eco-friendliness
(Dang, Lu, Yu, Sun, & Yuan, 2010; Tunc, Angellier, Cahyana, Chalier, Gontard, & Gastaldi,
2007; Zhao, Torley, & Halley, 2008). As a naturally existing clay, montmorillonite (MMT) has
been one of the most studied nanofillers not only due to its low cost and abundance (Essington,
2003; Gunister, Pestreli, Unlu, Atici, & Gungor, 2007) but also because of the high surface area
and large aspect ratios (ratio of length to thickness) from 50 to 1000 (de Azeredo, 2009; Le Corre,

44
Bras, & Dufresne, 2010). The large aspect ratio of MMT is a very important factor enhancing the
properties of nanocomposites because, according to the theory of torturous path developed by
Nielsen (Nielsen, 1967), MMT layers dispersed in biopolymer film matrix increase the tortuosity
of the diffusion path for permeate molecules. The increased mass transfer resistance thereby
reduces the diffusion coefficient of permeate molecules and improves the barrier properties of
the nanocomposite films (Adame & Beall, 2009; Capek, 2006). Improving the dispersibility of
nanoclay layers and their compatibility with matrix biopolymer plays an important role in
developing the structures of final nanocomposite products, which in turn determines their
mechanical and barrier properties. It is well accepted that nanocomposites with intercalated
and/or exfoliated MMT nanolayers have much improved mechanical and barrier properties than
conventional composite materials prepared with fillers dispersed as micrometer-sized structures
(Le Corre, Bras, & Dufresne, 2010; Tang, Alavi, & Herald, 2008a).
Native MMT has platelet clusters with little specific surface area exposed to polymers
(Arora & Padua, 2010), but the proper pretreatment or modification of MMT enhances its
dispersion in the continuous phase and increases the surface area available for interaction with
bulk polymer, that in turn improves nanocomposite performance. Arora & Padus (Arora & Padua,
2010) reported that chemical modification of hydrophilic nanoclays to be possessing
hydrophobic surfaces improved the compatibility with hydrophobic polymers. Rimdusit et al.
(Rimdusit, Jingjid, Damrongsakkul, Tiptipakorn, & Takeichi, 2008) observed that proper pre-
swelling conditions promoted the dispersion of MMT and resulted in a highly exfoliated
nanocomposite with methylcellulose being the matrix polymer. Adsorption of amines and amino
acids was greater on marine sediments with a higher organic content, which changed surface
chemistry of clay matter to improve compatibility with organic compounds (Wang & Lee, 1993).

45
Thus, surface-coating of MMT with protein may modify the structure of MMT for the enhanced
affinity with bulk biopolymer and performance of the nanocomposite.
In this work, MMT was surface coated by water-soluble proteins extracted from hominy
feed, a low-cost byproduct after separating starch from corn kernels in the dry-milling industry,
in order to modify native structure of MMT nanoclay layers. In general, protein has a net zero
charge at the isoelectric point (pI), a net positive charge at a pH below pI and a net negative
charge at a pH above pI. MMT surface has highly negative charges (Chen & Zhang, 2006) that
allow the adsorption of positively-charged hominy proteins based on the electrostatic interactions.
The objective of this work was to study the effects of coating conditions such as pH and the mass
ratio of MMT:protein on properties of modified MMT, including surface properties, basal
spacing (d-spacing) and degrees of intercalation and/or exfoliation of MMT nanoclay. The prior-
intercalated or exfoliated MMT can be used in production of nanocomposite materials.
3.3. MATERIALS AND METHODS
3.3.1. Materials
Na+-montmorillonite, with a brand name of Cloisite® Na+ Nanoclay, was purchased from
Southern Clay Products, Inc. (Gonzales, TX) and had a cation exchange capacity of 92.6
mequiv/100g, according to the manufacturer. Hominy feed was a free sample from Bunge
Milling (Danville, IL). Other chemicals were from Fisher Scientific (Fair Lawn, NJ), Sigma-
Aldrich Co. (St. Louis, MO), or GE Healthcare (Amersham Biosciences Corp., Piscataway, NJ).
3.3.2. Extraction of Water Soluble Hominy Protein
The literature procedures and parameters for extracting proteins from soybean and corn
kernels were adopted (L'Hocine, Boye, & Arcand, 2006; Paulis, Bietz, & Wall, 1975). The

46
preliminary experiments showed a higher protein content for extracts prepared at a higher pH
value between 6.0 and 10.0. Thus, protein extraction in this study was conducted at pH 10.0.
Specifically, hominy feed was ground with a coffee grinder (Hamilton Beach Proctor-Silex, Inc.,
Southern Pines, NC) to decrease the particle size and enhance the extraction efficiency. To
remove lipids, the powder was suspended in hexane at a solid:liquid volume ratio of 1:4 for 30
min using a stirring plate followed by gravitational sedimentation, decanting the serum, and re-
suspending the slurry in hexane, which was repeated for at least 7 times. The defatted powder
was left in a fume hood overnight to evaporate hexane. The final powder was suspended in
deionized water at a solid:liquid mass ratio of 1:10, adjusted to pH 10.0 using 4 N NaOH, and
heated to 48 °C under constant agitation for 3 h (model Isotemp®, Fisher Scientific, Fair Lawn,
NJ). The extract was separated by centrifugation (Sorvall RC 5B Plus, Newtown, CT) at 3,778g
for 15 min at ambient temperature, followed by filtration twice with #2 filter paper (Whatman®,
Lawrence, KS). To improve the protein extraction yield, the extraction was repeated three times
on the same batch of defatted hominy feed powder. Since little information is available about the
acid-precipitation of water soluble hominy protein, the filtrate was adjusted to pH 6.0, 5.5 and
4.3, in sequence, using 6 N HCl to precipitate water soluble proteins. Protein precipitated at each
pH was separated by centrifugation at 3,778g for 30 min, and the supernatant was collected for
acidification to a lower pH. To wash off impurities, the precipitate from centrifugation was re-
suspended in deionized water, adjusted to pH 10.0, re-precipitated at the corresponding pH, and
centrifuged at 3,778g for 15 min. The washing procedures were repeated three times at ambient
temperature. The final precipitate was neutralized and freeze-dried (model Freezone 4.5,
Labconco Corp., Kansas City, MO). The lyophilized samples were collected and stored in a -20
°C freezer till further experiments.
47
To estimate the protein content, 0.1 g of lyophilized powder was dissolved in 2 mL of
deionized water, and the total protein content was determined according to the Bradford method.
A Coomassie Plus Protein Assay kit (product 23236, Pierce Biotechnology, Rockford, IL) was
used, and the absorbance was measured at 595 nm by using a UV/Vis spectrophotometer (model
Biomate 5, Thermo Electron Corporation, Woburn, MA). Bovine serum albumin (BSA) was
used as a reference. Triplicate tests were performed for each sample.
3.3.3. Characterization of Hominy Protein by Two-dimensional Gel Electrophoresis (2D-
GE)
The 2D-GE was conducted according to the method of GE Healthcare. To remove non-
protein impurities, the lyophilized powder was dissolved in a solubilization solution, consisting
of 2% sodium dodecyl sulfate (SDS), 40 mM Tris™ base and 60 mM dithiothreitol (DTT), and
concentrated using a 2-D Clean-up Kit (Amersham Biosciences Corp., Piscataway, NJ). The
protein content after clean-up was quantified with a Quant Kit (Amersham Biosciences Corp.,
Piscataway, NJ). The absorbance at 480 nm (BioTek Synergy HT, Winooski, VT) was applied to
determine protein content from the standard curve established from BSA standard solutions. The
concentrated protein sample was diluted with a re-hydration buffer to a final total volume of 200
μL and protein content estimated as 120 μg, which was used to rehydrate one 11-cm gel strip of
either pH 3-10 or pH 4-7 (Immobiline™ DryStrip gels, GE Healthcare, Piscataway, NJ). The
first dimension (isoelectric focusing, IEF) separation was conducted at steps of 500 V for 1 h, a
linear gradient increase in voltage to 1000 V in 1 h, another linear gradient increase of voltage to
6000 V in 2 h, and holding at 6000 V for approximately 30 min. The second dimension step was
performed using a linear polyacrylamide gel laboratory-prepared. Proteins on the gel strip were
reduced by 5 mL of 2% SDS buffer with 1% DTT for 15 min, and the separation was conducted

48
using the DALTsix gel electrophoresis instrument (GE Healthcare, Amersham Biosciences Corp.,
Piscataway, NJ) at a beginning voltage of 80 V for 1 h and then a running voltage of 500 V for
around 5 h till the bromophenol blue in EZ-Run™ Rec Protein Ladder marker (Fisher Scientific,
Fair Lawn, NJ) reached the gel bottom. The gels were stained in a mixture of methanol, acetic
acid and coomassie Blue and de-stained by methanol and acetic acid till satisfactory visibility of
protein spots, followed by scanned to obtain images.
3.3.4. Determination of Protein Solubility
To test the solubility of protein at coating conditions, 10 mg of the lyophilized extract
powder was dissolved in 10 mL of 10 mM NaH2PO4 buffer with 4 mM sodium chloride, which
corresponded to sodium ion concentration of 1% w/v MMT dispersion determined by atomic
absorption spectroscopy at Department of Plant Science, the University of Tennessee (Knoxville,
TN). After adjusting pH to 2.0-10.0 and centrifugation at 14,500g for 30 min, the supernatant
was determined for protein concentration using the bicinchoninic acid (BCA) method.
Commercial BCA™ Protein Assay Reagent A (product 23228, Pierce Biotechnology, Thermo
Scientific, Rockford, IL) was utilized, and reagent B (4%w/v cupric sulfate) was freshly
laboratory-prepared. The incubation was performed at 37 °C for 30 min, and the absorbance was
recorded at 562 nm by using a UV/Vis spectrophotometer (model Biomate 5, Thermo Electron
Corporation, Woburn, MA). BSA was used as a reference and tests were performed in triplicate
for each sample.
3.3.5. Surface Coating of MMT
Coating experiments were performed using a solution intercalation method at 60 °C (P.
Chen & Zhang, 2006). The lyophilized protein powder was dispersed in 10 mM NaH2PO4 buffer
and adjusted to a desired pH. The dispersion was heated to 60 °C and stirred at 300 rpm for 30
49
min using a stirring hot plate. A dispersion of MMT was similarly prepared in a separate beaker.
The MMT dispersion was slowly added to the protein solution to a predetermined MMT: protein
mass ratio (49:1, 9:1, 4:1, 3:1 or 2:1), while being vigorously agitated at 1000 rpm and
maintained at 60 °C. After stirring for 3 h at 60 °C, the resultant slurry was centrifuged at 3,778g
for 15 min at ambient temperature. The supernatant was decanted, while the precipitate was re-
suspended with the same amount of fresh buffer to wash off unbound and loosely bound proteins.
The washing procedure was repeated three times, and the supernatants from the three repetitions
were combined. Both the final precipitate and combined supernatant were freeze-dried (mode l
Freezone 4.5, Labconco Corp., Kansas City, MO). The lyophilized samples were collected and
stored in a -20 °C freezer for further characterization.
3.3.6. Determination of Amount of Protein Coated on MMT
The above lyophilized supernatant samples were dissolved in 10 mM NaH2PO4 buffer at
pH 9, followed by centrifugation at 14,500g for 30 min to remove fine MMT. The protein
remaining in the supernatant was measured using the BCA method and treated as the portion that
did not coat MMT. The amount of bound protein was then determined by mass balance – the
difference between the total protein used in coating and that unbound.
3.3.7. Zeta Potential of MMT
Zeta potential was determined for the final re-suspended precipitate in the above coating
experiments and bare MMT samples suspended in phosphate buffer at pH 2.0-10.0 using a
Delsa™ Nano C Zeta-Potential/Particle Size Analyzer (Beckman Coulter, Fullerton, CA). The
bare MMT suspensions adjusted to a target pH were also stirred at 60 °C for 3 h prior to analysis.
Three measurements were performed for each sample. Each measurement included 5 runs, each
run for 10 cycles.
50
3.3.8. Wide-angle X-Ray Diffraction (WXRD)
WXRD experiments were performed at ambient temperature using an X-ray
diffractometer (model X’Pert, PANalytical Inc., Westborough, MA) with a generator voltage of
45 kV and a current of 40 mA. The diffraction data was collected in the 2θ range from 2° to 12°
in a fixed time mode with an increment of 0.02°. The XRD patterns were obtained from the
X’Pert Data Viewer software (PANalytical Inc., Westborough, MA) as a function of 2θ angle.
The identification of peaks and determination of d-spacing according to Bragg’s equation
(Prabhat. Kumar, 2009) were assisted by using the X’Pert HighScore Plus software
(PANalytical Inc., Westborough, MA). The present experimental limit of detectable d-spacing
also was calculated using eq. 1 (Dang, Lu, Yu, Sun, & Yuan, 2010; Tang, Alavi, & Herald,
2008a) at a 2θ angle of 2°.
)sin(2
d (1)
where θ is the angle of incidence, and λ is the wavelength of X-ray beam, which is 1.54 Å.
3.3.9. Fourier Transform Infrared Spectroscopy (FTIR)
FTIR analyses were conducted using a spectrometer (model Nicolet 670, Thermo Nicolet,
Madison, WI) in the wavenumber range of 4000-400 cm-1 using a powdered potassium bromide
(KBr) pellet method (Chen & Zhang, 2006; Gunister, Pestreli, Unlu, Atici, & Gungor, 2007).
One mg of a sample and 100 mg of KBr were mixed and ground to fine powder that was then
pressed into a clear or translucent pellet for measurement. A pristine KBr pellet was used as a
background. The outputs were recorded in %Transmittance as a function of wavenumber.

51
3.3.10. Statistical Data Analysis
Data analyses were carried out by using SAS software (v. 9.3, SAS Institute Inc., Cary,
NC). Significant differences were analyzed with a least-significant-difference (P < 0.05) mean
separation method (LSD).
3.4. RESULTS AND DISCUSSION
3.4.1. Protein Extracted from Hominy Feed
The lyophilized powder mass corresponding to precipitation at pH 5.5 was about 2 and 5
times of that precipitated at pH 4.3 and 6.0, respectively. The protein content of freeze-dried
protein extracts precipitated at pH 4.3, 5.5, and 6.0 was 58.75, 54.00, and 51.03%, respectively.
The 2D-GE patterns of proteins precipitated at pH 4.3, 5.5 and 6.0 are presented in Figure 3.1.
The IEF was conducted at pH ranges of 3.0-10.0 and 4.0-7.0. Extracts precipitated at pH 4.3
(Figure 3.1C) and pH 5.5 (Figure 3.1B) both showed proteins corresponding to pI of 4.8-5.1 and
molecular weights of 13, 20 and 28 kDa and those with pI of 5.0-5.6 and molecular weights of
50 and 60-68 kDa, with the extract precipitated at pH 5.5 showing more proteins in the latter
group. In addition, the sample precipitated at pH 4.3 had some spots corresponding to molecular
weights of 80-90 kDa and pI of 4.8-5.0. As for the sample precipitated at pH 6.0 (Figure 3.1A),
although the same amount of purified protein was loaded onto the gel strip, it showed very few
spots on the gel, and most spots were located at molecular weights of 20-23 kDa and pI of 5.5-
6.2. Molecular weights of most protein spots were consistent with the reported range of 10-66
kDa for proteins extracted from the dry-milled corn germ (Parris, Moreau, Johnston, Singh, &
Dickey, 2006).

52
3.4.2. Coating of MMT at pH 2.0 Using Proteins Precipitated at Different pH Conditions
Theoretically, the highly negatively-charged MMT attracts the positively-charged
proteins by coulombic forces (Dang, Lu, Yu, Sun, & Yuan, 2010; Ding & Henrichs, 2002;
Essington, 2003; Wang & Lee, 1993). The first group of study was conducted at pH 2.0 where
most proteins in the lyophilized extract powder are expected to be positively charged based on
2D-GE (Figure 3.1). To simplify description, PP4.3, PP5.5, and PP6.0 refer to proteins
precipitated at pH 4.3, 5.5, and 6.0, respectively, while MP-4.3, -5.5, and -6.0 represent MMT
coated by PP4.3, PP5.5, and PP6.0, respectively, hereafter. Further, coating experiments were
performed by using a mass ratio of MMT:lyophilized extract powder for convenience of sample
preparation, and the lyophilized extract powder is substituted by “protein” hereafter, although the
powder has a significant portion of non-protein matter. This group of experiments was conducted
at an MMT:protein mass ratio of 2:1 and pH 2.0. After coating, MMT was collected by
centrifugation, triple-washed, and lyophilized. The lyophilized precipitates were characterized
for crystalline structures and d-spacing by XRD and interactions by FTIR.
3.4.2.1. XRD patterns
As indicated in Figure 3.2, the XRD patterns of lyophilized extract powders did not show
characteristic peaks in the 2θ range from 2° to 12°, indicating that all extract powders did not
have ordered structures detectable within this 2θ range. Figure 3.3 shows that bare MMT had a
sharp peak at 2θ of 7.1°, corresponding to d-spacing of 1.24 nm, characteristic for pristine MMT
(Tang, Alavi, & Herald, 2008a). The sharp peak of MMT was no longer observed for MP-4.3
and MP-5.5. The disappearance of characteristic peaks in XRD patterns is due to changes from
highly ordered structures to fully exfoliated or highly intercalated structures that are beyond the
detectable 2θ range, i.e., <2° in our study, corresponding to a d-spacing value bigger than 4.41

53
nm (Chen & Zhang, 2006; Dang, Lu, Yu, Sun, & Yuan, 2010; Tang, Alavi, & Herald, 2008a).
As for MP-6.0, a very broad and weak peak appeared at 2θ angle of ~ 6.5°, corresponding to a d-
spacing value of 1.35 nm. Although the increase of d-spacing from 1.24 to 1.35 nm was not big,
the onset 2θ angle shifted to left from 7.1° for pristine MMT to less than 5.0° for MP-6.0.
According to Bragg’s law, the shift of the diffraction peak towards a lower angle indicates the
formation of a bigger basal spacing of intercalated clay layers (Tang, Alavi, & Herald, 2008a).
Because dilution of MMT by other compounds may lead to the misinterpretation of XRD
patterns (Prabhat. Kumar, 2009), simple mixtures of MMT and protein powders at MMT:protein
mass ratios of 2:1-49:1 were also characterized by XRD. Results in Figure 3.4 showed that the
mixtures all demonstrated peaks corresponding to a 2θ angle of 7.0-7.1 and d-spacing values of
1.24-1.28 nm, very similar to that of the bare MMT (Figure 3.3). Therefore, coating of MMT by
hominy protein resulted in exfoliated and/or intercalated structures.
3.4.2.2. FTIR
FTIR spectra of proteins precipitated at different pH conditions (Figure 3.5) showed
characteristic peaks of proteins at wavenumbers of 3300 and 3110, 2925 and 2855, 1618-1681,
1530-1550 and 1244 cm-1, which are due to the absorbance by functional groups of C–H, amide I
(C=O stretching vibration), amide II (N-H bending and C-N stretching modes) and amide III
bands (C-N stretching and N-H bending), in possible structures of –CO-NH2, –CO-NH–, and/or
–CO-N– (P. Chen & Zhang, 2006; Nakasato, Ono, Ishiguro, Takamatsu, Tsukamoto, & Mikami,
2004; Servagent-Noinville, Revault, Quiquampoix, & Baron, 2000). Among these peaks, the
greatest difference between protein samples was observed at a wavenumber around 2855 cm-1,
which is attributed to C–H stretching vibration bands. PP4.3 had a smaller peak than PP5.5 and
PP6.0 at this wavenumber, indicating a smaller amount of –CH structure. In addition, relative
54
intensities of the double-peaks at 1450-1400 cm-1 are different, implying different ratios of
carboxyl (stronger peak at approximately 1450 cm-1) to carboxylate (stronger peak at
approximately 1410 cm-1) groups. Since all extracts were neutralized before freeze-drying, the
difference between double-peak intensities is then likely due to difference in compositions,
including proteins as revealed in 2D-GE (Figure 3.1).
The FTIR spectra of MP-4.3, MP-5.5 and MP-6.0 (Figure 3.5) showed major peaks at
wavenumbers of 2925, 2855, 1618-1681 and 1530-1550 cm-1, indicating the presence of proteins
in coated-MMT samples. The disappearance of peaks at 1244 cm-1 demonstrated the decreases in
α-helix structure and β-sheet of proteins (Cai & Singh, 2004; Wang, Ke, Wang, Xi, & Cui, 2010),
implying that secondary conformational changes in proteins occurred by adsorption on clay
surfaces (Quiquampoix & Burns, 2007; Servagent-Noinville, Revault, Quiquampoix, & Baron,
2000). Compared to the spectra of protein samples, the double-peak at 1450-1400 cm-1 on the
spectra of protein-coated MMT disappeared or was highly reduced, more significant for the
treatment coated with protein precipitated at a lower pH. This observation implies the reduction
of carboxyl or carboxylate groups, likely due to unpairing of some carboxylate side chains and
binding of cationic side group with negatively charged MMT surface (Quiquampoix & Burns,
2007; Servagent-Noinville, Revault, Quiquampoix, & Baron, 2000). Meanwhile, the peak
intensity of protein in coated MMT varied at wavenumbers of 1681-1618 cm-1, with a less
intensive peak at 1618 cm-1, implying a reduced amount of amide I band than that for the protein
sample (Servagent-Noinville, Revault, Quiquampoix, & Baron, 2000), agreeing with the
structure transition of protein induced by self-association after coating. Additionally, hydrogen
bonds can form between proteins and MMT platelets (Chen & Zhang, 2006), likely between
either the amide or ketone groups of proteins and Si-O-Si or –OH groups of MMT. Hydrogen
55
bonding between protein and MMT surface was observed by slightly enhanced peaks at
approximate 1100-1000 cm-1, when comparing with either bare MMT or bare protein samples
(Figure 3.5).
This group of experiments showed that PP4.3 and PP5.5 were more effective in surface-
coating MMT than PP6.0. PP4.3 and PP5.5 were used in the next group of experiments to further
study the impacts of coating pH and the MMT:protein mass ratio.
3.4.3. Effect of MMT:protein Mass Ratio on Surface-coating at pH 2.0
Our preliminary experiments at an MMT:protein mass ratio of 49:1 revealed that the
addition of an insufficient amount of protein did not alter the XRD pattern of MMT. For this
group of treatments, MMT was coated by PP4.3 and PP5.5 at pH 2.0 and additional
MMT:protein mass ratios of 9:1 and 4:1. Figure 3.6A illustrates XRD patterns for MMT coated
by PP4.3. Compared to the absence of the characteristic peak of MMT when coated at an
MMT:protein mass ratio of 2:1, samples prepared with the two higher MMT:protein mass ratios
demonstrated peaks appearing at 2 angles smaller than that of the pristine MMT - the left shift,
which is more noticeable at a smaller MMT:protein mass ratio, i.e., a higher protein mass level.
Correspondingly, the d-spacing increased with an increase in protein mass, from ca. 1.32 nm at
an MMT:protein mass ratio of 9:1 to 1.38 nm at an MMT:protein mass ratio of 4:1 (Table 3.1).
At the MMT:protein mass ratio of 4:1, although the increase of d-spacing was modest (from 1.24
to 1.38 nm), the onset 2θ angle was less than 4.5°, showing a significant left shift when
comparing to that of the pristine MMT (Figure 3.3), and the peak was overall much broader. The
left-shift of the diffraction peak indicates the formation of some intercalated clay layers with a
bigger basal spacing, according to the Bragg function (Tang, Alavi, & Herald, 2008a).
Furthermore, a broader peak implies more disordered intercalated structures (Kumar, 2009). The
56
results in Figure 3.6A indicated that a higher amount of protein facilitates the formation of a
higher extent of intercalated and/or exfoliated nanoclay platelet structures.
XRD patterns for MMT coated by PP5.5 are shown in Figure 3.6B. No peaks were
detected via the software at MMT:protein mass ratios of 2:1 and 4:1. As for the sample coated at
an MMT:protein mass ratio of 9:1, the diffraction peak also shifted to a lower 2θ angle and the d-
spacing was enlarged to 1.50 nm with a lower onset of 4.0° as shown in Table 3.1, significantly
different from those of pristine MMT. The FTIR spectra verified the coating of MMT by both
PP4.3 and PP5.5 (data not shown).
3.4.4. Effect of pH on Surface Coating
3.4.4.1. Effect of pH on the structure of bare MMT
To verify the pH effect on MMT structure, bare MMT powder was dispersed in
phosphate buffer and adjusted to pH 3.0, 5.0, 7.0, and 9.0, mixed at 60 C for 3 h and freeze-
dried to prepare powder for XRD. The lyophilized samples all showed a peak at the same 2θ
angle of 7.1° (Figure 3.7) and had a d-spacing of 1.24 nm, identical to those of pristine MMT
(Figure 3.3). Therefore, adjusting dispersion pH alone either does not change the structure of
MMT platelets or changes the structures, if any, that are completely reversible after hydration
and drying.
3.4.4.2. Structure of protein-coated MMT at different pH conditions
This group of experiments was conducted to study the impact of coating pH on MMT
properties. The PP5.5 was used because it was more effective than PP4.3 in changing MMT
structures (Figure 3.6). Further, because no XRD peaks were detected at MMT:protein mass
ratios of 2:1 and 4:1, an intermediate ratio of 3:1 was adopted.

57
The XRD patterns show a strong impact by the coating pH (Figure 3.8). No distinct peaks
were detected at pH 2.0 and 7.0, suggesting a higher extent of exfoliated and highly-disordered
intercalated MMT structures than those at other coating pH conditions. Disordered intercalation
was observed at pH 3.0, showing a very broad peak. At pH 4.0-6.0, peaks were easily detected at
a 2θ angle of 6.9-7.0° with a low onset at a 2θ angle of 3°, corresponding to d-spacing values
around 1.25-1.29 nm (Table 3.2) and thus some disordered or intercalated structures. Higher
degrees of intercalation occurred at pH 8.0-10.0, with a low onset of 3° and d-spacing of 1.93-
1.95 nm. As indicated in Figure 3.9, FTIR results showed peaks at wavenumbers of 2925, 2855,
1618-1681 and 1530-1550 cm-1, verifying the adsorption of protein on MMT surface at all
coating conditions. The disappearance of double-peaks at 1450-1400 cm-1 indicates the breakup
or unpairing of carboxylate and carboxyl groups.
The amount of unbound protein in the supernatant at different pH was also quantified, as
listed in Table 3.3. At pH 4.0 and 5.0 and alkali conditions (pH 8.0-10.0), a greater amount of
protein remained in the supernatant after coating. The least percentage of protein adsorbing onto
MMT was observed at pH 2.0, followed by treatments at pH 3.0, 7.0, and 6.0. The solubility of
PP5.5 was also quantified at coating conditions, as shown in Table 3.3. The lowest solubility
was observed at pH 4.0 and 5.0, followed by that at pH 6.0. Further, the solubility of PP5.5 was
not statistically different at pH 7.0 and above and greater than those at lower pH conditions. The
solubility data agrees with the 2D-GE results showing that the pI range of most proteins is 4.5-
6.2 (Figure 3.1). Thus, the absolute amount of protein adsorbed on the MMT platelets was lower
when proteins have poorer solubility (at pH 4.0 and 5.0) or extensively negative charges (at pH
8.0-10.0).

58
To understand the significance of electrostatic attraction on coating, the precipitates, after
triple washing, were re-suspended in the phosphate buffer at the corresponding pH for zeta
potential analysis. Zeta potential of both bare MMT and protein-coated MMT after coating was
less negative at a lower pH with significant difference (P < 0.05) when pH was below 4.0 (Figure
3.10). In this case, the zeta potential data agrees with the expectations that proteins have more
positive charges at a lower pH below pI and thus the negative charges of coated MMT were
partially neutralized by adsorbed proteins. Above pH 4.0, zeta potential values of bare MMT
were statistically different between two pH groups, i.e. pH 5.0-8.0 and pH 9.0-10.0, while no
statistical difference for protein-coated MMT samples. Zeta potential values of protein-coated
MMT were similar at pH above 4.0, especially at alkaline conditions. These results may be
explained with the complicated composition of the hominy protein extract. Hominy protein
extracted from hominy feed is a complex mixture of proteins with a wide range of molecular
weight of 10-98 kDa and narrow pI range of 4.5-6.2 (Figure 3.1). It has been observed that
proteins can still bind with polyelectrolytes although both polymers carry same types of net
charge, likely due to specific charged patches (opposite to polyelectrolytes) on protein surface
(Dickinson, 2003). This localized binding, along with hydrogen bonding between MMT and
protein (P. Chen & Zhang, 2006), resulted in coating of MMT by proteins at all studied
conditions in our study.
3.5. CONCLUSION
Water soluble proteins extracted from hominy feed are complex mixtures of proteins,
most of which have pI of 4.5-6.2 and molecular weight of 10-68 kDa. The PP5.5 had the best
surface coating effect among the three precipitates, as indicated by the greater extent of
59
disorderly intercalated and/or exfoliated strutures. The degree of intercalation or exfoliation of
MMT structures was affected by the amount of protein applied during coating, while pH did not
affect the d-spacing of bare MMT but affected the amount of protein adsorbing onto MMT and
the degree of exfoliated/intercalated platelets after coating. The presence of protein after coating
MMT at all pH conditions suggests that coating involved not only electrostatic attraction but
non-coulombic forces such as hydrogen bonding. This study demonstrated a simple coating
method to modify highly-ordered structures of pristine MMT to intercalated and/or exfoliated
structures. The protein-coated MMT may be utilized to manufacture bio-nanocomposite
materials with improved physical properties for applications such as bio-degradable packaging
films.

60
LIST OF REFERENCES
Adame, D., & Beall, G. W. (2009). Direct measurement of the constrained polymer region in
polyamide/clay nanocomposites and the implications for gas diffusion. Applied Clay
Science, 42(3-4), 545-552.
Arora, A., & Padua, G. W. (2010). Review: nanocomposites in food packaging. Journal of Food
Science, 75(1), R43-R49.
Cao, N., Fu, Y. H., & He, J. H. (2007). Preparation and physical properties of soy protein isolate
and gelatin composite films. Food Hydrocolloids, 21(7), 1153-1162.
Capek, I. (2006). Nanocomposite structures and dispersions : science and nanotechnology--
fundamental principles and colloidal particles
Chen, P., & Zhang, L. (2006). Interaction and properties of highly exfoliated soy
protein/montmorillonite nanocomposites. Biomacromolecules, 7(6), 1700-1706.
Dang, Q. Q., Lu, S. D., Yu, S., Sun, P. C., & Yuan, Z. (2010). Silk fibroin/montmorillonite
nanocomposites: effect of pH on the conformational transition and clay dispersion.
Biomacromolecules, 11(7), 1796-1801.
de Azeredo, H. M. C. (2009). Nanocomposites for food packaging applications. Food Research
International, 42(9), 1240-1253.
Dickinson, E. (2003). Hydrocolloids at interfaces and the influence on the properties of dipsersed
systems. Food Hydrocolloids, 17, 25-39.
Ding, X. L., & Henrichs, S. M. (2002). Adsorption and desorption of proteins and polyamino
acids by clay minerals and marine sediments. Marine Chemistry, 77(4), 225-237.
61
Essington, M. E. (2003). Soil and water chemistry: an intergrative approach CRC Press, LLC.
Boca Raton, FL.
Gunister, E., Pestreli, D., Unlu, C. H., Atici, O., & Gungor, N. (2007). Synthesis and
characterization of chitosan-MMT biocomposite systems. Carbohydrate Polymers, 67(3),
358-365.
Jahangir, S., & Leber, M. J. (2007). Biodegradable good packaging: an environmental imperative.
Industry Report, 1-20.
Kim, K. W., Ko, C. J., & Park, H. J. (2002). Mechanical properties, water vapor permeabilities
and solubilities of highly carboxymethylated starch-based edible films. Journal of Food
Science, 67(1), 218-222.
Krochta, J. M., & DeMulderJohnston, C. (1997). Edible and biodegradable polymer films:
challenges and opportunities. Food Technology, 51(2), 61-74.
Kumar, P. (2009). Development of bio-nanocomposite films with enhanced mechanical and
barrier properties using extrusion processing. North Carolina State University. Ph.D
dissertation.
L'Hocine, L., Boye, J. I., & Arcand, Y. (2006). Composition and functional properties of soy
protein isolates prepared using alternative defatting and extraction procedures. Journal of
Food Science, 71(3), C137-C145.
Le Corre, D., Bras, J., & Dufresne, A. (2010). Starch nanoparticles: a review.
Biomacromolecules, 11(5), 1139-1153.
Nakasato, K., Ono, T., Ishiguro, T., Takamatsu, M., Tsukamoto, C., & Mikami, M. (2004).
Rapid quantitative analysis of the major components in soymilk using fourier transform
infrared spectroscopy (FT-IR). Food Science and Technology Research, 10(2), 137-142.
62
Nielsen, L. E. (1967). Models for the permeability of filled polymer systems. Journal of
Macromolecular Science: Part A - Chemistry, 1(5), 14.
Paetau, I., Chen, C. Z., & Jane, J. L. (1994). Biodegradable plastics made from soybean
products.1. effect of preparation and processings on mechanical-properties and water-
absorption. Industrial & Engineering Chemistry Research, 33(7), 1821-1827.
Parris, N., Moreau, R. A., Johnston, D. B., Singh, V., & Dickey, L. C. (2006). Protein
distribution in commercial wet- and dry-milled corn germ. Journal of Agricultural and
Food Chemistry, 54(13), 4868-4872.
Paulis, J. W., Bietz, J. A., & Wall, J. S. (1975). Corn protein subunits: molecular weights
determined by sodium dodecyl sulfate-polyacrylamide gel-electrophoresis. Journal of
Agricultural and Food Chemistry, 23(2), 197-201.
Quiquampoix, H., & Burns, R. G. (2007). Interactions between proteins and soil mineral surfaces:
Environmental and health consequences. Elements, 3(6), 401-406.
Rimdusit, S., Jingjid, S., Damrongsakkul, S., Tiptipakorn, S., & Takeichi, T. (2008).
Biodegradability and property characterizations of Methyl Cellulose: Effect of
nanocompositing and chemical crosslinking. Carbohydrate Polymers, 72(3), 444-455.
Servagent-Noinville, S., Revault, M., Quiquampoix, H., & Baron, M. H. (2000). Conformational
changes of bovine serum albumin induced by adsorption on different clay surfaces: FTIR
analysis. Journal of Colloid and Interface Science, 221(2), 273-283.
Tang, X. Z., Alavi, S., & Herald, T. J. (2008). Barrier and mechanical properties of starch-clay
nanocomposite films. Cereal Chemistry, 85(3), 433-439.
63
Tunc, S., Angellier, H., Cahyana, Y., Chalier, P., Gontard, N., & Gastaldi, E. (2007). Functional
properties of wheat gluten/montmorillonite nanocomposite films processed by casting.
Journal of Membrane Science, 289(1-2), 159-168.
Wang, X. C., & Lee, C. (1993). Adsorption and desorption of aliphatic-amines, amino-acids and
acetate by clay-minerals and marine-sediments. Marine Chemistry, 44(1), 1-23.
Zhao, R. X., Torley, P., & Halley, P. J. (2008). Emerging biodegradable materials: starch- and
protein-based bio-nanocomposites. Journal of Materials Science, 43(9), 3058-3071.
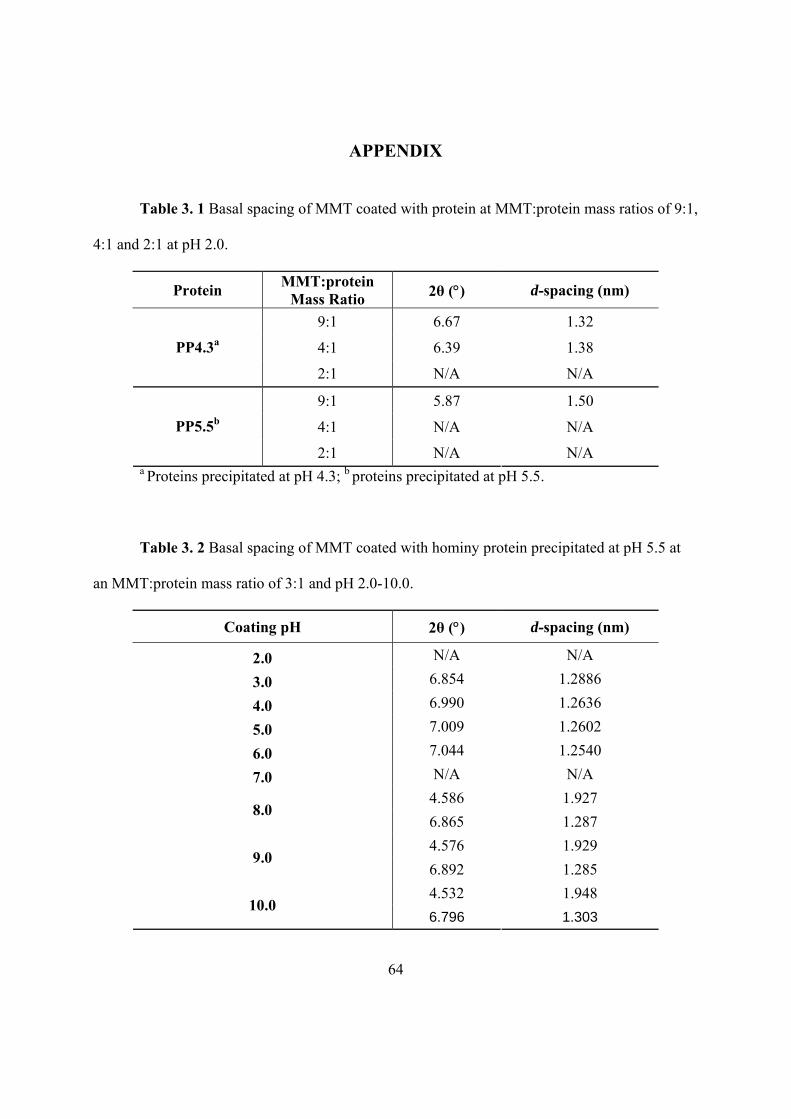
64
APPENDIX
Table 3. 1 Basal spacing of MMT coated with protein at MMT:protein mass ratios of 9:1,
4:1 and 2:1 at pH 2.0.
Protein MMT:protein
Mass Ratio 2θ () d-spacing (nm)
9:1 6.67 1.32
4:1 6.39 1.38 PP4.3a
2:1 N/A N/A
9:1 5.87 1.50
4:1 N/A N/A PP5.5b
2:1 N/A N/A a Proteins precipitated at pH 4.3; b proteins precipitated at pH 5.5.
Table 3. 2 Basal spacing of MMT coated with hominy protein precipitated at pH 5.5 at
an MMT:protein mass ratio of 3:1 and pH 2.0-10.0.
Coating pH 2θ () d-spacing (nm)
2.0 N/A N/A
3.0 6.854 1.2886
4.0 6.990 1.2636
5.0 7.009 1.2602
6.0 7.044 1.2540
7.0 N/A N/A
4.586 1.927 8.0
6.865 1.287
4.576 1.929 9.0
6.892 1.285
4.532 1.948 10.0
6.796 1.303
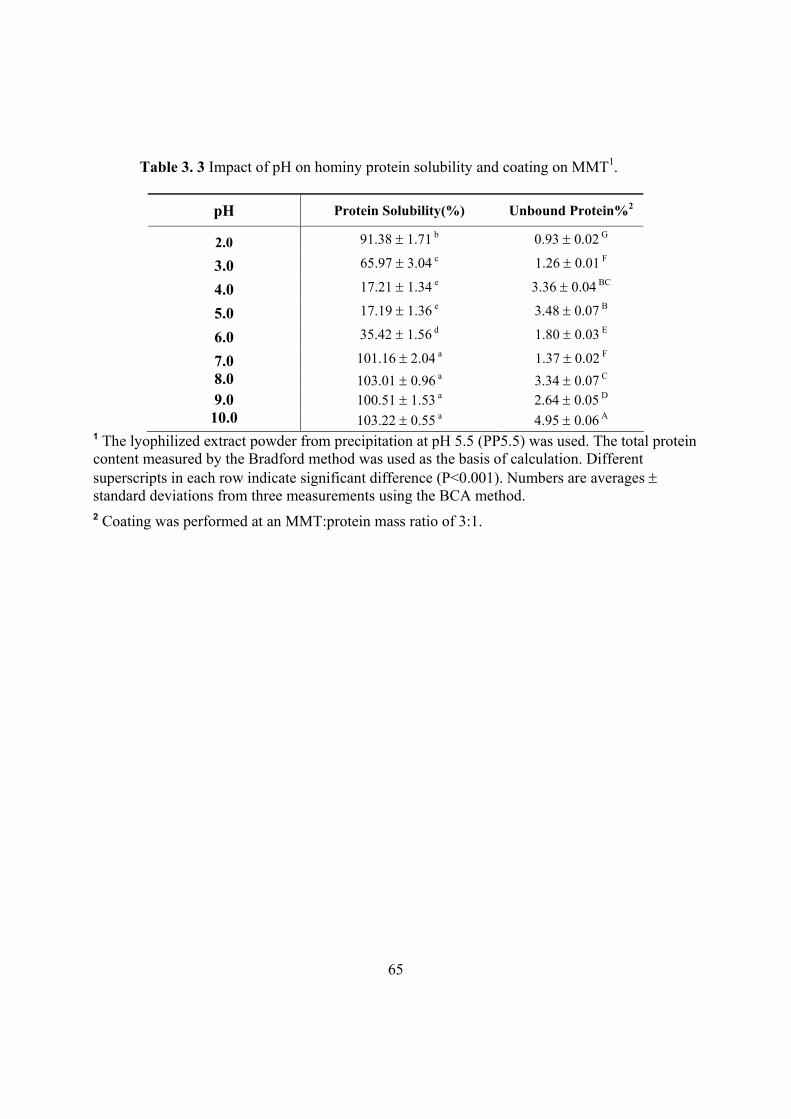
65
Table 3. 3 Impact of pH on hominy protein solubility and coating on MMT1.
pH Protein Solubility(%) Unbound Protein%2
2.0 91.38 1.71 b 0.93 0.02 G
3.0 65.97 3.04 c 1.26 0.01 F
4.0 17.21 1.34 e 3.36 0.04 BC
5.0 17.19 1.36 e 3.48 0.07 B
6.0 35.42 1.56 d 1.80 0.03 E
7.0 101.16 2.04 a 1.37 0.02 F 8.0 103.01 0.96 a 3.34 0.07 C 9.0 100.51 1.53 a 2.64 0.05 D
10.0 103.22 0.55 a 4.95 0.06 A 1 The lyophilized extract powder from precipitation at pH 5.5 (PP5.5) was used. The total protein content measured by the Bradford method was used as the basis of calculation. Different superscripts in each row indicate significant difference (P<0.001). Numbers are averages standard deviations from three measurements using the BCA method. 2 Coating was performed at an MMT:protein mass ratio of 3:1.
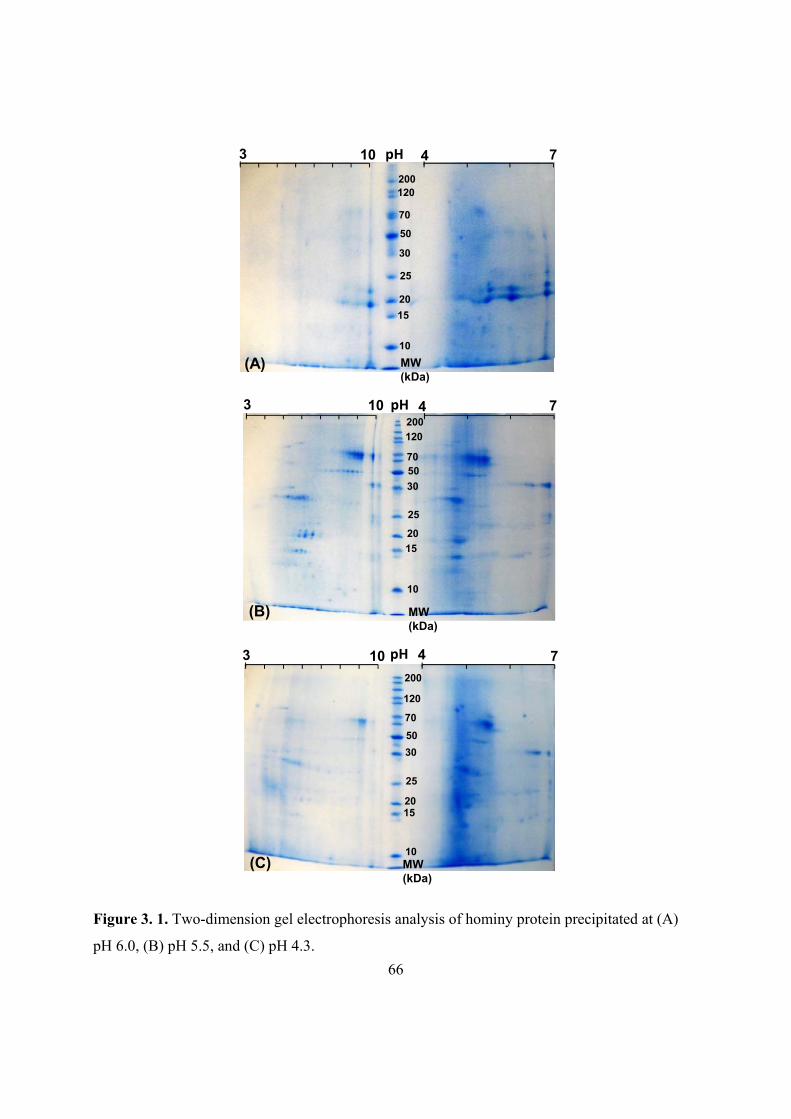
66
3 10 4 7
MW (kDa)
(A)10
15
20
25
30
50
70
120200
pH
3 10 4 7
MW (kDa)
10
15
20
25
30
5070
120
200
pH
(B)
3 10 4 7
MW (kDa)
10
1520
25
30
50
70
120
200
pH
(C)
Figure 3. 1. Two-dimension gel electrophoresis analysis of hominy protein precipitated at (A)
pH 6.0, (B) pH 5.5, and (C) pH 4.3.
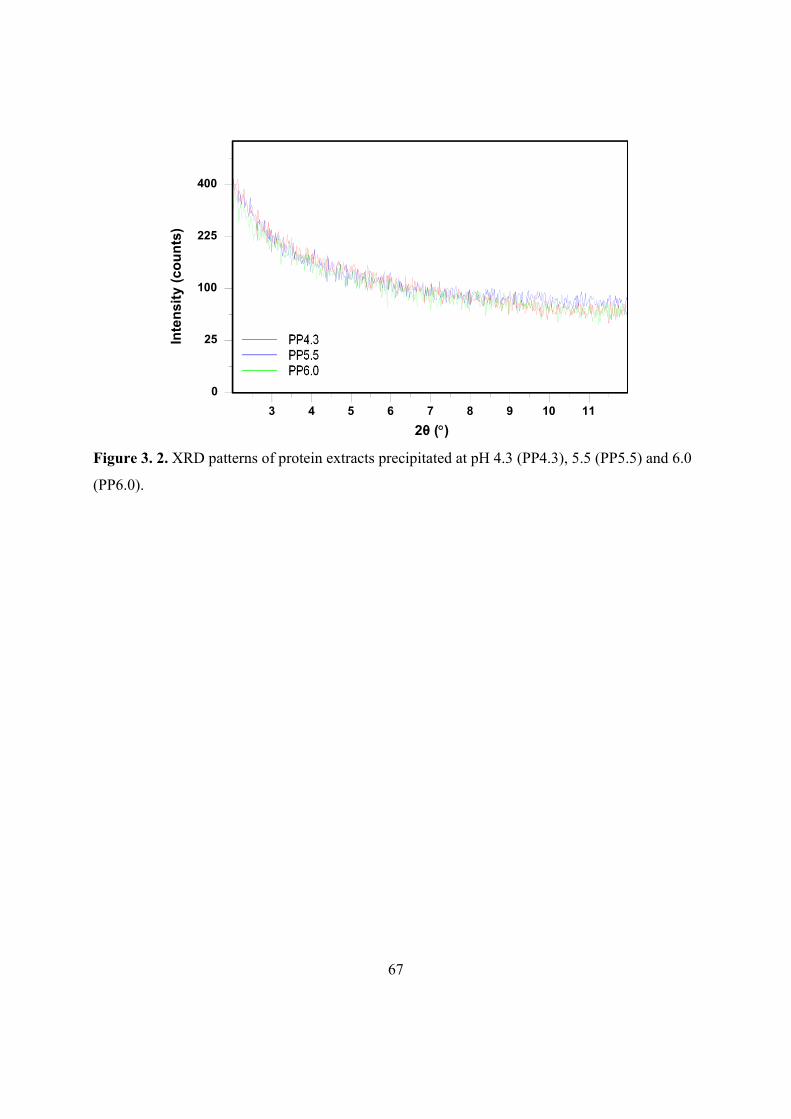
67
2θ ()
Inte
nsi
ty (
cou
nts
)
3 4 5 6 7 8 9 10 11
0
25
100
225
400
Figure 3. 2. XRD patterns of protein extracts precipitated at pH 4.3 (PP4.3), 5.5 (PP5.5) and 6.0
(PP6.0).
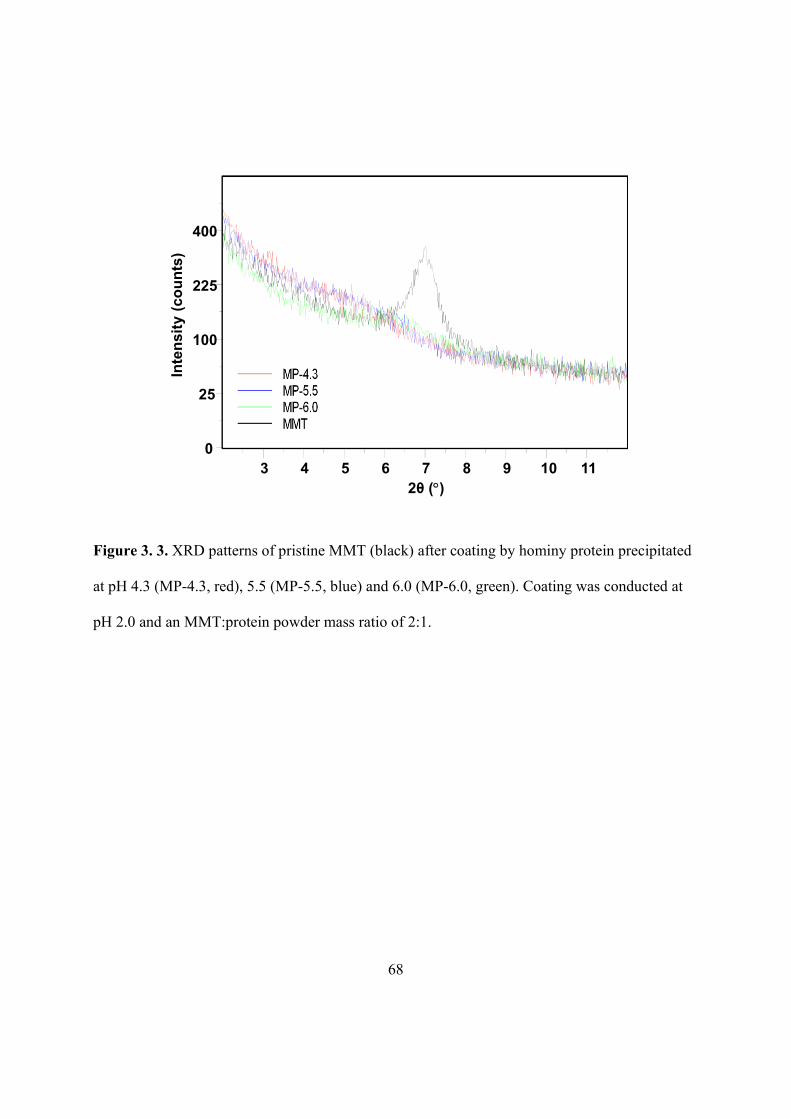
68
2θ ()
Inte
nsi
ty (
cou
nts
)
3 4 5 6 7 8 9 10 110
25
100
225
400
Figure 3. 3. XRD patterns of pristine MMT (black) after coating by hominy protein precipitated
at pH 4.3 (MP-4.3, red), 5.5 (MP-5.5, blue) and 6.0 (MP-6.0, green). Coating was conducted at
pH 2.0 and an MMT:protein powder mass ratio of 2:1.
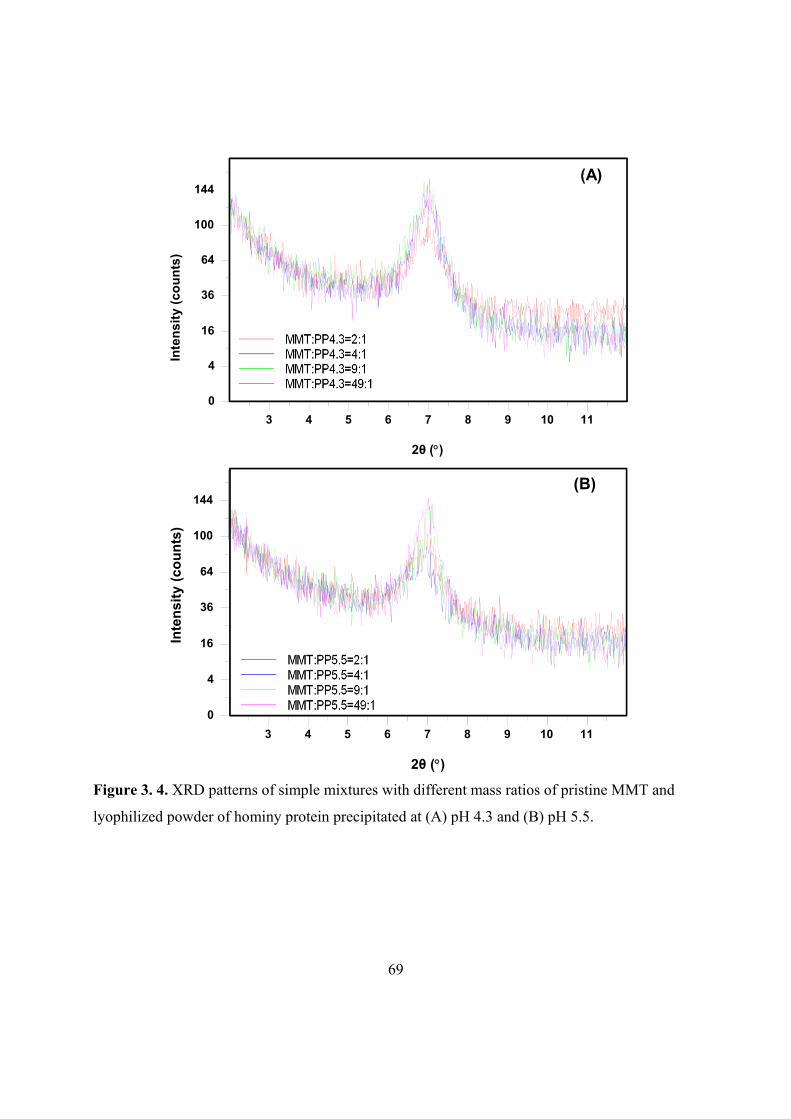
69
(A)
3 4 5 6 7 8 9 10 11
0
4
16
36
64
100
144
2θ ()
Inte
nsi
ty (
cou
nts
)
(B)
3 4 5 6 7 8 9 10 11
0
4
16
36
64
100
144
2θ ()
Inte
nsi
ty (
cou
nts
)
(B)
Figure 3. 4. XRD patterns of simple mixtures with different mass ratios of pristine MMT and
lyophilized powder of hominy protein precipitated at (A) pH 4.3 and (B) pH 5.5.

70
4000 3500 3000 2500 2000 1500 1000 500
Wavenumber (cm-1)
0
40
80
120
160
%T
ran
smit
tan
ce
(A)
(B)
4000 3500 3000 2500 2000 1500 1000 500
Wavenumber (cm-1)
%T
ran
smit
tan
ce
30
10
50
70
90
(C)
4000 3500 3000 2500 2000 1500 1000 500
Wavenumber (cm-1)
%T
ran
smit
tan
ce
30
10
50
70
90
110
Figure 3. 5. Comparison of FTIR spectra of pristine MMT (blue), protein (purple), and protein-coated MMT (red). Coating was perormed at pH 2.0 and an MMT:protein powder mass ratio of 2:1 using proteins precipitated at pH (A) 4.3, (B) 5.5 and (C) 6.0. Arrows are used to highlight the peaks discussed in the text.
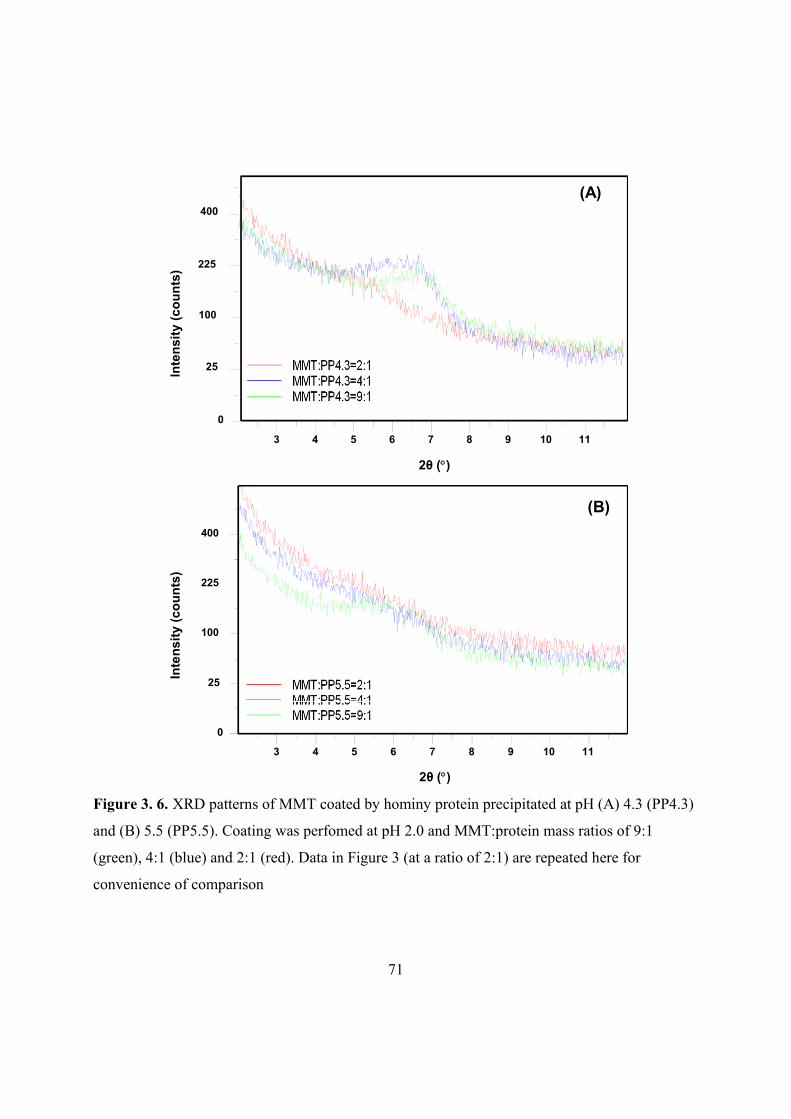
71
(A)
3 4 5 6 7 8 9 10 11
0
25
100
225
400
2θ ()
Inte
nsi
ty (
cou
nts
)
3 4 5 6 7 8 9 10 11
0
25
100
225
400
2θ ()
Inte
nsi
ty (
cou
nts
)
(B)
Figure 3. 6. XRD patterns of MMT coated by hominy protein precipitated at pH (A) 4.3 (PP4.3)
and (B) 5.5 (PP5.5). Coating was perfomed at pH 2.0 and MMT:protein mass ratios of 9:1
(green), 4:1 (blue) and 2:1 (red). Data in Figure 3 (at a ratio of 2:1) are repeated here for
convenience of comparison

72
2θ ()
3 4 5 6 7 8 9 10 11
0
400
1600
3600
6400In
ten
sity
(co
un
ts)
Figure 3. 7. XRD patterns of MMT powder freeze-dried from MMT suspensions in 10 mM
NaH2PO4 buffer adjusted to pH 3.0, 5.0, 7.0, and 9.0 and mixed at 60C for 3 h. 2θ =7.11. D-
spacing = 1.24 nm.

73
2θ ()
3 4 5 6 7 8 9 10 11
0
25
100
225
Inte
nsi
ty (
cou
nts
)
(A)
2θ ()
(B)
3 4 5 6 7 8 9 10 11
0
25
100
225
Inte
nsi
ty (
cou
nts
)
2θ ()
3 4 5 6 7 8 9 10 11
0
25
100
225
400
Inte
nsi
ty (
cou
nts
)
(C)
Figure 3. 8. XRD patterns of MMT coated with hominy protein at varied pH conditions: (A) pH
2.0-4.0, (B) pH 5.0-7.0, and (C) pH 8.0-10.0 with an MMT:protein mass ratio of 3:1 using
hominy protein precipitated at pH 5.5.

74
4000 3500 3000 2500 2000 1500 1000 500
Wavenumber (cm-1)
20
10
30
40
%T
ran
smit
tan
ce
(A)
4000 3500 3000 2500 2000 1500 1000 500
Wavenumber (cm-1)
(B)
%T
ran
smit
tan
ce
10
0
20
30
40
50
(C)
4000 3500 3000 2500 2000 1500 1000 500
Wavenumber (cm-1)
20
10
30
40
%T
ran
smit
tan
ce
0
Figure 3. 9. FTIR spectra of MMT coated by hominy protein precipitated at pH 5.5. Coating was perfomed at an MMT:protein mass ratio of 3:1 and (A) pH 2.0 (blue), 3.0 (purple), and 4.0 (red), (B) pH 5.0 (blue), 6.0 (purple), and 7.0 (red) and (C) pH 8.0 (blue), 9.0 (purple), and 10.0 (red). Arrows are used to highlight the peaks discussed in the text.

75
2 3 4 5 6 7 8 9 10-50
-40
-30
-20
-10
0
MMT onlyMMT coated by hominy protein
Zet
a p
ote
nti
al (
mV
)
pH
a
a abbc c
cc
dd
A
B
CCD
CD
DD
DD
Figure 3. 10. Comparison of zeta potential of bare MMT and protein-coated MMT at pH 2.0-
10.0. Coating was conducted at an MMT:protein powder mass ratio of 3:1 using protein
precipitated at pH 5.5.
Error bars are standard deviations for duplicate coating experiments, each measured for three
times. Different letters in each group indicate significant difference (P < 0.001).

76
CHAPTER 4 . STRUCTURE MODIFICATION OF MONTMORILLONITE NANOCLAYS BY SURFACE-
COATING WITH SOY PROTEIN
77
4.1. ABSTRACT
To achieve exfoliated and/or intercalated structures, montmorillonite (MMT) was
surface-coated by soy protein at 60 C, MMT:soy protein powder mass ratios of 49:1, 9:1, 4:1 or
2:1, and pH 2.0-10.0. The protein-coated MMT was triple-washed and lyophilized for
characterization. MMT structural modification was observed using protein coating at all pH
conditions, based on X-ray diffraction, Fourier transform infrared spectroscopy, and zeta
potential analyses, as well as the quantification of proteins remaining in the continuous phase
and present in triple-washed MMT. At a mass ratio of 4:1, more than 90% protein bound with
MMT, with the largest d-spacing at pH 9.0. When the mass ratio was reduced to 2:1, protein-
coated MMT at pH 9.0 demonstrated the highest degree of intercalation/exfoliation,
corresponding to the disappearance of the diffraction peak characteristic of pristine MMT. This
study thus demonstrated that intercalation/exfoliation of MMT can be easily achieved by coating
with low cost soy protein for manufacturing nanocomposite materials.
Keywords: layered montmorillonite nanoclay, surface-coating, soy protein, intercalation, X-ray
diffraction
78
4.2. INTRODUCTION
Concerns of fossil fuel depletion, increase of petroleum price, and negative
environmental impact of persistent petro-plastic wastes have been the driving forces in
investigating bio-plastic packaging based on renewable, low-cost, and degradable biopolymers
(Jahangir & Leber, 2007; Sorrentino, Gorrasi, & Vittoria, 2007; Zhao, Torley, & Halley, 2008).
The annual growth of bio-plastics has been ca. 17-20% since 2006, and the global demand for
bio-plastics is estimated to quadruple by 2013 (Markets, 2011). Some major retailers, including
Coca-Cola, Frito-Lay and Walmart, have already adopted bio-plastic bottles, pouches and wraps
(Marsh & Bugusu, 2007).
According to a report, poly-lactic-acid synthesized from monomers derived from corn
starch has been a dominating polymer in manufacturing bioplastics, but materials from sources
such as microorganisms and algae and advanced technologies such as nanotechnology are
emerging in bioplastic industry (Markets, 2011). Nanocomposites, composed of nano-scale
fillers uniformly dispersed in a polymer matrix, have the promise to improve mechanical, barrier
and thermo-resistance properties of natural biopolymer-based packaging films (Arora & Padua,
2010; Dang, Lu, Yu, Sun, & Yuan, 2010; de Azeredo, 2009). These properties are currently
technological challenges of developing bio-packaging to replace conventional petro-plastics.
Montmorillonite (MMT) is one of the most popular layered silicates in developing biopolymer-
based nanocomposites because of its low cost, abundance (Essington, 2003; Gunister, Pestreli,
Unlu, Atici, & Gungor, 2007), large surface area, and large specific aspect ratios estimated to be
around 50-1000 (Arora & Padua, 2010; de Azeredo, 2009; Zhao, Torley, & Halley, 2008).
Proteins have been extensively studied as film-forming biopolymers in the past two
decades (Cuq, Gontard, & Guilbert, 1998; Kumar, Sandeep, Alavi, Truong, & Gorga, 2010a,

79
2010b; Paetau, Chen, & Jane, 1994; Xiang, et al., 2009). Protein films have lower water vapor
permeabilities and better oxygen barrier properties than starch films (Cao, Fu, & He, 2007; de
Azeredo, 2009; Zhao, Torley, & Halley, 2008). However, when comparing to petro-plastics,
protein films have poor mechanical properties such as brittleness, rigidness and low elongation
percentage and relatively low moisture and gas resistance, but these properties can be improved
by incorporation of nanoclays (Arora & Padua, 2010; Krochta & DeMulderJohnston, 1997; Song,
Tang, Wang, & Wang, 2011). Studies on structure-property relationship have repeatedly
illustrated that nanocomposite materials with either intercalated or exfoliated MMT nanolayers
have much improved mechanical and barrier properties than conventional composite materials
containing the fillers dispersed as micrometer-sized structures (Chen & Zhang, 2006; Kumar,
Sandeep, Alavi, Truong, & Gorga, 2010a; Le Corre, Bras, & Dufresne, 2010; Tang, Alavi, &
Herald, 2008a).
Dispersion behavior of MMT particles plays an important role on MMT structural
formation in nanocomposites (Yang, Zhu, Yin, Wang, & Qi, 1999). Generally speaking, because
an enlarged d-spacing (distance between clay layer platelets) favors the penetration of polymer
chains, MMT with the bigger d-spacing is much easier to be transformed to intercalated or
exfoliated structures in final nanocomposites. To enlarge d-spacing, strategies have been
developed by chemically modifying surface properties of MMT or physically coating MMT with
molecules (Feng, Zhao, Gong, & Yang, 2004; Mallakpour & Dinari, 2011; Yang, Zhu, Yin,
Wang, & Qi, 1999). Intercalation agents have been studied for amino acids, primary aliphatic
amines and quaternary ammonium (Yang, Zhu, Yin, Wang, & Qi, 1999) and sequential steps of
hydrochloric acid and bovine serum albumin (Lin, Wei, Juang, & Tsai, 2007). The prior-
exfoliated or -intercalated MMT structures can then be used to produce nanocomposite materials,
80
with the possibility to maximize the extent of exfloliation/intercalation of MMT to further
improve mechanical and barrier properties.
The affinity of proteins and amino acids on soil minerals is well established (Ding &
Henrichs, 2002; Quiquampoix & Burns, 2007), implying the possibility of surface coating MMT
with naturally occurring low-cost proteins for direct exfoliation/intercalation. The objective of
this work was thus to study the feasibility to directly surface-coat MMT by soy protein to
increase the d-spacing and obtain intercalation and/or exfoliation of MMT layers. In addition to
the mass ratio of MMT:soy protein, experiments were conducted at different pH conditions that
are expected to directly impact surface properties of MMT and soy protein based on electrostatic
interactions.
4.3. MATERIALS AND METHODS
4.3.1. Materials
Na+-MMT (Cloisite® Na+ Nanoclay) with a cation exchange capacity of 92.6
mequiv/100g was purchased from Southern Clay Products, Inc. (Gonzales, TX). Defatted soy
flour was a product from MP Biomedicals, LLC (Solon, OH). Bovine serum albumin (BSA) and
BCA™ Coomassie Plus Reagent A were ordered from Pierce Biotechnology (Rockford, IL).
Other chemicals were from Thermo-Fisher Scientific Inc. (Fair Lawn, NJ) or Sigma-Aldrich
Corp. (St. Louis, MO). Chemicals were used as received.
4.3.2. Extraction of Soy Protein
Soy protein was extracted from soy flour using the protocol of preparing soy protein isolate
(L'Hocine, Boye, & Arcand, 2006). Soy flour after further size-reduction with a coffee grinder
(Hamilton Beach Proctor-Silex, Inc., Southern Pines, NC) was suspended in deionized water at a
81
solid:liquid mass ratio of 1:10, adjusted to pH 9.0 using 4 N NaOH, and heated to 48 °C for 3-h
extraction using a magnetic stirring hot plate (model Isotemp®, Fisher Scientific, Fair Lawn, NJ).
The extract was separated by centrifugation (Sorvall RC 5B Plus, Newtown, CT) at 3,778g for
15 min at ambient temperature, followed by sequentially filtering with #1 and #2 filter papers
(Whatman®, Lawrence, KS), twice for each. The same batch of soy flour powder was extracted
three times to improve the protein extraction yield. The three filtrates were combined and
acidified to pH 4.5 by using 6 N HCl, and the precipitate was separated by centrifugation at
3,778g for 30 min at ambient temperature. The precipitate was re-dispersed in deionized water,
adjusted to pH 9.0, and re-precipitated at pH 4.5. The re-precipitation was repeated for two
additional times to remove impurities. The final precipitate was re-dispersed, neutralized, and
spray-dried using a B-290 Mini Spray Dryer (BÜCHI Labortechnik AG, Postfach, Switzerland)
at inlet and outlet temperatures of 150 and 55-65 C, respectively, and a feed rate of 6.67
mL/min. The spray dried soy protein powder (SPP) was collected and stored in a -20 °C freezer.
4.3.3. Surface Coating of MMT
MMT was surface-coated by SPP using a solution intercalation method (Chen & Zhang,
2006). Two groups of experiments were performed to investigate the effects of MMT:SPP mass
ratio and coating pH. The first group was conducted at pH 2.0-10.0 at an MMT:SPP mass ratio
of 4:1. In the second group, the MMT:SPP mass ratios of 49:1, 9:1, 4:1 and 2:1 were studied at
pH 9.0 – the extraction pH where all proteins are soluble. Briefly, SPP and MMT dispersions
were separately prepared in 10 mM NaH2PO4 buffer according to the mass ratio, adjusted to a
desired pH, and preheated to 60C. The MMT dispersion was slowly added into the SPP
dispersion while being stirred at 1000 rpm using a magnetic stirring hot plate. The slurry was
vigorously agitated at the same speed for 3 h with the temperature maintained at 60 °C. After

82
centrifugation at 3,778g for 15 min at ambient temperature, the supernatant was collected, and
the precipitate was re-suspended in the same volume of fresh buffer to remove the unbound and
loosely bound proteins. The washing step was repeated three times, and the supernatants were
combined and centrifuged at 10,000g for 30 min to remove the fine MMT. Both the final
precipitate and combined supernatant were freeze-dried (VirTis AdVantage Plus EL-85
Benchtop Freeze Dryer, SP Scientific Inc., Gardiner, NY). The lyophilized samples were
collected and stored in a -20 °C freezer till further characterization.
4.3.4. Determination of Amount of Protein Coated on MMT
The above lyophilized supernatant samples were dissolved in 10 mM NaH2PO4 buffer at
pH 9.0 for determining unbound protein using the bicinchoninic acid (BCA) method. The
percentage of unbound protein was then calculated by normalizing to the total protein used in
coating, also measured using the BCA method. Commercial BCA™ Protein Assay Reagent A
was utilized, and reagent B (4%w/v cupric sulfate) was freshly prepared. The incubation was
conducted at 37 °C for 30 min, and the absorbance was measured at 562 nm by using a UV/Vis
spectrophotometer (model Biomate 5, Thermo Electron Corporation, Woburn, MA). BSA was
applied as a reference to establish a standard curve. Triplicate tests were performed for each
sample.
The amount of bound protein, in the lyophilized clay precipitate (coated MMT) samples
from coating experiments, was determined for the total nitrogen content using the Dumas method
by Atlantic MicroLab, Inc. (Norcross, GA). The nitrogen content was converted to protein
content by multiplying with the Jones’ factor, 6.25 for soy protein (Mariotti, Tome, & Mirand,
2008). The percentage of bound protein was then calculated after dividing by the total protein
83
used in coating. For consistency, the protein content of SPP in this calculation was also
determined by the Dumas method.
4.3.5. Determination of Protein Solubility
SPP was hydrated in 10 mM NaH2PO4 buffer with 4 mM NaCl to a final concentration of
1 mg/mL and adjusted to pH 2.0-10.0 using 1 N HCl or NaOH. The 4 mM NaCl was equivalent
to the free sodium ion concentration in 1%w/v MMT dispersion measured by using atomic
absorption spectroscopy at Department of Plant Sciences, the University of Tennessee
(Knoxville, TN). After centrifugation at 10,000g for 30 min, the supernatant was determined for
protein concentration using the above BCA method. The protein solubility was then calculated as
the percentage of the protein remaining in the supernatant with respect to the total protein
content in SPP determined by the Dumas method.
4.3.6. Zeta Potential
The final precipitates in the above coating experiments were suspended in the phosphate
buffer, adjusted to pH 2.0-10.0 using 1 N HCl or NaOH, and measured for zeta potential using a
Delsa™ Nano C Zeta Potential and Particle Size Analyzer (Beckman Coulter, Fullerton, CA). To
characterize zeta potential of the bare MMT under coating conditions, 1%w/v MMT was
suspended in phosphate buffer, adjusted to a corresponding pH, heated and stirred for 3 h at 60
°C, and cooled to room temperature before testing. Triplicate measurements were conducted for
each sample. Each measurement included 5 runs, each run for 10 cycles.
4.3.7. Wide-angle X-ray Diffraction (WXRD)
An X-ray diffractometer (model X’Pert, PANalytical Inc., Westborough, MA) with a
generator voltage of 45 kV, a current of 40 mA, and a wavelength of 1.54 Å was used to conduct
WXRD analyses at ambient temperature. The XRD patterns were obtained in the 2θ angle range
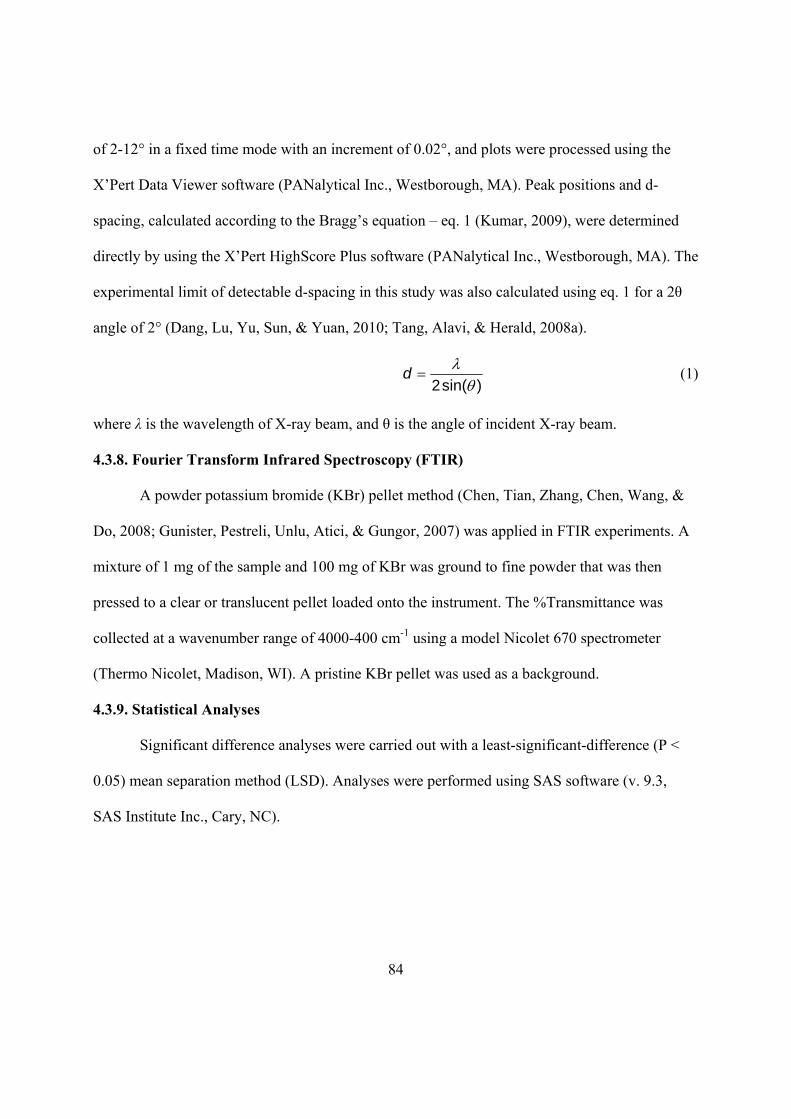
84
of 2-12° in a fixed time mode with an increment of 0.02°, and plots were processed using the
X’Pert Data Viewer software (PANalytical Inc., Westborough, MA). Peak positions and d-
spacing, calculated according to the Bragg’s equation – eq. 1 (Kumar, 2009), were determined
directly by using the X’Pert HighScore Plus software (PANalytical Inc., Westborough, MA). The
experimental limit of detectable d-spacing in this study was also calculated using eq. 1 for a 2θ
angle of 2° (Dang, Lu, Yu, Sun, & Yuan, 2010; Tang, Alavi, & Herald, 2008a).
)sin(2
d (1)
where λ is the wavelength of X-ray beam, and θ is the angle of incident X-ray beam.
4.3.8. Fourier Transform Infrared Spectroscopy (FTIR)
A powder potassium bromide (KBr) pellet method (Chen, Tian, Zhang, Chen, Wang, &
Do, 2008; Gunister, Pestreli, Unlu, Atici, & Gungor, 2007) was applied in FTIR experiments. A
mixture of 1 mg of the sample and 100 mg of KBr was ground to fine powder that was then
pressed to a clear or translucent pellet loaded onto the instrument. The %Transmittance was
collected at a wavenumber range of 4000-400 cm-1 using a model Nicolet 670 spectrometer
(Thermo Nicolet, Madison, WI). A pristine KBr pellet was used as a background.
4.3.9. Statistical Analyses
Significant difference analyses were carried out with a least-significant-difference (P <
0.05) mean separation method (LSD). Analyses were performed using SAS software (v. 9.3,
SAS Institute Inc., Cary, NC).
85
4.4. RESULTS AND DISCUSSION
4.4.1. Structures of MMT Coated by SPP at Different pH Conditions
4.4.1.1. XRD
XRD patterns of pristine MMT and SPP are presented in Figure 4.1. Pristine MMT had a
sharp characteristic peak at a 2θ angle of 7.11° with a d-spacing value of 1.24 nm, consistent
with the literatures (Essington, 2003; Tang, Alavi, & Herald, 2008a), while SPP did not have any
diffraction peaks in the studied 2θ range.
Figure 4.2 shows the XRD patterns of MMT samples coated at pH 2.0-10.0 with an
MMT:SPP mass ratio of 4:1. Table 4.1 lists the d-spacing values of corresponding samples. A
very weak peak was observed at pH 2.0, corresponding to a d-spacing value of 1.33 nm. At pH
3.0-5.0, sharp peaks appeared at 2θ angles of 6.63-7.08°, close to the characteristic peak for
pristine MMT (Figure 4.1), and the d-spacing values were around 1.25-1.27 nm, slightly smaller
than that at pH 2.0. At pH 6.0 or 7.0, two peaks were detected at 2θ of ca. 4.3 and 6.9°,
corresponding to d-spacing values of 2.09 and 1.27 nm at pH 6.0, and 2.01 and 1.27 nm at pH
7.0. Humps with low onset of ca. 3° and 2θ angle of ca. 4.2-4.4° were observed for MMT coated
by SPP at pH 8.0-10.0, corresponding to d-spacing values of 1.99-2.12 nm (Table 4.1), without
the sharp peak of pristine MMT. When bare MMT was similarly treated at coating conditions
without SPP, XRD patterns did not demonstrate any changes (data not shown).
The shifting of diffraction peak to a small 2 angle, the left-shift, and incresed d-spacing
are characteristics of intercalated layer structures (Tang, Alavi, & Herald, 2008a). A greater
extent of the left shift corresponds to a bigger d-spacing value. Thus, the treatment of pH 2.0
resulted in more intercalated MMT structures than other pH treatments. When analyzed using 2-
dimensional sodium-dodecyl sulfate polyacrylamide gel electrophoresis (results not shown),
86
most proteins corresponded to pI of 4.4-5.1 and molecular weight of 15-100 kDa, consistent with
the literature (Liu, Zhou, Tian, & Gai, 2007; Wu, Zhang, Kong, & Hua, 2009). Therefore, at pH
2.0, SPP carries more positive charges than other pH conditions, which facilitates the adsorption
onto negatively charged MMT surface upon mixing. As for samples at pH 6.0 and 7.0, the
existence of two peaks implied the occurrence of partially intercalated MMT. At pH 8.0-10.0,
broad peaks at low onset of ca. 3° imply a high extent of intercalated MMT structures (Kumar,
2009). Therefore, XRD patterns in Figure 4.2 indicate that intercalation of MMT occurred after
coating by SPP at all pH conditions but the extent was pH-dependent.
4.4.1.2. FTIR
FTIR spectra of pristine MMT and SPP are demonstrated in Figure 4.3. Characteristic
peaks of proteins appeared at wavenumbers of 2925, 2855, 1618-1681, 1530-1550, 1244, and
1450-1400 cm-1. The former five peaks are due to absorbances by functional groups of –CH2, –
CH (C-H stretching), amide I band (C=O stretching vibration), amide II band (N-H bending and
C-N stretching modes), and amide III band (C-N stretching and N-H bending), involving
possible structures of–CO-NH2, –CO-NH–, and/or –CO-N– (P. Chen & Zhang, 2006; Nakasato,
Ono, Ishiguro, Takamatsu, Tsukamoto, & Mikami, 2004; Servagent-Noinville, Revault,
Quiquampoix, & Baron, 2000). The double peaks at 1450-1400 cm-1 are related with carboxyl (at
ca. 1450 cm-1) and carboxylate groups (at ca. 1410 cm-1).
Figure 4.4 shows the FTIR spectra of MMT after coating by SPP at different pH
conditions. The presence of peaks corresponding to wavenumbers of 2925, 2855, 1618-1681 and
1530-1550 cm-1 confirms the absorbed proteins on MMT after surface coating. The peak of SPP
at 1244 cm-1 (Figure 4.3) disappeared after coating MMT (Figure 4.4), demonstrating the
changes of protein secondary conformational structures such as α-helix and β-sheet after
87
adsorption on MMT (Cai & Singh, 2004; Quiquampoix & Burns, 2007; Servagent-Noinville,
Revault, Quiquampoix, & Baron, 2000; Wang, Ke, Wang, Xi, & Cui, 2010). Peaks at
wavenumbers of 1450-1400 cm-1 varied for samples coated at different pH conditions, while
peaks at 1410 cm-1 disappeared for the ones at acidic pHs, but strengthened at alkaline pHs,
illustrating more carboxylate groups formed at more basic conditions. Changes in relative
intensities of the double peaks, i.e. the ratio of carboxyl to carboxylate groups, additionally
indicate changes of protein structures after adsorption on MMT (Quiquampoix & Burns, 2007;
Servagent-Noinville, Revault, Quiquampoix, & Baron, 2000).
In addition, more hydrogen bonds formed at lower pH, demonstrated by broader peaks at
wavenumbers of 3550-3230 cm-1 that are characteristic of hydroxyl group (Chen & Zhang, 2006).
Hydrogen bonds can be formed between Si-O-Si and –OH groups of MMT and polar groups of
proteins such as amide. The Si-O absorbance band occurs at wavenumbers of ~1120-1014 cm-1
and the disordering of clay platelets results in the intensity increase (Chen & Zhang, 2006). The
broad peaks at wavenumbers of both 3550-3230 and ~1120-1014 cm-1 in Figure 4.4A illustrate
the significance of hydrogen bonding between MMT platelets and soy proteins at highly acidic
conditions.
4.4.1.3. Total protein coated on MMT
The amount of protein coating MMT was estimated by both the percentages remaining in
the supernatant and those in the precipitate (Table 4.2). Despite discrepancy, two sets of results,
calculated by different protein assay methods, showed more than 90% protein bound with MMT
and there was no apparent trend of pH impact. Further, although Table 4.2 showes the lowest
solubility at pH 4.0, the amount of protein binding MMT was not the smallest. The two major
soy protein fractions, glycinin and β-conglycinin, are composed of different subunits. Glycinin

88
has 6 acidic subunits of ca. 35 kDa and 6 basic units of ~20 kDa (Badley, Atkinson, Hauser,
Oldani, Green, & Stubb, 1975), while β-conglycinin is a trimer corresponding to 60, 67 and 71
kDa (Maruyama, et al., 1998). The association and dissociation of these subunits are dependent
on pH, temperature, and reducing agents, etc. (Badley, Atkinson, Hauser, Oldani, Green, &
Stubb, 1975; Maruyama, et al., 1998) and likely impact the coating results. It however should be
noted that charged patches on protein surface may allow the binding with polyelectrolytes that
have a same type of net charge as proteins (Dickinson, 2003). Even at high pH of above 10.0 –
far away from the pI of soy protein, the existence of positively charged amino acids such as
lysine, histidine and arginine, accounting for ca. 14.77-15.39 g/100 g of soy protein despite the
varieties of soybeans (Wang, Gao, Zhang, Zhang, Li, He, et al., 2010; Wang, Tang, Yang, & Gao,
2008), contributes to the electrostatic attraction with MMT. Since the charged amino acid
residues are mainly located on the surface of protein molecules (Tang, Chen, & Ma, 2009), the
electrostatic binding of soy proteins on MMT at pH above pI should not be excluded.
Nevertheless, the protein adsorption data again suggests the significance of both coulumbic
(electrostatic attraction) and non-coulumbic forces.
4.4.1.4. Zeta potential
As shown in Figure 4.5, bare MMT dispersed in phosphate buffer had negative charges at
all pH conditions. Zeta potential values of the soy protein-coated MMT were less negative than
those of bare ones. Soy protein had zeta potential values ranging approximately from +30 to -50
mV, being positive at pH below pI and negative at pH above pI (Malhotra & Coupland, 2004).
Below pH 5.0, soy proteins are positively charged, and the adsorption of soy proteins on MMT is
expected to lower the absolute value of zeta potential of MMT due to the partial charge
neutralization, more apparent at a lower pH. Above pH 5.0, soy proteins are overall negatively

89
charged, but more than 90% were adsorbed on MMT (Table 4.2). The adsorption due to both
coulumbic and non-coulumbic mechanisms, as discussed above, is reflected by increased zeta-
potential value of MMT after coating. Further, the less negative charges of protein-coated MMT
at alkaline pH than that of bare MMT suggests that the SPP surface-coated on MMT partially
neutralized the negative charges on MMT surface by some positively-charged patches on the
surface of protein molecules.
4.4.2. Effect of MMT:SPP Mass Ratio on MMT Structure Coated by SPP at pH 9.0
Because pH 9.0 was used in extraction, verified for good solubility of SPP (Table 4.2)
and corresponded to the largest d-spacing (Table 4.1), this pH was used to study the impact of
MMT:SPP mass ratios, shown in Figure 4.6 for XRD patterns and Table 4.3 for d-spacing values.
Two diffraction peaks were detected for samples prepared with MMT:SPP mass ratios of 49:1
and 9:1: one similar to that of the pristine MMT and the other showing a left-shift to a lower 2
angle. The corresponding d-spacing values were 2.30 and 1.24 nm at the mass ratio of 9:1 and
2.64 and 1.27 nm at the mass ratio of 49:1. When comparing to a single peak at a mass ratio of
4:1, as discussed above, the insufficient amount of soy protein only enabled partial intercalation
of MMT platelets at MMT:SPP mass ratios of 49:1 and 9:1. When the MMT:SPP mass ratio was
decreased to 2:1, corresponding to an increased protein mass level, the diffraction peak of
pristine MMT at 2θ angle of 7.11° was no longer detected. The disappearance of the diffraction
peak characteristic of pristine MMT generally can be caused by formation of either fully
exfoliated or highly intercalated structures that are beyond the detection limit of the set 2θ range
(Dang, Lu, Yu, Sun, & Yuan, 2010), which was 2°, corresponding to a d-spacing value of 4.41
nm.
90
To clarify that the disappearance of the characteristic peak was not caused by dilution of
MMT with SPP (Kumar, 2009), simple mixtures of MMT and SPP at mass ratios from 2:1 to
49:1 were also characterized by XRD. All mixtures demonstrated a peak corresponding to a 2θ
angle of 6.9-7.3° (Figure 4.7) with d-spacing values of 1.21-1.28 nm (Table 4.3), very similar to
that of pristine MMT (Figure 4.1). Thus, the changes in XRD patterns of coated MMT at
different mass ratios are due to intercalation and/or exfoliation of platelets, and the larger d-
spacing at a smaller MMT:SPP mass ratio, i.e., a higher protein mass level, is likely caused by
increased possibility for protein chains to penetrate into MMT galleries to separate clay platelets
(Tang, Alavi, & Herald, 2008a). The results from XRD have been repeatedly verified by
structures assessed by structures assessed by transmission electron microscopy (Kumar, 2009;
Tang, Alavi, & Herald, 2008a) that was thus not attempted in this study.
This group of samples was also characterized for FTIR that had similar features as
discussed previously (data not shown), verifying the presence of proteins on MMT after coating
and the multiple interactions between MMT and proteins. Similarly, zeta potential was measured
for samples prepared with various MMT:SPP mass ratios. As depicted in Figure 4.8, a higher
SPP mass level corresponded to a less negative zeta potential, indicating an increased amount of
soy proteins adsorbed on MMT, in turn, enhanced charge neutralization on MMT surfaces. This
group of study strengthens the conclusion that the proteins coated on MMT involves both
coulumbic and non-coulumbic forces.
4.5. CONCLUSION
MMT was modified from highly ordered to highly intercalated or exfoliated structures
after surface coating by a sufficient amount of soy protein. The percentage of protein binding on
91
MMT exceeded 90% at an MMT:SPP mass ratio of 4:1, regardless of coating pH conditions. The
binding was caused by both electrostatic interactions and non-coulumbic forces such as hydrogen
bonding between MMT and soy protein, which was verified by complimentary results from XRD,
FTIR, and zeta-potential analyses, as well as quantifications of unbound and bound proteins. The
present study thus demonstrated that intercalation/exfoliation of MMT can be easily achieved by
coating using low-cost soy protein. The practical approach can be integrated in preparation of
various nanocomposite materials.
92
LIST OF REFERENCES
Arora, A., & Padua, G. W. (2010). Review: nanocomposites in food packaging. Journal of Food
Science, 75(1), R43-R49.
Badley, R. A., Atkinson, D., Hauser, H., Oldani, D., Green, J. P., & Stubb, J. M. (1975). The
structure, physical and chemical properties of the soy bean protein glycinin. Biochim
Biophys Acta, 412, 214-428.
Cao, N., Fu, Y. H., & He, J. H. (2007). Preparation and physical properties of soy protein isolate
and gelatin composite films. Food Hydrocolloids, 21(7), 1153-1162.
Chen, P., Tian, H. F., Zhang, L., Chen, Y., Wang, X. Y., & Do, Y. M. (2008). Structure and
properties of soy protein/alumina hydrate nanocomposites fabricated via in situ synthesis.
Journal of Biobased Materials and Bioenergy, 2(3), 248-257.
Chen, P., & Zhang, L. (2006). Interaction and properties of highly exfoliated soy
protein/montmorillonite nanocomposites. Biomacromolecules, 7(6), 1700-1706.
Cuq, B., Gontard, N., & Guilbert, S. (1998). Proteins as agricultural polymers for packaging
production. Cereal Chemistry, 75(1), 1-9.
Dang, Q. Q., Lu, S. D., Yu, S., Sun, P. C., & Yuan, Z. (2010). Silk fibroin/montmorillonite
nanocomposites: effect of pH on the conformational transition and clay dispersion.
Biomacromolecules, 11(7), 1796-1801.
de Azeredo, H. M. C. (2009). Nanocomposites for food packaging applications. Food Research
International, 42(9), 1240-1253.
Dickinson, E. (2003). Hydrocolloids at interfaces and the influence on the properties of dipsersed
systems. Food Hydrocolloids, 17, 25-39.
93
Ding, X. L., & Henrichs, S. M. (2002). Adsorption and desorption of proteins and polyamino
acids by clay minerals and marine sediments. Marine Chemistry, 77(4), 225-237.
Essington, M. E. (2003). Soil and water chemistry: an intergrative approach CRC Press, LLC.
Boca Raton, FL.
Feng, M., Zhao, C. G., Gong, F. L., & Yang, M. S. (2004). Study on the modification of sodium
montmorillonite with amino silanes. Acta Chimica Sinica, 62(1), 83-87.
Gunister, E., Pestreli, D., Unlu, C. H., Atici, O., & Gungor, N. (2007). Synthesis and
characterization of chitosan-MMT biocomposite systems. Carbohydrate Polymers, 67(3),
358-365.
Ikeda, S., & Foegeding, E. A. (1999). Dynamic viscoelastic properties of thermally induced
whey protein isolate gels with added lecithin. Food Hydrocolloids, 13(3), 245-254.
Jahangir, S., & Leber, M. J. (2007). Biodegradable good packaging: an environmental imperative.
Industry Report, 1-20.
Krochta, J. M., & DeMulderJohnston, C. (1997). Edible and biodegradable polymer films:
challenges and opportunities. Food Technology, 51(2), 61-74.
Kumar, P. (2009). Development of bio-nanocomposite films with enhanced mechanical and
barrier properties using extrusion processing. North Carolina State University. Ph.D
dissertation.
Kumar, P., Sandeep, K. P., Alavi, S., Truong, V. D., & Gorga, R. E. (2010a). Effect of type and
content of modified montmorillonite on the structure and properties of bio-
nanocomposite films based on soy protein isolate and montmorillonite. Journal of Food
Science, 75(5), N46-N56.

94
Kumar, P., Sandeep, K. P., Alavi, S., Truong, V. D., & Gorga, R. E. (2010b). Preparation and
characterization of bio-nanocomposite films based on soy protein isolate and
montmorillonite using melt extrusion. Journal of Food Engineering, 100(3), 480-489.
L'Hocine, L., Boye, J. I., & Arcand, Y. (2006). Composition and functional properties of soy
protein isolates prepared using alternative defatting and extraction procedures. Journal of
Food Science, 71(3), C137-C145.
Le Corre, D., Bras, J., & Dufresne, A. (2010). Starch nanoparticles: a review.
Biomacromolecules, 11(5), 1139-1153.
Lin, J. J., Wei, J. C., Juang, T. Y., & Tsai, W. C. (2007). Preparation of protein−silicate hybrids
from polyamine intercalation of layered montmorillonite. Langmuir, 23, 1995-1999.
Liu, S. H., Zhou, R. B., Tian, S. J., & Gai, J. Y. (2007). A study on subunit groups of soybean
protein extracts under SDS-PAGE. Journal of the American Oil Chemists Society, 84(9),
793-801.
Malhotra, A., & Coupland, J. N. (2004). The effect of surfactants on the solubility, zeta potential,
and viscosity of soy protein isolates. Food Hydrocolloids, 18(1), 101-108.
Mallakpour, S., & Dinari, M. (2011). Preparation and characterization of new organoclays using
natural amino acids and Cloisite Na(+). Applied Clay Science, 51(3), 353-359.
Mariotti, F., Tome, D., & Mirand, P. P. (2008). Converting nitrogen into protein - Beyond 6.25
and Jones' factors. Critical Reviews in Food Science and Nutrition, 48(2), 177-184.
Markets, R. a. (2011). The global outlook for biodegradable packaging. Accessed by website:
http://www.researchandmarkets.com/research/5e27e0/the_global_outlook. Business
Insights, June, 110.
95
Maruyama, N., Katsube, T., Wada, Y., Oh, M. H., Barba De La Rosa, A. P., Okuda, E.,
Nakagawa, S., & Utsumi, S. (1998). The roles of the N-linked glycans and extension
regions of soybean beta-conglycinin in folding, assembly and structural features. Eur J
Biochem, 258, 854-862.
Nakasato, K., Ono, T., Ishiguro, T., Takamatsu, M., Tsukamoto, C., & Mikami, M. (2004).
Rapid quantitative analysis of the major components in soymilk using fourier transform
infrared spectroscopy (FT-IR). Food Science and Technology Research, 10(2), 137-142.
Paetau, I., Chen, C. Z., & Jane, J. L. (1994). Biodegradable plastics made from soybean
products.1. effect of preparation and processings on mechanical-properties and water-
absorption. Industrial & Engineering Chemistry Research, 33(7), 1821-1827.
Quiquampoix, H., & Burns, R. G. (2007). Interactions between proteins and soil mineral surfaces:
Environmental and health consequences. Elements, 3(6), 401-406.
Servagent-Noinville, S., Revault, M., Quiquampoix, H., & Baron, M. H. (2000). Conformational
changes of bovine serum albumin induced by adsorption on different clay surfaces: FTIR
analysis. Journal of Colloid and Interface Science, 221(2), 273-283.
Song, F., Tang, D. L., Wang, X. L., & Wang, Y. Z. (2011). Biodegradable soy protein isolate-
based materials: a review. Biomacromolecules, 12(10), 3369-3380.
Sorrentino, A., Gorrasi, G., & Vittoria, V. (2007). Potential perspectives of bio-nanocomposites
for food packaging applications. Trends in Food Science & Technology, 18(2), 84-95.
Tang, X. Z., Alavi, S., & Herald, T. J. (2008). Barrier and mechanical properties of starch-clay
nanocomposite films. Cereal Chemistry, 85(3), 433-439.
Wang, X. C., & Lee, C. (1993). Adsorption and desorption of aliphatic-amines, amino-acids and
acetate by clay-minerals and marine-sediments. Marine Chemistry, 44(1), 1-23.
96
Wu, W., Zhang, C. M., Kong, X. Z., & Hua, Y. F. (2009). Oxidative modification of soy protein
by peroxyl radicals. Food Chemistry, 116(1), 295-301.
Xiang, L. X., Tang, C. Y., Cao, J., Wang, C. Y., Wang, K., Zhang, Q., Fu, Q., & Zhao, S. G.
(2009). Preparation and characterization of soy protein isolate (SPI)/montmorillonite
(MMT) bionanocomposites. Chinese Journal of Polymer Science, 27(6), 843-849.
Yang, Y., Zhu, Z. K., Yin, J., Wang, X. Y., & Qi, Z. E. (1999). Preparation and properties of
hybrids of organo-soluble polyimide and montmorillonite with various chemical surface
modification methods. Polymer, 40(15), 4407-4414.
Zhao, R. X., Torley, P., & Halley, P. J. (2008). Emerging biodegradable materials: starch- and
protein-based bio-nanocomposites. Journal of Materials Science, 43(9), 3058-3071.

97
APPENDIX
Table 4. 1. Basal spacing of MMT after coating by soy protein at an MMT:soy protein
powder mass ratio of 4:1 and pH 2.0-10.0.
Coating pH 2θ() d-spacing (nm)
2.0 6.63 1.33 3.0 7.07 1.25 4.0 6.96 1.27 5.0 7.08 1.25
4.23 2.09 6.0
6.93 1.27 4.37 2.01
7.0 6.98 1.27
8.0 4.30 2.05 9.0 4.16 2.12 10.0 4.43 1.99
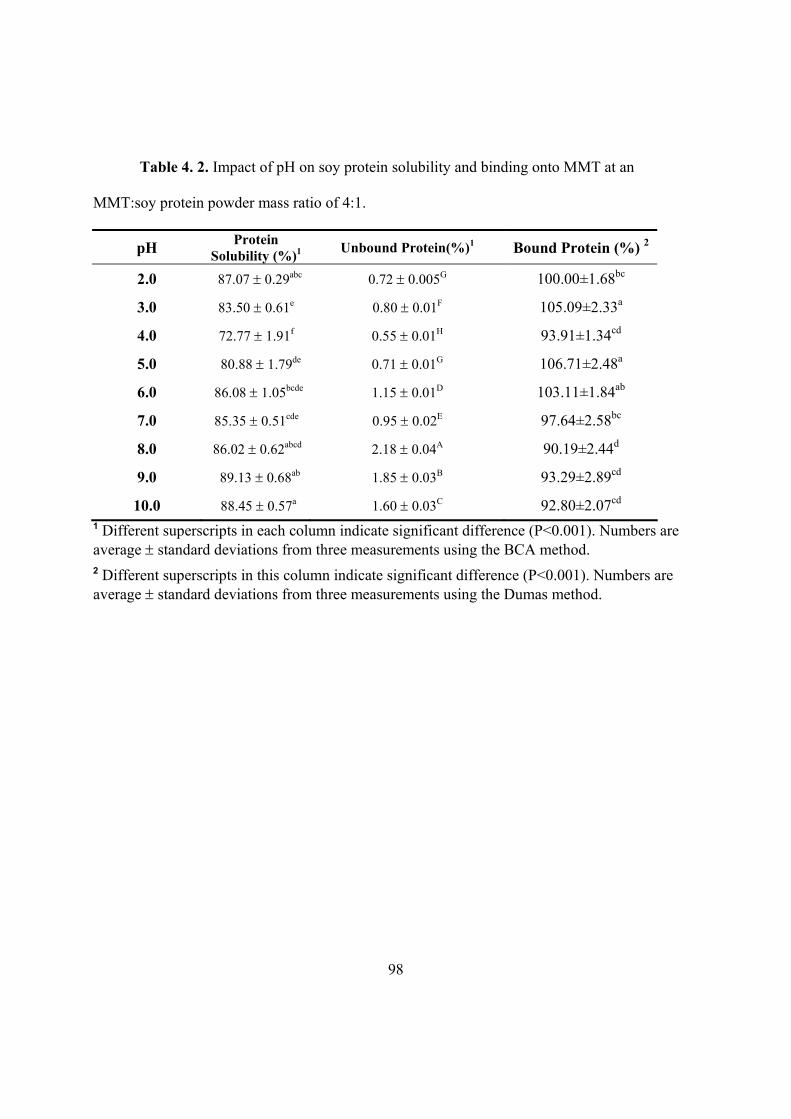
98
Table 4. 2. Impact of pH on soy protein solubility and binding onto MMT at an
MMT:soy protein powder mass ratio of 4:1.
pH Protein
Solubility (%)1 Unbound Protein(%)1 Bound Protein (%) 2
2.0 87.07 0.29abc 0.72 0.005G 100.00±1.68bc
3.0 83.50 0.61e 0.80 0.01F 105.09±2.33a
4.0 72.77 1.91f 0.55 0.01H 93.91±1.34cd
5.0 80.88 1.79de 0.71 0.01G 106.71±2.48a
6.0 86.08 1.05bcde 1.15 0.01D 103.11±1.84ab
7.0 85.35 0.51cde 0.95 0.02E 97.64±2.58bc
8.0 86.02 0.62abcd 2.18 0.04A 90.19±2.44d
9.0 89.13 0.68ab 1.85 0.03B 93.29±2.89cd
10.0 88.45 0.57a 1.60 0.03C 92.80±2.07cd 1 Different superscripts in each column indicate significant difference (P<0.001). Numbers are average standard deviations from three measurements using the BCA method. 2 Different superscripts in this column indicate significant difference (P<0.001). Numbers are average standard deviations from three measurements using the Dumas method.

99
Table 4. 3. XRD characteristics of MMT coated by soy protein at pH 9.0 using different
MMT:soy protein powder (SPP) mass ratios, with comparison to simple mixtures of MMT and
SPP.
MMT:SPP mass ratio 2θ () d-spacing (nm)
2:1 Not detected Not detected
4:1 4.16 2.12
3.84 2.30 9:1
7.13 1.24
3.35 2.64
Coated sample
49:1 6.91 1.26
2:1 7.29 1.21
4:1 7.06 1.25
9:1 6.98 1.27 Simple mixture
49:1 6.90 1.28
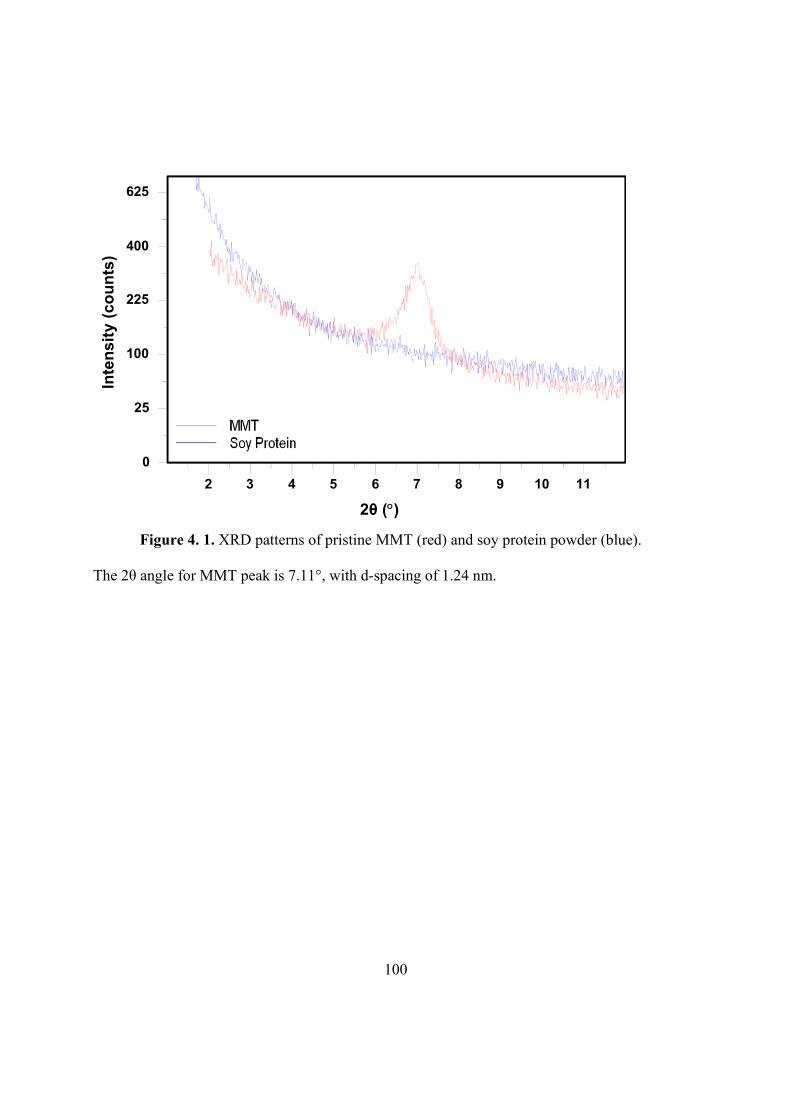
100
2θ ()
Inte
nsi
ty (
cou
nts
)
2 3 4 5 6 7 8 9 10 11
0
25
100
225
400
625
Figure 4. 1. XRD patterns of pristine MMT (red) and soy protein powder (blue).
The 2θ angle for MMT peak is 7.11°, with d-spacing of 1.24 nm.
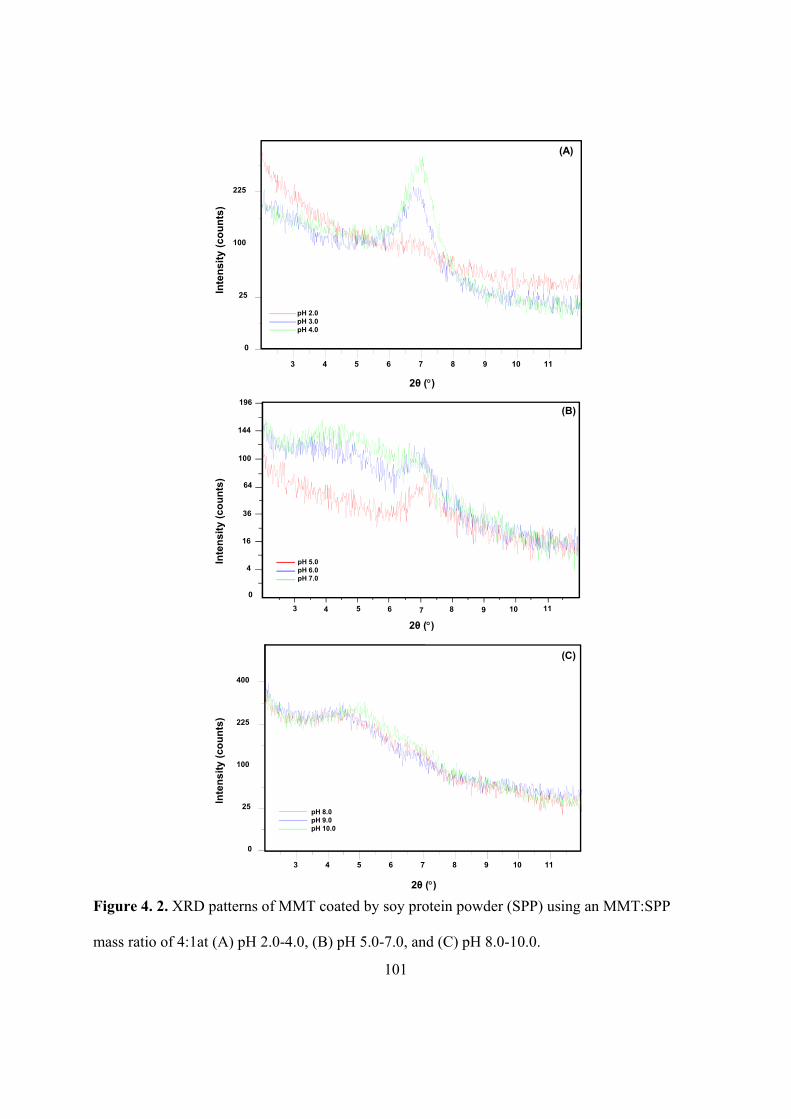
101
(A)
2θ ()
Inte
nsi
ty (
cou
nts
)
3 4 5 6 7 8 9 10 11
0
25
100
225
pH 2.0pH 3.0pH 4.0
144
196
100
64
36
16
4
0
3 4 5 6 7 8 9 10 11
pH 5.0pH 6.0pH 7.0
(B)
2θ ()
Inte
nsi
ty (
cou
nts
)
(C)
2θ ()
Inte
ns
ity
(co
un
ts)
pH 8.0pH 9.0pH 10.0
3 4 5 6 7 8 9 10 11
0
25
100
225
400
Figure 4. 2. XRD patterns of MMT coated by soy protein powder (SPP) using an MMT:SPP
mass ratio of 4:1at (A) pH 2.0-4.0, (B) pH 5.0-7.0, and (C) pH 8.0-10.0.

102
4000 3500 3000 2500 2000 1500 1000 500
Wavenumber (cm-1)
%Tr
ansm
itta
nc
e
20
0
40
60
80
Figure 4. 3. FTIR spectra of pristine MMT (red) and soy protein powder (blue).
Arrows highlight the positions discussed in the text.
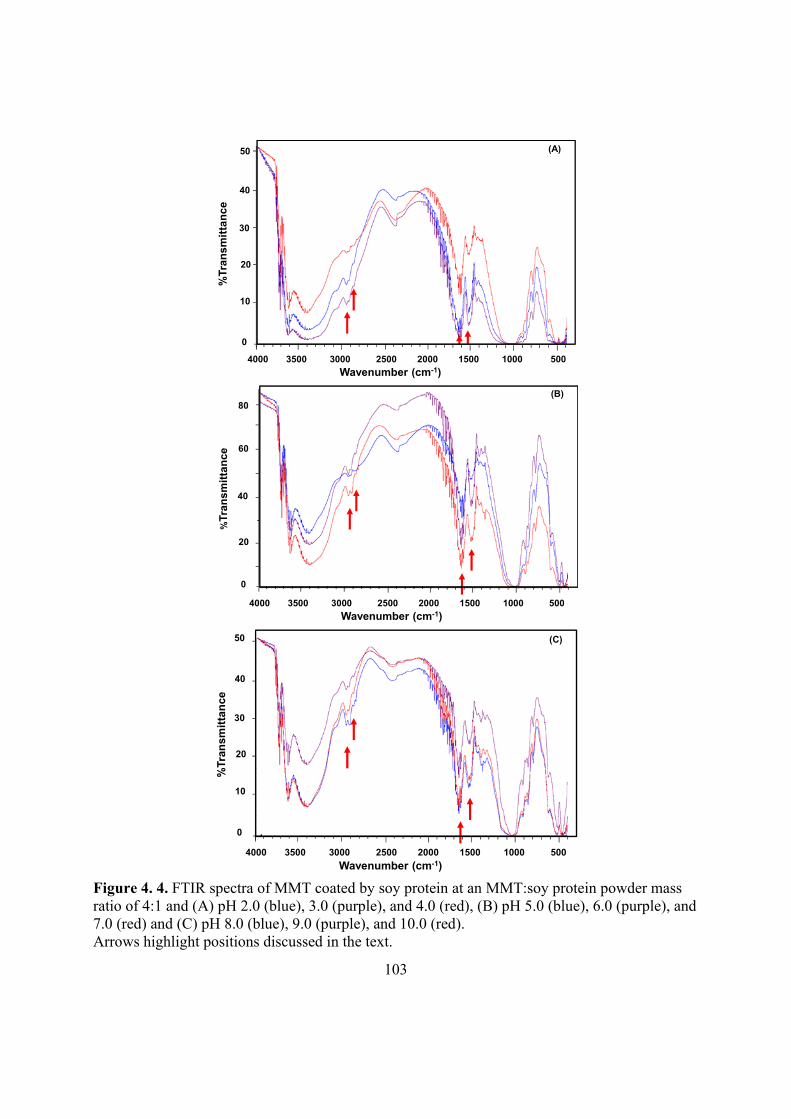
103
(A)
%T
ran
smit
tan
ce
10
0
20
30
40
50
4000 3500 3000 2500 2000 1500 1000 500
Wavenumber (cm-1)
(B)
%Tr
ansm
itta
nce
20
0
40
60
80
4000 3500 3000 2500 2000 1500 1000 500
Wavenumber (cm-1)
(C)
%T
ran
smit
tan
ce
10
0
20
30
40
50
4000 3500 3000 2500 2000 1500 1000 500
Wavenumber (cm-1)
Figure 4. 4. FTIR spectra of MMT coated by soy protein at an MMT:soy protein powder mass ratio of 4:1 and (A) pH 2.0 (blue), 3.0 (purple), and 4.0 (red), (B) pH 5.0 (blue), 6.0 (purple), and 7.0 (red) and (C) pH 8.0 (blue), 9.0 (purple), and 10.0 (red). Arrows highlight positions discussed in the text.
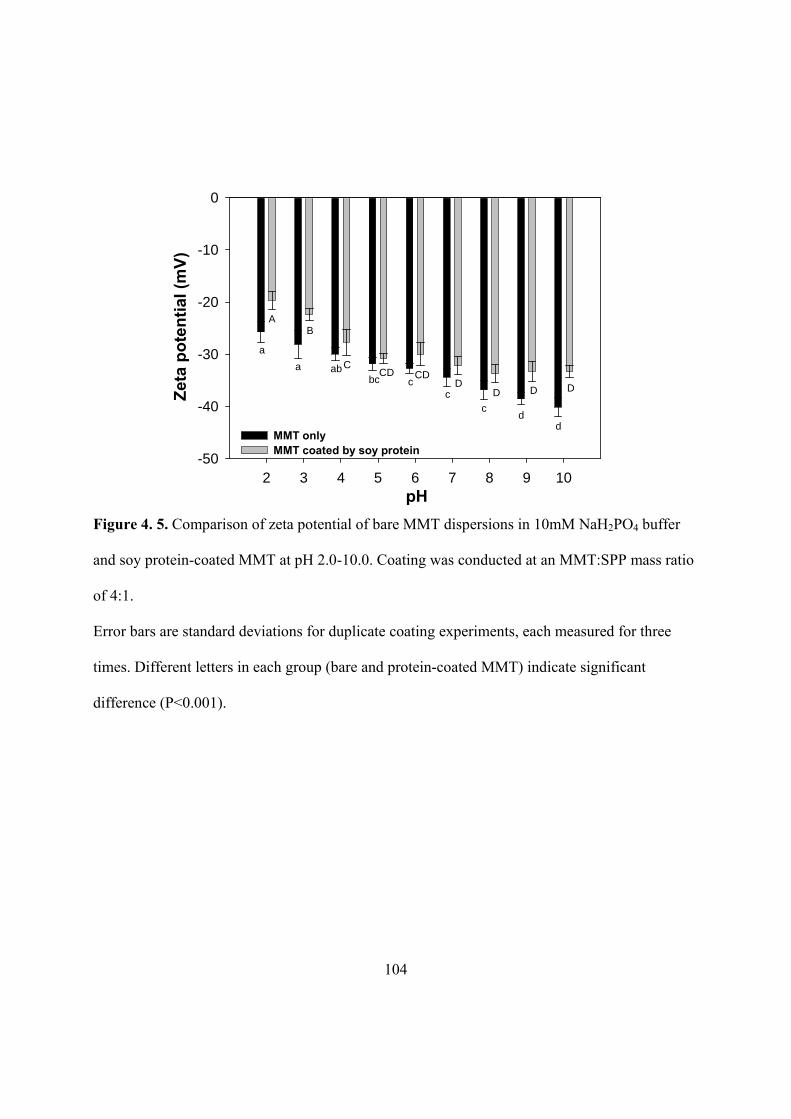
104
2 3 4 5 6 7 8 9 10-50
-40
-30
-20
-10
0
MMT onlyMMT coated by soy protein
Zet
a p
ote
nti
al (
mV
)
pH
a
a abbc c
cc
dd
AB
CCD CD
DD D D
Figure 4. 5. Comparison of zeta potential of bare MMT dispersions in 10mM NaH2PO4 buffer
and soy protein-coated MMT at pH 2.0-10.0. Coating was conducted at an MMT:SPP mass ratio
of 4:1.
Error bars are standard deviations for duplicate coating experiments, each measured for three
times. Different letters in each group (bare and protein-coated MMT) indicate significant
difference (P<0.001).
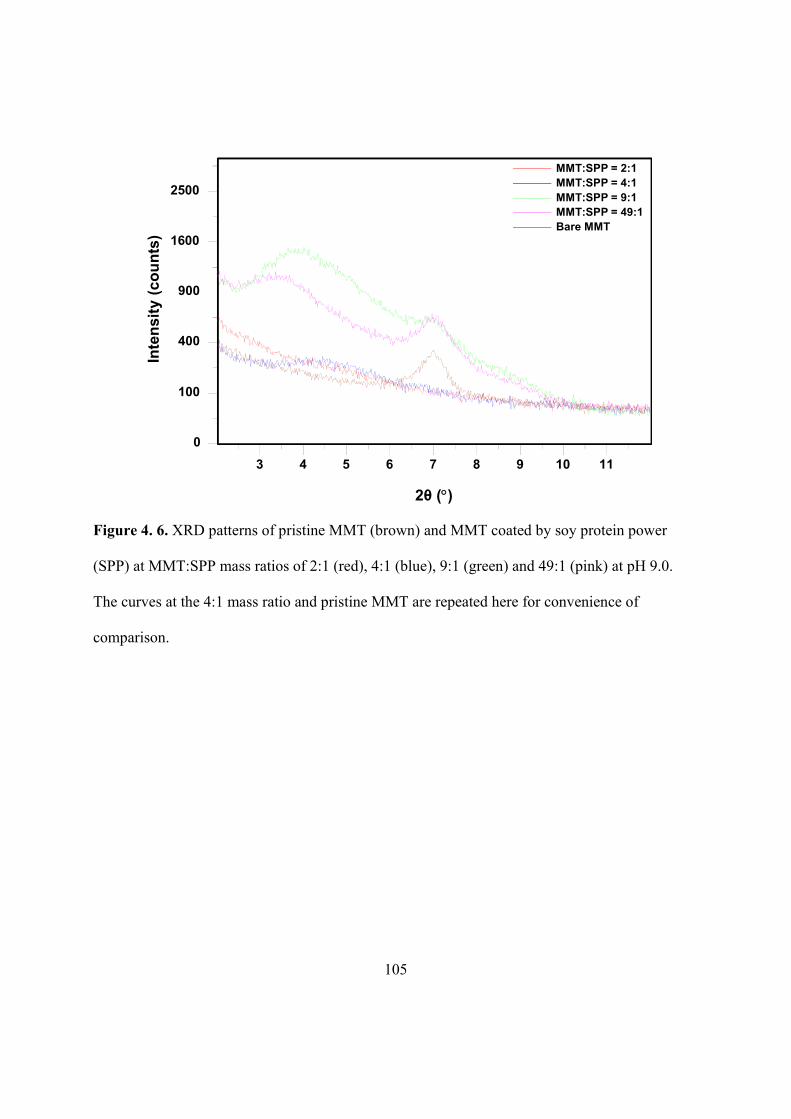
105
2θ ()
Inte
nsi
ty (
cou
nts
)MMT:SPP = 2:1MMT:SPP = 4:1MMT:SPP = 9:1MMT:SPP = 49:1Bare MMT
3 4 5 6 7 8 9 10 11
0
100
400
900
1600
2500
Figure 4. 6. XRD patterns of pristine MMT (brown) and MMT coated by soy protein power
(SPP) at MMT:SPP mass ratios of 2:1 (red), 4:1 (blue), 9:1 (green) and 49:1 (pink) at pH 9.0.
The curves at the 4:1 mass ratio and pristine MMT are repeated here for convenience of
comparison.
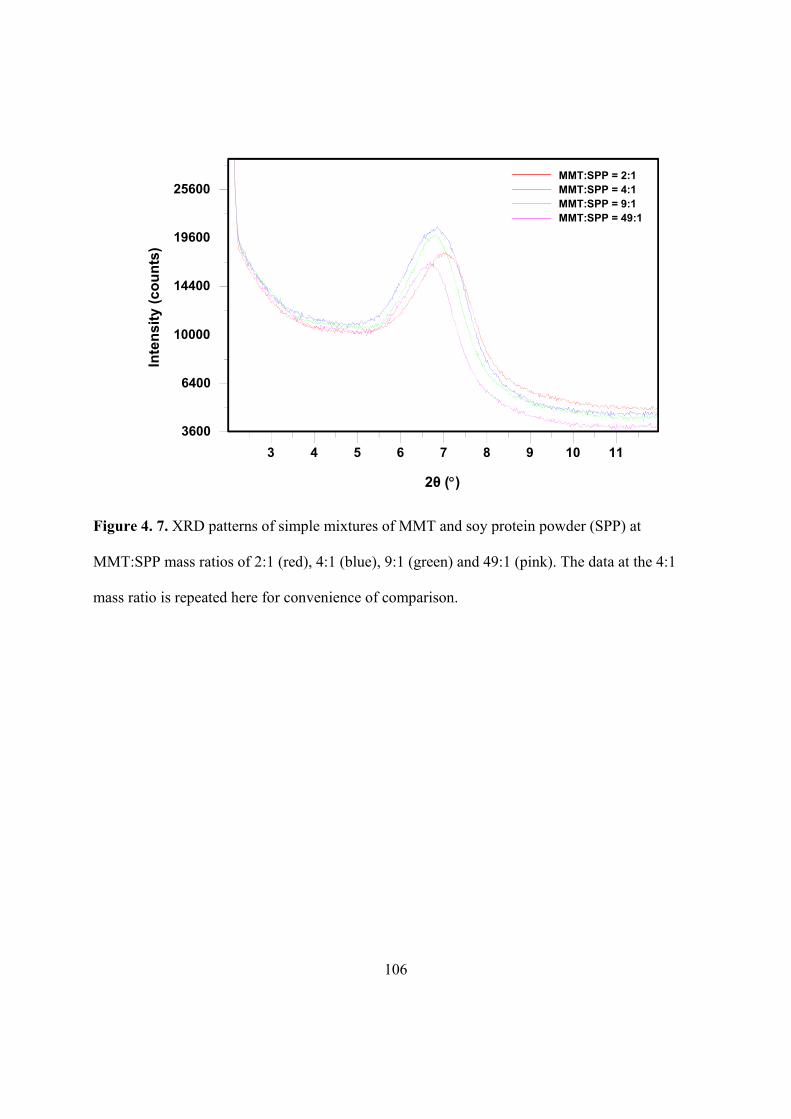
106
MMT:SPP = 2:1MMT:SPP = 4:1MMT:SPP = 9:1MMT:SPP = 49:1
2θ ()
Inte
nsi
ty (
co
un
ts)
3 4 5 6 7 8 9 10 11
3600
6400
10000
14400
19600
25600
Figure 4. 7. XRD patterns of simple mixtures of MMT and soy protein powder (SPP) at
MMT:SPP mass ratios of 2:1 (red), 4:1 (blue), 9:1 (green) and 49:1 (pink). The data at the 4:1
mass ratio is repeated here for convenience of comparison.

107
Figure 4. 8. Zeta potential of MMT coated by soy protein powder (SPP) at pH 9.0 using various
MMT:SPP mass ratios.
Error bars are standard deviations for duplicate coating experiments, each measured for three
times. Different letters next to symbols indicate significant difference (P<0.001).
-50
-40
-30
-20
-10
0Z
eta
po
ten
tial
(m
V)
MMT:SPP mass ratio
A
B
CC
2:1 4:1 9:1 49:1

108
CHAPTER 5 . TRANSGLUTAMINASE CROSS-LINKING OF SOY PROTEIN IN THE CONTINUOUS PHASE AND
ON INTERCALATED MONTMORILLONITE NANOCLAY PROBED BY DYNAMIC RHEOLOGY

109
5.1. ABSTRACT
The objective of this work was to enhance interactions between layered montmorillonite
(MMT) nanoclay and continuous phase biopolymer. MMT was intercalated by surface-coating with
soy protein before being dispersed in soy protein suspensions for crosslinking by microbial
transglutaminase (mTGase). Dynamic rheology was performed to study variables of sodium chloride
and mTGase concentrations, with and without MMT. Without mTGase and MMT, the maximum
storage modulus (G) was achieved at 100 mM NaCl, while the addition of MMT corresponded to an
identical increase in G at 200-1000 mM NaCl. With a higher level of mTGase, a shorter gelling time
and a stronger hydrogel were observed. The addition of protein-coated MMT further increased G and
shortened the gelation time, with the highest G observed for the treatment with 1.00%w/v mTGase
and 100 mM NaCl. Our results demonstrate that mTGase cross-linking is effective in enhancing
interactions between the matrix and fillers in the nanocomposite system.
Keywords: nanocomposite, enzymatic crosslinking, soy protein, protein coated nanoclay, dynamic
rheology

110
5.2. INTRODUCTION
Bio-nanocomposites, by dispersing inorganic nanoparticles in a matrix of biopolymer,
have attracted much attention as novel packaging materials for substitutions of petroleum-
derived plastics due to their renewability and bio-degradability (Arora & Padua, 2010; Dang, Lu,
Yu, Sun, & Yuan, 2010; de Azeredo, 2009). Proteins with good film-forming properties, such as
soy protein (SP), wheat gluten, pea protein and gelatin, have been extensively studied for bio-
derived packaging materials, with several recent studies investigating the improvement of
mechanical and barrier properties of nanocomposite films after incorporating nanoclays such as
montmorillonite (MMT) (Arora & Padua, 2010; Chang, Yang, Huang, Xia, Feng, & Wu, 2009;
Chen & Zhang, 2006; Guilherme, Mattoso, Gontard, Guilbert, & Gastaldi, 2010; Kumar,
Sandeep, Alavi, Truong, & Gorga, 2010a, 2010b; Lee & Kim, 2010; Martucci & Ruseckaite,
2010). Soy protein isolate (SPI)/MMT nanocomposite films have been reported for improved
vapor permeability and mechanical properties than those without nanofillers (Chen & Zhang,
2006; Kumar, Sandeep, Alavi, Truong, & Gorga, 2010a, 2010b; Lee & Kim, 2010). However,
water vapor permeability of SPI-based nanocomposite films, because of the hydrophilic nature of
SP, still requires substantial improvement when compared to petrochemical-based plastics
(Kumar, Sandeep, Alavi, Truong, & Gorga, 2010a).
It is well established that achieving either intercalation or exfoliation of layered nanoclay
is critical to improve mechanical and barrier properties of nanocomposite materials (Le Corre,
Bras, & Dufresne, 2010; Tang, Alavi, & Herald, 2008a). Modification of nanoclays by
increasing basal spacing with intercalated and/or exfoliated structures prior to incorporation into
the polymer matrix is a viable approach in improving structure and properties of final
nanocomposite materials (Feng, Zhao, Gong, & Yang, 2004; Lin, Wei, Juang, & Tsai, 2007;

111
Mallakpour & Dinari, 2011). In our separate study, surface coating of MMT via solution
intercalation by SP was observed to have enlarged basal spacing of MMT platelets that
corresponded to highly intercalated and/or exfoliated layers. In this study, the major objective
was to improve the interaction between protein-coated MMT and matrix SP so as to develop
nanocomposite materials with enhanced mechanical and barrier properties.
Crosslinking proteins coating MMT and those in the continous matrix is a logical
approach to enhance the interactions of the nanocomposite system. Enzymatic and chemical
cross-linking approaches have been studied for soy proteins (Caillard, Remondetto, & Subirade,
2009, 2010; de Carvalho & Grosso, 2004; Gan, Latiff, Cheng, & Easa, 2009; Jiang, Tang, Wen,
Li, & Yang, 2007; Yildirim & Hettiarachchy, 1998). The focus of this study was the enzymatic
method because it has been used in food production, which reduces possible regulatory issues
when applying to nanocomposite materials for applications such as food packaging films.
Transglutaminase (EC 2.3.2.13, protein-glutamine γ-glutamyltransferase, TGase) is an enzyme
with the capability of catalyzing crosslinking reactions between protein molecules, peptides, and
primary amines through acyl transfer reactions to form inter- or intramolecular ε-(γ-
glutamyl)lysine isopeptidic bond (Seguro, Nio, & Motoki, 1996; Zhu, Bol, Rinzema, Tramper, &
Wijngaards, 1999). TGase is ubiquitous, and the morden biotechnology has made it possible to
produce microbial TGase (mTGase) for commercial applications. The mTGase has been studied
extensively to improve functional properties of food proteins and protein-containing products
such as meat (Motoki & Seguro, 1998; Seguro, Nio, & Motoki, 1996). Reduced solubility and
increased surface hydrophobicity of SP was observed after treatment by mTGase, and the films
prepared from mTGase-treated SP had decreased solubility and improved mechanical properties
such as tensile strength and elongation at break (Gan, Latiff, Cheng, & Easa, 2009). Thus,
112
mTGase has the potential to improve the interactions of the nanocomposite system studied in this
work.
Specifically in this work, dynamic rheological tests were applied as a non-destructive
method to investigate interactions of SP dispersions with protein-coated MMT during cross-
linking by mTGase and the subsequent thermal treatment steps to additionally improve network
strength. Variables in enzymatic cross-linking included the concentrations of sodium chloride
and mTGase, and the presence or absence of protein-coated MMT.
5.3. MATERIALS AND METHODS
5.3.1. Materials
Cloisite® Na+-montmorillonite was purchased from Southern Clay Products, Inc.
(Gonzales, TX). Soy flour was a commercial product from MP Biomedicals, LLC (Solon, OH).
The mTGase (ACTIVA® TI) was a product of Ajinomoto Food Ingredients, LLC (Chicago, IL).
Other chemicals were from Sigma-Aldrich Corp. (St. Louis, MO) or Fisher Scientific (Fair Lawn,
NJ). All reagents were used without further purification.
5.3.2. Extraction of SP
SP was extracted from soy flour using the modified protocol for preparation of SPI
(L'Hocine, Boye, & Arcand, 2006). Soy flour was finely ground by a coffee grinder (Hamilton
Beach Proctor-Silex, Inc., Southern Pines, NC), suspended in deionized water at a solid:liquid
mass ratio of 1:10, adjusted to pH 9.0 by 4 N NaOH, and constantly stirred for 3 h at 48 °C
(model Isotemp®, Fisher Scientific, Fair Lawn, NJ). The dispersion was then centrifuged
(Sorvall RC 5B Plus, Newtown, CT) at 3,778g for 30 min at ambient temperature, and the
supernatant was filtered twice using the #1 filter paper and then twice using the #2 filter paper
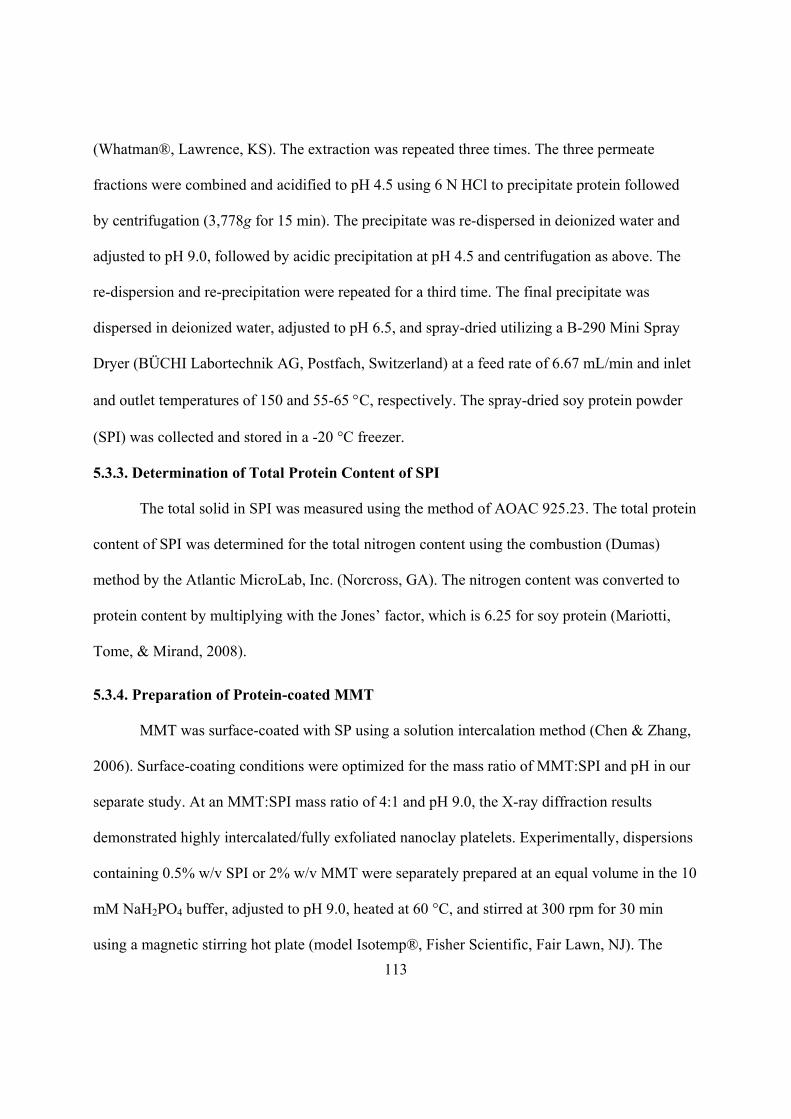
113
(Whatman®, Lawrence, KS). The extraction was repeated three times. The three permeate
fractions were combined and acidified to pH 4.5 using 6 N HCl to precipitate protein followed
by centrifugation (3,778g for 15 min). The precipitate was re-dispersed in deionized water and
adjusted to pH 9.0, followed by acidic precipitation at pH 4.5 and centrifugation as above. The
re-dispersion and re-precipitation were repeated for a third time. The final precipitate was
dispersed in deionized water, adjusted to pH 6.5, and spray-dried utilizing a B-290 Mini Spray
Dryer (BÜCHI Labortechnik AG, Postfach, Switzerland) at a feed rate of 6.67 mL/min and inlet
and outlet temperatures of 150 and 55-65 C, respectively. The spray-dried soy protein powder
(SPI) was collected and stored in a -20 °C freezer.
5.3.3. Determination of Total Protein Content of SPI
The total solid in SPI was measured using the method of AOAC 925.23. The total protein
content of SPI was determined for the total nitrogen content using the combustion (Dumas)
method by the Atlantic MicroLab, Inc. (Norcross, GA). The nitrogen content was converted to
protein content by multiplying with the Jones’ factor, which is 6.25 for soy protein (Mariotti,
Tome, & Mirand, 2008).
5.3.4. Preparation of Protein-coated MMT
MMT was surface-coated with SP using a solution intercalation method (Chen & Zhang,
2006). Surface-coating conditions were optimized for the mass ratio of MMT:SPI and pH in our
separate study. At an MMT:SPI mass ratio of 4:1 and pH 9.0, the X-ray diffraction results
demonstrated highly intercalated/fully exfoliated nanoclay platelets. Experimentally, dispersions
containing 0.5% w/v SPI or 2% w/v MMT were separately prepared at an equal volume in the 10
mM NaH2PO4 buffer, adjusted to pH 9.0, heated at 60 °C, and stirred at 300 rpm for 30 min
using a magnetic stirring hot plate (model Isotemp®, Fisher Scientific, Fair Lawn, NJ). The

114
MMT dispersion was slowly added to the SPI dispersion to reach an MMT:SPI mass ratio of 4:1,
while being agitated at 1000 rpm and maintained at 60 °C. After 3-h agitation, the resultant
slurry was ready for incorporation of SPI for mTGase cross-linking.
5.3.5. Determination of mTGase Activity
The activity of mTGase was determined using the enzymatic assay of TGase (EC
2.3.2.13) from Sigma-Aldrich Corp., with all solutions adjusted to pH 6.0 at 37 C. The fresh
enzyme solution was prepared immediately before use by dissolving enzyme powder at a
concentration of 1 mg/mL in cold deionized water at ca. 4 C. After mixing with the reaction
cocktail of reagents, incubating the test sample containing mTGase at 37 C for 10 min, and
centrifugation (10,000g) for 5 min, the absorbance was recorded at a wavelength of 525 nm
using a UV/Vis spectrophotometer (model Biomate 5, Thermo Electron Corporation, Woburn,
MA). One unit of enzyme was defined as the amount of enzyme that catalyzed the formation of
1.0 µmole per min of hydroxamate from Na-CBZ-Glutaminylglycine and hydroxylamine at pH
6.0 and 37 C. Triplicate measurements were conducted for each sample.
5.3.6. Dynamic Rheological Tests
5.3.6.1. Sample preparation
SPI was hydrated at 6% w/v in the 10 mM NaH2PO4 buffer or protein-coated MMT
slurry overnight, with pH maintained at 6.5. Immediately before the rheological test, NaCl and
mTGase were added to the dispersions to various combinations of NaCl (0, 50, 100, 200, 500,
750, and 1000 mM) and mTGase (0, 0.12, 0.16, 0.30, 0.40, and 1.00% w/v in the entire sample)
concentrations. A pH value of 6.5 was chosen for cross-linking studies because (1) high protein
solubility is needed for the formation of homogeneous hydrogel network (Lakemond, de Jongh,
Hessing, Gruppen, & Voragen, 2000), (2) soy protein had drastically improved solubility at pH

115
6.5 than that at pH 6.0 (Wolf, 1970), and (3) mTGase has an optimal activity at pH 6.0 and is
very stable at pH 5.0-7.0 (Ho, Leu, Hsieh, & Jiang, 2000; Tsai, Lin, & Jiang, 1996).
5.3.6.2. Rheological tests
An AR2000 rheometer (TA Instruments, New Castle, DE) equipped with a concentric
cylinder geometry consisting of a bob with an outer diameter of 28 mm and a cup with an inner
diameter of 30 mm was utilized to monitor cross-linking and subsequent thermal treatments of
dispersions. Approximately 15 mL of the dispersion was carefully transferred into the cup. After
positioning the bob and removing the excess sample, a layer of mineral oil was applied above the
sample to prevent moisture loss during measurement. The oscillatory tests consisted of these
sequential steps: (1) an isothermal step at 45 C for 2 h, (2) a heating ramp from 45 to 90 C at 2
C/min, (3) an isothermal step at 90 C for 1 h, (4) a cooling ramp from 90 to 25 C at 3 C/min,
and (5) a strain sweep at 25 C using a strain range of 0.001-1 and a frequency of 1 Hz. Except
for strain sweep tests, a strain of 0.01 and a frequency of 1 Hz were used. Each sample was
measured in duplicate and averages from two tests were reported.
5.4. RESULTS AND DISCUSSION
5.4.1. Representative Rheological Profiles Showing Impacts of NaCl, MMT, and mTGase
The storage modulus (G) and loss modulus (G) of SPI dispersions developed during
holding at 45 C for 2 h for enzymatic cross-linking (step 1), heating to 90 C (step 2), holding at
90 C for 1 h (step 3), and cooling to 25 C (step 4). The holding step at 45 C was shortened to
10 min for the SPI samples added with NaCl only because protein aggregation and cross-linking
is not expected. The end point at each step of the thermal profile was denoted as P1, P2, P3, or
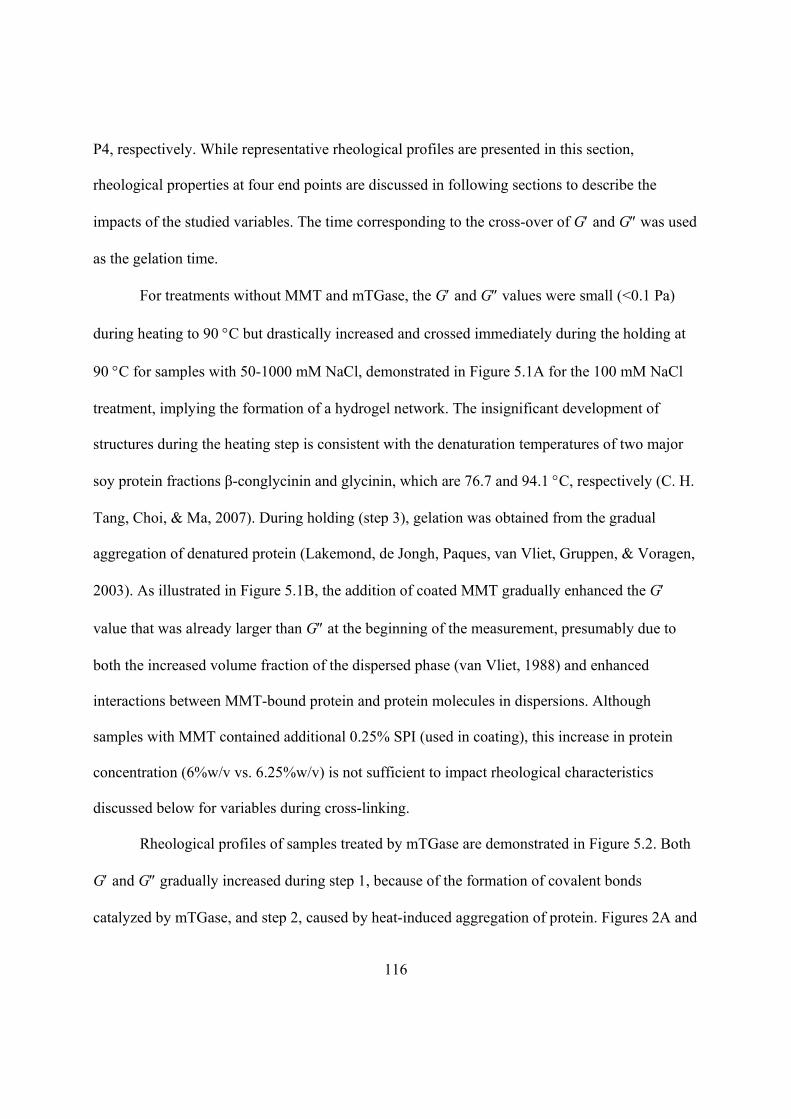
116
P4, respectively. While representative rheological profiles are presented in this section,
rheological properties at four end points are discussed in following sections to describe the
impacts of the studied variables. The time corresponding to the cross-over of G and G was used
as the gelation time.
For treatments without MMT and mTGase, the G and G values were small (<0.1 Pa)
during heating to 90 C but drastically increased and crossed immediately during the holding at
90 C for samples with 50-1000 mM NaCl, demonstrated in Figure 5.1A for the 100 mM NaCl
treatment, implying the formation of a hydrogel network. The insignificant development of
structures during the heating step is consistent with the denaturation temperatures of two major
soy protein fractions β-conglycinin and glycinin, which are 76.7 and 94.1 C, respectively (C. H.
Tang, Choi, & Ma, 2007). During holding (step 3), gelation was obtained from the gradual
aggregation of denatured protein (Lakemond, de Jongh, Paques, van Vliet, Gruppen, & Voragen,
2003). As illustrated in Figure 5.1B, the addition of coated MMT gradually enhanced the G
value that was already larger than G at the beginning of the measurement, presumably due to
both the increased volume fraction of the dispersed phase (van Vliet, 1988) and enhanced
interactions between MMT-bound protein and protein molecules in dispersions. Although
samples with MMT contained additional 0.25% SPI (used in coating), this increase in protein
concentration (6%w/v vs. 6.25%w/v) is not sufficient to impact rheological characteristics
discussed below for variables during cross-linking.
Rheological profiles of samples treated by mTGase are demonstrated in Figure 5.2. Both
G and G gradually increased during step 1, because of the formation of covalent bonds
catalyzed by mTGase, and step 2, caused by heat-induced aggregation of protein. Figures 2A and
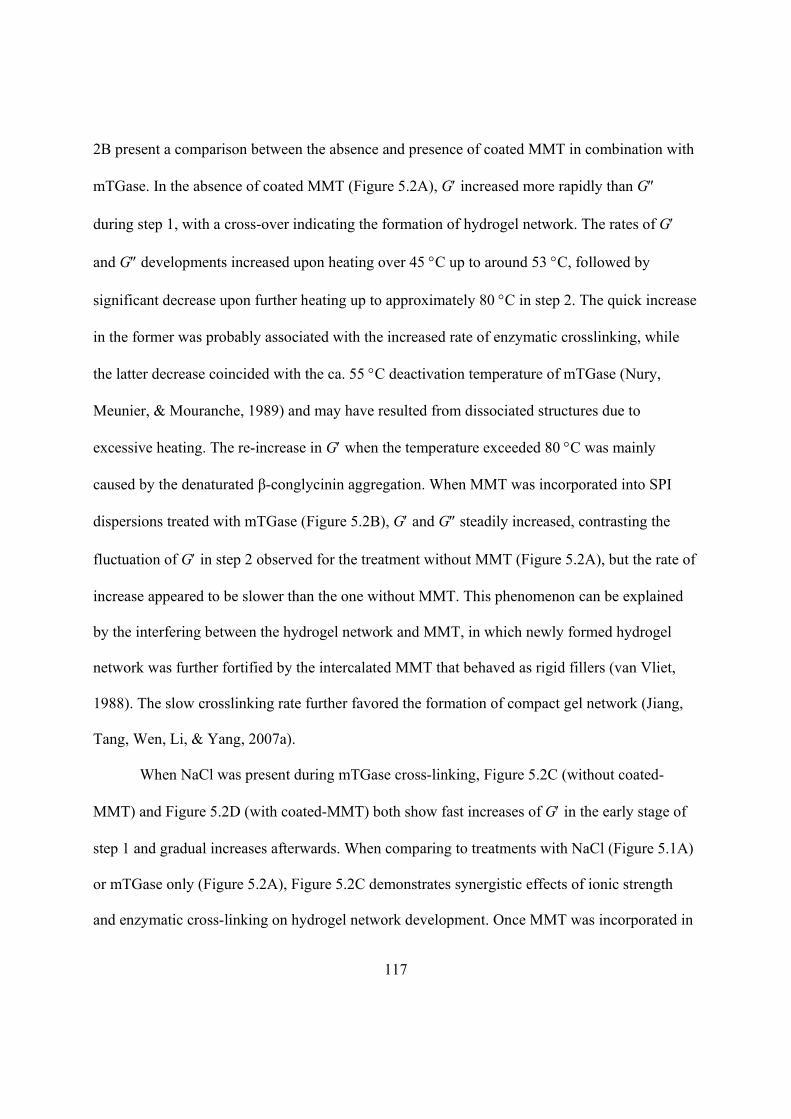
117
2B present a comparison between the absence and presence of coated MMT in combination with
mTGase. In the absence of coated MMT (Figure 5.2A), G increased more rapidly than G
during step 1, with a cross-over indicating the formation of hydrogel network. The rates of G
and G developments increased upon heating over 45 C up to around 53 C, followed by
significant decrease upon further heating up to approximately 80 C in step 2. The quick increase
in the former was probably associated with the increased rate of enzymatic crosslinking, while
the latter decrease coincided with the ca. 55 C deactivation temperature of mTGase (Nury,
Meunier, & Mouranche, 1989) and may have resulted from dissociated structures due to
excessive heating. The re-increase in G when the temperature exceeded 80 C was mainly
caused by the denaturated β-conglycinin aggregation. When MMT was incorporated into SPI
dispersions treated with mTGase (Figure 5.2B), G and G steadily increased, contrasting the
fluctuation of G in step 2 observed for the treatment without MMT (Figure 5.2A), but the rate of
increase appeared to be slower than the one without MMT. This phenomenon can be explained
by the interfering between the hydrogel network and MMT, in which newly formed hydrogel
network was further fortified by the intercalated MMT that behaved as rigid fillers (van Vliet,
1988). The slow crosslinking rate further favored the formation of compact gel network (Jiang,
Tang, Wen, Li, & Yang, 2007a).
When NaCl was present during mTGase cross-linking, Figure 5.2C (without coated-
MMT) and Figure 5.2D (with coated-MMT) both show fast increases of G in the early stage of
step 1 and gradual increases afterwards. When comparing to treatments with NaCl (Figure 5.1A)
or mTGase only (Figure 5.2A), Figure 5.2C demonstrates synergistic effects of ionic strength
and enzymatic cross-linking on hydrogel network development. Once MMT was incorporated in
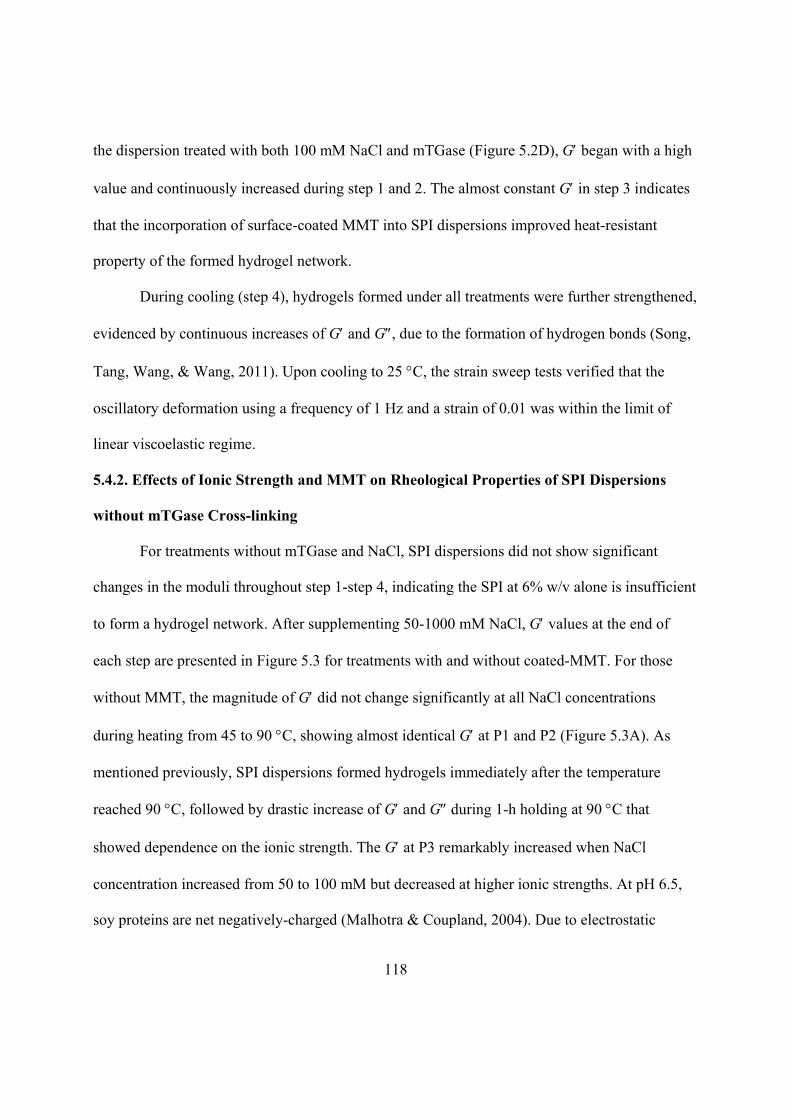
118
the dispersion treated with both 100 mM NaCl and mTGase (Figure 5.2D), G began with a high
value and continuously increased during step 1 and 2. The almost constant G in step 3 indicates
that the incorporation of surface-coated MMT into SPI dispersions improved heat-resistant
property of the formed hydrogel network.
During cooling (step 4), hydrogels formed under all treatments were further strengthened,
evidenced by continuous increases of G and G, due to the formation of hydrogen bonds (Song,
Tang, Wang, & Wang, 2011). Upon cooling to 25 C, the strain sweep tests verified that the
oscillatory deformation using a frequency of 1 Hz and a strain of 0.01 was within the limit of
linear viscoelastic regime.
5.4.2. Effects of Ionic Strength and MMT on Rheological Properties of SPI Dispersions
without mTGase Cross-linking
For treatments without mTGase and NaCl, SPI dispersions did not show significant
changes in the moduli throughout step 1-step 4, indicating the SPI at 6% w/v alone is insufficient
to form a hydrogel network. After supplementing 50-1000 mM NaCl, G values at the end of
each step are presented in Figure 5.3 for treatments with and without coated-MMT. For those
without MMT, the magnitude of G did not change significantly at all NaCl concentrations
during heating from 45 to 90 C, showing almost identical G at P1 and P2 (Figure 5.3A). As
mentioned previously, SPI dispersions formed hydrogels immediately after the temperature
reached 90 C, followed by drastic increase of G and G during 1-h holding at 90 C that
showed dependence on the ionic strength. The G at P3 remarkably increased when NaCl
concentration increased from 50 to 100 mM but decreased at higher ionic strengths. At pH 6.5,
soy proteins are net negatively-charged (Malhotra & Coupland, 2004). Due to electrostatic
119
repulsion between protein molecules, the probability of aggregation between two protein
molecules is relatively low at low ionic strengths. An increase in the ionic strength is expected to
facilitate aggregation between protein molecules since the charges on protein molecules are
shielded to a greater extent. It has been established that protein hydrogel networks become
coarser and mechanically weaker with increasing rate of aggregation at high ionic strengths
(Ikeda, Foegeding, & Hagiwara, 1999). The present results suggest that 100 mM is the optimum
NaCl concentration for maximizing the mechanical strength of the formed hydrogel networks.
Significant increases in G were observed at relatively low NaCl concentrations of 50-200 mM
after SPI dispersions were cooled to 25 C. It was confirmed that the maximum G at P4 was
obtained at 100 mM NaCl, consistent with the optimum NaCl concentration for heat-induced
gelation of whey protein isolate (Ikeda & Foegeding, 1999).
In contrast to Figure 5.3A, SPI dispersions containing surface-coated MMT exhibited
different trends: G increased with an increase in NaCl concentration up to 200 mM before
reaching a plateau (Figure 5.3B). As discussed above, the addition of coated-MMT changes
interactions among protein molecules in the continuous phase and increases the overall volume
fraction of the dispersed phase and thus G (van Vliet, 1988). At 50-200 mM NaCl, MMT
appeared to interfere with protein-protein aggregation and the development of hydrogel networks,
demonstrating lower G than the samples without MMT (Figure 5.3A). Above 200 mM NaCl, G
was not impacted by ionic strength, indicating the network-weakening at high ionic strengths in
MMT-free systems (Figure 5.3A) was not significant when comparing to the impacts on overall
network structures due to addition of surface-coated MMT. It was previously suggested that
fillers strengthen the hydrogel moduli only for the case of strong interactions between fillers and
matrix polymer molecules (van Vliet, 1988). The results in Figure 5.3 suggest that the coated-

120
MMT silicates are active fillers improving the mechanical strength of hydrogel networks but
inhibited the effect of ionic strength on protein-protein aggregations. The impacts of mTGase
cross-linking on hydrogel strengths of SPI dispersions with coated-MMT are presented below for
the strongest and weakest systems in Figure 5.3, corresponding to 0 and 100 mM NaCl.
5.4.3. Rheological Properties of SPI Dispersions Cross-linked by mTGase at 0 mM NaCl
The enzyme activity of mTGase was determined as 0.0314 U/mg powder, while SPI
contained 83.85% protein wet-based, with 92.11% total solid. Treatments with mTGase powder
used at 0.00, 0.12, 0.16, 0.30, 0.40, and 1.00% w/v in SPI dispersions thus corresponded to
enzyme levels of 0.00, 0.75, 1.00, 1.88, 2.50, and 6.25 U/g protein, respectively. For simplicity
of description, the mass/volume concentrations of mTGase powder are still used.
Figure 5.4A reveals that G at the end of each step monotonically increased with an
increase in mTGase concentration. During step 1, a shorter gelation time was observed at a
higher level of mTGase (Figure 5.5), consistent to the trend in a literature study (Song & Zhang,
2008). The addition of protein-coated MMT was found to remarkably increase G at all examined
mTGase concentrations (Figure 5.4B), and the short gelation time (Figure 5.5) corresponded to
the observations that G was already higher than G at the beginning of data collection. It is
known that G of composite gles increases since interactions between the matrix and filler
particles favor network formation but decreases otherwise (van Vliet, 1988). The drastic increase
in G when compared to mTGase- (Figure 5.4A) or MMT-only (no gelation) treatments
illustrates the occurrence of cross-linking between proteins coating MMT and those in the
continuous phase and the significance of our approach in strengthening the interactions of the
studied system.

121
5.4.4. Rheological Properties of SPI Dispersions Cross-linked by mTGase at 100 mM NaCl
The combined effects of 100 mM NaCl, mTGase, and MMT on G of SPI dispersions
were further studied. For systems without MMT, the synergistic effects of NaCl and mTGase on
G development discussed above were observed for all mTGase levels (Figure 5.6A). It is worth
noting that the SPI dispersion treated with 1.00% mTGase showed a lower G at P2 and P3 than
at P1, indicating that the highest mTGase level resulted in the formation of a well-developed
network during the 2-h cross-linking (step 1) and the restructuring of network at elevated
temperatures weakened the hydrogel strength. Similar to the samples without NaCl (Figure 5.5),
a shorter gelation time was observed at a higher level of mTGase during step 1 (Figure 5.7).
Furthermore, the addition of 100 mM NaCl shortened the gelation time to some extent at the
same mTGase level (Figure 5.5 vs. 5.7), presumably due to the synergistic effects of ionic
strength- induced protein-protein aggregations.
The weaker structures at P2 and P3 than that at P1 for systems in the absence of MMT
were not observed when protein-coated MMT was incorporated in SPI dispersions for mTGase
cross-linking with 1.00% mTGase (Figure 5.6B). The addition of MMT caused consistent
increases in G at all examined mTGase concentrations. The MMT-filled SPI dispersion
containing 100 mM NaCl and treated with 1.00%w/v mTGase developed the highest G at P4.
However, the effect of mTGase level at P4 was not linear: G increased from 72 to 907 Pa with
an increase of mTGase from 0.00 to 0.16%, and increased to 1099 Pa after a further increase of
mTGase concentration to 1.00%. The data suggests that the combination of 100 mM NaCl,
0.16%w/v mTGase, and 1% protein-coated MMT may be a cost-effective option in production,
because 82.5% of the maximum G value, corresponding to the 1.00%w/v mTGase treatment,
was obtained at a much lower level of mTGase.
122
5.4.5. Rheological Interpretation of Hydrogel Network Impacted by MMT
To understand the mechanism of the formed hydrogel structures requires other techniques
to complement rheology, e.g., transmission electron microscopy to investigate the occurrence of
segregation of protein-coated MMT at the studied conditions, especially after thermal treatments.
Nevertheless, the network structures as impacted by MMT are discussed for strain sweep results
at 25C, after step 4, in this section. For samples without mTGase crosslinking, G was almost
constant at the low strain regime, but strain-stiffening (higher G at larger strains) was observed
before yielding at a strain of ca. 1 for treatments with 50-1000 mM NaCl (shown in Figure 5.8
for the 100 mM NaCl sample), demonstrating that these hydrogel networks are elastic. In
contrast, nonlinear regimes were readily observed at lower strains for treatments with MMT, e.g.,
ca. 0.03 for the 100 mM NaCl treatment (Figure 5.8), indicating a typical filler system. The
strain sweep data confirmed that MMT screened the effect of ionic strength on get network
formation, as discussed previously.
The similar trend was observed for the dispersions treated by mTGase only, demonstrated
in Figure 5.9 for the 0.30%w/v mTGase treatment. For the sample without MMT, the strain-
stiffening also was observed (Figure 5.9), implying semi-flexible or rigid aggregates (Chen, Wen,
Janmey, Crocker, & Yodh, 2010) of covalent-bonded protein molecules catalyzed by mTGase.
The hydrogel containing MMT did not show the strain-stiffening property (Figure 5.9), possibly
due to a less homogenous network than the protein network cross-linked by mTGase without the
filler. The improved gel strength for the MMT-containing sample indicates the contribution from
cross-links created between proteins bound on MMT and those in the matrix, as well as the role
of MMT being rigid fillers, as discussed previously.
123
When mTGase cross-linking was conducted at 100 mM NaCl, the straining stiffening
was observed for the samples with and without MMT (Figure 5.10). The parallel G and
G’curves indicate both are stronger and more elastic hydrogels than comparable treatments in
Figures 5.8 and 5.9. The stronger and more elastic hydrogel containing mTGase, 100 mM NaCl,
and 1%w/v MMT than other comparable treatments are synergistically contributed by impacts of
ionic strength on protein aggregations, mTGase crosslinking of proteins in the continuous phase
and/or bound on MMT, and the addition of rigid fillers – protein-coated MMT, as discussed
above.
5.5. CONCLUSION
Dynamic rheological properties of soy protein dispersions with protein-coated MMT
were highly affected by variables during enzymatic crosslinking induced by mTGase and were
further strengthened by subsequent heating and cooling processes. Concentrations of NaCl and
mTGase were critical in developing hydrogel strength during crosslinking, with a higher G
observed at 100 mM NaCl and a higher level of mTGase. Overall, the non-gelling 6%w/v SPI
dispersion was transformed to a hydrogel with G of 1099 Pa after addition of 100 mM NaCl and
1% protein-coated MMT and treatments by 1%w/v mTGase for 2 h and a heating-cooling cycle.
The much strengthened interactions between the nanofillers and matrix biopolymer can be used
to direct the manufacturing of biodegradable nanocomposite materials with superior functional
performances.

124
LIST OF REFERENCES
Arora, A., & Padua, G. W. (2010). Review: nanocomposites in food packaging. Journal of Food
Science, 75(1), R43-R49.
Caillard, R., Remondetto, G. E., & Subirade, M. (2009). Physicochemical properties and
microstructure of soy protein hydrogels co-induced by Maillard type cross-linking and
salts. Food Research International, 42(1), 98-106.
Caillard, R., Remondetto, G. E., & Subirade, M. (2010). Rheological investigation of soy protein
hydrogels induced by Maillard-type reaction. Food Hydrocolloids, 24(1), 81-87.
Chang, P. R., Yang, Y., Huang, J., Xia, W. B., Feng, L. D., & Wu, J. Y. (2009). Effects of
layered silicate structure on the mechanical properties and structures of protein-based
bionanocomposites. Journal of Applied Polymer Science, 113(2), 1247-1256.
Chen, D. T. N., Wen, Q., Janmey, P. A., Crocker, J. C., & Yodh, A. G. (2010). Rheology of soft
materials. Annu. Rev. Condens. Matter Phys., 1, 301-322.
Chen, P., & Zhang, L. (2006). Interaction and properties of highly exfoliated soy
protein/montmorillonite nanocomposites. Biomacromolecules, 7(6), 1700-1706.
Dang, Q. Q., Lu, S. D., Yu, S., Sun, P. C., & Yuan, Z. (2010). Silk fibroin/montmorillonite
nanocomposites: effect of pH on the conformational transition and clay dispersion.
Biomacromolecules, 11(7), 1796-1801.
de Azeredo, H. M. C. (2009). Nanocomposites for food packaging applications. Food Research
International, 42(9), 1240-1253.
de Carvalho, R. A., & Grosso, C. R. F. (2004). Characterization of gelatin based films modified
with transglutaminase, glyoxal and formaldehyde. Food Hydrocolloids, 18(5), 717-726.

125
Feng, M., Zhao, C. G., Gong, F. L., & Yang, M. S. (2004). Study on the modification of sodium
montmorillonite with amino silanes. Acta Chimica Sinica, 62(1), 83-87.
Gan, C. Y., Latiff, A. A., Cheng, L. H., & Easa, A. M. (2009). Gelling of microbial
transglutaminase cross-linked soy protein in the presence of ribose and sucrose. Food
Research International, 42(10), 1373-1380.
Guilherme, M. R., Mattoso, L. H. C., Gontard, N., Guilbert, S., & Gastaldi, E. (2010). Synthesis
of nanocomposite films from wheat gluten matrix and MMT intercalated with different
quaternary ammonium salts by way of hydroalcoholic solvent casting. Composites Part
a-Applied Science and Manufacturing, 41(3), 375-382.
Ho, M. L., Leu, S. Z., Hsieh, J. F., & Jiang, S. T. (2000). Technical approach to simplify the
purification method and characterization of microbial transglutaminase produced from
Streptoverticillium ladakanum. Journal of Food Science, 65(1), 76-80.
Ikeda, S., & Foegeding, E. A. (1999). Dynamic viscoelastic properties of thermally induced
whey protein isolate gels with added lecithin. Food Hydrocolloids, 13(3), 245-254.
Ikeda, S., Foegeding, E. A., & Hagiwara, T. (1999). Rheological study on the fractal nature of
the protein gel structure. Langmuir, 15(25), 8584-8589.
Jiang, Y., Tang, C.-H., Wen, Q.-B., Li, L., & Yang, X.-Q. (2007). Effect of processing
parameters on the properties of transglutaminase-treated soy protein isolate films.
Innovative Food Science and Emerging Technologies, 8(2), 218-225.
Jiang, Y., Tang, C. H., Wen, Q. B., Li, L., & Yang, X. Q. (2007). Effect of processing
parameters on the properties of transglutaminase-treated soy protein isolate films.
Innovative Food Science & Emerging Technologies, 8(2), 218-225.
126
Kumar, P., Sandeep, K. P., Alavi, S., Truong, V. D., & Gorga, R. E. (2010a). Effect of type and
content of modified montmorillonite on the structure and properties of bio-
nanocomposite films based on soy protein isolate and montmorillonite. Journal of Food
Science, 75(5), N46-N56.
Kumar, P., Sandeep, K. P., Alavi, S., Truong, V. D., & Gorga, R. E. (2010b). Preparation and
characterization of bio-nanocomposite films based on soy protein isolate and
montmorillonite using melt extrusion. Journal of Food Engineering, 100(3), 480-489.
L'Hocine, L., Boye, J. I., & Arcand, Y. (2006). Composition and functional properties of soy
protein isolates prepared using alternative defatting and extraction procedures. Journal of
Food Science, 71(3), C137-C145.
Lakemond, C. M. M., de Jongh, H. H. J., Hessing, M., Gruppen, H., & Voragen, A. G. J. (2000).
Soy glycinin: Influence of pH and ionic strength on solubility and molecular structure at
ambient temperatures. Journal of Agricultural and Food Chemistry, 48(6), 1985-1990.
Lakemond, C. M. M., de Jongh, H. H. J., Paques, M., van Vliet, T., Gruppen, H., & Voragen, A.
G. J. (2003). Gelation of soy glycinin; influence of pH and ionic strength on network
structure in relation to protein conformation. Food Hydrocolloids, 17(3), 365-377.
Le Corre, D., Bras, J., & Dufresne, A. (2010). Starch nanoparticles: a review.
Biomacromolecules, 11(5), 1139-1153.
Lee, J. E., & Kim, K. M. (2010). Characteristics of Soy Protein Isolate-Montmorillonite
Composite Films. Journal of Applied Polymer Science, 118(4), 2257-2263.
Lin, J. J., Wei, J. C., Juang, T. Y., & Tsai, W. C. (2007). Preparation of protein-silicate hybrids
from polyamine intercalation of layered montmorillonite. Langmuir, 23(4), 1995-1999.
127
Malhotra, A., & Coupland, J. N. (2004). The effect of surfactants on the solubility, zeta potential,
and viscosity of soy protein isolates. Food Hydrocolloids, 18(1), 101-108.
Mallakpour, S., & Dinari, M. (2011). Preparation and characterization of new organoclays using
natural amino acids and Cloisite Na(+). Applied Clay Science, 51(3), 353-359.
Mariotti, F., Tome, D., & Mirand, P. P. (2008). Converting nitrogen into protein - Beyond 6.25
and Jones' factors. Critical Reviews in Food Science and Nutrition, 48(2), 177-184.
Martucci, J. F., & Ruseckaite, R. A. (2010). Biodegradable three-layer film derived from bovine
gelatin. Journal of Food Engineering, 99(3), 377-383.
Motoki, M., & Seguro, K. (1998). Transglutaminase and its use for food processing. Trends in
Food Science & Technology, 9(5), 204-210.
Nury, S., Meunier, J. C., & Mouranche, A. (1989). The kinetics of the thermal deactivation of
transglutaminase from guinea-pig liver. European Journal of Biochemistry, 180(1), 161-
166.
Seguro, K., Nio, N., & Motoki, M. (1996). Some characteristics of a microbial protein cross-
linking enzyme: Transglutaminase. In N. K. A. C. L. K. P. J. Parris (Ed.),
Macromolecular Interactions in Food Technology, vol. 650 (pp. 271-280).
Song, F., Tang, D. L., Wang, X. L., & Wang, Y. Z. (2011). Biodegradable soy protein isolate-
based materials: a review. Biomacromolecules, 12(10), 3369-3380.
Song, F., & Zhang, L. M. (2008). Enzyme-catalyzed formation and structure characteristics of a
protein-based hydrogel. Journal of Physical Chemistry B, 112(44), 13749-13755.
Tang, C. H., Choi, S. M., & Ma, C. Y. (2007). Study of thermal properties and heat-induced
denaturation and aggregation of soy proteins by modulated differential scanning
calorimetry. International Journal of Biological Macromolecules, 40(2), 96-104.

128
Tang, X. Z., Alavi, S., & Herald, T. J. (2008). Barrier and mechanical properties of starch-clay
nanocomposite films. Cereal Chemistry, 85(3), 433-439.
Tsai, G. J., Lin, S. M., & Jiang, S. T. (1996). Transglutaminase from Streptoverticillium
ladakanum and application to minced fish product. Journal of Food Science, 61(6), 1234-
1238.
van Vliet, T. (1988). Rheological properties of filled gels. Influence of filler matrix interaction
Colloid and Polymer Science, 266(6), 518-524.
Wolf, W. J. (1970). Soybean protiens - their functional, chemical, and physical properties.
Journal of Agricultural and Food Chemistry, 18(6), 969-&.
Yildirim, M., & Hettiarachchy, N. S. (1998). Properties of films produced by cross-linking whey
proteins and 11S globulin using transglutaminase. Journal of Food Science, 63(2), 248-
252.
Zhu, Y., Bol, J., Rinzema, A., Tramper, J., & Wijngaards, G. (1999). Transglutaminase as a
potential tool in developing novel protein foods. Agro Food Industry Hi-Tech, 10(1), 8-
10.
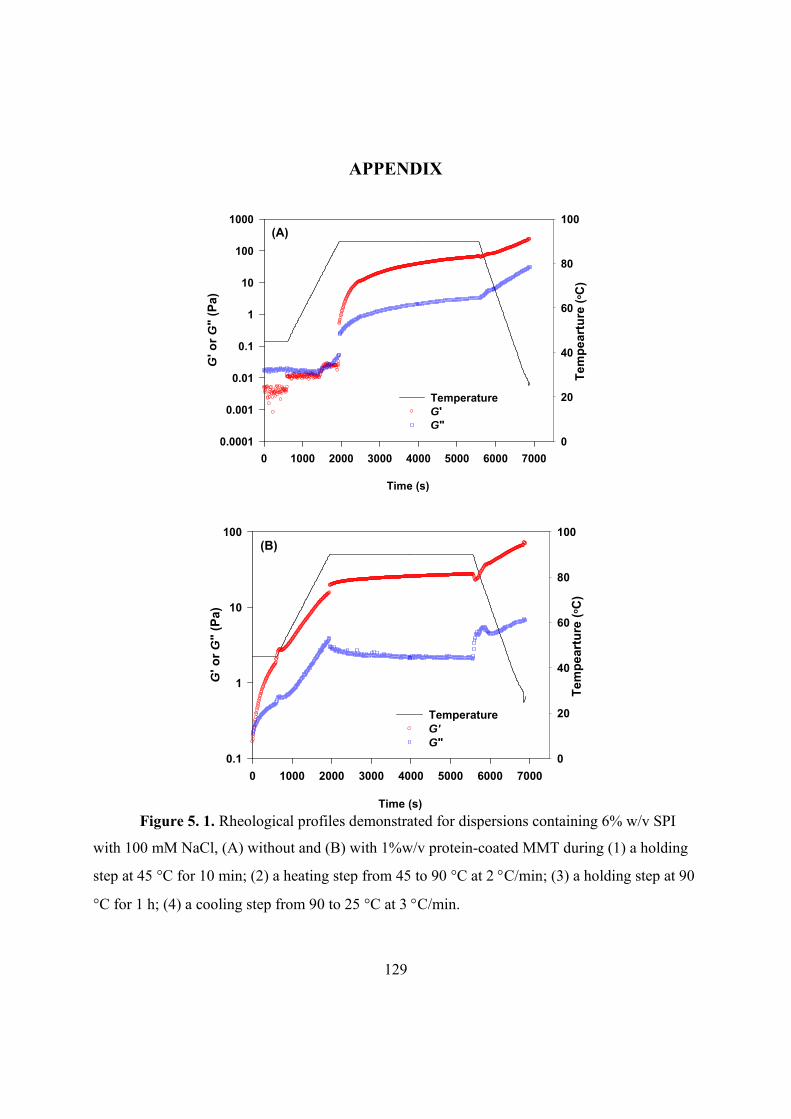
129
APPENDIX
Time (s)
0 1000 2000 3000 4000 5000 6000 7000
Tem
pea
rtu
re (
oC
)
0
20
40
60
80
100G
' or
G"
(Pa)
0.0001
0.001
0.01
0.1
1
10
100
1000
TemperatureG'G"
(A)
Time (s)
0 1000 2000 3000 4000 5000 6000 7000
Tem
pea
rtu
re (
oC
)
0
20
40
60
80
100
G' o
r G
" (P
a)
0.1
1
10
100
TemperatureG'G"
(B)
Figure 5. 1. Rheological profiles demonstrated for dispersions containing 6% w/v SPI
with 100 mM NaCl, (A) without and (B) with 1%w/v protein-coated MMT during (1) a holding
step at 45 °C for 10 min; (2) a heating step from 45 to 90 °C at 2 C/min; (3) a holding step at 90
°C for 1 h; (4) a cooling step from 90 to 25 °C at 3 C/min.

130

131
Figure 5. 2. Rheological profiles demonstrated for dispersions containing 6% w/v SPI
with (A) 0.3%w/v mTGase, (B) 0.3%w/v mTGase and 1%w/v protein-coated MMT, (C)
0.4%w/v mTGase and 100 mM NaCl, and (D) 0.4%w/v mTGase, 100 mM NaCl and 1%w/v
protein-coated MMT during (1) a holding step at 45 °C for 2 h; (2) a heating step from 45 to 90
°C at 2 C/min; (3) a holding step at 90 °C for 1 h; (4) a cooling step from 90 to 25 °C at 3
C/min.
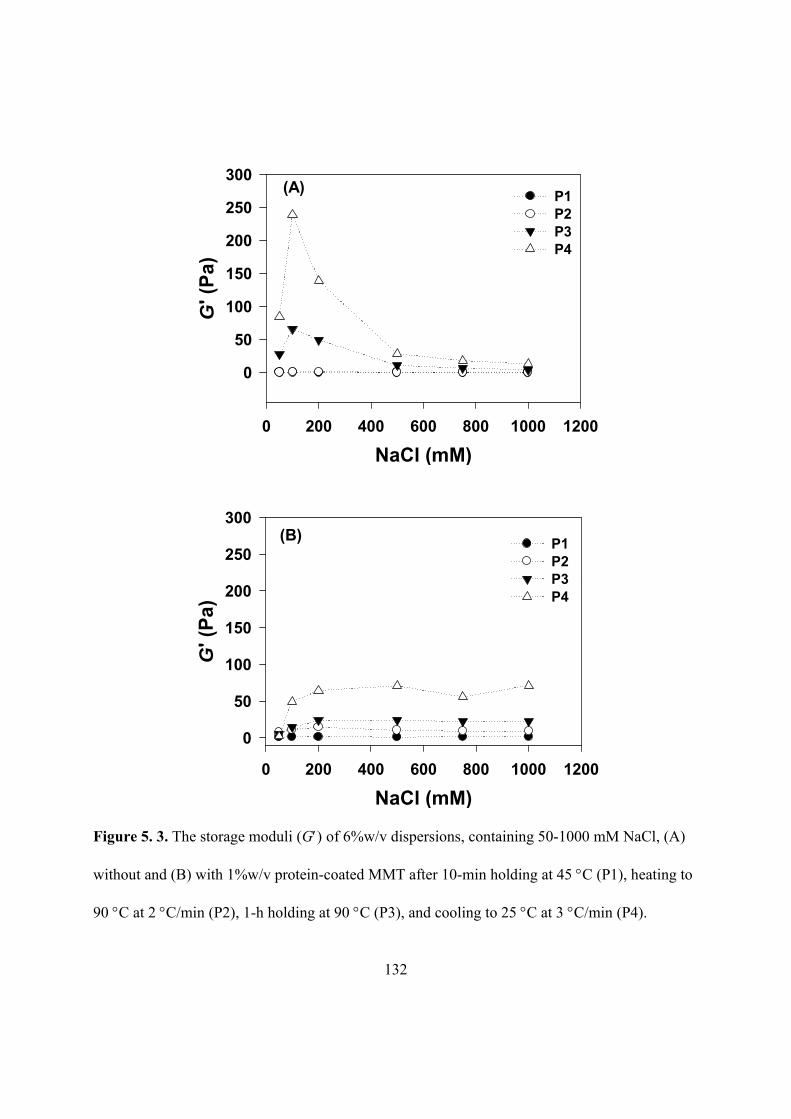
132
NaCl (mM)
0 200 400 600 800 1000 1200
G' (
Pa)
0
50
100
150
200
250
300P1P2P3P4
(A)
NaCl (mM)
0 200 400 600 800 1000 1200
G' (
Pa)
0
50
100
150
200
250
300
P1P2P3P4
(B)
Figure 5. 3. The storage moduli (G) of 6%w/v dispersions, containing 50-1000 mM NaCl, (A)
without and (B) with 1%w/v protein-coated MMT after 10-min holding at 45 C (P1), heating to
90 C at 2 C/min (P2), 1-h holding at 90 C (P3), and cooling to 25 C at 3 C/min (P4).
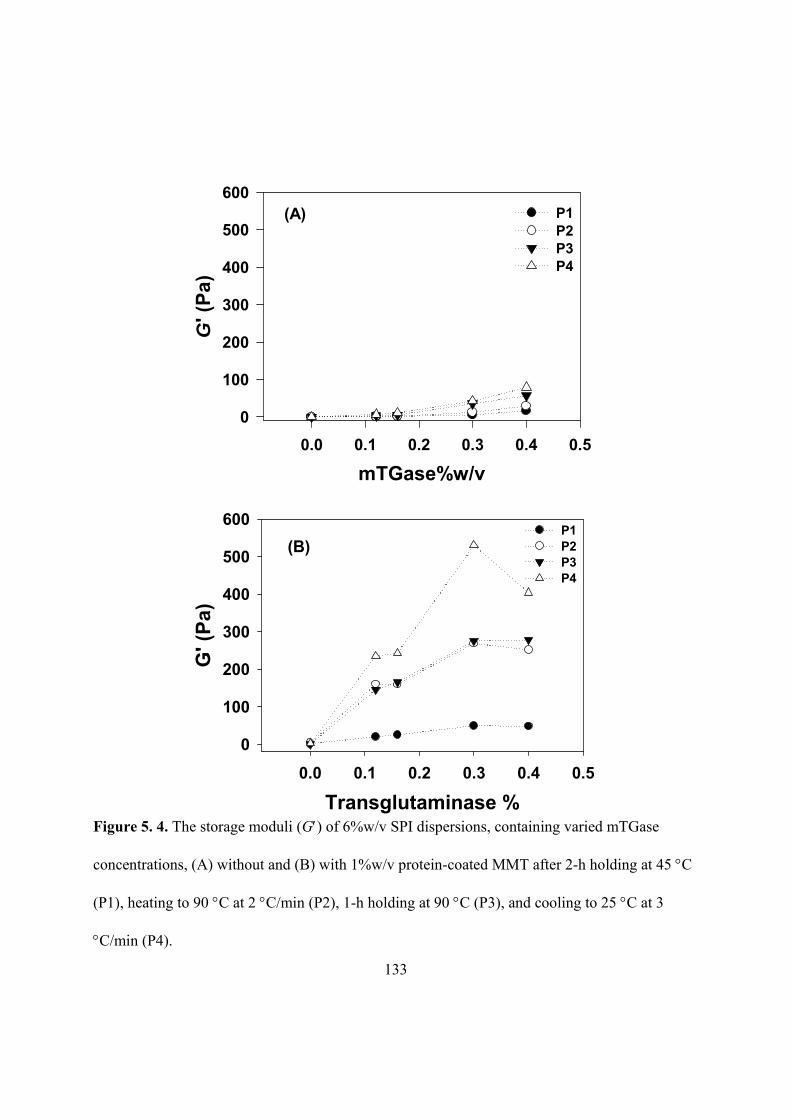
133
mTGase%w/v
0.0 0.1 0.2 0.3 0.4 0.5
G' (
Pa)
0
100
200
300
400
500
600P1P2P3P4
(A)
Transglutaminase %
0.0 0.1 0.2 0.3 0.4 0.5
G' (
Pa)
0
100
200
300
400
500
600P1P2P3P4
(B)
Figure 5. 4. The storage moduli (G) of 6%w/v SPI dispersions, containing varied mTGase
concentrations, (A) without and (B) with 1%w/v protein-coated MMT after 2-h holding at 45 C
(P1), heating to 90 C at 2 C/min (P2), 1-h holding at 90 C (P3), and cooling to 25 C at 3
C/min (P4).

134
mTGase %w/v
0.0 .2 .4 .6 .8 1.0 1.2
Gel
ling
Tim
e (s
)
0
2000
4000
6000No MMTMMT
Figure 5. 5. Effects of mTGase concentration on gelation time during crosslinking 6%w/v SPI
dispersions with and without 1%w/v protein-coated MMT.
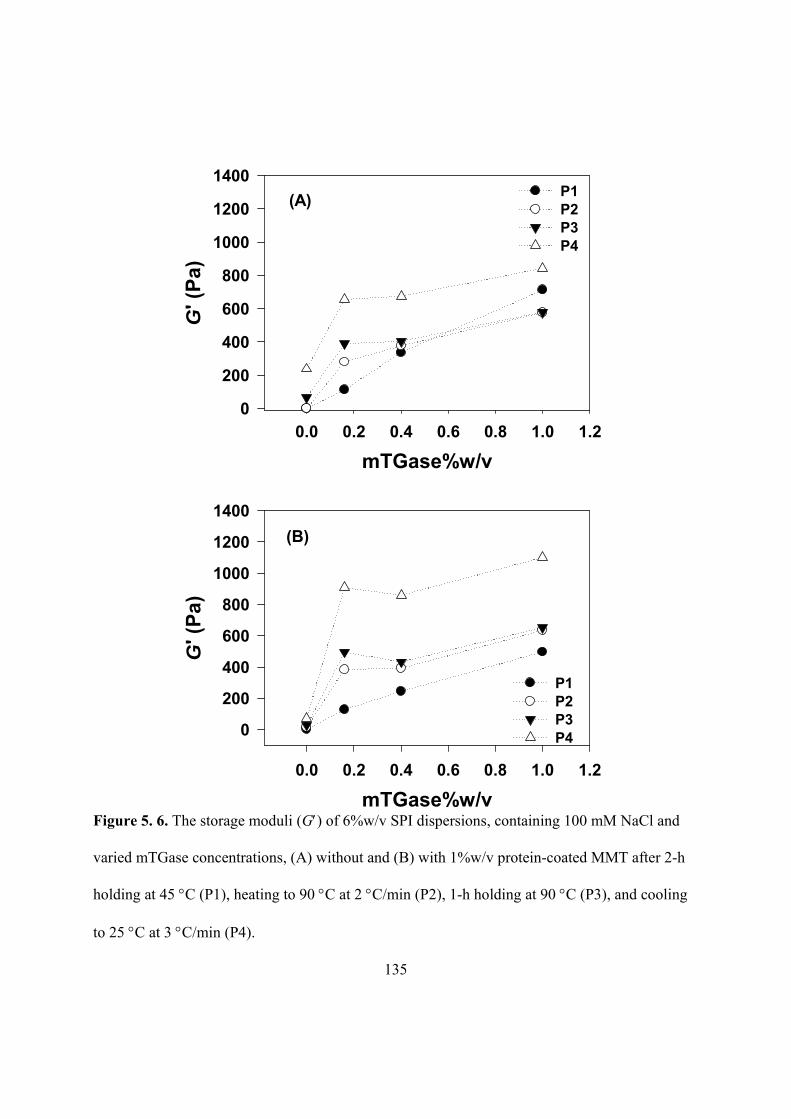
135
mTGase%w/v
0.0 0.2 0.4 0.6 0.8 1.0 1.2
G' (
Pa)
0
200
400
600
800
1000
1200
1400P1P2P3P4
(A)
mTGase%w/v
0.0 0.2 0.4 0.6 0.8 1.0 1.2
G' (
Pa)
0
200
400
600
800
1000
1200
1400
P1P2P3P4
(B)
Figure 5. 6. The storage moduli (G) of 6%w/v SPI dispersions, containing 100 mM NaCl and
varied mTGase concentrations, (A) without and (B) with 1%w/v protein-coated MMT after 2-h
holding at 45 C (P1), heating to 90 C at 2 C/min (P2), 1-h holding at 90 C (P3), and cooling
to 25 C at 3 C/min (P4).
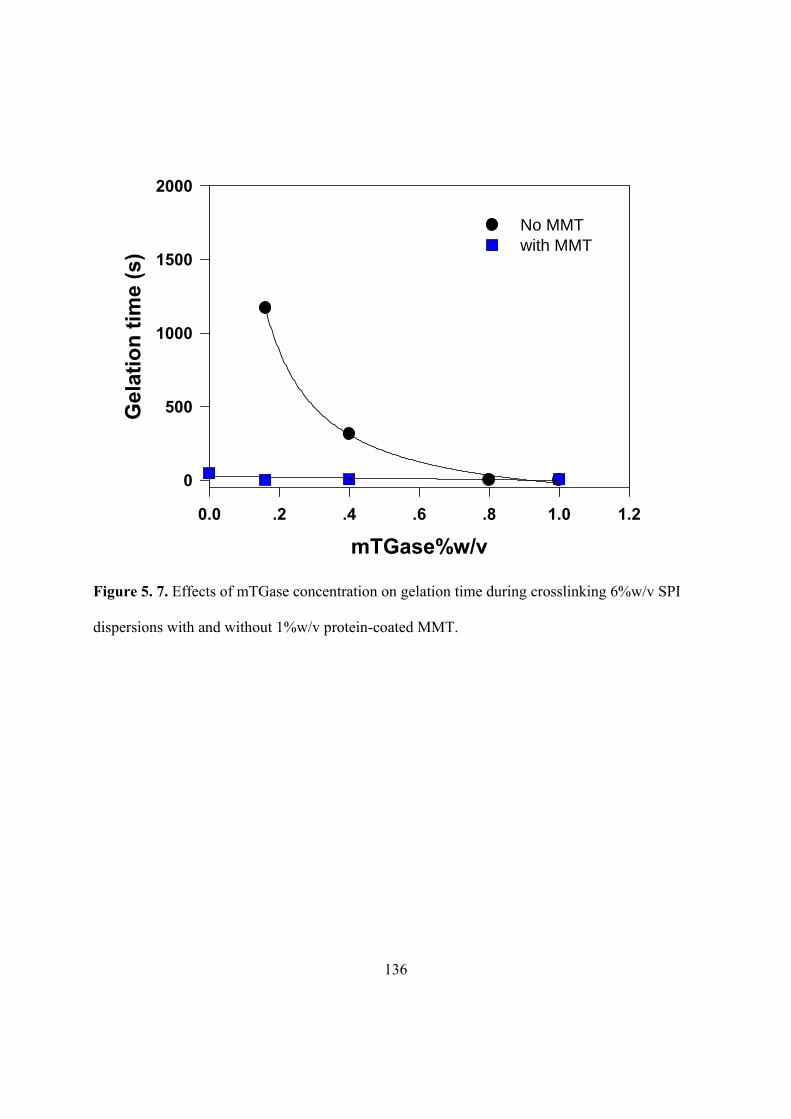
136
mTGase%w/v
0.0 .2 .4 .6 .8 1.0 1.2
Gel
atio
n t
ime
(s)
0
500
1000
1500
2000
No MMTwith MMT
Figure 5. 7. Effects of mTGase concentration on gelation time during crosslinking 6%w/v SPI
dispersions with and without 1%w/v protein-coated MMT.
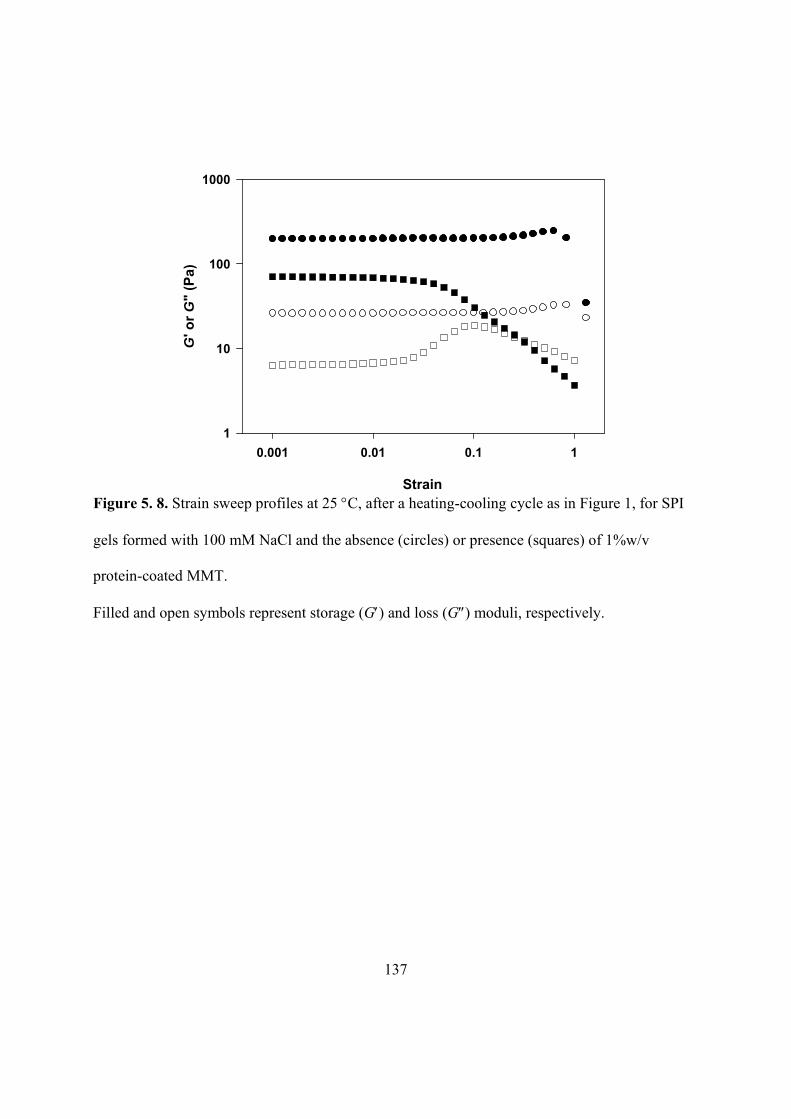
137
Strain
0.001 0.01 0.1 1
G' o
r G
" (P
a)
1
10
100
1000
Figure 5. 8. Strain sweep profiles at 25 C, after a heating-cooling cycle as in Figure 1, for SPI
gels formed with 100 mM NaCl and the absence (circles) or presence (squares) of 1%w/v
protein-coated MMT.
Filled and open symbols represent storage (G) and loss (G) moduli, respectively.
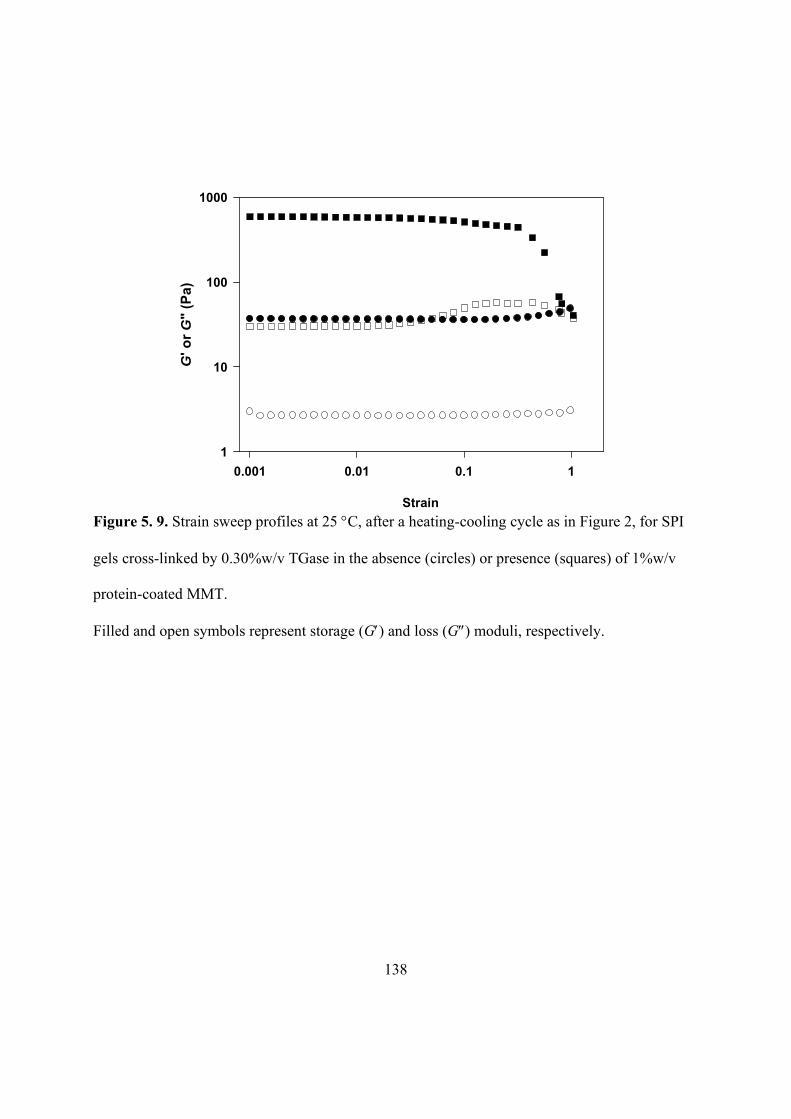
138
Strain
0.001 0.01 0.1 1
G' o
r G
" (P
a)
1
10
100
1000
Figure 5. 9. Strain sweep profiles at 25 C, after a heating-cooling cycle as in Figure 2, for SPI
gels cross-linked by 0.30%w/v TGase in the absence (circles) or presence (squares) of 1%w/v
protein-coated MMT.
Filled and open symbols represent storage (G) and loss (G) moduli, respectively.
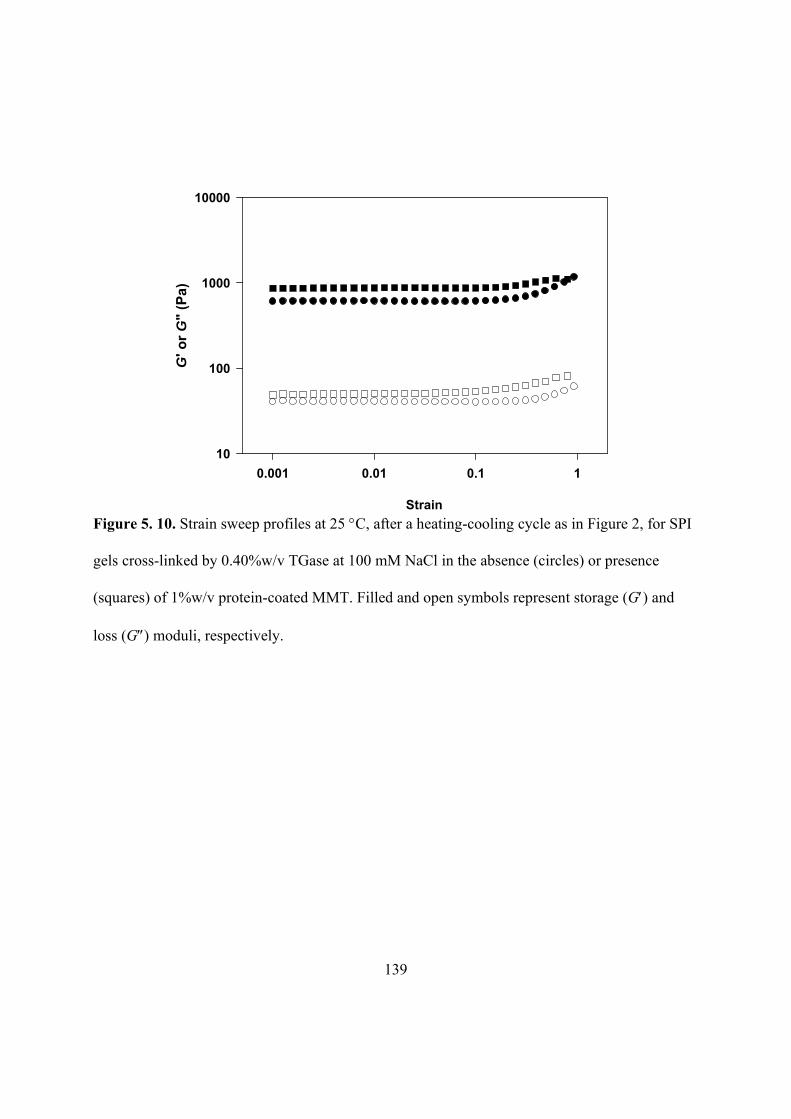
139
Strain
0.001 0.01 0.1 1
G' o
r G
" (P
a)
10
100
1000
10000
Figure 5. 10. Strain sweep profiles at 25 C, after a heating-cooling cycle as in Figure 2, for SPI
gels cross-linked by 0.40%w/v TGase at 100 mM NaCl in the absence (circles) or presence
(squares) of 1%w/v protein-coated MMT. Filled and open symbols represent storage (G) and
loss (G) moduli, respectively.
140
CHAPTER 6 . EFFECTS OF GLUTARALDEHYDE CONCENTRATION, pH AND TEMPERATURE ON
RHEOLOGICAL PROPERTIES OF NANOCOMPOSITES CONSISTING OF INTERCALATED
MONTMORILLONITE DISPERSED IN SOY PROTEIN MATRIX
141
6.1. ABSTRACT
Cross-linking of proteins between matrix protein polymers and protein-coated
montmorillonite (MMT) may strengthen the interactions of relevant bio-nanocomposite systems,
besides the well-established concept that material properties are improved by the incorporation
of highly intercalated or exfoliated nanoclays. Dynamic rheological tests were utilized as a non-
destructive method to illustrate the formation of hydrogel network and the strength during
chemical crosslinking by glutaraldehyde (GA), impacted by GA concentration, pH, cross-linking
temperature, and the absence and presence of coated MMT. In the absence of MMT, the storage
modulus (G) gradually increased with an increase in GA concentration, while the incorporation
of MMT further increased G to a high order of magnitude. At a GA concentration equal to 10%
mass of soy protein, increased chemical crosslinking rates and G were observed at ambient
temperature than those at 90 °C, while results were opposite at lower additions of GA. At pH 5.5,
the strength of soy protein nanocomposite gel network was greatly improved with the existence
of particulate aggregates. The results showed that the interactions in cross-linked soy protein gel
system were enhanced by the incorporation of protein-coated MMT and the synergetic impacts
of GA concentration, pH, and crosslinking temperature. The established chemical cross-linking
method between fillers and matrix and conditions can be beneficial for preparing
bionanocomposite materials with enhanced mechanical properties.
Keywords: nanocomposite, chemical crosslinking, soy protein, protein-coated montmorillonite,
dynamic rheology
142
6.2. INTRODUCTION
The modification of nanofillers to obtain good dispersibility has been demonstrated for
improving material properties of nanocomposite systems (Arora & Padua, 2010; Lin, Wei, Juang,
& Tsai, 2007; Spirkova, Duchek, Strachota, Poreba, Kotek, Baldrian, et al., 2011).
Montmorillonite (MMT) is an intensively-studied nanofiller because of the abundance,
availability, low cost, and the specific characteristics of high elastic modulus (178 GPa), high
surface area (750 m2/g) and large aspect ratio (50-1000) (Kumar, 2009). The specific
characteristics of MMT contribute to enhanced mechanical and barrier properties of
nanocomposite materials (de Azeredo, 2009; Essington, 2003; Gunister, Pestreli, Unlu, Atici, &
Gungor, 2007; Le Corre, Bras, & Dufresne, 2010). Chemical or physical modifications of MMT
have been demonstrated for enlarging the basal spacing between platelets and modifying the clay
layers from highly ordered to intercalated and/or exfoliated structures (Feng, Zhao, Gong, &
Yang, 2004; Mallakpour & Dinari, 2011; Yang, Zhu, Yin, Wang, & Qi, 1999). The affinity of
proteins and amino acids on soil minerals indicates the possibility of surface coating MMT with
naturally-existing proteins (Ding & Henrichs, 2002; Quiquampoix & Burns, 2007). MMT
modified with proteins can thus potentially further improve the interactions within the bio-
composite system by enhancing interactions between biopolymer molecules in the interphase
layer formed between the MMT and those in the bulk (Shenoy, 1999). Our studies in Chapters 3
and 4 identified the feasibility of surface-coating MMT with extracted plant proteins, i.e., water
soluble hominy protein and soy protein, to obtain the enlarged basal spacing and
intercalated/exfoliated structures of MMT with a sufficient MMT:protein mass ratios and coating
pH.
143
Crosslinking is a potential method for further strengthening the interaction among our
protein-based nanocomposite system because of the possibility to form covalent bonds between
proteins on MMT and those in the continuous phase. Enzymatic and chemical cross-linking
approaches have been studied for soy proteins to enhance the hydrogel, polymer, and film
properties (Caillard, Remondetto, & Subirade, 2009, 2010; de Carvalho & Grosso, 2004; Gan,
Latiff, Cheng, & Easa, 2009; Jiang, Tang, Wen, Li, & Yang, 2007b; Yildirim & Hettiarachchy,
1998). Cross-linkers containing aldehyde groups include glutaraldehyde, formaldehyde, glyxoal,
dialdehyde starch, hexanedial, biacetyl, and cyclopentane-dione and have been widely utilized
for protein crosslinking (Gerrard, et al., 2005). This type of crosslinking reaction is called
“Maillard-type” crosslinking (Caillard, Remondetto, & Subirade, 2009, 2010) because covalent
amide (CO-NH) bonds are formed between lysine residues on protein molecules and aldehyde
groups on cross-linkers, resulting in the loss of lysine residues on proteins (Gerrard, Brown, &
Fayle, 2003). Soy proteins cross-linked by glutaraldehyde had a lowered solubility, lowered
emulsifying properties and improved foaming stabilities. Meanwhile, glutaraldehyde-treatment
enhanced tensile strength and elongation at break of soy protein isolate (SPI) films, more
significantly at increased glutaraldehyde concentrations (Park, Bae, & Rhee, 2000). Increased
tensile properties and improved processability as a resin of soy protein concentrate were also
obtained by crosslinking with glutaraldehyde to manufacture flax fabric-reinforced composites
(Chabba & Netravali, 2005).
Soy protein, as an abundant plant supply resource with good film-forming properties, has
been frequently studied to develop either protein coatings/films alone or clay-incorporated
nanocomposite films (Chen, Tian, Zhang, Chen, Wang, & Do, 2008; Kumar, Sandeep, Alavi,
Truong, & Gorga, 2010a, 2010b; Nayak, Sasmal, Nayak, Sahoo, Mishra, Kang, et al., 2008;
144
Zhao, Torley, & Halley, 2008). In this dissertation research, our objective was to improve the
interaction between the matrix biopolymer – soy protein and protein-coated MMT for potentially
developing protein-based nanocomposites with further enhanced mechanical and barrier
properties. In Chapter 5, enzymatic crosslinking induced by transglutaminase was investigated
and demonstrated that the incorporation of protein-coated MMT further increased the storage
modulus and hydrogel network strength at the optimized ionic strength. In this study, chemical
crosslinking was utilized to strengthen the interactions between protein-coated MMT and bulk
soy proteins. Formaldehyde, glutaraldehyde, and glyxoal were studied in our preliminary tests.
Results showed that the best crosslinking effect, evident by highest rheological moduli, was
obtained by utilizing glutaraldehyde, consistent with the literatures that glutaraldehyde was the
most reactive cross-linker among these three (Gerrard, Brown, & Fayle, 2003). Small-
deformation rheological analyses were performed as a non-destructive method to illustrate the
development of rheology moduli and the formation of hydrogel network, impacted by pH (5.5,
6.5, and 10.0), cross-linking temperature (23, 60, and 90°C), glutaradehyde concentration (2.0,
4.0, and 10.0% mass of spray-dried soy protein powder, and the absence and presence of
protein-coated MMT.
6.3. MATERIALS AND METHODS
6.3.1. Materials
Na+-montmorillonite (Cloisite® Na+ Nanoclay) used in the present study was supplied
from Southern Clay Products, Inc. (Gonzales, TX). Commercial soy flour was obtained from MP
Biomedicals, LLC (Solon, OH). Glutaraldehyde (50 wt% solution in water) was purchased from
Sigma-Aldrich Corp. (St. Louis, MO), used as received. Mineral oil and other chemicals were of
145
analytical grade and purchased from Fisher Scientific (Fair Lawn, NJ) and Sigma-Aldrich Corp.
(St. Louis, MO).
6.3.2. Extraction of Soy Protein
Soy protein used in present study was extracted from commercial soy flour using a
modified protocol for preparing SPI (L'Hocine, Boye, & Arcand, 2006). Soy flour was finely
ground utilizing a coffee grinder (Hamilton Beach Proctor-Silex, Inc., Southern Pines, NC),
suspended in deionized water at a solid:liquid mass ratio of 1:10, adjusted to pH 9.0, and
vigorously stirred at 48 °C for 3 h using a magnetic stirring hot plate (model Isotemp®, Fisher
Scientific, Fair Lawn, NJ). The suspension was then centrifuged (Sorvall RC 5B Plus, Newtown,
CT) at 3,778g for 30 min at ambient temperature. The extraction in alkaline condition was
repeated three times to increase the protein extraction yield on each batch of soy flour. The
supernatants were filtered twice using a #1 filter paper and then twice with a #2 filter paper
(Whatman®, Lawrence, KS), followed by adjustment to pH 4.5 for acidic precipitation of soy
proteins. The precipitate was separated by centrifugation (3,778g for 15 min), re-suspended in
deionized water and adjusted to pH 9.0, re-precipitated at pH 4.5 and centrifuged as above. The
re-suspension and re-precipitation procedures were repeated for a third time. The final protein
precipitate was suspended in deionized water, adjusted to pH 6.5, and spray-dried by using a B-
290 Mini Spray Dryer (BÜCHI Labortechnik AG, Postfach, Switzerland). The spray drying
parameters were as below: a feed rate of 6.67 mL/min and inlet and outlet temperatures of 150
and 55-65 C, respectively. Afterwards, the spray-dried soy protein powder (SPI) was collected
and stored at a -20 °C freezer.
146
6.3.3. Preparation of Protein-coated MMT
Surface-coated MMT by SPI was prepared via solution intercalation (Chen & Zhang,
2006). In Chapter 4, surface-coating conditions were optimized at an MMT:SPI mass ratio of 4:1
and pH 9.0, at which the X-ray diffraction test illustrated highly intercalated nanoclay platelets
that are expected to improve the interaction with biopolymer matrix. Practically, dispersions of
0.5% w/v SPI or 2% w/v MMT were prepared in 10 mM NaH2PO4 buffer, adjusted to pH 9.0,
heated at 60 °C, and stirred at 300 rpm for 30 min using a magnetic stirring hot plate,
respectively. The MMT dispersion was slowly added to the same volume of SPI dispersion,
while being vigorously agitated at 1000 rpm and heated at 60 °C. The resultant slurry was
agitated for 3 h and then ready for hydrating SPI for chemical cross-linking.
6.3.4. Sample Preparation for Rheological Measurement
Dispersions containing 8% w/v SPI were prepared in 10 mM NaH2PO4 buffer or protein-
coated MMT slurry overnight, and adjusted to a pH of 5.5, 6.5 or 10.0. Immediately before the
rheological test, predetermined amounts of glutaraldehyde were added to the SPI dispersions to
achieve the final concentrations of 2.0, 4.0, and 10.0% mass of SPI.
6.3.5. Dynamic Rheological Analyses
Small-deformation rheological analyses were performed with an AR2000 rheometer (TA
Instruments, New Castle, DE). A concentric cylinder geometry consisting of a bob with an outer
diameter of 28 mm and a cup with an inner diameter of 30 mm was applied for measuring the
storage modulus (G) and loss modulus (G) during cross-linking. Approximately 15 mL of the
prepared SPI dispersion were carefully added into the cup. After positioning the bob and
removing the excess sample, a thin layer of mineral oil was applied to the top of the sample to
minimize moisture evaporation during monitoring. The small-deformation tests included the

147
following sequential steps: (1) an isothermal step at a designed temperature of 23, 60, or 90 C
for 5 h, at a strain of 0.01 and a frequency of 1 Hz and (2) a strain sweep test at 23 C at a strain
range of 0.001-1 and a frequency of 1 Hz. All experiments were performed in duplicate and the
averages were reported.
6.4. RESULTS AND DISCUSSION
6.4.1. Effects of Glutaraldehyde Concentration and MMT
Soy proteins having an isoelectric point around pH 4.5 are partially unfolded in alkaline
conditions and a greater number of lysine residues are available for the crosslinking reaction
catalyzed by glutaraldehyde (Jiang et al. 2009). Therefore, effects of the glutaraldehyde
concentration were investigated at pH 10.0 in this section. Figure 6.1 presents developments of
G and G during the isothermal treatment at 23 C and pH 10.0 for up to 5 hours as affected by
different levels of glutaraldehyde and the absence and presence of protein-coated MMT. In the
absence of protein-coated MMT (Figure 6.1A), 2.0% glutaraldehyde was insufficient to cause
gelation. The G appears to increase somewhat faster than G but G was still larger than G at
the end of the treatment. When treated with 4.0 and 10.0% glutaraldehyde, G was already larger
than G at the beginning of the treatment, indicating that glutaraldehyde is a very reactive cross-
linker (Gerrard, et al., 2005). The addition of surface coated MMT resulted in remarkable
increases in both G and G at all examined glutaraldehyde concentrations (Figure 6.1B).
Figure 6.2 shows the strain dependence of G and G after the isothermal treatment at 23
C. The all examined samples showed a limit of linear viscoelastic regime (LLVR) greater than
approximately 0.05, verifying that the strain amplitude used in oscillatory shear tests (0.01) was
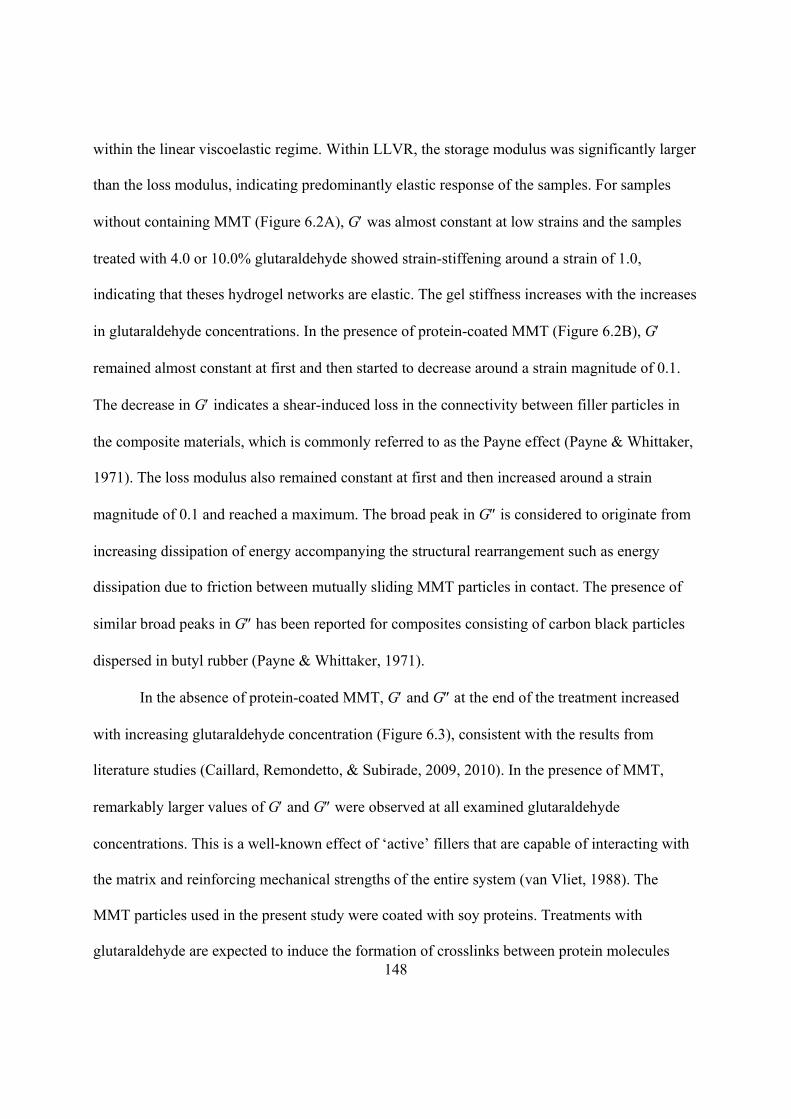
148
within the linear viscoelastic regime. Within LLVR, the storage modulus was significantly larger
than the loss modulus, indicating predominantly elastic response of the samples. For samples
without containing MMT (Figure 6.2A), G was almost constant at low strains and the samples
treated with 4.0 or 10.0% glutaraldehyde showed strain-stiffening around a strain of 1.0,
indicating that theses hydrogel networks are elastic. The gel stiffness increases with the increases
in glutaraldehyde concentrations. In the presence of protein-coated MMT (Figure 6.2B), G
remained almost constant at first and then started to decrease around a strain magnitude of 0.1.
The decrease in G indicates a shear-induced loss in the connectivity between filler particles in
the composite materials, which is commonly referred to as the Payne effect (Payne & Whittaker,
1971). The loss modulus also remained constant at first and then increased around a strain
magnitude of 0.1 and reached a maximum. The broad peak in G is considered to originate from
increasing dissipation of energy accompanying the structural rearrangement such as energy
dissipation due to friction between mutually sliding MMT particles in contact. The presence of
similar broad peaks in G has been reported for composites consisting of carbon black particles
dispersed in butyl rubber (Payne & Whittaker, 1971).
In the absence of protein-coated MMT, G and G at the end of the treatment increased
with increasing glutaraldehyde concentration (Figure 6.3), consistent with the results from
literature studies (Caillard, Remondetto, & Subirade, 2009, 2010). In the presence of MMT,
remarkably larger values of G and G were observed at all examined glutaraldehyde
concentrations. This is a well-known effect of ‘active’ fillers that are capable of interacting with
the matrix and reinforcing mechanical strengths of the entire system (van Vliet, 1988). The
MMT particles used in the present study were coated with soy proteins. Treatments with
glutaraldehyde are expected to induce the formation of crosslinks between protein molecules
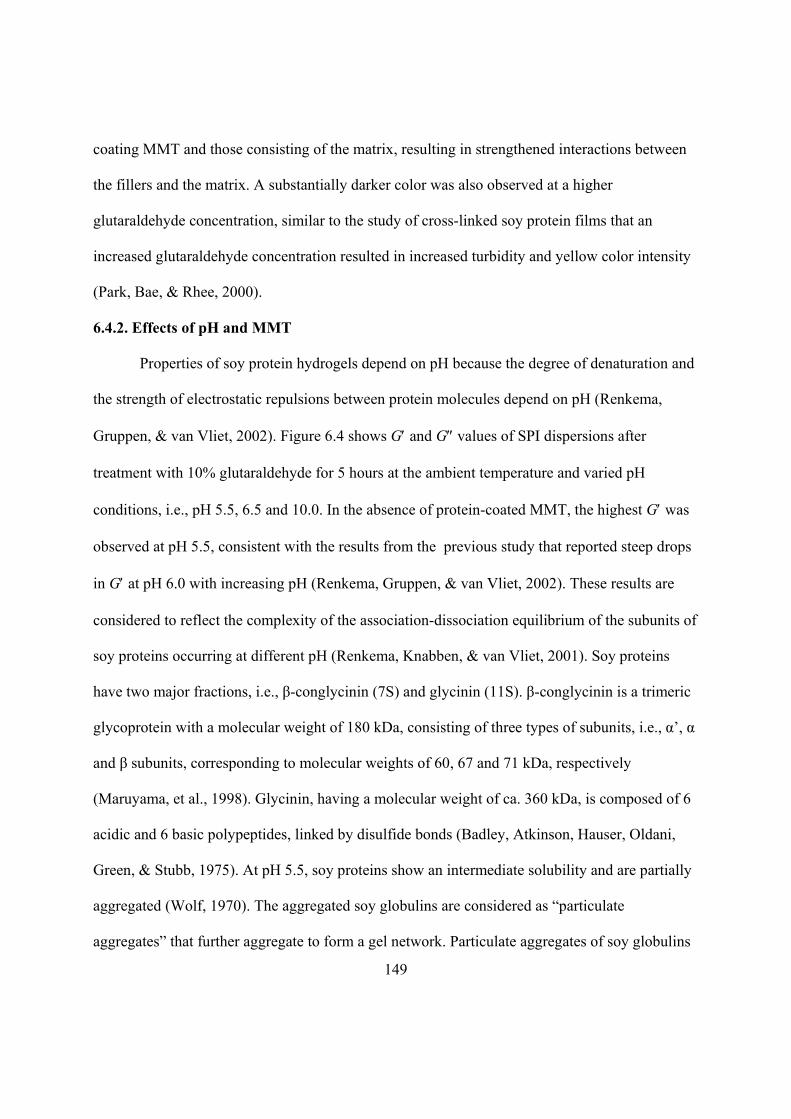
149
coating MMT and those consisting of the matrix, resulting in strengthened interactions between
the fillers and the matrix. A substantially darker color was also observed at a higher
glutaraldehyde concentration, similar to the study of cross-linked soy protein films that an
increased glutaraldehyde concentration resulted in increased turbidity and yellow color intensity
(Park, Bae, & Rhee, 2000).
6.4.2. Effects of pH and MMT
Properties of soy protein hydrogels depend on pH because the degree of denaturation and
the strength of electrostatic repulsions between protein molecules depend on pH (Renkema,
Gruppen, & van Vliet, 2002). Figure 6.4 shows G and G values of SPI dispersions after
treatment with 10% glutaraldehyde for 5 hours at the ambient temperature and varied pH
conditions, i.e., pH 5.5, 6.5 and 10.0. In the absence of protein-coated MMT, the highest G was
observed at pH 5.5, consistent with the results from the previous study that reported steep drops
in G at pH 6.0 with increasing pH (Renkema, Gruppen, & van Vliet, 2002). These results are
considered to reflect the complexity of the association-dissociation equilibrium of the subunits of
soy proteins occurring at different pH (Renkema, Knabben, & van Vliet, 2001). Soy proteins
have two major fractions, i.e., β-conglycinin (7S) and glycinin (11S). β-conglycinin is a trimeric
glycoprotein with a molecular weight of 180 kDa, consisting of three types of subunits, i.e., α’, α
and β subunits, corresponding to molecular weights of 60, 67 and 71 kDa, respectively
(Maruyama, et al., 1998). Glycinin, having a molecular weight of ca. 360 kDa, is composed of 6
acidic and 6 basic polypeptides, linked by disulfide bonds (Badley, Atkinson, Hauser, Oldani,
Green, & Stubb, 1975). At pH 5.5, soy proteins show an intermediate solubility and are partially
aggregated (Wolf, 1970). The aggregated soy globulins are considered as “particulate
aggregates” that further aggregate to form a gel network. Particulate aggregates of soy globulins
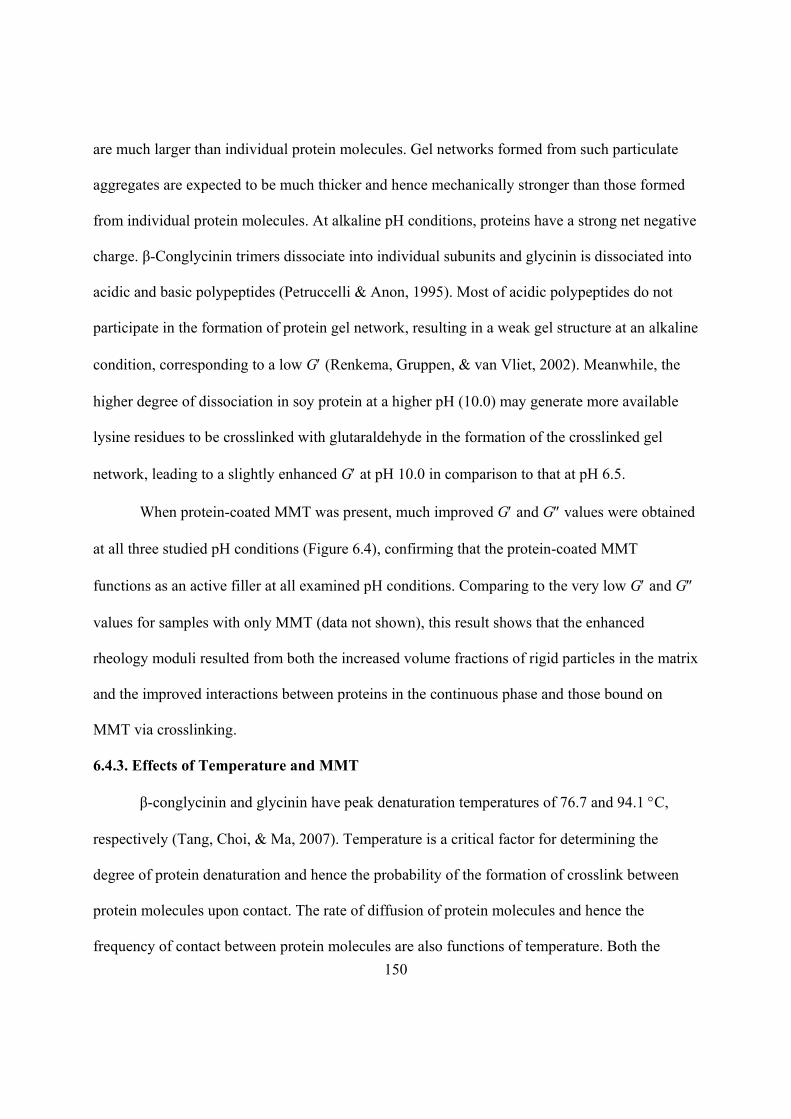
150
are much larger than individual protein molecules. Gel networks formed from such particulate
aggregates are expected to be much thicker and hence mechanically stronger than those formed
from individual protein molecules. At alkaline pH conditions, proteins have a strong net negative
charge. β-Conglycinin trimers dissociate into individual subunits and glycinin is dissociated into
acidic and basic polypeptides (Petruccelli & Anon, 1995). Most of acidic polypeptides do not
participate in the formation of protein gel network, resulting in a weak gel structure at an alkaline
condition, corresponding to a low G (Renkema, Gruppen, & van Vliet, 2002). Meanwhile, the
higher degree of dissociation in soy protein at a higher pH (10.0) may generate more available
lysine residues to be crosslinked with glutaraldehyde in the formation of the crosslinked gel
network, leading to a slightly enhanced G at pH 10.0 in comparison to that at pH 6.5.
When protein-coated MMT was present, much improved G and G values were obtained
at all three studied pH conditions (Figure 6.4), confirming that the protein-coated MMT
functions as an active filler at all examined pH conditions. Comparing to the very low G and G
values for samples with only MMT (data not shown), this result shows that the enhanced
rheology moduli resulted from both the increased volume fractions of rigid particles in the matrix
and the improved interactions between proteins in the continuous phase and those bound on
MMT via crosslinking.
6.4.3. Effects of Temperature and MMT
β-conglycinin and glycinin have peak denaturation temperatures of 76.7 and 94.1 C,
respectively (Tang, Choi, & Ma, 2007). Temperature is a critical factor for determining the
degree of protein denaturation and hence the probability of the formation of crosslink between
protein molecules upon contact. The rate of diffusion of protein molecules and hence the
frequency of contact between protein molecules are also functions of temperature. Both the
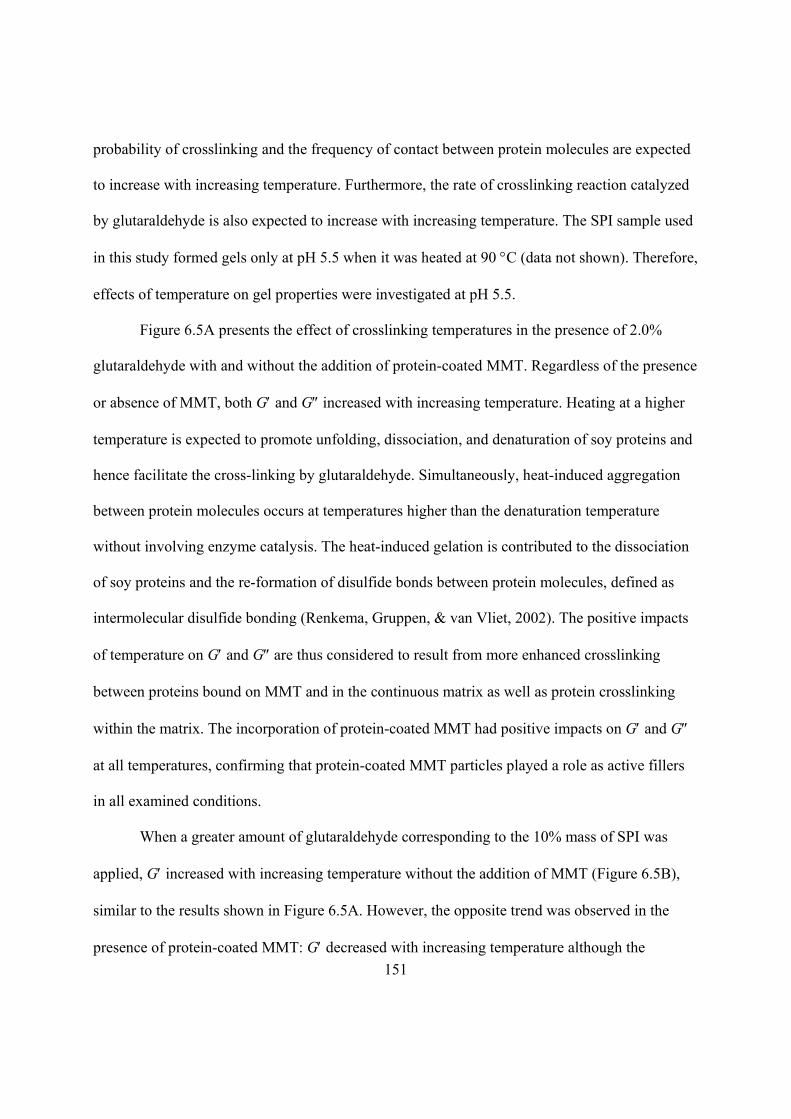
151
probability of crosslinking and the frequency of contact between protein molecules are expected
to increase with increasing temperature. Furthermore, the rate of crosslinking reaction catalyzed
by glutaraldehyde is also expected to increase with increasing temperature. The SPI sample used
in this study formed gels only at pH 5.5 when it was heated at 90 C (data not shown). Therefore,
effects of temperature on gel properties were investigated at pH 5.5.
Figure 6.5A presents the effect of crosslinking temperatures in the presence of 2.0%
glutaraldehyde with and without the addition of protein-coated MMT. Regardless of the presence
or absence of MMT, both G and G increased with increasing temperature. Heating at a higher
temperature is expected to promote unfolding, dissociation, and denaturation of soy proteins and
hence facilitate the cross-linking by glutaraldehyde. Simultaneously, heat-induced aggregation
between protein molecules occurs at temperatures higher than the denaturation temperature
without involving enzyme catalysis. The heat-induced gelation is contributed to the dissociation
of soy proteins and the re-formation of disulfide bonds between protein molecules, defined as
intermolecular disulfide bonding (Renkema, Gruppen, & van Vliet, 2002). The positive impacts
of temperature on G and G are thus considered to result from more enhanced crosslinking
between proteins bound on MMT and in the continuous matrix as well as protein crosslinking
within the matrix. The incorporation of protein-coated MMT had positive impacts on G and G
at all temperatures, confirming that protein-coated MMT particles played a role as active fillers
in all examined conditions.
When a greater amount of glutaraldehyde corresponding to the 10% mass of SPI was
applied, G increased with increasing temperature without the addition of MMT (Figure 6.5B),
similar to the results shown in Figure 6.5A. However, the opposite trend was observed in the
presence of protein-coated MMT: G decreased with increasing temperature although the
152
addition of MMT still resulted in one to two decades of magnitude of increases in G and G.
These results indicate that the chemical crosslinking catalyzed by glutaraldehyde had
predominant effects over the heat-induced intermolecular disulfide bonding and hydrophobic
interactions between protein molecules on the determination of G and G of soy protein gels in
the presence of protein-coated MMT particles.
It has been reported that the elastic modulus of heat-induced soy protein gels increases
first with increasing temperature, reaches a maximum, and then decreases (Furukawa, Ohta, &
Yamamoto, 1980; Nagano, Hirotsuka, Mori, Kohyama, & Nishinari, 1992). The rate of self-
assembling of protein molecules monotonically increases with increasing temperature due to
more enhanced denaturation and diffusion, leading to the formation of thicker and hence
mechanically stronger networks. However, an excessive increase in the rate of crosslinking is
expected to lead to the formation of coarser and hence mechanically weaker networks. Decreases
in G and G with increasing temperature from 23 C in the presence of protein-coated MMT and
10.0% glutaraldehyde (Figure 6.5B) indicate that the optimum temperature for the crosslinking
reaction is less than 23 C.
6.5. CONCLUSION
Chemical crosslinking by glutaraldehyde enhanced interactions between the matrix
consisting of soy proteins and MMT particles coated with soy proteins. As a result, the
incorporation of protein-coated MMT significantly promoted the development of the elastic
modulus of nanocomposites containing protein-coated MMT particles dispersed in soy protein
hydrogel networks. The glutaraldehyde concentration, pH, and cross-linking temperature played
important roles on the network formation and mechanical strength of hydrogels. The storage

153
modulus gradually increased with increasing glutaraldehyde concentration. Soy protein
hydrogels formed at pH 5.5 were stronger than those formed at pH 6.5 and 10.0 at an ambient
temperature. Effects of temperature were suggested to exhibit parabolic trends on the mechanical
strength of nanocomposites. It is thus critical to perform crossliking at the optimal temperature.
These findings generally indicate that the addition of a higher level of glutaraldehyde facilitates
the crosslinking reaction. The chemical cross-linking was confirmed to be beneficial for
preparing bionanocomposite materials with enhanced interactions between protein-coated MMT
and the matrix proteins and expected to potentially improve mechanical and barrier properties.
154
LIST OF REFERENCES
Arora, A., & Padua, G. W. (2010). Review: nanocomposites in food packaging. Journal of Food
Science, 75(1), R43-R49.
Badley, R. A., Atkinson, D., Hauser, H., Oldani, D., Green, J. P., & Stubb, J. M. (1975). The
structure, physical and chemical properties of the soy bean protein glycinin. Biochim
Biophys Acta, 412, 214-428.
Caillard, R., Remondetto, G. E., & Subirade, M. (2009). Physicochemical properties and
microstructure of soy protein hydrogels co-induced by Maillard type cross-linking and
salts. Food Research International, 42(1), 98-106.
Caillard, R., Remondetto, G. E., & Subirade, M. (2010). Rheological investigation of soy protein
hydrogels induced by Maillard-type reaction. Food Hydrocolloids, 24(1), 81-87.
Chabba, S., & Netravali, A. N. (2005). 'Green' composites Part 1: Characterization of flax fabric
and glutaraldehyde modified soy protein concentrate composites. Journal of Materials
Science, 40(23), 6263-6273.
Chen, P., Tian, H. F., Zhang, L., Chen, Y., Wang, X. Y., & Do, Y. M. (2008). Structure and
properties of soy protein/alumina hydrate nanocomposites fabricated via in situ synthesis.
Journal of Biobased Materials and Bioenergy, 2(3), 248-257.
Chen, P., & Zhang, L. (2006). Interaction and properties of highly exfoliated soy
protein/montmorillonite nanocomposites. Biomacromolecules, 7(6), 1700-1706.
de Azeredo, H. M. C. (2009). Nanocomposites for food packaging applications. Food Research
International, 42(9), 1240-1253.
155
de Carvalho, R. A., & Grosso, C. R. F. (2004). Characterization of gelatin based films modified
with transglutaminase, glyoxal and formaldehyde. Food Hydrocolloids, 18(5), 717-726.
Ding, X. L., & Henrichs, S. M. (2002). Adsorption and desorption of proteins and polyamino
acids by clay minerals and marine sediments. Marine Chemistry, 77(4), 225-237.
Essington, M. E. (2003). Soil and water chemistry: an intergrative approach CRC Press, p58, 65,
68.
Feng, M., Zhao, C. G., Gong, F. L., & Yang, M. S. (2004). Study on the modification of sodium
montmorillonite with amino silanes. Acta Chimica Sinica, 62(1), 83-87.
Furukawa, T., Ohta, S., & Yamamoto, A. (1980). Texture-structure relationships in heat-induced
soy protein gels. Journal of Texture Studies, 10(4), 333-346.
Gan, C.-Y., Latiff, A. A., Cheng, L.-H., & Easa, A. M. (2009). Gelling of microbial
transglutaminase cross-linked soy protein in the presence of ribose and sucrose. Food
Research International, 42(10), 1373-1380.
Gerrard, J. A., Brown, P. K., & Fayle, S. E. (2003). Maillard crosslinking of food proteins II: the
reactions of glutaraldehyde, formaldehyde and glyceraldehyde with wheat proteins in
vitro and in situ. Food Chemistry, 80(1), 35-43.
Gerrard, J. A., Meade, S. J., Millera, A. G., Brown, P. K., Yasir, S. B. M., Sutton, K. H., &
Newberry, M. P. (2005). Protein cross-linking in food. In J. W. Baynes, V. M. Monnier, J.
M. Ames & S. R. Thorpe (Eds.), Maillard Reaction: Chemistry at the Interface of
Nutrition, Aging, and Disease, vol. 1043 (pp. 97-103).
Gunister, E., Pestreli, D., Unlu, C. H., Atici, O., & Gungor, N. (2007). Synthesis and
characterization of chitosan-MMT biocomposite systems. Carbohydrate Polymers, 67(3),
358-365.
156
Jiang, Y., Tang, C.H., Wen, Q.B., Li, L., & Yang, X.Q. (2007). Effect of processing parameters
on the properties of transglutaminase-treated soy protein isolate films. Innovative Food
Science & Emerging Technologies, 8(2), 218-225.
Kumar, P. (2009). Development of bio-nanocomposite films with enhanced mechanical and
barrier properties using extrusion processing. North Carolina State University. Ph.D
dissertation.
Kumar, P., Sandeep, K. P., Alavi, S., Truong, V. D., & Gorga, R. E. (2010a). Effect of type and
content of modified montmorillonite on the structure and properties of bio-
nanocomposite films based on soy protein isolate and montmorillonite. Journal of Food
Science, 75(5), N46-N56.
Kumar, P., Sandeep, K. P., Alavi, S., Truong, V. D., & Gorga, R. E. (2010b). Preparation and
characterization of bio-nanocomposite films based on soy protein isolate and
montmorillonite using melt extrusion. Journal of Food Engineering, 100(3), 480-489.
L'Hocine, L., Boye, J. I., & Arcand, Y. (2006). Composition and functional properties of soy
protein isolates prepared using alternative defatting and extraction procedures. Journal of
Food Science, 71(3), C137-C145.
Le Corre, D., Bras, J., & Dufresne, A. (2010). Starch nanoparticles: a review.
Biomacromolecules, 11(5), 1139-1153.
Lin, J. J., Wei, J. C., Juang, T. Y., & Tsai, W. C. (2007). Preparation of protein-silicate hybrids
from polyamine intercalation of layered montmorillonite. Langmuir, 23(4), 1995-1999.
Mallakpour, S., & Dinari, M. (2011). Preparation and characterization of new organoclays using
natural amino acids and Cloisite Na(+). Applied Clay Science, 51(3), 353-359.
157
Maruyama, N., Katsube, T., Wada, Y., Oh, M. H., Barba De La Rosa, A. P., Okuda, E.,
Nakagawa, S., & Utsumi, S. (1998). The roles of the N-linked glycans and extension
regions of soybean beta-conglycinin in folding, assembly and structural features. Eur J
Biochem, 258, 854-862.
Nagano, T., Hirotsuka, M., Mori, H., Kohyama, K., & Nishinari, K. (1992). Dynamic
viscoelastic study on the gelation of 7 S globulin from soybeans. Journal of Agricultural
and Food Chemistry, 40(6), 941-944.
Nayak, P. L., Sasmal, A., Nayak, P., Sahoo, S., Mishra, J. K., Kang, S. C., Lee, J. W., & Chang,
Y. W. (2008). Nanocomposites from polycaprolactone (PCL)/soy protein isolate (SPI)
blend with organoclay. Polymer-Plastics Technology and Engineering, 47(6), 600-605.
Park, S. K., Bae, D. H., & Rhee, K. C. (2000). Soy protein biopolymers cross-linked with
glutaraldehyde. Journal of the American Oil Chemists Society, 77(8), 879-883.
Payne, A., & Whittaker, R. (1971). Low strain dynamic properties of filled rubbers. Rubber
chemistry and technology, 44, 440.
Petruccelli, S., & Anon, M. C. (1995). Soy protein isolate components and their interactions.
Journal of Agricultural and Food Chemistry, 43(7), 1762-1767.
Quiquampoix, H., & Burns, R. G. (2007). Interactions between proteins and soil mineral surfaces:
environmental and health consequences. Elements, 3(6), 401-406.
Renkema, J. M. S., Gruppen, H., & van Vliet, T. (2002). Influence of pH and ionic strength on
heat-induced formation and rheological properties of soy protein gels in relation to
denaturation and their protein compositions. Journal of Agricultural and Food Chemistry,
50(21), 6064-6071.
158
Renkema, J. M. S., Knabben, J. H. M., & van Vliet, T. (2001). Gel formation by beta-
conglycinin and glycinin and their mixtures. Food Hydrocolloids, 15(4-6), 407-414.
Shenoy, A. V. (1999). Rheology of filled polymer systems. Kluwer Academic Publishers,
Dordrecht, The Netherlands.
Spirkova, M., Duchek, P., Strachota, A., Poreba, R., Kotek, J., Baldrian, J., & Slouf, M. (2011).
The role of organic modification of layered nanosilicates on mechanical and surface
properties of organic-inorganic coatings. Journal of Coatings Technology and Research,
8(3), 311-328.
Tang, C. H., Choi, S. M., & Ma, C. Y. (2007). Study of thermal properties and heat-induced
denaturation and aggregation of soy proteins by modulated differential scanning
calorimetry. International Journal of Biological Macromolecules, 40(2), 96-104.
van Vliet, T. (1988). Rheological properties of filled gels. Influence of filler matrix interaction
Colloid and Polymer Science, 266(6), 518-524.
Wolf, W. J. (1970). Soybean protiens - their functional, chemical, and physical properties.
Journal of Agricultural and Food Chemistry, 18(6), 969-&.
Yang, Y., Zhu, Z. K., Yin, J., Wang, X. Y., & Qi, Z. E. (1999). Preparation and properties of
hybrids of organo-soluble polyimide and montmorillonite with various chemical surface
modification methods. Polymer, 40(15), 4407-4414.
Yildirim, M., & Hettiarachchy, N. S. (1998). Properties of films produced by cross-linking whey
proteins and 11S globulin using transglutaminase. Journal of Food Science, 63(2), 248-
252.
Zhao, R. X., Torley, P., & Halley, P. J. (2008). Emerging biodegradable materials: starch- and
protein-based bio-nanocomposites. Journal of Materials Science, 43(9), 3058-3071.
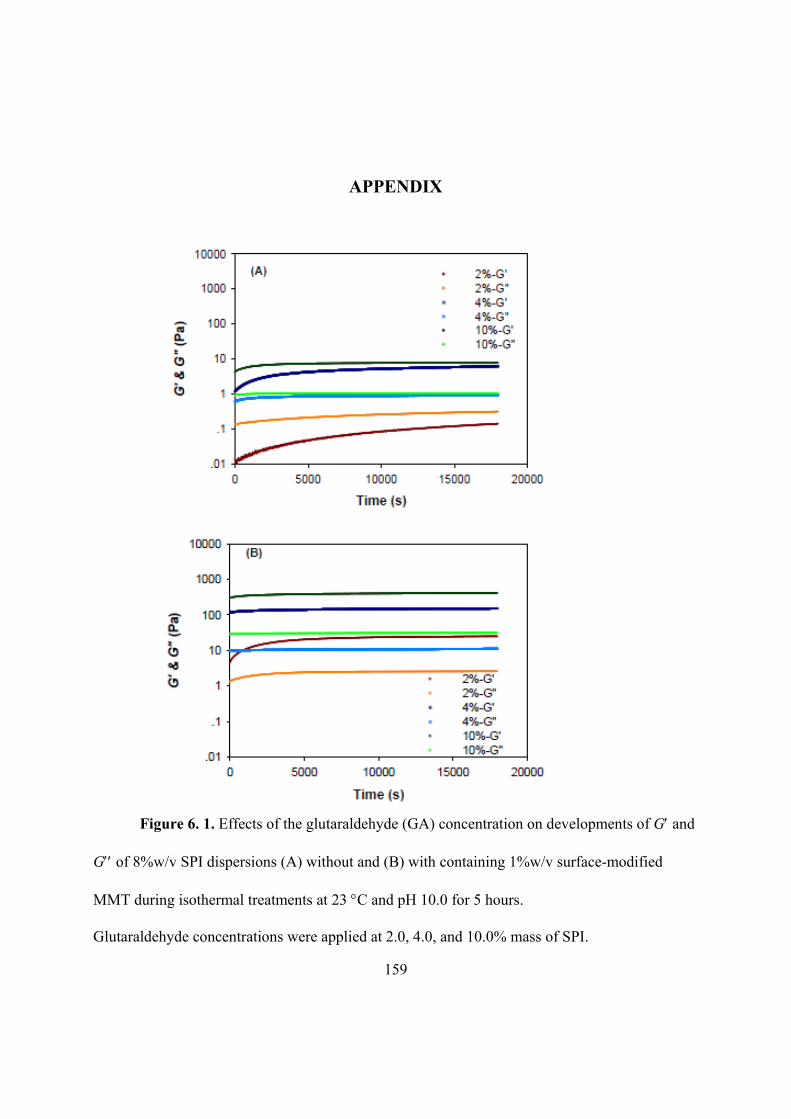
159
APPENDIX
Figure 6. 1. Effects of the glutaraldehyde (GA) concentration on developments of G and
G of 8%w/v SPI dispersions (A) without and (B) with containing 1%w/v surface-modified
MMT during isothermal treatments at 23 C and pH 10.0 for 5 hours.
Glutaraldehyde concentrations were applied at 2.0, 4.0, and 10.0% mass of SPI.

160
Strain
.001 .01 .1 1
G' o
r G
" (P
a)
.1
1
10
100
1000
10000
(A)
Strain
.001 .01 .1 1
G' o
r G
" (P
a)
.1
1
10
100
1000
10000
(B)
Figure 6. 2. Strain sweep profiles of 8%w/v SPI dispersions (A) without and (B) with
containing 1%w/v surface-modified MMT after isothermal treatments at 23 C and pH 10.0 for 5
hours. The glutaraldehyde concentrations were 2.0% (circles), 4.0% (square), and 10.0%
(diamond) mass of SPI.
Filled and open symbols represent storage (G) and loss (G) moduli, respectively.
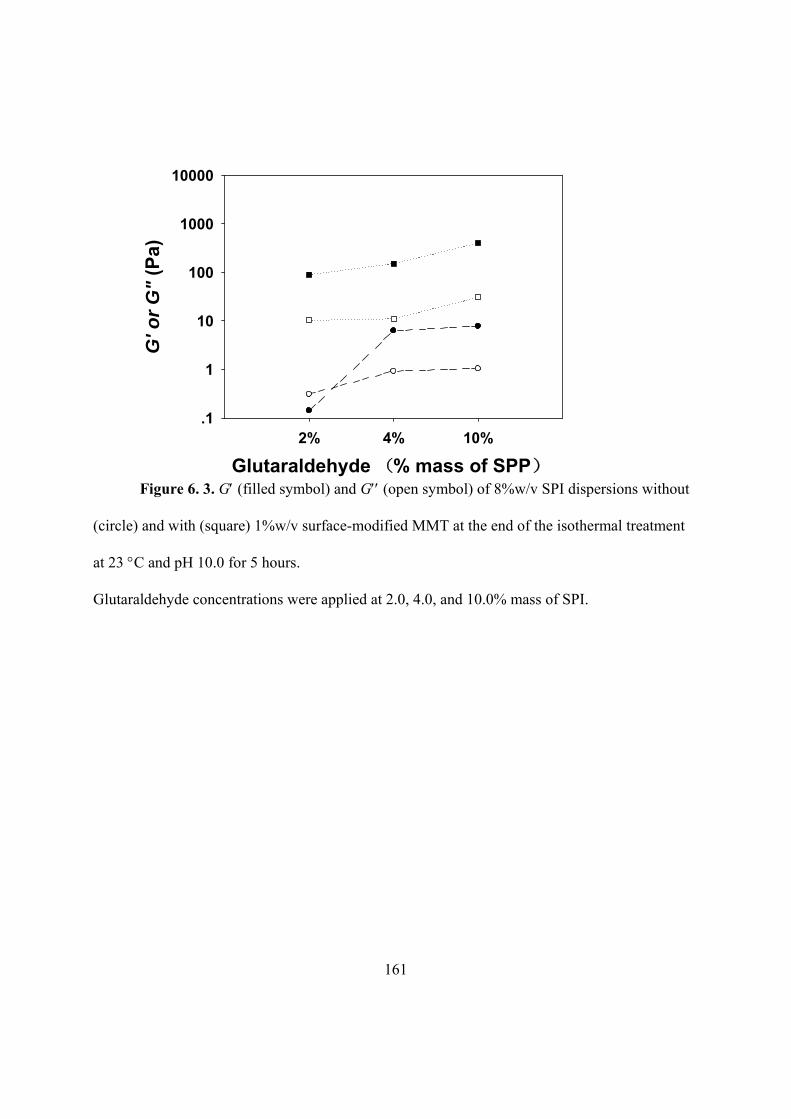
161
Glutaraldehyde (% mass of SPP)
2% 4% 10%
G' o
r G
" (P
a)
.1
1
10
100
1000
10000
Figure 6. 3. G (filled symbol) and G (open symbol) of 8%w/v SPI dispersions without
(circle) and with (square) 1%w/v surface-modified MMT at the end of the isothermal treatment
at 23 C and pH 10.0 for 5 hours.
Glutaraldehyde concentrations were applied at 2.0, 4.0, and 10.0% mass of SPI.
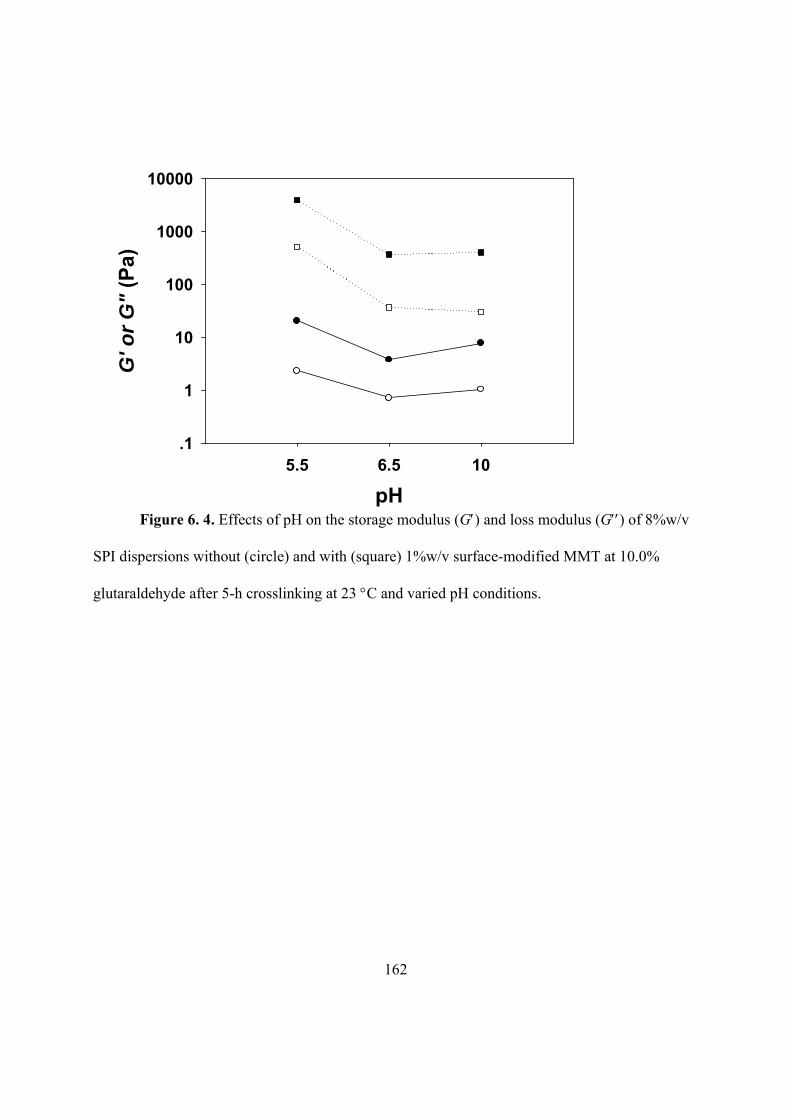
162
pH
5.5 6.5 10
G' o
r G
" (P
a)
.1
1
10
100
1000
10000
Figure 6. 4. Effects of pH on the storage modulus (G) and loss modulus (G) of 8%w/v
SPI dispersions without (circle) and with (square) 1%w/v surface-modified MMT at 10.0%
glutaraldehyde after 5-h crosslinking at 23 C and varied pH conditions.

163
Temperature (C)
23 60 90
G' o
r G
" (P
a)
.1
1
10
100
1000
10000(A)
Temperature (C)
23 60 90
G' o
r G
" (P
a)
.1
1
10
100
1000
10000(B)
Figure 6. 5. Effects of crosslinking temperature on the storage modulus (G) and loss
modulus (G) of 8%w/v SPI dispersions without (circle) and with (square) 1%w/v surface-
modified MMT at (A) 2.0% and (B) 10.0% glutaraldehyde after 5-h crosslinking at pH 5.5 and
different temperatures.

164
CHAPTER 7 . CONCLUSIONS AND FUTURE WORK

165
This dissertation demonstrated that the structure of nanoclay montmorillonite (MMT)
could be easily modified by a simple treatment – surface-coating with water soluble plant-
sourced proteins, i.e., hominy proteins and soy proteins using a solution intercalation method. A
sufficient amount of proteins and coating pH were critical to the degree of modification of MMT
from highly ordered to highly intercalated and/or exfoliated structures. The highly intercalated or
exfoliated MMT nanoclay has the promises to well disperse in nanocomposite in turn improve
the mechanical and barrier properties of bio-nanocomposite materials. The presence of majority
of coating proteins (>90%) bound on MMT at all pH conditions suggests that coating involved
not only electrostatic interactions but non-coulombic forces such as hydrogen bonding between
MMT and protein molecules. This practical approach on structural modification of nanoclay
prior to nanocomposite production can be integrated in preparation of various nanocomposite
materials.
Crosslinking was demonstrated to be an effective method to improve the interactions in
the protein-based nanocomposite system. Crosslinking of proteins promoted the formation of
strong covalent bondings between protein molecules in the continuous phase and between the
proteins bound on MMT and those in the matrix, and thus enhanced the interactions between the
incorporated MMT and the biopolymer matrix. These strengthened interactions made the
protein-coated MMT to be “active” fillers in the nanocomposite system, further improve the
mechanical properties of nanocomposite materials.
This dissertation work illustrated these strengthened interactions during both enzymatic
and chemical crosslinking by utilizing the dynamic rheological test as a non-destructive method.
Microbial transglutaminase (mTGase) and glutaraldehyde were studied for enzymatic and
chemical crosslinking, respectively. Both studied crosslinking methods were confirmed to be

166
beneficial for preparing bionanocomposite materials with enhanced interactions between protein-
coated MMT and the matrix proteins and expected to potentially improve mechanical and barrier
properties. The mTGase has been used in food production, which reduces possible regulatory
issues when applying to nanocomposite materials for applications such as food packaging films.
In addition, crosslinking normally decreases the solubility of proteins and enhances the
hydrophobic effect as an extra bonus. Thus, cross-linking approaches can be used to direct the
manufacturing of biodegradable nanocomposite materials with superior functional performances.
In conclusion, the simple surface-coating method presented in this research can be used
to intercalate and/or exfoliate MMT platelets. The protein-coated MMT may be utilized to
manufacture various bio-nanocomposite materials with improved physical properties for
applications such as bio-degradable packaging films. Crosslinking can strengthen the interactions
between matrix polymers and “active” nanofillers in turn improve both mechanical and barrier
properties of bio-nanocomposite materials, thus contributing to the growing bio-plastic industry.

167
VITA
Minfeng Jin was born on June 20, 1979 in Shanghai, China, where her mother and her
sister still reside. She graduated in Huazhong Agricultural University with a bachelor’s degree in
Food Science and Engineering and a minor in Marketing in June of 2001. In July of 2001,
Minfeng started her career as a product specialist in a healthcare food company in Shanghai. She
led the new product team to develop and launch a supplementary calcium tablet fermented with
beneficial bacteria to enhance the absorption ability in GI track, for which the sales was ca. $1
million in the first year after launching. After that, she joined a committee to establish a new
company which produced beef/fish snack foods in Shanghai. She set up the food chemistry and
food microbiology labs, and complemented the Standard Operation Procedures of processing
food products and ISO management documents for the company.
Minfeng always wanted to broaden and deepen her knowledge and insight of food
industry in the global economy. In August of 2006, she came to the University of Tennessee for
her graduate study and completed her M.S. degree in the Food Science and Technology in two
years, under the guidance of Dr. Qixin Zhong on the development of microencapsulation
techniques for a naturally-occurring antimicrobial, lysozyme with a biopolymer corn zein. Since
Fall 2008, Minfeng has been in her pursuit of Ph.D degree in the same lab, under the guidance of
Dr. Qixin Zhong on investigating the exfoliation of montmorillonite nanoclay by surface coating
and enhanced interactions by enzymatic and chemical cross-linking. After completion of her
Ph.D. study, Minfeng hopes to explore opportunities in the global food industry.


![Nanocomposite [5]](https://static.fdocuments.net/doc/165x107/577c7ecf1a28abe054a26499/nanocomposite-5.jpg)