
PLANT PERFORMANCE IMPROVEMENTS BY ENHANCED …zolotech.com/wp-content/uploads/Siemens_Rizhao... ·...
12
Distributed with permission of Sudha Thavamani, Matthias Behmann and Till Spaeth by ISA 2012 Presented at ISA POWID 2012; http://www.isa.org PLANT PERFORMANCE IMPROVEMENTS BY ENHANCED COMBUSTION THROUGH LASER-BASED OPTIMIZATION Dr. Sudha Thavamani Siemens Energy, Instrumentation, Controls & Electrical, U.S.A Dr. Matthias Behmann Siemens Energy, Instrumentation, Controls & Electrical, Germany Till Spaeth Siemens Energy, Instrumentation, Controls & Electrical, Germany Keywords: Combustion Optimization, Laser Measurements, Boiler Efficiency, Tangential Fired boilers, Siemens Power Plant Automation SPPA-P3000 ABSTRACT The power generation companies have to seek more superior and sophisticated technologies in order to gain an edge on their competitors owing to continually rising demands by environmental and governmental authorities and consumers. Intelligent Combustion Optimization is a proven methodology to accomplish plant performance improvements, boiler efficiency increase and reduction in emissions. The Siemens SPPA-P3000 Combustion Optimization solutions allow plant operators to achieve these objectives. The purpose of the paper is to describe in detail the performance improvements achieved by using Siemens SPPA-P3000 Combustion Optimizer at Unit 4 of Huaneng Rizhao Power Plant, P. R. China. This unit is a 660 MW tangentially-fired, supercritical boiler. To balance the combustion better, a closed-loop optimization is delivered by manipulating fuel and air levels with the help of laser measurements which provide the key combustion components O 2 , CO, H 2 O and temperature simultaneously, directly in the furnace.
-
Upload
truongquynh -
Category
Documents
-
view
230 -
download
4
Transcript of PLANT PERFORMANCE IMPROVEMENTS BY ENHANCED …zolotech.com/wp-content/uploads/Siemens_Rizhao... ·...
Distributed with permission of Sudha Thavamani, Matthias Behmann and Till Spaeth by ISA 2012 Presented at ISA POWID 2012; http://www.isa.org
PLANT PERFORMANCE IMPROVEMENTS BY ENHANCED COMBUSTION THROUGH LASER-BASED
OPTIMIZATION
Dr. Sudha Thavamani Siemens Energy, Instrumentation, Controls & Electrical, U.S.A
Dr. Matthias Behmann Siemens Energy, Instrumentation, Controls & Electrical, Germany
Till Spaeth Siemens Energy, Instrumentation, Controls & Electrical, Germany
Keywords: Combustion Optimization, Laser Measurements, Boiler Efficiency, Tangential Fired
boilers, Siemens Power Plant Automation SPPA-P3000
ABSTRACT
The power generation companies have to seek more superior and sophisticated technologies in order to gain an edge on their competitors owing to continually rising demands by environmental and governmental authorities and consumers.
Intelligent Combustion Optimization is a proven methodology to accomplish plant performance improvements, boiler efficiency increase and reduction in emissions. The Siemens SPPA-P3000 Combustion Optimization solutions allow plant operators to achieve these objectives.
The purpose of the paper is to describe in detail the performance improvements achieved by using Siemens SPPA-P3000 Combustion Optimizer at Unit 4 of Huaneng Rizhao Power Plant, P. R. China. This unit is a 660 MW tangentially-fired, supercritical boiler. To balance the combustion better, a closed-loop optimization is delivered by manipulating fuel and air levels with the help of laser measurements which provide the key combustion components O2, CO, H2O and temperature simultaneously, directly in the furnace.
Distributed with permission of Sudha Thavamani, Matthias Behmann and Till Spaeth by ISA 2012 Presented at ISA POWID 2012; http://www.isa.org
INTRODUCTION
In the current market conditions, steam power plants must always be run at the most profitable operating point. This primarily demands a high degree of flexibility, high efficiency, high availability and low emissions. The Siemens Power Plant Automation Process Optimization (SPPA-P3000) solutions allow plant operators to achieve these objectives. One of the most cost-effective means for improving the boiler efficiency is by applying the primary measures based on optimized combustion adjustments. However, this optimization approach is usually restricted by the power plant operator’s limited knowledge of actual combustion conditions. These uncertainties about the actual combustion process leads to situations in which operators keep most of boiler settings constant, although considerable variations occur with respect to fuel properties, fuel flow rate imbalances, load range or air flow disturbances. The insufficient monitoring and control means that, in general, the operation of the boilers is based on the use of certain combinations of global or indirect variables, derived either from the recommendations of the boiler manufacturer or from the accumulated experience of the operators of the specific plant. These often have more to do with operational stability and historical inertia, i.e. following customary practices, than with true optimum operating conditions.
The Combustion Optimizer provides closed-loop optimization of fuel and air mixing by manipulating fuel and air levels to balance combustion in the furnace. The important benefits of the optimizer include greater combustion efficiency and consequently lower fuel costs, reliable combustion of supplementary fuel, reliable combustion of a wider range of coal types, etc.
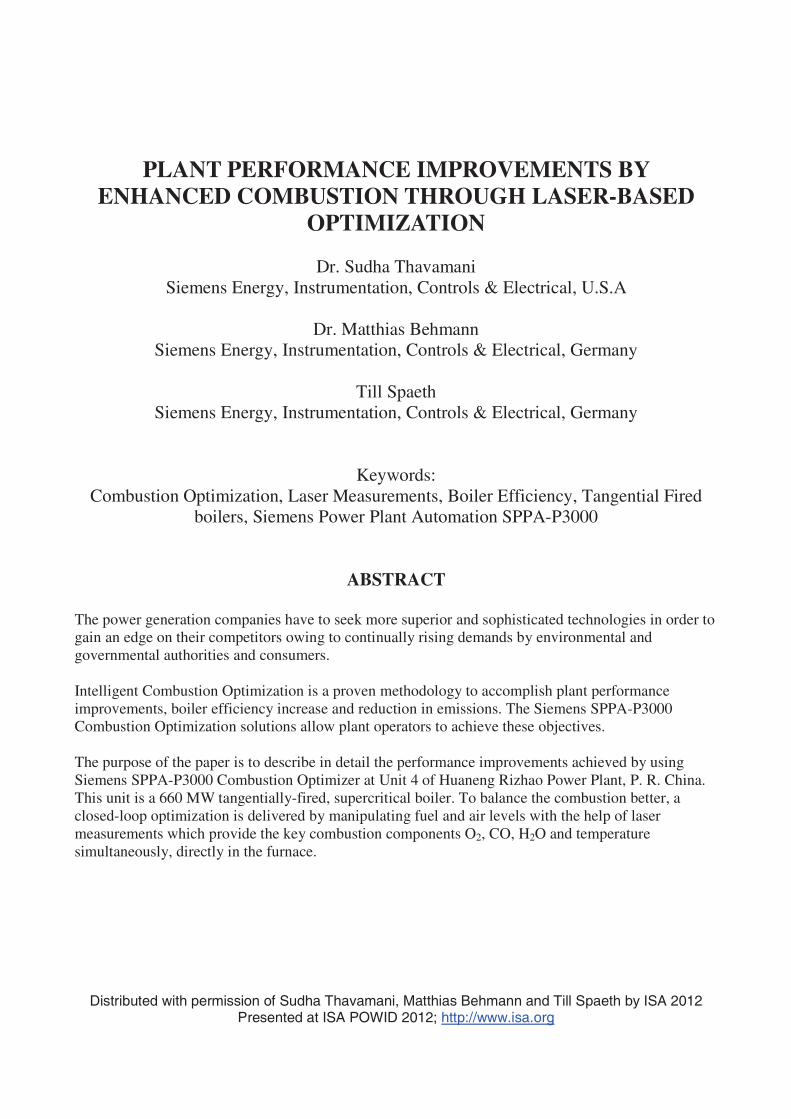
The Combustion Optimizer is software based solutions and needs no modifications to mechanical equipment. This solution is comprised of Combustion Optimizer modules for laser-based measuring technology, distribution calculation based on Computer-Aided Tomography (CAT) procedure and Combustion Optimization Controls as shown in Figure 1. The combustion controller is completely integrated together with the included spectroscopy-based in-furnace measurements from Zolo Technologies’ ZoloBOSS system.
Figure 1 Combustion Optimizer Module Interactions
The laser-based measurement system maps the concentration of in-furnace CO, O2, H2O and temperature simultaneously in real time and directly in the furnace as shown in Figure 2. Laser

Distributed with permission of Sudha Thavamani, Matthias Behmann and Till Spaeth by ISA 2012 Presented at ISA POWID 2012; http://www.isa.org
transmitters and receivers are arranged outside the boiler so that a grid of laser beams criss-crosses the furnace. Each path of the X by X laser grid measures an average value for temperature, O2, H2O, and CO simultaneously, and together, the paths are used to create a tomographic image of this plane in the boiler, which is also displayed to the operators directly in the control room.
Figure 2 Laser –based Measurement System
The objective of the paper is to describe in detail the performance improvements achieved by using the Combustion Optimizer at Unit 4 of Huaneng Rizhao Power Plant, P. R. China.
RIZHAO POWER PLANT UNIT 4 BOILER DESCRIPTION
Unit 4 at Rizhao Power Plant is located in Rizhao City, Shandong Province in P.R. of China. It is a 660 MW tangentially–fired, supercritical boiler. The boiler is a once through boiler with single furnace cavity, single reheat, balanced draft, semi-outdoor, dry ash extraction. It belongs to � type boiler with whole steel frame overhung construction. Two ljungstrom tri-sector regenerative air preheaters are installed in the boiler back-end. Fuel used by the boiler is soft coal.
There are six coal feeders and mills. A cyclone classifier is used at the coal mills. There are six burner levels with 4 burners at each level. The direct flow burner at every corner forms the tangential firing. Six layers of coal nozzles surrounded by fuel air (boundary air) are installed in the windbox. SOFA (Separated OFA) nozzles installed in the upper part of the windbox include five layers of horizontally swinging nozzles. There are 25 secondary air valves including boundary air of coal nozzles that are controlled individually by pneumatic drives at every boiler corner and layer.

Distributed with permission of Sudha Thavamani, Matthias Behmann and Till Spaeth by ISA 2012 Presented at ISA POWID 2012; http://www.isa.org
COMBUSTION OPTIMIZATION PROJECT EXECUTION
The combustion optimization project was executed in the year 2011 with four major steps as shown in the Figure 3.
1. The first step was the installation of laser measurement grids inside the boiler. 2. The second step was to carry out the parametric testing based on the conditions of the boiler.
This was followed by the deductions and analysis of the spatial distributions. 3. Based on observations and inferences of step 2 above, decision on the required controlled
variables for the closed loop controls engineering was made, which was the third major step of the project
4. The fourth step was to integrate and commission the combustion optimization controls in the existing I&C system.
Figure 3 Combustion Optimization Project Execution in 2011 at Rizhao Power Plant.
COMBUSTION OPTIMIZER HARDWARE AND SOFTWARE
o Hardware Configuration
The functions of the Combustion Optimizer modules ran on a small SPPA-T3000 I&C system.
The system is comprised, as shown in Figure 4, of the standard components:
� Technology server, e.g. for archiving and optimization
� Thin Client with software for CAT display
� Standard interface to existing DCS

Distributed with permission of Sudha Thavamani, Matthias Behmann and Till Spaeth by ISA 2012 Presented at ISA POWID 2012; http://www.isa.org
Figure 4 Optimizer System Modules
The hardware configuration of the Combustion Optimizer at Rizhao Power Plant’s Unit 4 is shown in Figure 5. The Laser Measurement System was connected to the Technology Server through OPC via TCP/IP. There was also a Thin Client connected to the Technology Server. The Technology Server was connected to the Foxboro DCS via Modbus. This permits the availability of measured data from the existing DCS, such as coal and air flows or CO and NOx in the flue gas, to the combustion optimization process.
Figure 5 Optimizer Hardware Configuration
o Transfer of Signals between Combustion Optimizer and Foxboro DCS
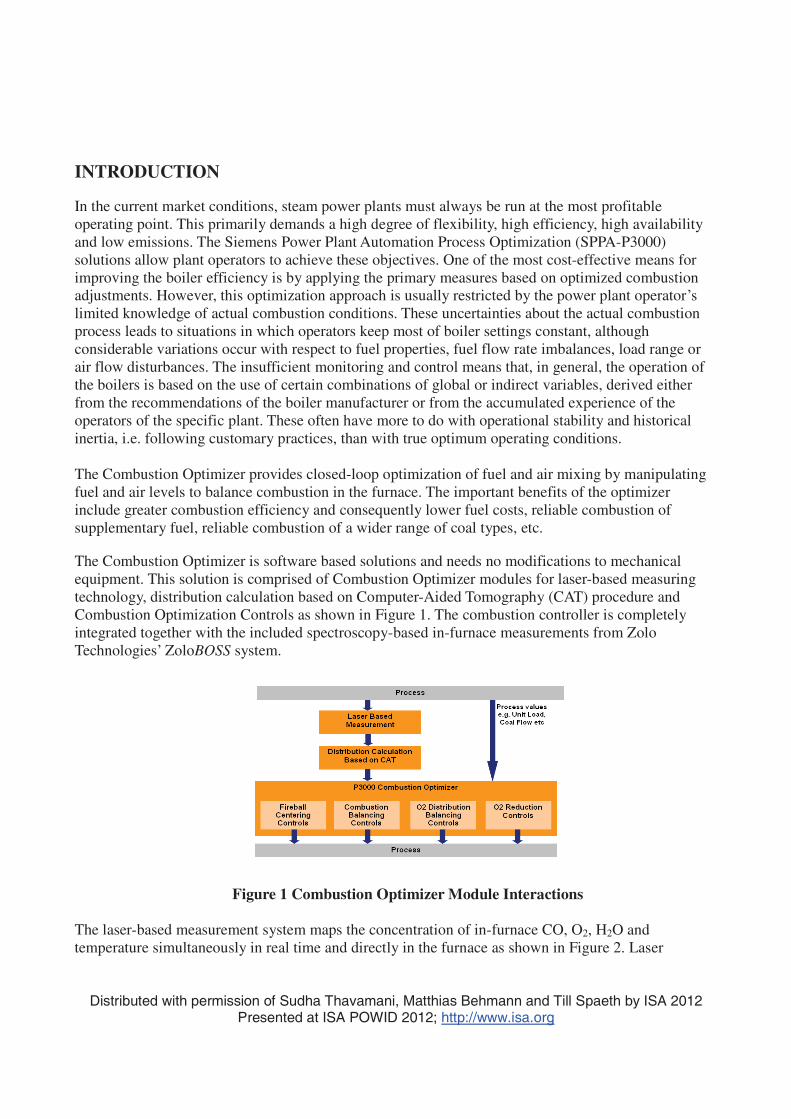
The basic block diagram for signal transfer between the Combustion Optimizer and Foxboro DCS is shown in Figure 6.
There was a watchdog signal available for the communication check between the optimizer and the DCS. The process measurements from the DCS were used for controls calculation in optimizer. The optimizer then used the process measurements from the DCS along with the laser measurements data from the boiler to calculate the optimized values. These values were provided as the setpoint deltas which were additive bias values to the existing setpoints in the DCS. This provided the new setpoints which were transferred to the basic underlying controls and to the field.
Distributed with permission of Sudha Thavamani, Matthias Behmann and Till Spaeth by ISA 2012 Presented at ISA POWID 2012; http://www.isa.org
There were three safety checks in the DCS that every setpoint delta change had to pass before they became effective in the controls and boiler process. The three safety checks were an Optimizer ON/OFF switch, rate limiter and min / max absolute limits.
Figure 6 Signal Transfer between Combustion Optimizer and DCS
PARAMETRIC TESTING OUTCOME
During the parametric testing, the behavior of the boiler was observed by changing and adjusting individual secondary air, secondary auxiliary air and SOFA dampers.
The outcome of the parametric testing and combustion analysis were
o Fireball was often not in the center of the boiler which led to unbalanced heat transfer to water wall and heaters. This also increased the risk of slagging for parts of the water wall.
o Non-homogeneous distribution of excess air in the boiler which led to efficiency loss in regions with too much air and bad combustion in regions without enough air.
o O2 setpoint of 3.5% at full load for normal operation with limited manual O2 reduction possibilites, due to the non-homogenious and continuously changing combustion situation in the boiler.
Distributed with permission of Sudha Thavamani, Matthias Behmann and Till Spaeth by ISA 2012 Presented at ISA POWID 2012; http://www.isa.org
COMBUSTION OPTIMIZATION CONTROLS CONCEPT
o Fireball Centering
The objective behind the fireball centering control was to center the fireball for uniform combustion. The fireball was centered by using the secondary auxiliary air dampers. The reported temperature values from the laser measurements were used to calculate the current position of the fireball. A model was developed using the angle of secondary auxiliary air damper to determine the reaction of the fireball position and to determine the distance of the fireball from the origin. Using this information the controller then computes the secondary auxiliary air damper position delta for each of the four corners of the boiler.
o O2 Distribution Balancing
The objective behind the O2 distribution balancing was to uniformly spread the O2 using the SOFA. The O2 balancing was performed by controlling the SOFA dampers. The O2 distributions in the boiler, determined from the laser measurements, were used as control inputs. A model was built based on weighted average for O2 measurements for the individual four corners of the boiler. This model for each corner determined the SOFA deltas proportional to the distribution of DCS damper demands for level I through level V.
o Combustion Balancing
The objective behind the combustion balancing was uniform combustion based on a good air to fuel ratio. The combustion balancing was implemented using the secondary boundary air dampers. The temperature, O2 and CO measurements from the laser measurements were used as inputs for combustion balancing controls. A boiler model was developed using these inputs which was then used to reveal reaction required for the secondary boundary air damper deltas.
o Excess O2 Reduction
The fireball centering, O2 distribution and combustion balancing controls helped to allow the reduction of the excess O2 for increasing the boiler efficiency. This additional logic using CO concentration was implemented to determine the O2 setpoint correction dependant on the actual combustion situation in the boiler. The CO values in the boiler from the laser measurements and the CO after boiler from the DCS were used to determine the rated CO concentration. The CO setpoint to the integral control was determined as a function of the unit load from the DCS. The optimization controller also has the lower limit for O2 reduction which was based on the function of unit load and had an absolute lower limit from the O2 setpoint characteristics from the DCS.
Distributed with permission of Sudha Thavamani, Matthias Behmann and Till Spaeth by ISA 2012 Presented at ISA POWID 2012; http://www.isa.org
USER INTERFACE
o Operator Interface in DCS
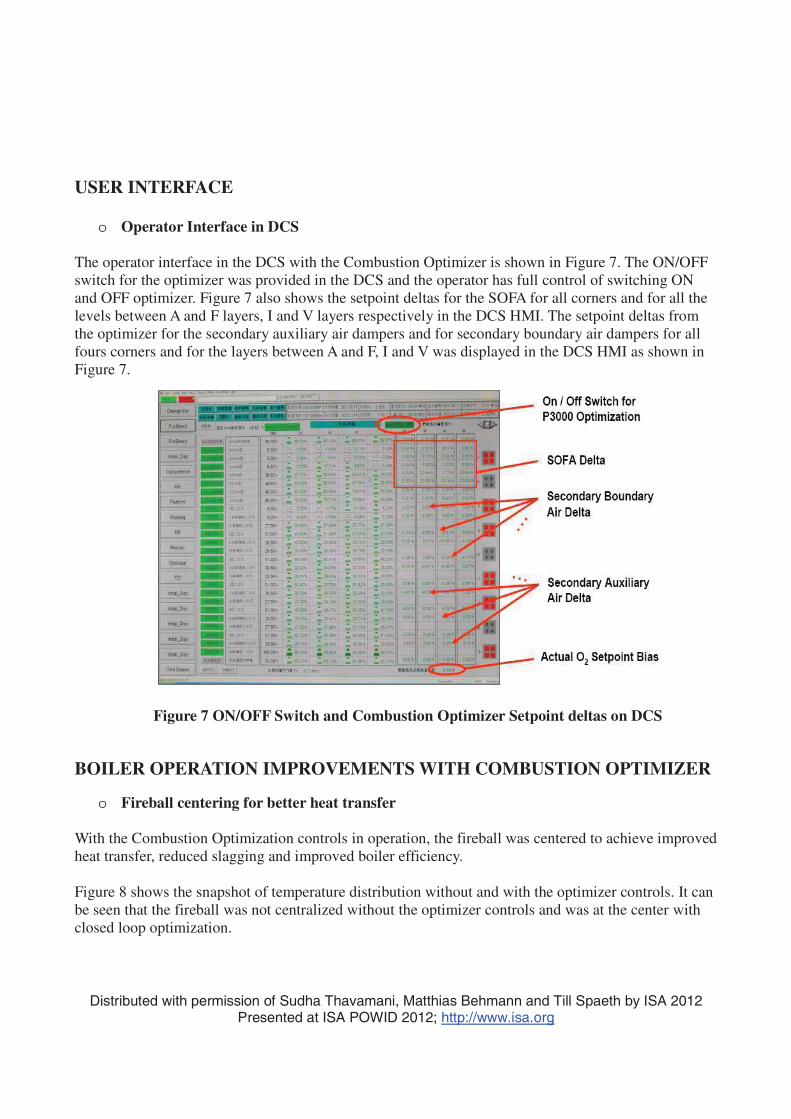
The operator interface in the DCS with the Combustion Optimizer is shown in Figure 7. The ON/OFF switch for the optimizer was provided in the DCS and the operator has full control of switching ON and OFF optimizer. Figure 7 also shows the setpoint deltas for the SOFA for all corners and for all the levels between A and F layers, I and V layers respectively in the DCS HMI. The setpoint deltas from the optimizer for the secondary auxiliary air dampers and for secondary boundary air dampers for all fours corners and for the layers between A and F, I and V was displayed in the DCS HMI as shown in Figure 7.
Figure 7 ON/OFF Switch and Combustion Optimizer Setpoint deltas on DCS
BOILER OPERATION IMPROVEMENTS WITH COMBUSTION OPTIMIZER
o Fireball centering for better heat transfer
With the Combustion Optimization controls in operation, the fireball was centered to achieve improved heat transfer, reduced slagging and improved boiler efficiency.
Figure 8 shows the snapshot of temperature distribution without and with the optimizer controls. It can be seen that the fireball was not centralized without the optimizer controls and was at the center with closed loop optimization.

Distributed with permission of Sudha Thavamani, Matthias Behmann and Till Spaeth by ISA 2012 Presented at ISA POWID 2012; http://www.isa.org
Figure 8 Laser measurements portraying Fireball position with and without Optimizer
o Balanced O2 distribution for better combustion
With the combustion optimization controls in operation, the O2 distribution was balanced to achieve improved combustion, reduced O2 in the boiler and improved boiler efficiency. Figure 9 shows the snapshot of O2 distribution without and with the optimizer controls. The O2
distribution was not balanced without the optimizer control and O2 distribution is well balanced with the closed loop controls.
Figure 9 Laser measurements portraying O2 distribution with and without Optimizer
o Reduced O2 for higher boiler efficiency
With the optimization controls in operation, reduction of combustion air was achieved after balancing the boiler. An automatic reduction of excess O2 according to the actual combustion situation was accomplished. With the optimizer, reduced flue gas flow and less related heat losses in the boiler was attained. The combination of all the other optimizer controls along with the O2 reduction controls resulted in improved boiler efficiency.
Figure 10 illustrates the O2 reduction trend over a period of 3h50min at constant unit load. The green color trend shows the delta O2 reduction calculated by the Combustion Optimizer. The violet color trend shows the O2 reduction lower limit. The O2 setpoint from the operator in the DCS is shown as
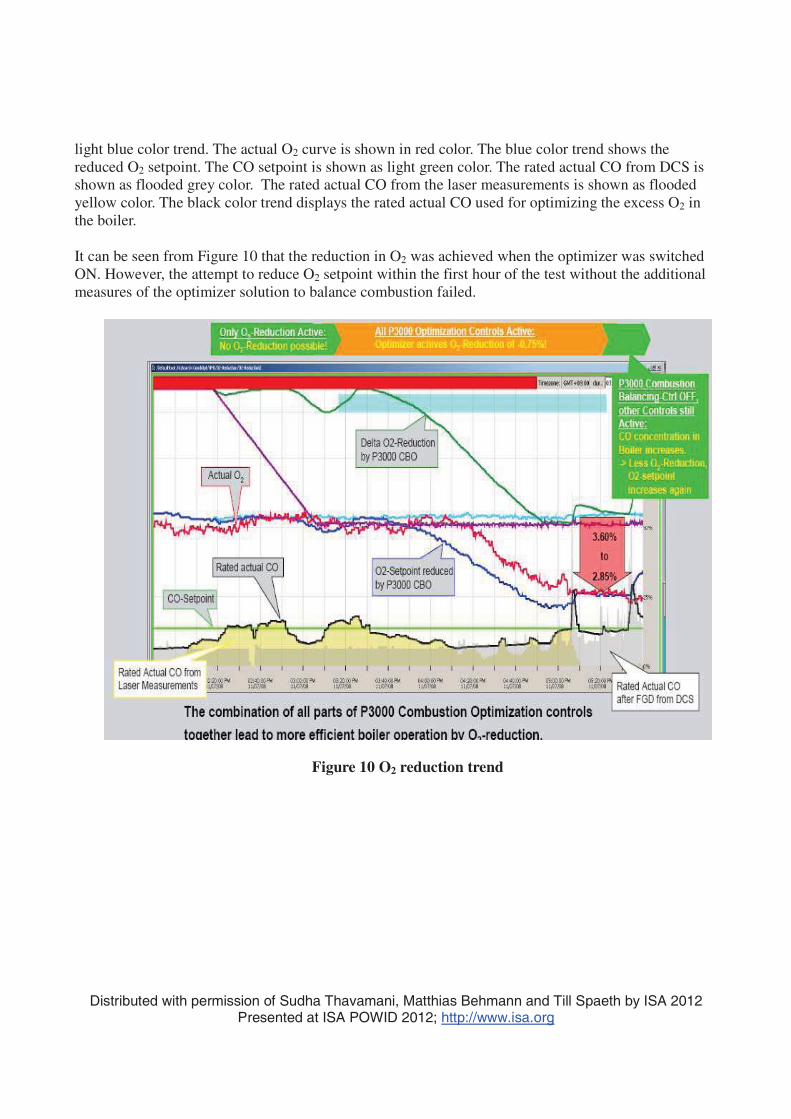
Distributed with permission of Sudha Thavamani, Matthias Behmann and Till Spaeth by ISA 2012 Presented at ISA POWID 2012; http://www.isa.org
light blue color trend. The actual O2 curve is shown in red color. The blue color trend shows the reduced O2 setpoint. The CO setpoint is shown as light green color. The rated actual CO from DCS is shown as flooded grey color. The rated actual CO from the laser measurements is shown as flooded yellow color. The black color trend displays the rated actual CO used for optimizing the excess O2 in the boiler.
It can be seen from Figure 10 that the reduction in O2 was achieved when the optimizer was switched ON. However, the attempt to reduce O2 setpoint within the first hour of the test without the additional measures of the optimizer solution to balance combustion failed.
Figure 10 O2 reduction trend

Distributed with permission of Sudha Thavamani, Matthias Behmann and Till Spaeth by ISA 2012 Presented at ISA POWID 2012; http://www.isa.org
LASER MEASUREMENTS DISPLAY WITH AND WITHOUT OPTIMIZER
Figure 11 demonstrates the snapshot of laser measurements without the optimizer switched ON. In this scenario, the fireball was not centered in the temperature profile and the O2 distribution was not balanced in the O2 laser measurement profile.
Figure 11 Snapshot of Laser Measurements without Combustion Optimizer Controls
Figure 12 demonstrates the snapshot of laser measurements with the Combustion Optimizer switched ON. At this state, the fireball was well centered in the temperature profile and the O2 distribution is balanced in the O2 laser measurement profile.
Figure 12 Snapshot of Laser Measurements with Combustion Optimizer Controls

Distributed with permission of Sudha Thavamani, Matthias Behmann and Till Spaeth by ISA 2012 Presented at ISA POWID 2012; http://www.isa.org
CONCLUSION
The Combustion Optimizer was tested for different plant conditions like that of different unit loads, different coal etc.
The principle benefits of using Combustion Optimizer at Rizhao Power Plant were:
� Better centralization of the fireball � Better O2 distribution in boiler � More O2 reduction based on the balanced combustion, normally the O2 reduction is 0.7~1.1 � Reduced auxiliary power, reduced coal consumption and increased boiler efficiency
With the request of the management at the Rizhao Power Plant, a third party evaluation of boiler efficiency improvement achieved by Combustion Optimizer was administered by Xi’an Thermal Power Research Institute Co., Ltd. (TPRI).
TPRI conducted a boiler efficiency test using GB 10184-88 standard methodology at full load and at partial load to compare the boiler efficiency with Combustion Optimizer ‘OFF’ and ‘ON’. Performance improvements attributed to combustion balancing but not included in the TPRI boiler efficiency calculation such as lower auxiliary power requirements (from induced, forced and primary air fan loads) and increased steam enthalpy were also calculated using TPRI test data and ASME 4.1 standards.
The Combustion Optimizer improved the performance by a total of 0.57% at full load. A better balanced combustion was achieved permitting the excess O2 to be reduced by 0.93% based on the DCS setpoints. This resulted in the decrease of fan loads (induced/forced draft and primary air) which further diminished the auxiliary power requirements by 293 KW/hr or 0.05% of the load. This reduction in auxiliary power led to the increase in the amount of electricity available for sale by the plant.
Also, at full load the steam enthalpy increased as Superheater and Reheater steam temperatures enhanced as a result of better combustion which increased 0.07% more overall improvement in steam turbine output. In addition, NOx level was reduced by 14.4% as a result of lower excess O2 while the CO and LOI did not materially change.
REFERENCES
1. Boiler Efficiency Calculation via ASME PTC 4.1 Method
2. GB 10184-88 Performance Test Code for Utility Boiler


