Hearing Sight Smell Taste Touch Three Sections: Inner, Middle and Outer.

Planning for Urban Change in the Inner & Middle (Greyfield) Suburbs of Melbourne
Presentation to: U3A
Swinburne University Friday 29 January 2016
Professor Peter Newton & Dr Stephen Glackin
Swinburne Institute for Social Research

Overview of Presentation
1. What’s the problem? 2. Models for urban infill transition
in the ‘greyfields’ 3. GtG Project: locating & engaging
precincts 4. Audience feedback

Metro [Melbourne] Challenges: • Melbourne’s current & forecast high population growth + demand for housing • Housing supply lagging demand….increasing gap • Housing affordability….capital city housing prices world leading……. Melbourne among least affordable globally • Housing mix…..undersupply of medium density housing • High cost of delivering inner/middle suburban medium density housing • Urban sprawl…greenfield continues to be where most new housing built → significant economic, environmental & social costs • Suburbanisation of social and economic disadvantage (concentration of lower income h’holds; poor access to public transport, tertiary education, specialist health; concentration of social problems) • Key urban infrastructures ageing; retrofitting & greenfield development lagging → developing hybrid urban infrastructures for energy, water and waste • Ecological footprint among highest globally (high resource consumption + CO2) • Plan Melbourne …. no strategy for regenerative intensification in established, underperforming suburbs apart from activity centres (and transport arterials

Future Population Forecasts (ABS series B)
Melbourne’s population forecast to double in 45 years
Both sides of politics committed to a ‘Big Australia’….and big ‘cities’

Population shares by zone, Melbourne
Source: Chris Loader (chartingtransport.com)
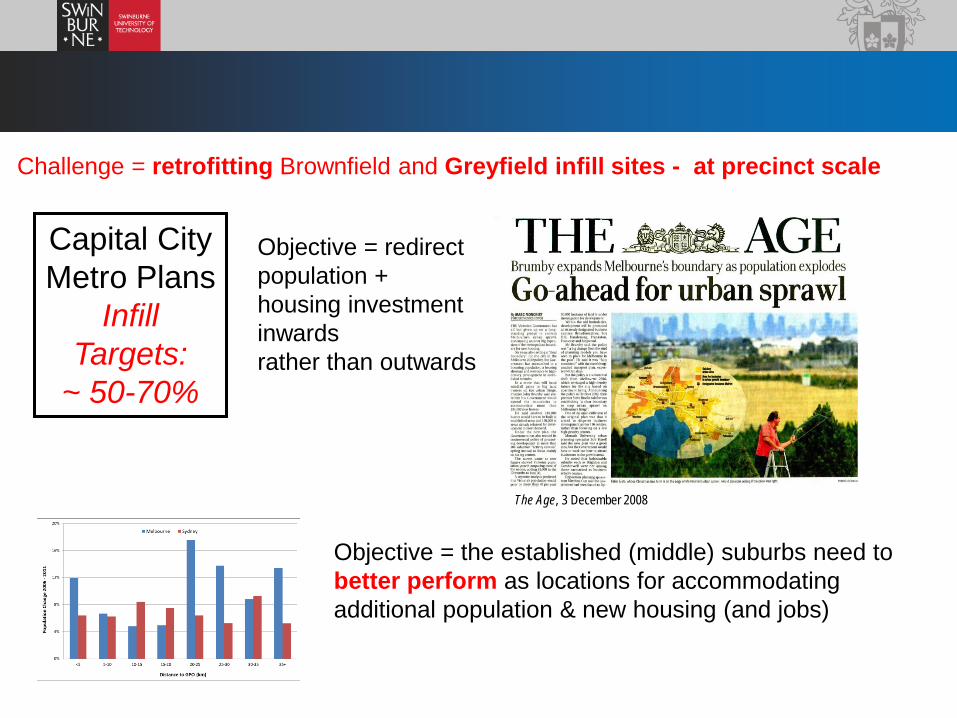
Challenge = retrofitting Brownfield and Greyfield infill sites - at precinct scale
Objective = the established (middle) suburbs need to better perform as locations for accommodating additional population & new housing (and jobs)
Capital City Metro Plans
Infill Targets:
~ 50-70%
Objective = redirect population + housing investment inwards rather than outwards
The Age, 3 December 2008

Liveability ≠ Sustainability: Melbourne’s Large Ecological Footprint
Australian Capital Cities
Source: Newton(2012)

Housing and Transport Contributions to Ecological Footprints in Australia, North America and Europe: a reflection of land use and transport planning
Transport: (ICE) Car Dependency; High VKTs; High Consumption of Petroleum / Fossil Fuels
Housing: Large dwellings require more energy to heat & cool household; Trojan horse for household consumption
Source: Townsend (2006)

Australia: Global house-price leader – a reflection of land use rules?

Landscapes of Relative Accessibility: Melbourne
Access to tertiary education
Access to public transport
Access to jobs

Housing market: constrained inner/middle city housing supply increasing costs and suburbanising social disadvantage

PATHWAYS TO MORE SUSTAINABLE CITIES: 3 HORIZONS OF URBAN DEVELOPMENT AT PRECINCT SCALE 3 Horizons of Urban Development
Greyfields are characterised by occupied residential areas that are physically and technologically obsolescent, environmentally poor performing and where the asset value resides in the land rather than the building (Newton, 2010; Built Environment )
Development Model ?
X:NRZ, GRZ
√
√

• where > 80% total property value is vested in the land; indicating high redevelopment potential
>30% housing stock in established inner / middle suburbs represent “Greyfield” built environments: • physically, technologically and environmentally poor
performing (but occupied) dwellings • economically under-capitalised/under-utilised asset

Maroondah Residential Properties
0
2000
4000
6000
8000
10000
12000
1.00 - 0.9 0.89 - 0.8 0.79 - 0.7 0.69 - 0.6 0.59 - 0.5 0.49 - 0.4 0.39 - 0.3 0.29 - 0.2 0.19 - 0.1 0.09 - 0.0
RDI
Prop
ertie
s
Residential Properties in 2000Residential Properties in 2006
Stonnington Residential Properties
0
1000
2000
3000
4000
5000
6000
7000
8000
1.00 - 0.9 0.89 - 0.8 0.79 - 0.7 0.69 - 0.6 0.59 - 0.5 0.49 - 0.4 0.39 - 0.3 0.29 - 0.2 0.19 - 0.1 0.09 - 0.0
RDI
Prop
ertie
s
Residential Properties in 2000Residential Properties in 2006
Melbourne Residential Properties
0
2000
4000
6000
8000
10000
12000
14000
16000
18000
1.00 - 0.9 0.89 - 0.8 0.79 - 0.7 0.69 - 0.6 0.59 - 0.5 0.49 - 0.4 0.39 - 0.3 0.29 - 0.2 0.19 - 0.1 0.09 - 0.0
RDI
Prop
ertie
s
Residential Properties in 2000Residential Properties in 2006
RESIDENTIAL REDEVELOPMENT POTENTIAL BY MUNICIPALITY
City of Melbourne Boroondara
Stonnington Maroondah
Redevelopment Potential Index (RPI) = Land Value/Capital Improved Value
High Low
High Low
High Low
High Low
Redevelopment Potential Index (RPI) = Land Value/Capital Improved Value
Redevelopment Potential Index (RPI) = Land Value/Capital Improved Value Redevelopment Potential Index (RPI) = Land Value/Capital Improved Value
Boroondara Residential Properties
0
2000
4000
6000
8000
10000
12000
14000
16000
1.00 - 0.9 0.89 - 0.8 0.79 - 0.7 0.69 - 0.6 0.59 - 0.5 0.49 - 0.4 0.39 - 0.3 0.29 - 0.2 0.19 - 0.1 0.09 - 0.0
RDI
Prop
ertie
s
Residential Properties in 2000Residential Properties in 2006
RPI
RPI
RPI
RPI

Stages in the housing life cycle of a metropolitan region
Source: Newton et al 2011

Most residential redevelopment can be expected to continue to occur OUTSIDE current designated development zones … as fragmented, sub-optimal ‘knock-down-rebuild’
Currently there is no operational model for medium density residential precinct redevelopment in the Greyfields [ in Neighbourhood and General Residential Zones]
Activity centres and transport corridors are both necessary but not sufficient instruments for meeting infill targets and delivering more compact cities. They are not acting as the ‘twin magnets’ planning policy has articulated.
Arenas for Greyfield Infill Development

What’s happening with urban infill in Melbourne?
• Net new housing infill below 50% [Plan Melbourne (PM) target 53%; PM Refresh 70%]
• Brownfields (BF):Greyfields (GF) ratio of new dwelling construction running approximately 45:55
• Types and scale (YIELD) of dwelling projects vary significantly between BF & GF: GF: 27% 1:1 50% 1:2-4 units BF: 17% 1:50-100 56% 1: 100+ units • Public transport access level (PTAL ) is not a magnet for attracting higher levels of
infill; households remain attached to cars and developers to offering car parking
• CBD is only activity centre attracting significant rate of new housing
• Type of infill housing varies by area socio-economic status: Above ave. SES locations: 1:1 replacement; high rise apartments dominate Average-to-Below ave. SES locations: 1: 2-4 and 1: 5-9 projects dominate

Residential infill yields of Projects, Melbourne, 2004-2010 (% total infil)
1 2-4 5-9 10-19 20-49 50-99 100+ Total
Brownfield 1.3 0.5 0.7 2.8 4.1 5.9 19.2 34.4
Greyfield 17.9 32.3 6.3 2.3 3.2 2.3 1.3 65.6
Totals (%) 19.2 32.8 7.0 5.1 7.3 8.2 20.5 100.0
(N) 21,947 37,614 8,029 5,833 8,309 9,374 23,487 114,593
Medium density precinct scale redevelopment significantly under-represented in urban infill projects
Where is the medium scale residential precinct development?
Source: Newton & Glackin (2014; UP&R)

Cantankerous cities: intensification, neighbourhood change and resident reaction

Appeals to VCAT, 2007–2012, by municipal council area, Melbourne: Planning needs to be better than this……
Source: Newton & Glackin (2014)

Precinct regeneration offers the prospect for the (re-)design of more sustainable, resilient, low carbon neighbourhoods: •Housing (variety, affordability, yield) •Energy (low/zero carbon; distributed generation) •Water (integrated stormwater/ rainwater/ greywater; water sensitive design) •Waste (optimise recycling, reuse, food composting) •Mobility and health (more walkable) •Neighbour contact (community spaces, gardens)
……that mesh with an evolving transition in urban character from ‘suburban’ to ‘urban’ through better design
Why Precincts?

Innovation Arenas for Initiating Greyfield Precinct Regeneration
Source: Newton et al 2011

How all this works on the ground. • Land is being redeveloped
everywhere. • In lots of instances its creating
bad outcomes. • People are starting to capitalise
on this by selling their land together for more money.
• And now there is the potential to use lot amalgamation for all sorts of social and environmental benefit.
• The big questions is: “what NARRATIVE will drive people to work together?” or rather “what would YOU consider as a viable option for lot amalgamation?”

We have tools to show WHERE it is practical and viable
High redevelopment potential in Maroondah, near train stations and hospitals, with low land slope.

And here are the properties with high RPI around us NOW!

We have tools to show WHAT can be developed - and its benefit
Redevelopment scenario in Maroondah to gain maximum: open space, walkability, stormwater capture and housing choices.

We have numerous process to show HOW to develop precincts
State commitment: Senior partners in state government and local government who are committed to this process. Planning reform: New statutory process (zones and overlays) that allow landowners to benefit from lot amalgamation. Legal frameworks: Allowing landowners to work together fairly and equitably, as well as to protect the rights of all landowners. Choices and options: Alternative funding pathways for precincts (sell land, hold land, joint venture, reverse mortgage, new dwelling + profit, etc.) Market Information: Economic viability analysis tools to illustrate the cost and potential outcomes of different redevelopment models.

Who? Identify key market segments; eg. Baby boomers

And this is where you come in.
• You are the land owners and control what happens on your land
• Individually you may not much say about your locality
• BUT as a group of landowners you could have far more
say over developments on amalgamated lots. • So the big questions are:
• What do you think your housing decisions will be in the future, and
• What would tempt you towards joining with your neighbours to regenerate your houses together?

Housing decisions for older Australians - what are your plans?
• Age in place: Higher wealth/lower income? Draw down on home equity?
Prospects for home care? • Sell and move to a retirement village/hostel arrangement • Sell individually and shift locally to smaller newer property (existing or from plan)
in same municipality/suburb/area ; Q: similar price points for selling and buying (ie little extra cash after transaction)
• Sell individually and shift to smaller newer property (existing or from plan) in
different municipality/suburb/area ; Q: different price points for selling and buying (ie gain a cash benefit as well as downsize)
• Sell with neighbours (double sale price) for precinct scale medium density and
buy into new development in same neighbourhood • Sell with neighbours (double sale price) for precinct scale medium density and
move to another/different area

Future design of your space and locality Other than financial and housing security, what else would tempt you to join a project?
• Common space? • Private space? • Economic sustainability? • Greater access to services and transport? • Greater levels of passive surveillance? • Shared resources? • Less expensive water and energy bills? • As a way to shape your locality for the better? • Anything else?

THANK YOU ………………….and Acknowledgements