Planning for Senior Population Growth in Prince George’s ... · LLC Limited Liability Company...
76
Planning for Senior Population Growth in Prince George’s County i
Transcript of Planning for Senior Population Growth in Prince George’s ... · LLC Limited Liability Company...

Planning for Senior Population Growth in Prince George’s County
i
Planning for Senior Population Growth in Prince George’s County
ii
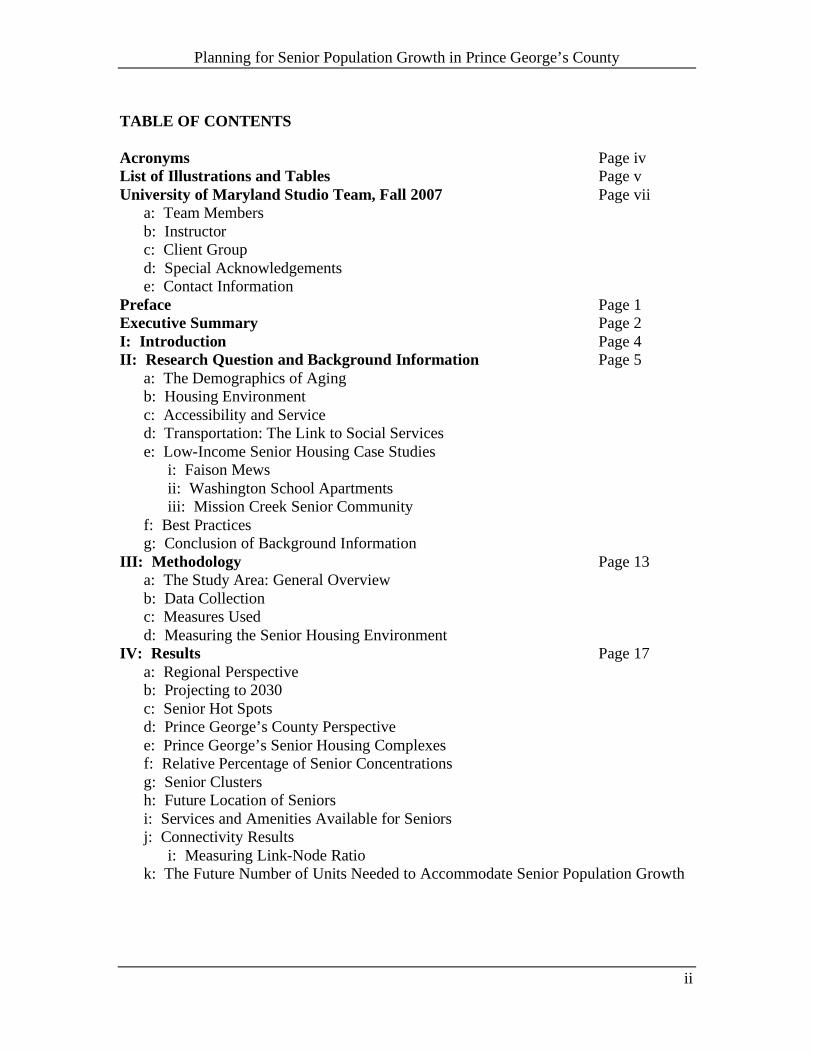
TABLE OF CONTENTS Acronyms Page iv List of Illustrations and Tables Page v University of Maryland Studio Team, Fall 2007 Page vii
a: Team Members b: Instructor c: Client Group d: Special Acknowledgements e: Contact Information
Preface Page 1 Executive Summary Page 2 I: Introduction Page 4 II: Research Question and Background Information Page 5
a: The Demographics of Aging b: Housing Environment c: Accessibility and Service d: Transportation: The Link to Social Services e: Low-Income Senior Housing Case Studies i: Faison Mews ii: Washington School Apartments iii: Mission Creek Senior Community f: Best Practices g: Conclusion of Background Information
III: Methodology Page 13 a: The Study Area: General Overview b: Data Collection c: Measures Used d: Measuring the Senior Housing Environment
IV: Results Page 17 a: Regional Perspective b: Projecting to 2030 c: Senior Hot Spots d: Prince George’s County Perspective e: Prince George’s Senior Housing Complexes f: Relative Percentage of Senior Concentrations g: Senior Clusters h: Future Location of Seniors i: Services and Amenities Available for Seniors j: Connectivity Results i: Measuring Link-Node Ratio k: The Future Number of Units Needed to Accommodate Senior Population Growth

Planning for Senior Population Growth in Prince George’s County
iii
l: County Financing: HOME Investment Partnership Program and Community
Development Block Grants Program (CDBG) i: HOME Investment Partnership Program-History and Purpose ii: HOME Funds Allocation Process iii: HOME Funds Eligibility iv: HOME Funds Requirements
m: Prince George’s County HOME Fund Program i: Lead Agency
ii: Activity and Budget Overview for Fiscal Year 2008 ii: HOME Funds Allocation Criteria
n: Community Development Block Grants (CDBG)-History and Purpose o: Prince George’s County CDBG Program
i: Fiscal Year 2005 and Fiscal Year 2006 CDBG Allocations V: Discussion of Results Page 53 VI: Recommendations Page 55
a: Recommendation 1: Address Prince George’s County’s Current and Future Need for More Affordable Senior Housing
b: Recommendation 2: Address the Mismatch between Senior Housing Locations and Services
c: Recommendation 3: Address Issues of Regulatory Policy Regarding ADA Standards for Senior Housing Facilities
d: Recommendation 4: Improve County Methods for Data Management and Record Keeping of Housing Facilities and Social Services for
e: Seniors including Data Sharing Among County Agencies VII: Areas for Further Research Page 64 VIII: References Page 66 IX: List of Appendices Page 69
Planning for Senior Population Growth in Prince George’s County
iv
ACRONYMS AARP American Association of Retired Persons ACS American Community Survey ADA Americans with Disabilities Act (1990) ADC Alexandria Drafting Company ADDI American Dream Down Payment Initiative ADL Activity of Daily Living AIDS Acquired Immunity Deficiency Syndrome AMI Area Media Income ANSI American National Standards Institute CAFB Capital Area Food Bank CDBG Community Development Block Grants CHDO Community Housing Development Organization CPD Division of Community of Planning and Development DFS Department of Family Services DSS Department of Social Services DHCD Department of Housing and Community Development ESG Emergency Shelter Grants FHA (1988) Fair Housing Act FY Fiscal Year GIS Geographic Information System HOME Home Investment Partnership Funds HMO Health Maintenance Organization HOPWA Housing Opportunities for Persons with AIDS HUD Housing and Urban Development ICC International Code Council IDL Instrumental Activity of Daily Living LIHTC Low Income Housing Tax Credits LLC Limited Liability Company MAHT Maryland Affordable Housing Trust M-NCPPC Maryland-National Capital Park and Planning Commission MRT Mass Rapid Transit MSA Metropolitan Statistical Area NDC Neighborhood Design Center, Prince George’s County OASIS Older Adult Services and Information Network PBCPI Parkside Business and Community Partnership, Inc. PILOT Payments in Lieu of Taxes PJ Participating Jurisdiction PPI Public Policy Institute S.E.E.D. Sowing Empowerment and Economic Development, Inc. TOD Transit Oriented Development UCAP United Communities Against Poverty, Inc. UFAS Uniform Federal Accessibility Standards WMATA Washington Metropolitan Area Transit Authority WWHA Walla Walla Housing Authority

Planning for Senior Population Growth in Prince George’s County
v
LIST OF ILLUSTRATIONS AND TABLES
Figure 1 Affordable Housing for Seniors Case Study Summary Page 11 Figure 2 Prince George’s Demographic Changes – 1990 to 2006 Page 13 Figure 3 Examples of Connectivity Page 16 Figure 4 Regional Senior Population – Density per Square Mile – 2000 Page 17
Figure 5 Percentage Growth in Total Population Compared to Senior Population - 2000 to 2006 Page 18
Figure 6 Regional Population Projections – 2000 to 2030 Page 20
Figure 7 Prince George’s Seniors as Percentage of Regional Seniors – 2010 to 2030 Page 20
Figure 8 Regional Senior Population – Density per Square Mile – 2010 Page 21 Figure 9 Regional Senior Population – Density per Square Mile – 2020 Page 21
Figure 10 Regional Senior Population – Density per Square Mile – 2030 Page 21 Figure 11 Regional Senior Hotspots – 2000 Page 22 Figure 12 Regional Senior Hotspots – 2010 Page 23 Figure 13 Regional Senior Hotspots – 2020 Page 23 Figure 14 Regional Senior Hotspots – 2030 Page 23
Figure 15 Prince George’s County – Senior Population Density per Square Mile - 2000 Page 25
Figure 16 Senior Population Density with Senior Affordable Housing Complexes - 2000 Page 26
Figure 17 Senior Population Density - Senior Affordable Complexes and Councilmanic Districts – 2000 Page 27
Figure 18 Detail of Prince George’s Senior Density – 2000 Page 28
Figure 19 Close Up with Streets: A Block Group with High Density of Seniors per Square Mile – 2000 Page 29
Figure 20 Percentage of Total Senior Complexes and Affordable Units in or near Beltway Page 30
Figure 21 Percentage of Area, Population, and Seniors Inside and Outside of Capital Beltway – 2000 Page 30
Figure 22 Prince George’s County – Senior Population as Percentage of Block Group Population – 2000 Page 31
Figure 23 Prince George’s Hot Spots – 2000 Page 32 Figure 24 Prince George’s Hot Spots – 2010 Page 33 Figure 25 Prince George’s Hot Spots – 2020 Page 34 Figure 26 Prince George’s Hot Spots – 2030 Page 35
Figure 27 Services within 1-mile Radius of Existing Affordable Senior Housing Complexes Page 37
Figure 28 Services within 1-Mile Radius of Existing Affordable Senior Housing Complexes – Best Case Page 38
Figure 29 Services within 1-Mile Radius of Existing Affordable Senior Housing Complexes – Worst Case Page 38
Figure 30 Connectivity Link-Node Ratio Examples Page 39 Figure 31 Connectivity Scores for .25-mile and 1-mile Buffers Page 40 Figure 32 Senior Complex Transportation Accessibility Page 41 Figure 33 Ratio of Seniors to Affordable Senior Housing Units – 2006 Page 43 Figure 34 Annual Number of New Affordable Units Needed to 2030 Page 43 Figure 35 Estimates for Number of Future Affordable Senior Housing Units Page 44 Figure 36 Uses of HOME Funds By Category and Budget Page 47 Figure 37 Prince George’s County CDBG Allocation Process Page 49

Planning for Senior Population Growth in Prince George’s County
vi
Figure 38 CDBG Allocations - Fiscal Years 2005-2006 Page 50 Figure 39 Prince George’s County CDBG Expenditures by Type - Fiscal Year 2005 Page 51 Figure 40 Prince George’s County CDBG Expenditures by Type - Fiscal Year 2006 Page 51
Figure 41 CDBG Eligible Block Groups and Location of Affordable Senior Complexes Page 56
Figure 42 Connectivity Measures for Seniors Complexes – Highest Case Page 59 Figure 43 Connectivity Measures for Seniors Complexes – Lowest Case Page 59
Figure 44 Connectivity Measures of Senior Affordable Complexes in Prince George's County Page 60

Planning for Senior Population Growth in Prince George’s County
vii
UNIVERSITY OF MARYLAND STUDIO TEAM, FALL 2007 The studio team consists of graduate planning students in the Urban Studies and Planning Program at the University of Maryland, College Park:
Rosalina Balarezo Shannon Grevious Emanuel Briggs Ruizhu Huang Sun Young Choi Megan Moriarty Eric Duneman Claire Schnitzer Anthony Gamallo Tiffany C. Williams
Dr. Alex Chen, Instructor Client Group The client group for this studio project consists of the following community stakeholders:
Anne Baum, Prince George's County Department of Housing and Community Development (DHCD)
Jan Townsend, Program Manager, Neighborhood Design Center (NDC), Prince George's County
Special Acknowledgements
The studio team would like to acknowledge the contributions made by Dr. Alex Chen to the successful completion of this study and report. His instruction and guidance throughout the process were invaluable.
The team gives special thanks to the client group for their time and continued support, and we would also like to thank the many residents, senior housing and senior center staff, and senior service agencies and organizations that have helped to make this project possible.
Contact Information
For further information about this report, please contact:
Dr. Alex Chen University of Maryland School of Architecture, Planning and Preservation 1245 Architecture College Park, MD 20742 (301) 405-6798 [email protected]
The report may also be accessed online at: http://www.arch.umd.edu/URSP/Research/studiorpts/

Planning for Senior Population Growth in Prince George’s County
1
PREFACE
Definition and Purpose of the Community Planning Studio
The Community Planning Studio is a capstone course for graduate students enrolled in the University of Maryland at College Park's Master of Community Planning Program. Building on research and analytical skills gained in core courses such as Planning History and Theory, Research Methods and Planning Process, students are organized into a studio research team in which they apply classroom knowledge to real life experience. Over a sixteen week period, students work as a team of planning professionals alongside an instructor and client group of stakeholders who have identified a problem of planning relevance. In this context, students identify key issues within the specified study area, define a research question, develop a research methodology, employ intensive fieldwork and data collection efforts, and analyze primary and secondary data. The results of these efforts are summarized in a written report including detailed findings and policy recommendations. The written report was complemented with an oral presentation of the team's efforts and conclusions to the clients and other interested parties.

Planning for Senior Population Growth in Prince George’s County
2
EXECUTIVE SUMMARY This report presents the findings of a study conducted on current and projected distributions of affordable senior housing1, social services, and the senior2 population in Prince George's County. Graduate students in the Urban Studies and Planning Program, the University of Maryland, College Park conducted this study during the Fall 2007 semester. In an effort to address the needs of its aging population, Prince George’s County has traditionally provided funding to increase and improve housing programs and social services that benefit low-income seniors. Primary sources of this funding have been Community Development Block Grants (CDBG) and Home Investment Partnership (HOME) funds. In recent years, however, there has been increasing concern regarding the allocation of resources in support of the aging population. A major challenge to addressing this issue has been identifying the spatial distribution of the County’s elder population so that funding may be used to target communities that most need affordable senior housing and adequate community based social services. This report presents a methodology for identifying the spatial relationship between the senior population and affordable multifamily senior housing in Prince George’s County for the purpose of identifying mismatches between the supply and demand for affordable multifamily senior housing. This report also goes beyond the traditional bricks and mortar approach to senior housing, and explicitly recognizes that social support services are a critical element of the senior housing environment. In addition, the study examines the role of CDBG and HOME funds in providing affordable housing for the elderly. Finally, the report contains a set of recommendations to address future housing needs and spatial mismatches and also considers the vital roles played by non-profit, public and faith-based agencies and organizations in providing programs and services that enhance the quality of life for seniors. To address these issues, the research team used both qualitative and quantitative research methods to provide a comprehensive view of the problem. Data collection for this study included site visits, interviews, contact with community stakeholders, reviews of existing literature on planning and design of housing and service programs for the elderly, and surveys of senior housing complexes to assess levels of services. The report relies heavily on Geographic Information System (GIS) technology to integrate these data into a single spatial framework for Prince George’s County.
1 This report defines affordable senior housing as multifamily housing complexes that are a) subsidized at either the federal, state or local level, b) income-restricted so that monthly unit rental costs will not rise above 30 percent of renters' disposable incomes or 60 percent of the area median income, and c) also restricted to senior residents. 2 For the purposes of this report, the senior population shall include those individuals 65 years of age and older.

Planning for Senior Population Growth in Prince George’s County
3
Based on the findings of this report, it is evident that there is a spatial disconnect among the distribution of the County's senior population and its social support environment. In addition, the number of seniors in the County far exceeds the available senior multifamily housing units. This gap will grow wider as the total number of seniors is projected to nearly triple over the next 20 years. Many senior housing complexes offer a wide program of activities and other types of services to residents, but this is not the case in every example. Compounding these issues are those of connectivity and walkability, which address the proximity and accessibility of community based social services to senior housing complexes, as well as the condition and layout of roads and sidewalks which often inhibit seniors’ ability to travel. Certainly, there is a wide variety of housing alternatives available to the senior population, of which affordable multifamily housing is but one option. Nonetheless, multifamily housing is a critical element of the array of housing options that should be made available to the elderly and must not be disregarded. In assessing the senior housing environment for Prince George’s County, it is necessary to look at the current and future needs of the aging population. This includes a consideration of whether the distribution of affordable senior housing is sufficient for the current and projected senior population, and an analysis of the social services that are accessible to senior communities. There is also a need for accurate record keeping of the total number of seniors and senior housing units in the County. The recommendations presented in this report take these considerations into account, while addressing three basic goals: Prince George’s County’s current and future need for affordable multifamily senior housing; the spatial mismatch between locations of multifamily senior housing complexes and community based social services; and improving methods of data management with regard to senior housing unit inventories, and record keeping of the total number of senior residents within the County. While housing agencies, non-profit groups and other community stakeholders are encouraged to take an active role in providing sufficient affordable housing programs and community based social services that deal with the needs of the elderly, the recommendations presented in this report are included primarily for those County agencies concerned with addressing the needs of the elderly.
Planning for Senior Population Growth in Prince George’s County
4
I: INTRODUCTION This report responds to a growing concern expressed by the Prince George's County Department of Housing and Community Development (DHCD), the County agency responsible for the allocation of housing funding in the County3, and the Neighborhood Design Center, Prince George's County (NDC), a non profit group that provides a wide variety of support services for local communities.4 Both groups echoed a growing national concern regarding how best to house the County’s elder population. The report presented here describes and analyzes the current and future housing environment for low-income seniors in Prince George’s County. It uses spatial analytic techniques available through GIS technology to examine the relationship between 37 affordable senior housing complexes5 located in the County and the distribution of the County’s elder population. These 37 apartment complexes comprise the total sum of low-income multifamily senior housing complexes in the County6. This report also considers data gathered during site visits to all 37 complexes and interviews with experts in the field to assess the social support environment of these senior housing facilities. As such, the report also assesses the extent to which the existing supply of multifamily senior housing complexes in the County is able to meet the current and future needs of its growing elder population. The report concludes with a series of recommendations as to how the County should plan for the future growth of its senior population. Special attention is given to how the County should allocate its CDBG and HOME funds, traditionally a primary source of financial support for elder housing and services. This report has been designed as a guide for County agencies concerned with the spatial distribution of its senior population and the location of affordable multifamily senior housing. It is also intended as a proactive document to encourage senior service agencies and organizations to develop programs and strategies to meet the needs of the County’s aging population. In addition to the policy recommendations provided herein, the research methodology developed provides a template for other jurisdictions concerned with housing for the elderly.
3 http://www.goprincegeorgescounty.com/Government/AgencyIndex/HCD/ 4 www.ndc-md.org 5 These complexes were provided to the studio team by the Prince George’s Department of Housing and Community Development. 6 See Appendix B for a listing of the 37 complexes.
Planning for Senior Population Growth in Prince George’s County
5
II: RESEARCH QUESTION AND BACKGROUND INFORMATION Discussions with the Neighborhood Design Center and officials with Prince George’s County shed light on several concerns regarding housing the local senior community. Though these concerns varied in detail, the fundamental issue that arose was: “What is the current and future state of the housing environment for low-income seniors in Prince George’s County?” More careful thought reveals the complexity of the issue: What constitutes the housing environment for the elderly? Is it only bricks and mortar, or should it include the social environment as well? Where are the elderly located, and what is the condition of the social support environment in terms of proximity and accessibility? In this light, a review of the literature was conducted to gain a sense of the state of affordable housing for the elderly, as well as some insight as to how best to approach the problem. The Demographics of Aging The graying of America is one of the most significant and dramatic trends in the last 20 years7. This is not altogether surprising. Between 1946 and 1964, 78 million Baby Boomers were born nationwide, representing a massive bulge in the population well above previous birthrates.8 According to the report issued in 2002 by the federally mandated Commission on Affordable Housing and Health Facility Needs for Seniors in the 21st Century, as the years progress within the millennium, the elder population will double by the year 2030 from 35 million to 75 million persons.9 At the time of the report, roughly one-third of seniors were living at annual incomes of $17,500 or below. Included in this figure were 8.4 million elder persons who had incomes of less than $10,500.10 Other data showed that of the seniors with the lowest incomes, 6.5 million pay fifty percent or more of their incomes on housing related expenses. The Commission further reported that at the time of publication there were 1.3 million affordable government-assisted units occupied by seniors in the United States, but that many more, some 730,000 units, would be needed to house the growing elder population by the year 2030. The problem is compounded by cutbacks in federal spending for affordable housing, which affect the development of new housing facilities geared to the needs of the elderly. In Prince George’s County, those 65 years of age and over have increased by 45.94 percent since 1990, and now account for 15.36 percent of the total population.11
7 Leo Pastalan, “Designing Housing Environments for the Elderly”, JAE, Vol. 31, No. 1, Environments and Aging. (Sep. 1977): 11-13 and Nancy Libson, “Sad State of Affordable Housing for Older People”. Generations (Winter 2005-2006) 8 Tom Valeo, “Growing Old, Baby Boomer Style.” CBS News. 10 January 2006 http://www.cbsnews.com/stories/2006/01/10/health/webmd/main1195879.shtml; Internet; accessed 20 November 2007. 9 Nancy Libson. 10 Nancy Libson. 11 United States Census; www.census.gov

Planning for Senior Population Growth in Prince George’s County
6
Housing Environment With an aging population and a growing concern of federal cutbacks, planners and policy makers must be strategic in identifying the housing needs of the elderly. Increasingly, attention has turned to the broader macro environment in which seniors live when considering housing arrangements, rather than limit attention to traditional bricks and mortar12. Lawton alluded to this in the 1970s when he urged that the “senior housing environment” be “life-enriching and life-sustaining,” creating a balance between a life that is engaging and also provides support services for “ease of living.”13 It is in this context that planning for senior housing environments currently transcends the physical design of the building or home, and also takes into account community services and accessibility to such services. Clearly, this is not to say that physical design is unimportant. There is ample evidence that the lack of barrier-free design elements hinders an older person’s ability to age in place.14 For example, AARP supports programs that allow seniors to stay in their homes through retrofitting and physical modifications. In light of the exorbitant costs associated with home modification, a universal design model is offered and is based on physical features that enable persons of all ages and abilities to enjoy a product; typical features include lever faucets and door handles, roll-under sinks in kitchens and bathrooms, doors offering at least 32 inches of clear passage space, grab bars, and roll-in showers with handheld adjustable shower heads. When staying in a single-family home is not possible, AARP supports the congregate housing model, which it defines as an apartment building for people living independently and receiving common hospitality services such as hot meals, light housekeeping and social activities.15 AARP also maintains that accessibility policies and requirements for new multifamily dwellings are keys to ensuring that these types of dwellings are adequate. Many such policies have been adopted at the national level and require the following: wide hallways, a level entry to the principal entrance, an entrance door wide enough to allow wheelchair access, and raised electrical outlets and lowered light switches.16
12 Leo Pastalan. 13 M. Powell Lawton, Planning and Managing Housing for the Elderly (New York: John Wiley & Sons, Inc., 1975) 14. “Time for Action: Advancing Human Rights for Older Ontarians”, Ontario Human Rights Commission Toronto: Ontario Human Rights Commission, June 2001; http://www.ohrc.on.ca/en/resources/discussion_consultation/TimeForActionsENGL/pdf; Internet; accessed 6 December 2007. 15 AARP Public Policy Institute. (2005). Beyond 50.05 A Report to the Nation on Livable Communities: Creating Environments for Successful Aging. Washington, DC: AARP May 2005 (pp. 16; 48; 8-10; 49-56). 16 AARP Public Policy Institute p. 57.

Planning for Senior Population Growth in Prince George’s County
7
Accessibility and Service As one might expect, transportation plays an increasingly critical role in defining a person’s environment as he or she ages. The Council On Tall Buildings And Urban Habitat report that “transportation systems serve as important linkages between the private domain and the public domain for all people,” and concludes, “[t]ransportation that connects individuals to the goods, services, and social opportunities of the community contributes to successful aging.” Further evidence indicates that many seniors do not drive nor receive rides in personal vehicles, suggesting a reliance on alternative modes of transportation, e.g. walking, public transit, or simply not leaving their homes. Transportation: The Link to Social Services Increasingly, social services are deemed the critical resource in creating suitable living environments for the elderly. Such services are the necessary ingredient which will allow the elderly to age in their communities, regardless of whether they are homeowners or renters. Indeed, community based amenities and services are one of three elements that comprise AARP’s definition of livable community, with the remaining two elements being affordable and appropriate housing and adequate mobility options. In this light, the interaction between transportation and social services becomes an integral component of the senior housing environment. Notably, in Prince George’s County, there are several agencies and organizations that address the needs of the elderly (See Appendix A for an expanded list). The two County agencies that specifically address seniors’ service needs are the Department of Social Services that provides aid to the most vulnerable of seniors, those that might be in danger of exploitation, abuse or neglect, and the Department of Family Services that houses the Agency on Aging, which provides various services for seniors and their caretakers. The array of social services offered highlights the complex and multifaceted nature of meeting the needs of the elderly, and the recognition by the County to address those needs. Low-Income Senior Housing Case Studies As noted earlier, the graying of America is of national concern, and the evidence indicates that there are many examples of innovative approaches to housing the elderly. Following are summaries of three successful examples of senior housing complexes located in the United States. These complexes are independent living facilities for low-income seniors and are of interest because of their focus on affordable housing for individuals in financial need, creative financing mechanisms, effective use of HOME and CDBG funds, and amenities offered to residents. They are meant to provide an additional context for developing recommendations for Prince George’s County to consider when developing strategies for senior housing development.

Planning for Senior Population Growth in Prince George’s County
8
Faison Mews17 Faison Mews is an independent living apartment building located in Camden, New Jersey, offering 51 affordable housing units to low-income seniors. The project was developed in partnership by two local affordable housing developers, Pennrose Properties, Inc. and Parkside Business and Community Partnership, Inc. (PBCPI). The project called for the rehabilitation of an existing structure called the Pearlye Building, along with some surrounding apartment buildings, which had all fallen into disrepair over the years. The developers also wanted to add green features to the renovated building that would help reduce energy costs for tenants. The total cost of the project was $9 million, an amount raised through a variety of financing resources. The developers received $2.5 million from the New Jersey Department of Community Affairs’ Balanced Housing Program18, which funds affordable housing projects throughout the state; $5.9 million in Low Income Housing Tax Credits (LIHTC), which provides tax incentives for investors to build affordable housing; $200,000 from Camden’s HOME fund; and approximately $415,000 in other subsidies and equity sources.19 The apartments are one-bedroom, one-bathroom units that are ADA accessible. The facility has controlled access with a security camera, community room, laundry facilities, and a visiting nurse suite. In addition, Faison Mews also schedules social and recreational activities for its residents, including educational seminars, health and wellness screenings, and volunteer activities. As one final amenity, there is accessible public transportation to neighborhood shopping as bus stops are within close proximity of the facility.20 Washington School Apartments21 Walla Walla, Washington, in the early 1990s, was experiencing a rental housing market suffering from a very low vacancy rate, between 1 and 5 percent, which was exacerbated by the lack of any new residential construction over the previous several decades. The area was also home to a sizable population of seniors, many of whom were low-income and, due to market circumstances, could not find affordable housing. With community backing, the Walla Walla Housing Authority (WWHA) decided to renovate a century-old
17 Bendix Anderson,. “Readers’ Choice Awards: Urban Finalist: Rehabbed Landmark Revives Neighborhood”, Affordable Housing Finance http://www.housingfinance.com/ahf/articles/2007/aug/FAISON-MEWS0807.htm; Internet; accessed 4 November 2007. 18 “Balanced Housing Program” New Jersey Department of Community Affairs. www.nj.gov/dca/dh/pubs/balanhous.pdf; Internet; accessed 4 November 2007. 19 Bendix Anderson. 20 Pennrose Properties, LLC, “Faison Mews” pennrose.com/PDFs/FaisonMews.pdf; Internet; accessed 1 November 2007. 21 “Affordable Housing and HOME-The Washington School Apartments, Walla Walla, Washington” National Association of Housing and Redevelopment Officials http://www.nahro.org/home/wash.htm, Internet; accessed 1 November 2007.
Planning for Senior Population Growth in Prince George’s County
9
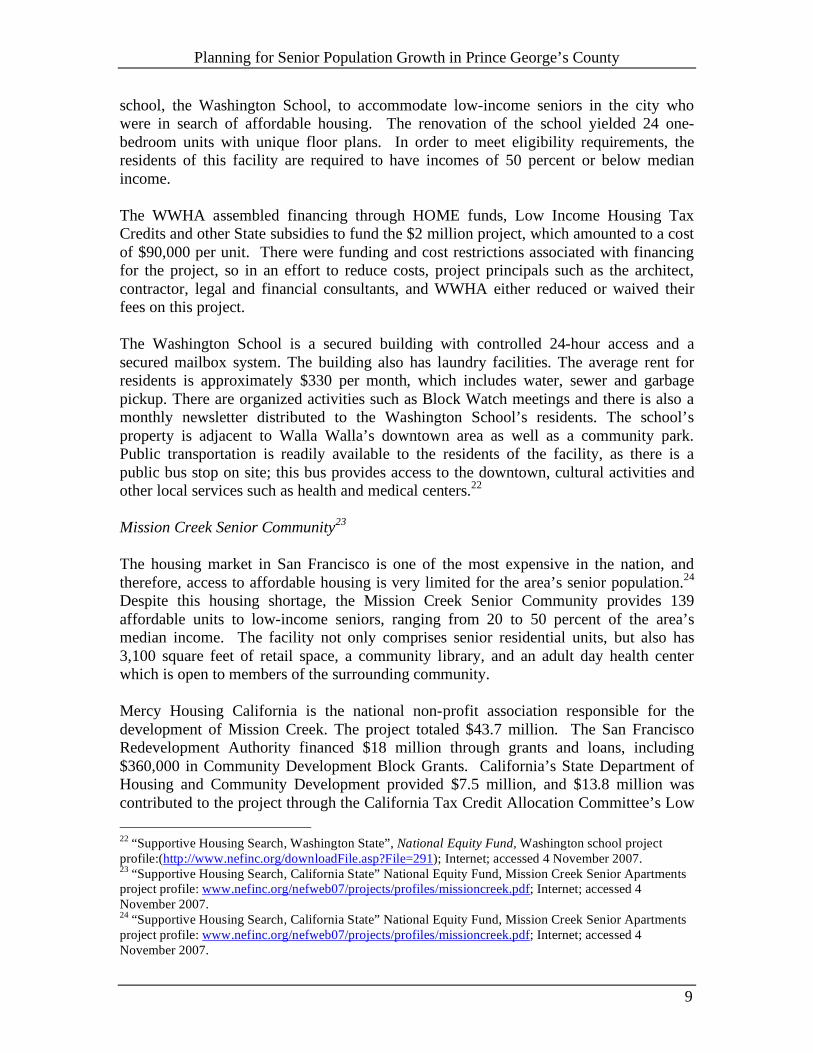
school, the Washington School, to accommodate low-income seniors in the city who were in search of affordable housing. The renovation of the school yielded 24 one-bedroom units with unique floor plans. In order to meet eligibility requirements, the residents of this facility are required to have incomes of 50 percent or below median income. The WWHA assembled financing through HOME funds, Low Income Housing Tax Credits and other State subsidies to fund the $2 million project, which amounted to a cost of $90,000 per unit. There were funding and cost restrictions associated with financing for the project, so in an effort to reduce costs, project principals such as the architect, contractor, legal and financial consultants, and WWHA either reduced or waived their fees on this project. The Washington School is a secured building with controlled 24-hour access and a secured mailbox system. The building also has laundry facilities. The average rent for residents is approximately $330 per month, which includes water, sewer and garbage pickup. There are organized activities such as Block Watch meetings and there is also a monthly newsletter distributed to the Washington School’s residents. The school’s property is adjacent to Walla Walla’s downtown area as well as a community park. Public transportation is readily available to the residents of the facility, as there is a public bus stop on site; this bus provides access to the downtown, cultural activities and other local services such as health and medical centers.22 Mission Creek Senior Community23 The housing market in San Francisco is one of the most expensive in the nation, and therefore, access to affordable housing is very limited for the area’s senior population.24 Despite this housing shortage, the Mission Creek Senior Community provides 139 affordable units to low-income seniors, ranging from 20 to 50 percent of the area’s median income. The facility not only comprises senior residential units, but also has 3,100 square feet of retail space, a community library, and an adult day health center which is open to members of the surrounding community. Mercy Housing California is the national non-profit association responsible for the development of Mission Creek. The project totaled $43.7 million. The San Francisco Redevelopment Authority financed $18 million through grants and loans, including $360,000 in Community Development Block Grants. California’s State Department of Housing and Community Development provided $7.5 million, and $13.8 million was contributed to the project through the California Tax Credit Allocation Committee’s Low 22 “Supportive Housing Search, Washington State”, National Equity Fund, Washington school project profile:(http://www.nefinc.org/downloadFile.asp?File=291); Internet; accessed 4 November 2007. 23 “Supportive Housing Search, California State” National Equity Fund, Mission Creek Senior Apartments project profile: www.nefinc.org/nefweb07/projects/profiles/missioncreek.pdf; Internet; accessed 4 November 2007. 24 “Supportive Housing Search, California State” National Equity Fund, Mission Creek Senior Apartments project profile: www.nefinc.org/nefweb07/projects/profiles/missioncreek.pdf; Internet; accessed 4 November 2007.
Planning for Senior Population Growth in Prince George’s County
10
Income Housing Tax Credit program.25 The remaining $8.6 million was financed through additional subsidies and equity resources. The project also secured a business partner in North & South of Market Adult Day Health, Inc., which is a local service provider of health care and manager of Mission Creek’s health center.26 The center provides medical care such as physical and occupational therapy to residents and members of the community, and hot meals are also provided.27 Mission Creek Senior Community comprises energy saving features such as solar panels and low-flow plumbing fixtures. Other features include handicap accessible apartments, laundry facilities, resident lounges, retail centers in close proximity to the complex, and access to public transportation. In addition to health services, the Adult Day Health Center schedules recreational activities for residents. The area is also adjacent to public parks and the Mission Creek waterway.28 Best Practices The following table summarizes highlights of each case study and important practices gathered from a review of the complexes. A review of these examples highlight the importance of innovative financing techniques, such as the use of multiple financing sources and waiving of development fees; the importance of partnerships between the private and public sector; and finally, the emphasis on mixed uses, and the adaptive re-use of properties. It suggests considerations for the County if it chooses to develop programs to increase the housing stock for the elderly. Specifically, there are four principles that should guide any considerations for creating senior related affordable housing. First, the studies indicate that developers, community organizations and planners must evaluate the immediate housing environment of their particular communities. In turn, the location of any new housing facility will depend on the specific needs of the target population and community. Third, a housing facility’s resident population should determine the services provided at the housing complex. Finally, local jurisdictions, community organizations and developers must find creative solutions to financing affordable housing for its citizens. These basic principles provide a framework for addressing the housing needs of the elderly.
25 Donna Kimura,. “Reader’s Choice Awards: Urban Finalist-Development Brings Together Housing, Public Library” Affordable Housing Finance http://www.housingfinance.com/ahf/articles/2007/aug/MISSION-CREEK0807.htm; Internet; accessed 4 November 2007. 26 Donna Kimura. 27 “Supportive Housing Search, California State” National Equity Fund, Mission Creek Senior Apartments project profile: www.nefinc.org/nefweb07/projects/profiles/missioncreek.pdf; Internet; accessed 4 November 2007. 28 “Supportive Housing Search, California State” National Equity Fund, Mission Creek Senior Apartments project profile: www.nefinc.org/nefweb07/projects/profiles/missioncreek.pdf; Internet; accessed 4 November 2007.

Planning for Senior Population Growth in Prince George’s County
11
Figure 1: Affordable Housing for Seniors – Case Study Summary
Name of Complex
Financing Amenities Best Practices
Faison Mews
LIHTC, HOME, grants and loans
Rooms are disabled accessible
24 controlled access Residents pay
percentage of median income for rent
Access to public transit in close proximity
Multiple financing sources, including LIHTC, federal/state grants
Partnerships between community organizations
Use of vacant, blighted property to revitalize community as well as serve a purpose for senior housing
Rooms disabled accessible
Washington School Apartments
HOME, LIHTC, reduced, fees from principal workers, housing authority waived its fee
Controlled access to building
Residents pay percentage of income, certain utilities included in rent
Near central commercial district
Local housing authority waived its development fees
Principal workers reduced their fees Mixture of financing sources Use of historic, vacant property
Mission Creek Senior Community
CDBG, State grants, LIHTC, local government for library funding
Mixed use facility contains library and retail uses as well as residential
Health clinic located in facility
Rent based on percentage of income
Mixed use facility Health center caters to residents and
community Partnership with local organization to
provide services to community
Conclusion of Background Information There is increasing concern that the federal, state and local government’s response to the housing needs of the aging is inadequate. In part, the issue is that the senior housing environment is more than bricks and mortar; it must also include a consideration of social services and transportation. This is aptly summarized by AARP’s definition of a livable community. Specifically, a livable community must have “affordable and appropriate housing, supportive community features and services, and adequate mobility options, which together facilitate personal independence and the engagement of residents in civic and social life.”29
29 AARP Public Policy Institute, p. 16.
Planning for Senior Population Growth in Prince George’s County
12
This definition holds significant implications for the provision of senior affordable housing, not only for the physical home (i.e. bricks and mortar) but also for the availability of community based social services and adequate modes of transportation to ensure that seniors are able to live comfortably in their own homes and participate as active members in their respective communities. In many of today’s senior communities, however, there is a mismatch between locations of affordable housing and the vital support services and resources needed to assist residents who wish to age in place. This mismatch is of utmost importance to the County, as it has tried to address the needs of its own aging population through the allocation of limited CDBG and HOME funds.

Planning for Senior Population Growth in Prince George’s County
13
III: METHODOLOGY The Study Area: General Overview The focus of this study is Prince George’s County, an older suburban community in the state of Maryland. The County is part of the Washington Metropolitan region, with the District of Columbia and Virginia to its south, and the neighboring Maryland community of Montgomery County to the north. This report will only discuss the three jurisdictions of Washington, D.C., Montgomery County and Prince George’s County. According to 2006 American Community Survey (ACS), Prince George’s County’s total population was 841,315, larger than that of Washington, D.C. (581,530), but less than Montgomery County (932,131).30 Over the past fifteen years, significant population shifts have changed the racial composition of Prince George’s County, while not significantly increasing its total population. Figure 2: Prince George’s Demographic Changes – 1990 to 2000
1990 2000 2006 Total Population 841,315 801,515 841,315
% African American 51% 63% 64% % White 43% 27% 23%
% Hispanic 4% 7% 12% % Seniors 6.8% 7.7% 8.6%
By 2030, the regional population31 is projected to increase by 14.1 percent, from a total of 2,246,915 in 2000, to 2,563,61432. The region’s seniors are expected to grow 88.9 percent between 2000 and 2030, from 229,360 to 433,153. Prince George’s County itself is expected to see an increase in total population of 22.92 percent between 2000 to 2030. Using the projection methods developed for this study, the senior population in Prince George’s County is projected to increase 180.5 percent, from 61,815 in 2000 to 173,395 by 2030. Prince George’s County’s growth, along with that of its neighboring jurisdictions, will create the need for even more affordable housing in the coming years, especially for seniors.33
30 U.S. Census; www.census.gov 31 Prince George’s County, Montgomery County, and Washington, D.C. 32 See Appendix D for a description of the projection method. 33 See Appendix C for a more complete table listing different demographic changes from 2000 to 2006.

Planning for Senior Population Growth in Prince George’s County
14
Data Collection The research for this report focused on Prince George’s County and was crafted to meet the following objectives:
• Identify the spatial distribution of seniors relying on a “hot spot” analysis of the
County’s current and future senior populations • Identify the spatial distribution of the 37 housing complexes which comprise the
County’s affordable senior multifamily housing stock • Assess the housing environment of the County’s 37 affordable senior complexes
relying on a spatial analysis of the physical and social support environments surrounding them complemented with phone and in-person interviews with senior facility staff.
Specifically, the report will present the spatial distribution of the County’s senior population projections, senior population density (elders per square mile), specific demographic characteristics of the elder population, as well as the locations of social services and transit stops, and street patterns. This analysis and evaluation of the senior population provides the basis for assessing the spatial mismatch between elders and affordable housing environments. In this light, this report will address the question: “What is the current and future state of the housing environment for low-income seniors in Prince George’s County?” Measures Used Measuring Future Population To provide a context for understanding the trends in Prince George’s County, the population trends for the District and Montgomery County are reviewed as well. The analysis uses both 2000 population data from the U.S. Census, and 2006 data from the American Community Survey. Based on population data from the 2000 census, and employing a modified cohort analysis approach, a set of projections for the elder (65 years and over) population was developed over the next three decennial periods for all three jurisdictions. Projections were developed for both a census tract and block group level to better understand the spatial shifts in the aging population within Prince George’s County. Clearly, there is no single way to develop accurate and precise projections on a sub-area basis that go well into the future—in this case, 2030. However, the purpose of these projections is to show general spatial trends in the aging population, i.e. where will concentrations of elderly be in the future. The purpose is not to provide reliable counts of the elderly in the future. Nonetheless, the analysis does provide some context for the estimates by giving a range of population projections (high to low), which reflect different assumptions about future growth in the region. In any case, it is hoped that the analyses contained in this report will at the minimum provide a valid methodology that can be redone with more accurate and timely data in the future. Certainly in the near

Planning for Senior Population Growth in Prince George’s County
15
future, by 2010, the new Census will allow officials and organizations to more precisely measure the numbers and needs of Prince George’s County’s low-income seniors. Measuring the Senior Housing Environment Three characteristics were used to measure the senior housing environment. They included social services, transportation access and connectivity. Social services are critical to the quality of life for seniors. To this end, the analysis relied heavily on field research tools and secondary data collection to develop a picture of the environment surrounding the County’s 37 senior affordable housing complexes. The main component of the field research involved visits to the 37 complexes to conduct on-site assessments of their physical and social support environments. At each site, team members gathered general information about rental rates, transportation, safety, and community services. To gain this information, team members interviewed property managers using a Housing Facility Survey (see Appendix E for this survey). In addition, team members took a series of photographs at these senior housing complexes to document their physical appearances. To aid in this activity, a photograph checklist was designed and detailed with specific areas to be photographed (see Appendix E for photograph checklist and Appendix L for the photo inventory itself). To complement this primary data, the team identified services surrounding each of the 37 complexes. Duany & Plater-Zyberk have suggested that most people are willing to walk within a 1/4-mile street network34. Other evidence suggests that a 1-mile buffer would be appropriate for identifying services that are accessible to the elderly through other modes of transportation, say for example, bicycling. As such, the 1/4-mile buffer would encompass those services that would be within walking distance for the senior, while the 1-mile buffer would include those services accessible by other means. For each of the 37 complexes, a 1-mile circular buffer was created to define the social service environment of the individual. Specifically, using data obtained from PGAtlas35, a web-based GIS provided by the Maryland-National Capital Park and Planning Commission, the team counted all services within each of the two buffers36. To provide a measure of accessibility to these services, maps for all public transit, i.e. Metro bus and rail routes surrounding the 37 senior housing complexes were obtained, and the total number of Metro bus and rail stops within a 1-mile buffer was determined. Based on these data, an index was developed representing the total count of services and transit stops within a 1-mile radius of each senior housing complex. It provides one perspective of the social support environment which surrounds each of the 37 complexes. Clearly, this measure is subject to several caveats. There is no clear indication whether services within the study area are affordable for the elderly, or in fact accessible by public transportation. Further, the accessibility of nearby services may be affected by high-
34 Andres Duany and Elizabeth Plater-Zyberk,. “The Second Coming of the American Small Town” Plan Canada: May 1992, 6–13. 35 “Welcome to the Prince George’s County GIS” Maryland-National Capital Park and Planning Commission, http://www.pgatlas.com/mncppc/default.aspx; Internet; accessed November 2007. 36 See Figure 27 on Page 37 for this list and see Appendix J for images of each complex.

Planning for Senior Population Growth in Prince George’s County
16
volume traffic in and around residential streets, as well as poor condition of roads and sidewalks. Nonetheless, this index does provide an initial strategy for public agencies to assess the environment surrounding bricks and mortar for the elderly. Connectivity is one measure that summarizes the physical layout of the network of streets that make up a neighborhood and consequently its walkability. A grid network is in many cases offered as a street pattern which promotes walkability, characterized by its relatively small blocks, and short travel distances between origin and destination. The more curvilinear and cul-de-sac streets a neighborhood has, the worse its overall connectivity. This kind of street pattern can lead to very large blocks, long travel distances between origin and destination, and a street arrangement that may discourage walking and biking. In most cases, a grid network is preferred over those with winding roads and cul-de-sacs. As applied to seniors, connectivity is a measure of the potential accessibility of one’s own environment. In this sense, areas with high connectivity suggest that seniors are able to navigate their environments, and community services are also accessible.
Figure 3: Examples of Connectivity
(Source: Hannah Twaddell, 200537)
37 Hannah Twaddell, “Forward Motion: Making the Connection”, Planning Commisioners Journal, Spring 2005 No. 53. http://www.plannersweb.com/216free.pdf; Internet; accessed November 2007.
Planning for Senior Population Growth in Prince George’s County
17
IV: RESULTS
This section summarizes the results from a spatial analysis of seniors in Prince George’sCounty. The analysis relies on both data from the U.S. Census 2000, as well as 2006 ACSdata. All the maps used in this report, along with others not presented here, are includedin Appendix K on the accompanying compact disc.
Regional Perspective
Initially, the analysis focuses on Washington, D.C., Montgomery County and PrinceGeorge’s County, providing a tri-jurisdictional or regional perspective on the currentlocation of seniors in the area.
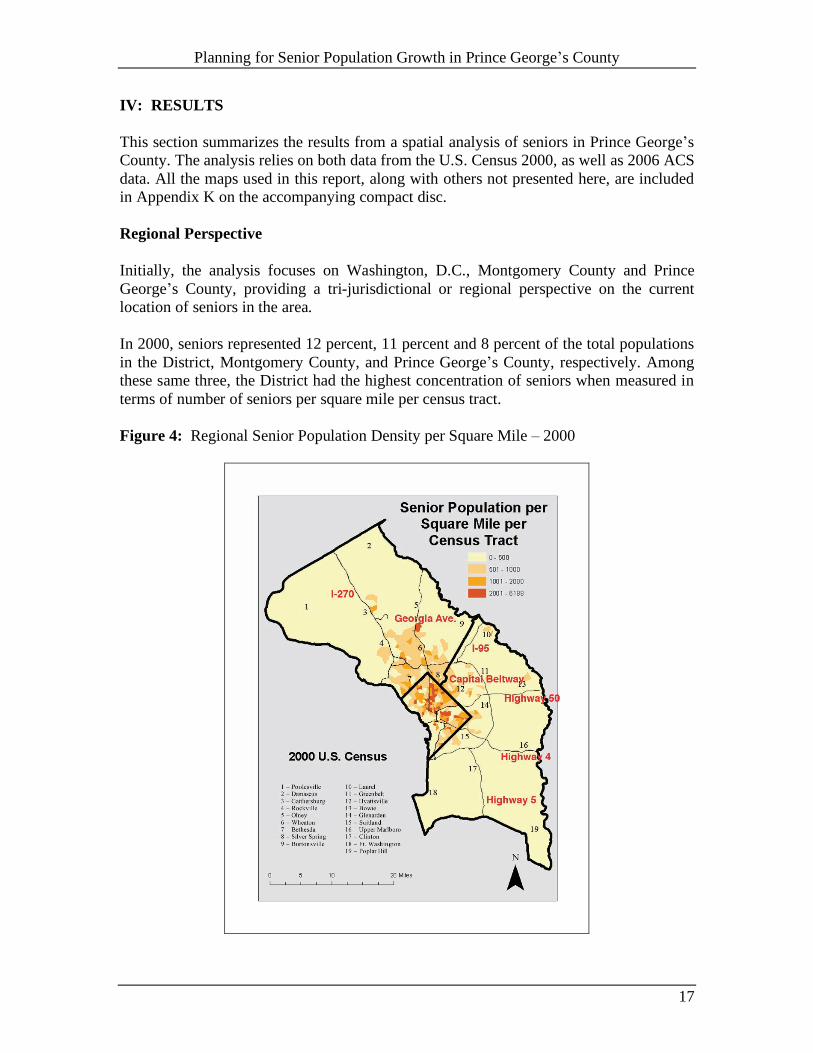
In 2000, seniors represented 12 percent, 11 percent and 8 percent of the total populationsin the District, Montgomery County, and Prince George’s County, respectively. Amongthese same three, the District had the highest concentration of seniors when measured interms of number of seniors per square mile per census tract.
Figure 4: Regional Senior Population Density per Square Mile – 2000

Planning for Senior Population Growth in Prince George’s County
18
Figure 4 above shows the spatial distribution of senior density (seniors per square mile per census tract) across the three jurisdictions. The jurisdictions are outlined with Montgomery County to the north, Prince George’s County to the South, and the smaller District of Columbia situated between the two. The lighter lines represent major thoroughfares in the region. To provide additional points of reference, the general locations of several municipalities are also identified. Thus, the number 12 on the map represents the area in and around the municipality of Hyattsville, MD; the number 14 includes the area surrounding the town of Glenarden, MD, while the number 15 represents the area around Suitland, MD. In the remainder of this report, the broader area comprising areas 12, 14, and 15 will be referred to as the Inner Beltway (a major thoroughfare in the County). The map suggests that the senior population density in Prince George’s County is moderate, revealing a few tracts adjacent to the District (areas 12, 14 and 15) with densities in the highest class. Moderate density levels are seen in Laurel (area 10) and Bowie (area 13). With respect to Montgomery County, it would appear that seniors are concentrated in the south central area, with the highest density around Wheaton (6), the area south of Rockville (4), and the area adjacent to the District border or Bethesda (7). In 2000, the District of Columbia had the most census tracts with highest senior densities. Specifically, the north central and northeastern areas of the District had the highest number of tracts with the highest densities. Figure 5: Percentage Growth in Total Population Compared to Growth of Senior Population – 2000 to 2006
Planning for Senior Population Growth in Prince George’s County
19
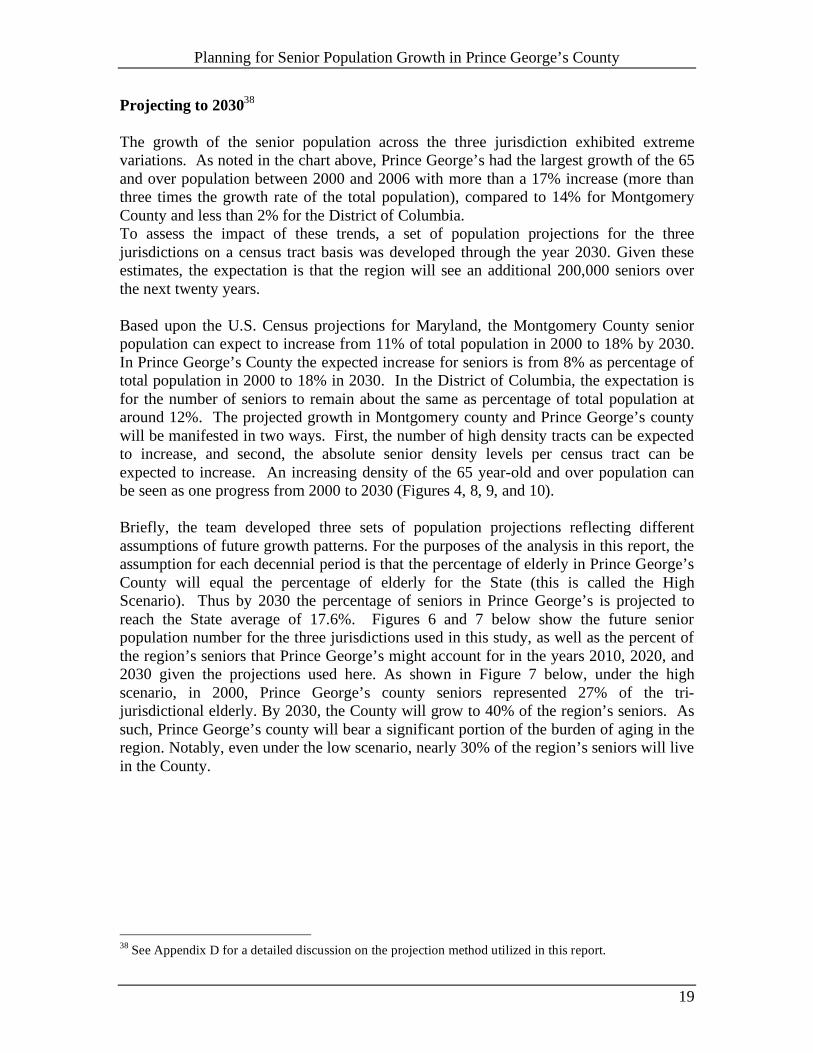
Projecting to 203038 The growth of the senior population across the three jurisdiction exhibited extreme variations. As noted in the chart above, Prince George’s had the largest growth of the 65 and over population between 2000 and 2006 with more than a 17% increase (more than three times the growth rate of the total population), compared to 14% for Montgomery County and less than 2% for the District of Columbia. To assess the impact of these trends, a set of population projections for the three jurisdictions on a census tract basis was developed through the year 2030. Given these estimates, the expectation is that the region will see an additional 200,000 seniors over the next twenty years. Based upon the U.S. Census projections for Maryland, the Montgomery County senior population can expect to increase from 11% of total population in 2000 to 18% by 2030. In Prince George’s County the expected increase for seniors is from 8% as percentage of total population in 2000 to 18% in 2030. In the District of Columbia, the expectation is for the number of seniors to remain about the same as percentage of total population at around 12%. The projected growth in Montgomery county and Prince George’s county will be manifested in two ways. First, the number of high density tracts can be expected to increase, and second, the absolute senior density levels per census tract can be expected to increase. An increasing density of the 65 year-old and over population can be seen as one progress from 2000 to 2030 (Figures 4, 8, 9, and 10). Briefly, the team developed three sets of population projections reflecting different assumptions of future growth patterns. For the purposes of the analysis in this report, the assumption for each decennial period is that the percentage of elderly in Prince George’s County will equal the percentage of elderly for the State (this is called the High Scenario). Thus by 2030 the percentage of seniors in Prince George’s is projected to reach the State average of 17.6%. Figures 6 and 7 below show the future senior population number for the three jurisdictions used in this study, as well as the percent of the region’s seniors that Prince George’s might account for in the years 2010, 2020, and 2030 given the projections used here. As shown in Figure 7 below, under the high scenario, in 2000, Prince George’s county seniors represented 27% of the tri-jurisdictional elderly. By 2030, the County will grow to 40% of the region’s seniors. As such, Prince George’s county will bear a significant portion of the burden of aging in the region. Notably, even under the low scenario, nearly 30% of the region’s seniors will live in the County.
38 See Appendix D for a detailed discussion on the projection method utilized in this report.

Planning for Senior Population Growth in Prince George’s County
20
Figure 6: Regional Population Projections – 2000 to 2030
Prince George’s Montgomery D.C. 2000 61,815 97,457 70,088 2010 105,506 120,780 61,036 2020 134,475 159,208 61,535 2030 173,395 201,520 58,238
Figure 7: Prince George’s Seniors as Percentage of Regional Seniors – 2000 to 2030
Low Scenario Medium Scenario High Scenario 2000 27% 27% 27% 2010 30% 33% 37% 2020 29% 33% 38% 2030 29% 34% 40%
With the growth of the senior population the expectation per tract is that the densities will increase over time. To demonstrate the increase in densities, the range of each class in the legend have been held constant over time. That is to say, that for the three periods, 2010, 2020, and 2030, the team categorized the tracts with the same classes; (1) less than 500; (2) 501 to 1000; (3) 1001 to 2000; and (4) 2001 or more seniors per square mile per census tract. A visual inspection of the Figures 8, 9, and 10 below shows the spread in the number of tracts with moderate (1001 to 2000 seniors per square mile) to high (2001 or more) densities of seniors though it would appear there are only a few areas, which will move into the highest density class. In Prince George’s County the spread is apparent, both inside and outside the Beltway.

Planning for Senior Population Growth in Prince George’s County
21
Figures 8, 9, and 10: Regional Senior Population - Density per Square Mile – Projection2010 to 2030
Planning for Senior Population Growth in Prince George’s County
22
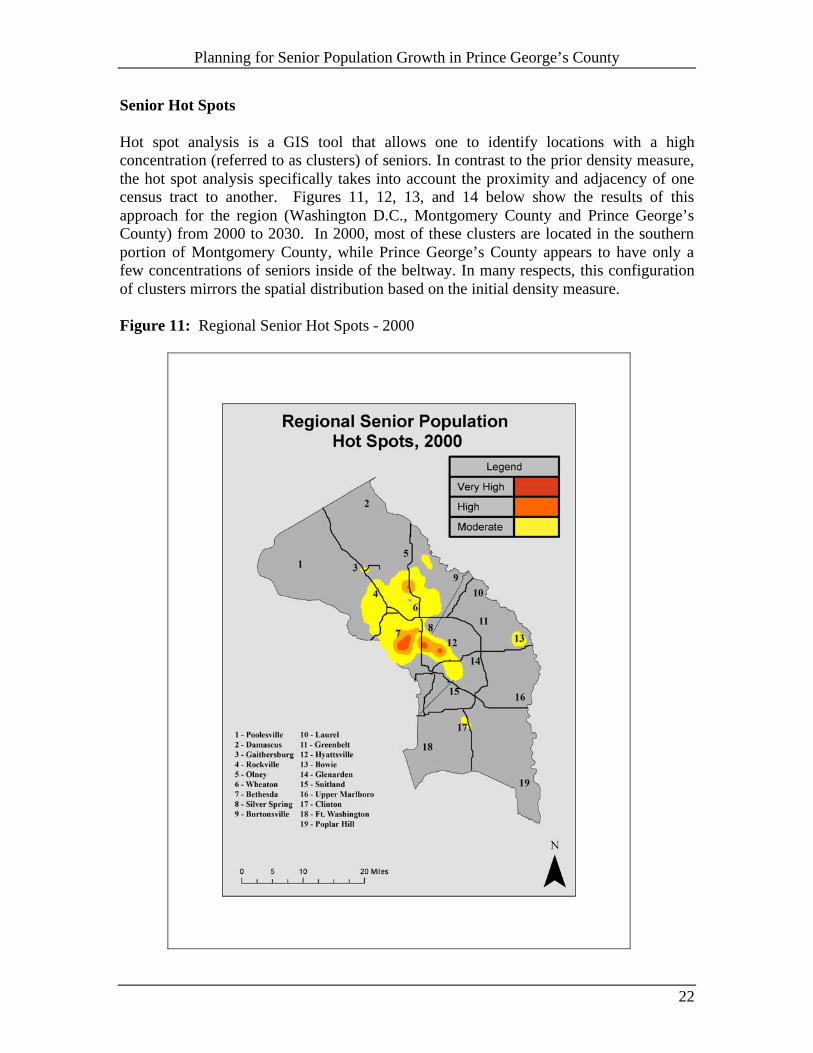
Senior Hot Spots Hot spot analysis is a GIS tool that allows one to identify locations with a high concentration (referred to as clusters) of seniors. In contrast to the prior density measure, the hot spot analysis specifically takes into account the proximity and adjacency of one census tract to another. Figures 11, 12, 13, and 14 below show the results of this approach for the region (Washington D.C., Montgomery County and Prince George’s County) from 2000 to 2030. In 2000, most of these clusters are located in the southern portion of Montgomery County, while Prince George’s County appears to have only a few concentrations of seniors inside of the beltway. In many respects, this configuration of clusters mirrors the spatial distribution based on the initial density measure. Figure 11: Regional Senior Hot Spots - 2000

Planning for Senior Population Growth in Prince George’s County
23
Figures 12, 13, and 14: Regional Senior Hot Spot Analysis – 2010 to 2030

Planning for Senior Population Growth in Prince George’s County
24
The hot spot projections confirm the spread of elderly throughout the region. Consistent with the density analysis, clusters of Prince George’s County elderly were located inside the Beltway as well as one cluster in Laurel. Prince George’s County Perspective To provide a more detailed view of the location of the elderly in the County, the focus of the analysis now changes from the census tract to the census block group and from region to Prince George’s County. Based on seniors per square mile per census block group, there do not appear to be a great number of high concentrations of seniors in 2000. There are only ten block groups in the County that are high-density (more than 1,426 seniors per square mile)39. Most of the areas that do have a higher than average density in 2000 are located inside or adjacent to the Capital Beltway in and around areas of Hyattsville, Glenarden and Suitland. Notably, areas around Laurel, Bowie, and Clinton also showed relatively high concentrations of seniors. The following three maps show the senior population in Prince George’s County in the year 2000. The first shows the spatial distribution of senior density per square mile and per block group. The second and third add the 37 senior affordable housing complexes used in this study as well as the Councilmanic Districts. As noted above there are ten block groups in the highest density class. The average density of seniors per square mile in these block groups (more than 2000 seniors per square mile) is roughly seventeen times the County average (approximately 120 seniors per square mile).
39 See Appendix G for details of these ten block groups.

Planning for Senior Population Growth in Prince George’s County
25
Figure 15: Prince George’s County – Senior Population Density per Square Mile – 2000

Planning for Senior Population Growth in Prince George’s County
26
Figure 16: Senior Population Density with Senior Affordable Housing Complexes – 2000

Planning for Senior Population Growth in Prince George’s County
27
Figure 17: Senior Population Density - Senior Affordable Complexes and Councilmanic Districts – 2000

Planning for Senior Population Growth in Prince George’s County
28
Included here is a detail map of the area of Prince George’s that contains all ten of the highest density block groups for seniors in 2000. The area outlined with the circle in this map in shown in even greater detail on the following page. Figure 18: Detail of Prince George’s Senior Density - 2000
Planning for Senior Population Growth in Prince George’s County
29
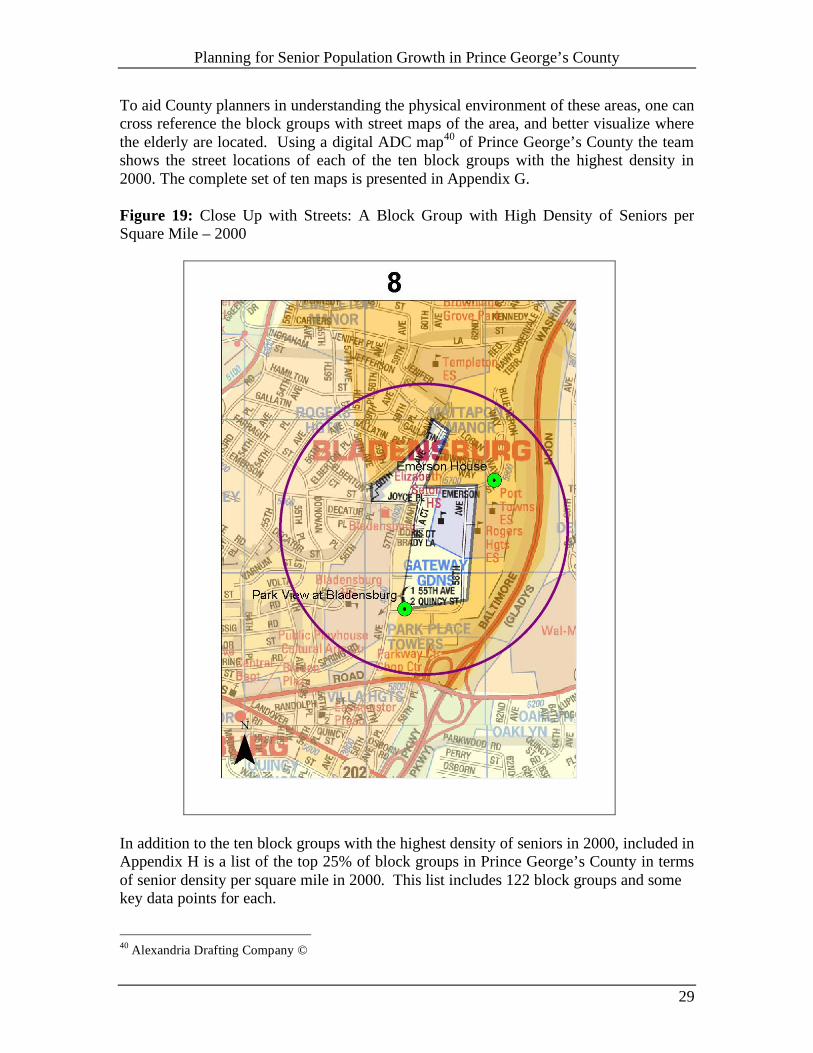
To aid County planners in understanding the physical environment of these areas, one can cross reference the block groups with street maps of the area, and better visualize where the elderly are located. Using a digital ADC map40 of Prince George’s County the team shows the street locations of each of the ten block groups with the highest density in 2000. The complete set of ten maps is presented in Appendix G. Figure 19: Close Up with Streets: A Block Group with High Density of Seniors per Square Mile – 2000
In addition to the ten block groups with the highest density of seniors in 2000, included in Appendix H is a list of the top 25% of block groups in Prince George’s County in terms of senior density per square mile in 2000. This list includes 122 block groups and some key data points for each.
40 Alexandria Drafting Company ©

Planning for Senior Population Growth in Prince George’s County
30
Prince George’s Senior Housing Complexes A review of Figure 16 shows that 70% of the study’s 37 existing affordable senior housing complexes are located within or very near to the Beltway. These 70% of complexes account for 66% of the affordable senior housing units provided by the 37 complexes. Figure 20 below summarizes the percentage of total senior complexes and affordable units in and around the Beltway. Clearly, outside the Beltway, there is dearth of senior complexes. Figure 20: Percentage of Total Senior Complexes and Affordable Units in or near Beltway
Figure 21: Percentage of Area, Population, and Seniors Inside and Outside of Capital Beltway - 2000 % of Land
Area % of Total Population
% of Seniors Density of Seniors (per square mile)
Inside Beltway 15.58 48.94 47.36 363.3 Outside Beltway 84.42 51.06 52.64 74.5 Total n/a n/a n/a 119.5 As can be seen above in Figure 21, in 2000 nearly half of all seniors lived within the Beltway even though this area only accounts for 15.58% of the total land area in the County. The density of seniors per square mile inside the Beltway is nearly five times as high as the density outside of the Beltway. Going out to 2030, the percentage of the senior population that is expected to live within the Beltway is projected to increase to 53.68%.
# of Complexes
Percentage
# of Units
Percentage
Inside Beltway 21 57% 2352 53%
Outside Beltway 16 43% 2068 47%
Inside or Close to Beltway
26
70%
2908
66%

Planning for Senior Population Growth in Prince George’s County
31
Relative Percentage of Senior Concentrations An alternative measure of concentration to seniors per square mile per block group is percentage of seniors relative to the total population per block group. In contrast, to a purely spatial measure based on total area the percentage of a block group’s population who are elderly, provide an alternative view as to where seniors are located. Figure 22 shows that block groups where the elderly make up a relative largely percentage of its population are scattered throughout the county and not necessarily concentrated inside the Beltway. Figure 22: Prince George’s County – Senior Population as Percent of Block Group Population - 2000

Planning for Senior Population Growth in Prince George’s County
32
Senior Clusters A hot spot analysis identifies clusters or groups of block groups with significant concentrations of seniors. In 2000, several senior hot spots (light and dark orange) were found across the County as seen in Figure 23. They appear in the northwest near Langley Park, in northeast around Bowie and in the southwest of the county near Clinton and Fort Washington. Notably, the hotspot analysis provides a different perspective of the relationship between concentrations of the elderly and the location of the 37 complexes. There does not appear to be a match between those complexes located in the central part of the County and the senior hot spots. Figure 23: Prince George’s County - Senior Hot Spots – 2000
Planning for Senior Population Growth in Prince George’s County
33
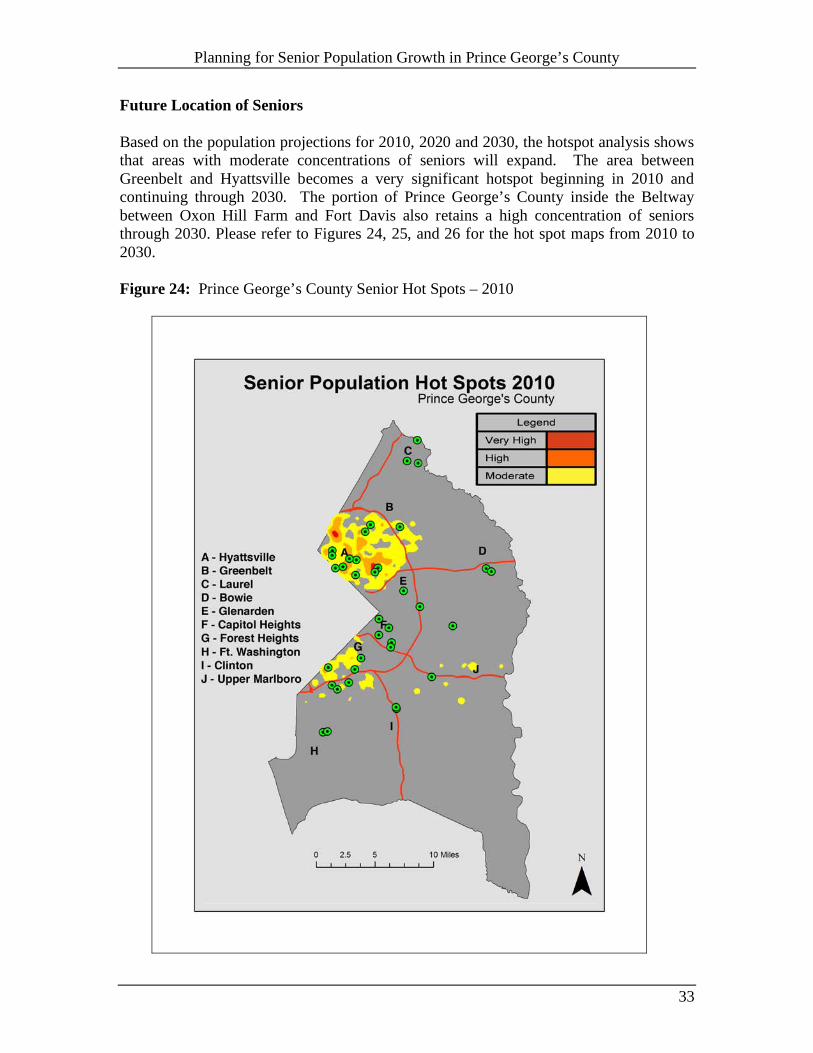
Future Location of Seniors Based on the population projections for 2010, 2020 and 2030, the hotspot analysis shows that areas with moderate concentrations of seniors will expand. The area between Greenbelt and Hyattsville becomes a very significant hotspot beginning in 2010 and continuing through 2030. The portion of Prince George’s County inside the Beltway between Oxon Hill Farm and Fort Davis also retains a high concentration of seniors through 2030. Please refer to Figures 24, 25, and 26 for the hot spot maps from 2010 to 2030. Figure 24: Prince George’s County Senior Hot Spots – 2010

Planning for Senior Population Growth in Prince George’s County
34
Figure 25: Prince George’s County Senior Hot Spots – 2020

Planning for Senior Population Growth in Prince George’s County
35
Figure 26: Prince George’s County Senior Hot Spots - 2030

Planning for Senior Population Growth in Prince George’s County
36
The hot spot analysis shows that the clustering of seniors will be in flux as one progress toward 2030. The maps show hot spots both inside and outside the Beltway. However, the key finding is that the projections clearly show that the communities inside the Beltway are likely to contain the largest concentrations of seniors in the future. Therefore these projections indicate that the County government will need to find policy solutions to address the housing needs for the increased future populations for the elderly in this part of the county.
Services and Amenities Available for Seniors To assess whether basic services and amenities are available for senior populations living in the 37 complexes, community services were identified within a 1-mile radius of each complex. These services included: religious institutions, metro and county bus stops, shopping centers, hospitals, community centers, and parks and were based on information provided by the County. Presumably, the greater number of amenities, the greater the level of social support and consequently, the better the senior population will be served. Figure 27 on the next page provides the total count of services for each of the 37 complexes.

Planning for Senior Population Growth in Prince George’s County
37
Figure 27: Services within 1-mile Radius of Existing Affordable Senior Housing Complexes
Name Total Religious Institutions Library Bank Post
Office Nursing Home
Assisted Living Hospital Park Community
Center Shopping Center
Grocery Store Pharmacy
Friendship Arms 38 33 0 0 0 1 1 0 Y 1 1 1 0
Cottage City 36 30 0 0 1 0 0 0 Y 2 3 0 0
Independence Court 33 19 0 1 0 1 1 0 Y 1 6 0 0
Rainier Manor 32 18 0 2 0 2 0 0 Y 1 5 1 0
Council House 26 18 0 0 1 0 0 0 Y 1 5 0 0
Emerson House 26 16 0 0 0 0 1 0 Y 1 7 0 0
Gateway Village 26 24 0 0 0 0 0 0 Y 0 2 1 0 Manor at Victoria Park 26 20 0 0 1 0 0 0 Y 2 2 0 0
Marlborough Towne 23 17 0 0 0 0 0 0 Y 1 3 1 0 Park View at Bladensburg 23 16 0 0 0 0 1 1 Y 0 4 1 0
Cheval Court 22 15 0 0 1 0 1 0 Y 0 5 2 0 Mrs. Philippines House 22 11 1 3 0 0 0 0 Y 1 3 2 0
Chillum Oaks 21 14 0 0 0 1 0 0 Y 1 5 0 0
Rolling Crest Village 21 13 0 0 0 2 0 0 Y 1 5 0 0
Selborne House 20 14 0 2 0 0 0 0 N 0 3 1 0
Victory Housing 19 13 0 0 0 0 0 0 Y 1 4 4 0
Branchwood 17 13 0 0 0 0 0 0 Y 0 3 0 0
Windsor Crossing 17 10 0 0 1 0 1 0 Y 0 5 2 0
Clinton Manor 16 12 0 0 0 0 0 0 Y 0 3 1 0 Laurel Lakes Apartments 16 8 0 1 0 0 0 0 Y 0 5 2 0
Attick Towers 15 11 0 0 0 0 0 0 Y 1 2 0 0
Spellman House 15 11 0 0 0 0 0 0 Y 1 2 2 1 Woodside Village 1 & 2 15 8 1 2 0 0 0 0 Y 1 2 0 0 Fort Washington Adventist 12 7 0 1 0 0 0 0 Y 1 1 0 0
Fort Washington 12 7 0 0 0 0 0 0 Y 1 2 1 0
Greenridge House 10 5 1 0 1 0 0 0 N 0 2 4 0
Park View at Laurel 10 8 0 0 0 0 0 0 Y 1 1 0 0
Avondale Park 8 3 0 0 0 0 0 0 Y 0 5 1 0
Owens Road 8 5 0 0 0 0 0 0 Y 1 2 1 0 St. Paul Senior Living 1 & 2 8 7 0 0 0 0 0 0 Y 0 1 0 0
Trinity Terrace 7 5 0 0 0 0 0 0 Y 0 2 0 0 Vistas at Lake Largo 7 5 0 0 0 0 0 0 Y 0 2 1 0
Pin Oak 7 3 0 1 0 0 0 0 Y 0 3 0 0
Bowie Commons 4 1 0 1 0 0 0 1 Y 0 1 0 0 Marwood Senior Apartments 3 3 0 0 0 0 0 0 Y 0 0 0 1
Largo Landing 1 1 0 0 0 0 0 0 Y 0 0 0 0

Planning for Senior Population Growth in Prince George’s County
38
Figures 28 and 29 below provide examples of senior complexes (in these examples, Friendship Arms and Largo Landing) with the best and worse levels services and amenities for seniors. Please see Appendix J on the accompanying compact disc for similar images of each Senior Complex. Figures 28 and 29: Services within 1-Mile Radius of Existing Affordable Senior Housing Complexes – Best and Worst Cases

Planning for Senior Population Growth in Prince George’s County
39
Connectivity Results There are several measures for connectivity. One such measure is the Link-Node Ratio, which is an index of the total number of links divided by the total number of nodes in a defined area. In this case, the higher the number, the greater connectivity. In this study, with limited of data and time, the team adopted this Link-Node Ratio as the quantitative measure of senior housing neighborhood connectivity. As the illustration shows, links are defined as the street segments between two nodes and the nodes are the intersections and the ends of each cul-de-sac. A perfect grid street network system can achieve a ratio of 2.5, most experts agree that a good street network should have a Link-Node ratio above 1.4.41 Figure 30: Connectivity Link-Node Ratio Examples
(Source: Jennifer Dill, 200442) The purpose of this connectivity measure is to provide a quantitative analysis of the connectivity in the neighborhoods surrounding each of the existing affordable senior housing in Prince George’s County. This index is one measure that at least partially captures whether senior complex neighborhoods encourage walking or not. Within a 1/4-mile buffer, senior complexes having a high connectivity index indicate that people have multiple choices from a particular origin to a destination. Items not included in this connectivity measure that may encourage pedestrian activity are things such as well-marked and safe crossings, crossings that directly access shopping centers or other services (as opposed to crosswalks being at the end of the block).
41 Reid Ewing, Best Development Practices: Doing the Right Thing and Making Money at the Same Time, American Planning Association, (Chicago, IL 1996). 42 Jennifer Dill (2004) Measuring Network Connectivity for Bicycling and Walking, http://www.enhancements.org/download/trb/trb2004/TRB2004-001550.pdf

Planning for Senior Population Growth in Prince George’s County
40
Measuring Link-Node Ratio
Duany & Plater-Zyberk have suggested that most people are willing to walk within a 1/4-mile street network43. A buffer of a 1/4-mile was used for effective walking distance in addition to a 1-mile for bicycling and other modes of transportation providing access to services. The table below summarizes the connectivity measures for the 37 housing complexes. Note that due to their proximity, St. Paul Senior Living I and II have been combined in the following two tables. Figure 31: Connectivity Scores for .25-mile and 1-mile Buffers
NAME OF COMPLEX 1 Mile .25 Mile 1 Rainier Manor 1.44 1.04 2 Avondale Park 1.43 1.12 3 Cottage City Towers 1.41 1.08 4 Attick Towers 1.40 1.23 5 Independence Court 1.37 1.12 6 Friendship Arms 1.36 1.20 7 Gateway Village 1.35 1.08 8 Rollingcrest Village 1.34 0.97 9 Cheval Court Apartments 1.33 1.02 10 Park View at Bladensburg 1.30 0.79 11 Chillum Oaks Adventist 1.29 0.97 12 Spellman House Apartments 1.28 1.05 13 Selborne House 1.26 1.13 14 Emerson House 1.25 0.78 15 Owens Road 1.24 0.88 16 Windsor Crossing 1.22 1.14 17 Council House 1.21 1.03 18 Victory Housing 1.21 0.97 19 Laurel Lakes Apartments 1.19 1.04 20 Mrs. Philippines House 1.18 0.94 21 Manor at Victoria Park 1.14 0.94 22 Greenridge House 1.14 0.93 23 Woodside Village 1 & 2 1.13 1.00 24 Bowie Commons 1.13 0.95 25 Park View at Laurel 1.13 0.93 26 Marlborough Towne 1.13 0.79 27 Pin Oak Apartments 1.09 1.09
43 Andres Duany and Elizabeth Plater-Zyberk, 6-13 .

Planning for Senior Population Growth in Prince George’s County
41
28 Branchwood Towers 1.08 0.95 29 Vistas at Lake Largo 1.07 0.88 30 Fort Washington Manor 1.06 0.93 31 Clinton Manor 1.06 0.70 32 Fort Washington Adventist Apartments 1.04 0.88 33 Trinity Terrace 1.04 0.88 34 St. Paul Senior Living 1&2 1.03 0.89 35 Marwood Senior Apartments 0.97 0.94 36 Largo Landing 0.97 0.75 Average Score 1.20 0.97
The connectivity scores for 1/4-mile and 1-mile were also used as one part of a scoring system developed for this study that provides a relative measure of the transportation accessibility for the existing affordable senior apartments in Prince George’s County. In addition to the 1/4-mile and 1-mile connectivity scores, whether or not the center had access to public and private transportation was measured. These four measures were each give a rating of 1 to 5 (with 1 being the lowest and 5 being the highest) and then averaged to arrive at a combined score for each center. The higher numbers mean that the center had a greater number of transportation options and also had high connectivity scores. Figure 32: Senior Complex Transportation Accessibility
NAME OF COMPLEX COMBINED SCORE
1 Attick Towers 5.00 2 Independence Court 4.75 3 Gateway Village 4.50 4 Windors Crossing 4.25 5 Cheval Court 4.25 6 Selborne House 4.25 7 RollingCrest 4.25 8 Laurel Lakes Apartments 4.00 9 Pin Oak Apartments 1/2 4.00 10 Chillum Oaks Adventist 4.00 11 Victory Housing 4.00 12 Avondale Park 3.75 13 Cottage City Towers 3.75 14 Manor at Victoria Park 3.75 15 Woodside Village 1 & 2 3.75 16 Owens Road 3.75 17 Park View at Laurel 3.75 18 Bowie Commons 3.75 19 Friendship Arms 3.75

Planning for Senior Population Growth in Prince George’s County
42
20 Rainier Manor 3.50 21 Trinity Terrace 3.50 22 Fort Washington Adventist Apartments 3.50 23 Vistas at Lake Largo 3.50 24 St. Paul Senior Living (Phases I and II) 3.50 25 Clinton Manor 3.25 26 Spellman House 3.25 27 Marlborough Towne 3.25 28 Council House 3.00 29 Mrs. Philippines Home 3.00 30 Largo Landing 3.00 31 Park View at Bladensburg 2.75 32 Fort Washington Manor 2.75 33 Branchwood Towers 2.75 34 Greenridge House 2.75 35 Marwood 2.50 36 Emerson House 2.50 Average Score 3.60
The team’s initial analysis indicates that there are gaps in the service provision and access to Metro bus/Metro rail, Prince George’s County buses, and other modes of public transportation throughout the region that may make it difficult for seniors to take advantage of social services and resources which are located outside of their respective communities. A better integration of transportation services into the community fabric and also an increase in public transportation options may be one option that the County considers in the future.

Planning for Senior Population Growth in Prince George’s County
43
The Future Number of Units Needed to Accommodate Senior Population Growth Clearly, there are many different arrangements to house the elderly population. This report focuses on the 37 affordable senior complexes in the County, and as such does not address other rental alternatives, homeownership or assisted living arrangements. However, as one gross measure to exemplify the magnitude of the future need, the team calculated the ratio of the number of seniors in 2006 (72,637) to the number of affordable units in the 37 senior housing complexes (4420). As a result in 2006, there were 16.4 seniors for each senior affordable unit. Figure 33: Ratio of Seniors to Affordable Senior Housing Units – 2006
If the senior population were to grow at rate such that the County’s percent elderly in 2030 were to match the projected State average in 2030 (17.6%) the projected numbers of seniors would be 72,627. In order to maintain the 2006 ratio of 16.4, the County would need to build more than 6,000 new affordable senior housing units, as seen in Figures 34 and 35 below. In 2006, the average affordable senior complex had 120 units. Using this as a standard, the 6131 new units needed would be equivalent to building at least 2 new 120 units senior complexes every year through 2030. Notably, even if there were the assumption that a more stagnant growth of the County’s elderly population of 1 percent each decade (the Low Scenario), the County would still need to build 2028 senior units (or slightly less than one new 120-unit complex per year) to maintain the 2006 ratio of 16.4, which can be seen below in Figures 34 and 35. Though a monumental challenge, and disregarding the role of existing housing, the magnitude of the numbers such a reevaluation of how best to use County resources. For the purposes of this study, the team chose to examine the HOME Program and the Community Development Block Grant Program as possible resources to support housing initiatives for the elderly. Figure 34: Annual Number of New Affordable Units Needed to 2030
Total Number of New Units Needed
by 2030
Number of New Units Needed
Annually
Number of New Complexes of 120 Units
Needed Annually
Low Scenario
2028
88
0.74
High Scenario
6131
267
2.23
Total Number of Seniors in 2006
Existing Number of Units in 2006
Ratio of Total Seniors to Affordable Senior
Units 72,637
4420
16.43

Planning for Senior Population Growth in Prince George’s County
44
Figure 35: Estimates for Number of Future Affordable Senior Housing Units

Planning for Senior Population Growth in Prince George’s County
45
County Financing: Home Investment Partnership (HOME) Program and Community Development Block Grants Program (CDBG) HOME Investment Partnership Program-History and Purpose The Home Investment Partnership (HOME) Program was created in 1990 as part of the National Affordable Housing Act [Title II] of the Cranston-Gonzalez National Affordable Housing Act (Nov. 28, 1990)]. The main purpose of the HOME program is to facilitate the supply of “decent, safe, sanitary and affordable housing for low- and very low-income families.” In addition, the program aims to provide financial and technical assistance to states and local governments to develop affordable housing and to strengthen the partnership among the private sector and all levels of government.44 According to the United States Department of Housing and Urban Development (HUD) since 1990, over 450,000 affordable housing units have been acquired, constructed, or rehabilitated through the HOME program, and nearly 84,000 tenants have received direct rental assistance from this program.45
HOME Funds Allocation Process
In order to expand the supply of affordable housing, HUD provides HOME grants to states and local governments, referred to as participating jurisdictions or "PJs." More specifically, HOME funds are allocated according to a formula that considers the relative inadequacy of each jurisdiction's housing supply, degree of poverty, fiscal distress, and other factors. When HOME funds become available each year, HUD informs eligible jurisdictions and then earmarks money for them. To be eligible for HOME funds, PJs are required to have a current and approved consolidated plan containing an action plan detailing the ways in which they plan to use the funds. HOME Funds Eligibility
In order to efficiently allocate funding toward affordable housing for low-income families, HUD has detailed specific criteria for eligibility. When HOME funds are used to assist renters, HUD requires that at least 90 % of benefiting families must have incomes below 60% of the HUD – adjusted median income. For rental housing with five or more units, at least 20% of the units must be occupied by families with incomes below 50% of the HUD-adjusted area median income. In addition, when HOME funds are applied to current and potential homeowners, HUD mandates that household incomes may not exceed 80% of the area median income.
44 “HOME Investment Partnerships Program”, US Department of Housing and Community Development http://www.hud.gov/offices/cpd/affordablehousing/, Internet; accessedNovember 2007. 45 “HOME Investment Partnerships Program”, US Department of Housing and Community Development http://www.hud.gov/offices/cpd/affordablehousing/, Internet; accessedNovember 2007.

Planning for Senior Population Growth in Prince George’s County
46
HUD has also specified major eligible uses for HOME funds. As one possible use, HOME funds can help create affordable homeownership opportunities for low-income households. An example would be a grant or loan to cover the down payment on a new home. As another possible use, HOME funds can help low-income homeowners rehabilitate their homes. Participating Jurisdictions can use HOME funds to create more affordable rental opportunities for low-income tenants by directly working with developers to construct or rehabilitate rental housing. Finally, HOME funds could be used for tenant-based rental assistance, which enables low-income households to rent market rate units.46 HOME Funds Requirements
Participating Jurisdictions must meet certain special conditions in the allocation of HOME funds. First, they must match each dollar of dispersed HOME funds (not including administrative costs) with 25 cents from nonfederal sources, which encourages the use of local resources. Another condition is the “minimum affordable term” for HOME-funded housing units, in which case PJs must make sure that newly constructed housing facilities that are HOME-funded remain affordable for at least twenty years.
Prince George’s County HOME Fund Program Lead Agency
In Prince George’s County, the Division of Community Planning and Development (CPD) administers HOME funds. CPD distributes funds in accordance with the County’s Five Year Consolidated Plan for Housing and Community Development, and also in accordance with its Annual Action Plan.
Activity and Budget Overview for Fiscal Year 2008 According to Prince George’s County’s Annual Action Plan for FY 2008, 7% of all HOME funds are used for the Homeowner Rehabilitation Program. The Redevelopment Authority of Prince George’s County administers the Rental Housing Rehabilitation Program, which comprises 31% of total HOME funds for FY 2008. In addition to this, the County provides financial assistance to qualified Community Housing Development Organizations (CHDO)47 for the acquisition and rehabilitation of rental housing and other
46 U.S. Department of Housing and Community Development, 2007 47 In the Prince George’s County, these organizations are qualified CHDO (FY 2008 Prince George’s County Annual Action Plan p 47) ; Suitland Family life & Development Center, Housing Initiative Partnership, Inc. Greater Washington Urban League of Prince George’s County, Kairos Development Corporation, Seat Pleasant Community Development Corporation, Central Prince George’s Community Development Corporation, Omega Gold Development Group
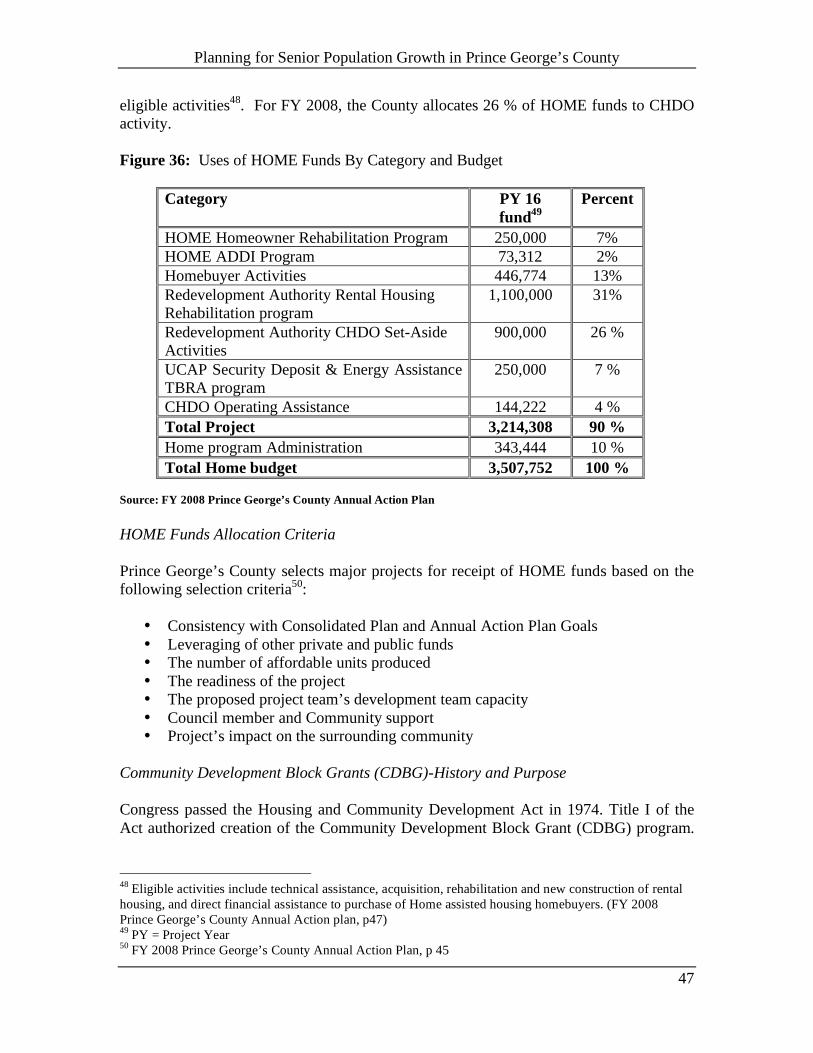
Planning for Senior Population Growth in Prince George’s County
47
eligible activities48. For FY 2008, the County allocates 26 % of HOME funds to CHDO activity.
Figure 36: Uses of HOME Funds By Category and Budget
Category PY 16 fund49
Percent
HOME Homeowner Rehabilitation Program 250,000 7% HOME ADDI Program 73,312 2% Homebuyer Activities 446,774 13% Redevelopment Authority Rental Housing Rehabilitation program
1,100,000 31%
Redevelopment Authority CHDO Set-Aside Activities
900,000 26 %
UCAP Security Deposit & Energy Assistance TBRA program
250,000 7 %
CHDO Operating Assistance 144,222 4 % Total Project 3,214,308 90 % Home program Administration 343,444 10 % Total Home budget 3,507,752 100 %
Source: FY 2008 Prince George’s County Annual Action Plan HOME Funds Allocation Criteria Prince George’s County selects major projects for receipt of HOME funds based on the following selection criteria50:
• Consistency with Consolidated Plan and Annual Action Plan Goals • Leveraging of other private and public funds • The number of affordable units produced • The readiness of the project • The proposed project team’s development team capacity • Council member and Community support • Project’s impact on the surrounding community
Community Development Block Grants (CDBG)-History and Purpose Congress passed the Housing and Community Development Act in 1974. Title I of the Act authorized creation of the Community Development Block Grant (CDBG) program.
48 Eligible activities include technical assistance, acquisition, rehabilitation and new construction of rental housing, and direct financial assistance to purchase of Home assisted housing homebuyers. (FY 2008 Prince George’s County Annual Action plan, p47) 49 PY = Project Year 50 FY 2008 Prince George’s County Annual Action Plan, p 45

Planning for Senior Population Growth in Prince George’s County
48
The CDBG program works to ensure decent affordable housing, to provide services to the most vulnerable, and to create jobs through the expansion and retention of businesses. In addition to the requirement that at least 70% of a CDBG allocation be for activities that benefit low-and moderate-income persons, CDBG regulations dictate that these activities must meet one of the national CDBG program objectives. They include: benefit low- and moderate-income persons, prevention or elimination of slums or blight, or address community development needs having a particular urgency because existing conditions pose a serious and immediate threat to the health or welfare of the community for which other funding is not available. In this light, HUD has designated the following activities as eligible for CDBG funding:
• Acquisition of real property • Relocation and demolition • Rehabilitation of residential and non-residential structures • Construction of public facilities and improvements, such as water and sewer
facilities, streets, neighborhood centers, and the conversion of school buildings for eligible purposes
• Public services, within certain limits • Activities relating to energy conservation and renewable energy resources • Assistance to profit-motivated businesses to carry out economic development and
job creation/retention activities HUD has designated the following activities as ineligible for CDBG funding:
• Acquisition, construction, or reconstruction of buildings for the general conduct of government
• Political activities • Certain income payments • Construction of new housing by units of general local government
Prince George’s County CDBG Program According to qualifications and requirements set by Prince George’s County municipalities, local government agencies and non-profit organizations are eligible to apply for CDBG funding. Applicants must ensure that at least 51% of the persons receiving services have low- and moderate-incomes, project beneficiaries must live in areas that have been determined low- and moderate-income communities, or the project must address a slum or blighted condition or meet an urgent need. Prince George’s County has identified the following activities as eligible to receive funding:
• Acquisition or disposition of real property • Clearance and/or demolition • Housing rehabilitation and preservation • Removal of architectural barriers to the handicapped • Public facilities improvements • Economic development • Job creation or retention • Public services

Planning for Senior Population Growth in Prince George’s County
49
Figure 37: Prince George’s County CDBG Allocation Process
Proposal application packets are available during the second week of October
Projects are implemented beginning July 1 of the fiscal year
Proposal Advisory Group appointed by the County Executive and the County Council
reviews proposals
County Executive makes recommendations to the County Council
County Council holds public hearings in April & adopts the Annual Action Plan by
early May
The County submits the adopted Annual Action Plan to HUD by May of each year

Planning for Senior Population Growth in Prince George’s County
50
Fiscal Year 2005 and Fiscal Year 2006 CDBG Allocations Prince George’s County allocated $5,958,620 in fiscal year 200551, with the majority of funding designated for housing projects and the smallest percentage of total funding designated for economic development projects. Housing expenditures, which represented 31.86% of all CDBG allocations, went to rehabilitation of single units and rehabilitation administration; no funds were designated for senior housing production. In Fiscal Year 2006, there was a significant increase in CDBG funding-nearly $4,000,00052 in additional monies. Allocations for economic development projects increased from .92% of total CDBG expenditures in FY 2005 to 17.85% in FY 2006. There was a slight decrease in CDBG allocations for housing with expenditures going to rehabilitation of single units and rehabilitation administration; following the trend from the previous year, no funds were designated for senior housing production. Figure 38: CDBG Allocations - Fiscal Years 2005-2006
Source: Prince George’s County 53
Source: Prince George’s County54
51 U.S. Dept of Housing and Community Development. (2005) Use of CDBG Funds by PRINCE GEORGE'S COUNTY, MD FROM 07/01/2004 TO 06/30/2005. 52 U.S. Department of Housing and Community Development. (2006) Use of CDBG Funds by PRINCE GEORGE'S COUNTY, MD FROM 07/01/2005 TO 06/30/2006. 53 Prince George’s County http://www.hud.gov/offices/cpd/communitydevelopment/budget/disbursementreports/md/05_PrinceGeorgesCountyMd.pdf; Internet; accessed November 2007.
Fiscal Year 2005 (7/1/2004 -6/30-2005) Expenditures: Acquisition $687,218 11.53% Economic Development $54,916 .92% Housing $2,098,412 35.22% Public Services $1,063,659 17.85% Public Improvements $837,202 14.05% Admin/Planning $1,217,211 20.43% Total $5,958,620
Fiscal Year 2006 (7/1/2005 -6/30-2006) Expenditures: Acquisition $64,705 .68% Economic Development $1,700,302 17.85% Housing $3,034,469 31.86% Public Services $1,083,088 11.37% Public Improvements $1,900,881 19.96% Admin/Planning $1,742,184 18.29% Total $9,525,633

Planning for Senior Population Growth in Prince George’s County
51
Figure 39: Prince George’s County CDBG Expenditures by Type - Fiscal Year 2005
17.85
14.05
20.43
11.53
0.92
35.22
Acquisition
Economic Development
Housing
Public Services
Public Improvements
Admin/Planning
Figure 40: Prince George’s County CDBG Expenditures by Type - Fiscal Year 2006
11.37
19.96
18.29
0.68
17.85
31.86
Acquisition
Economic Development
Housing
Public Services
Public Improvements
Admin/Planning
54 Prince George’s County http://www.hud.gov/offices/cpd/communitydevelopment/budget/disbursementreports/md/04_PrinceGeorgesCountyMd.pdf; Internet; accessed November 2007.
Planning for Senior Population Growth in Prince George’s County
52
Both funding programs HOME and CDBG provide financial mechanisms for Prince George’s County to address affordable housing in the county. Although each program has its distinct purposes and requirements the thrust of these programs is to provide local governments with a means for financing housing and social services for their residents. Prince George’s County can use a combination of HOME and CDBG funds to focus efforts on providing affordable housing options and much needed services for seniors across the county in the future.

Planning for Senior Population Growth in Prince George’s County
53
V: DISCUSSION OF RESULTS This study reports on the current and future state of the senior housing environment in Prince George’s County to determine whether mismatches exist between locations of the elderly, affordable senior housing, and social services and amenities. The research findings indicate that location plays an important role in understanding the senior housing situation in Prince George’s County. The analysis indicates that 70% of the affordable housing complexes are located in or very near to the Beltway and that the hot spots of seniors, going out to the year 2030, show that most of the areas expected to have high concentrations of seniors will also be located inside the Beltway. In addition, the total number of seniors is expected to increase dramatically by 2030. Higher land values and lack of available land inside the Beltway present obstacles to the construction of new senior housing complexes. The challenge for the County will be determining how to resolve spatial differences between seniors and the existing distribution of senior housing, while also promoting the development of additional housing. The projection method used in this report reveals that the senior population will expand over the coming decades. A review of the hot spot analyses shows that by the year 2030 there will be a significant clustering of seniors in Prince George’s County inside the Capital Beltway. The municipalities in this area should begin a more detailed evaluation of service support for an elder population. The data also show that the current supply of available affordable senior housing complexes must increase to maintain a balance as the population continues to grow. Federal funding for affordable housing is decreasing, but Prince George’s County does have available funds, through the HOME and CDBG programs, which can be used to support future affordable housing developments and senior services. However, an examination of current funding systems indicates that there are strategies that should be employed in order to promote and encourage the production of senior housing facilities. The allocating body for CDBG funds, in this case Prince George’s County, sets the funding priorities for the jurisdiction. Unfortunately, projects that produce and/or rehabilitate senior housing units are not explicitly stated as a top priority for receiving funding in the County. The situation is similar for the HOME program, although funding is available for senior housing, it is unclear if this funding is used for senior housing production. With its limited resources, the County will need to find creative ways to finance development projects, as well as direct the money that they currently have to programs that can aid the senior population. This report is premised on the belief that the senior housing environment includes the physical infrastructure (i.e. bricks and mortar), as well as the network service support that surrounds the home. Many of the County’s 37 senior affordable housing complexes have amenities such as laundry facilities, 24-hour secured entry, scheduled recreational activities, and also offer residents participation in programs sponsored by local organizations. In addition to these, there are other amenities and services to be

Planning for Senior Population Growth in Prince George’s County
54
considered, including access to transportation (public or private) and close proximity to local businesses, shopping centers, medical offices, and churches. Greater access to these and other amenities and services can provide an enhanced quality of life. Issues of connectivity and walkability are also important for seniors who may not rely solely upon motorized transportation for mobility. In addition, the connectivity indices for the 37 senior complexes were found to vary significantly, with some having better connectivity than others. Those with the greatest connectivity had features such as better sidewalks, safer crosswalks, and were also located near amenities. The County should ensure that for those senior housing facilities without sufficient connectivity or access to local transportation, attention is focused on efforts to rectify this type of mismatch. Finally, much of this research is based on only the 37 senior affordable housing complexes that were provided to the studio team by Prince George’s County. The initial list of complexes provided by the County actually included 45 complexes but upon review, eight of the facilities were either not affordable or not age-restricted. A lack of accurate and consistent record and data management prevents County agencies from understanding the true extent of the senior housing problem. In addition, there was little indication that the various agencies within the County worked together to share financial, housing or service data. Therefore, it is imperative that the agencies whose programs cater to the needs of seniors share pertinent data, practices and ideas in order to serve this population more effectively and efficiently.
Planning for Senior Population Growth in Prince George’s County
55
VI: RECOMMENDATIONS This report draws upon several approaches including interviews, field research, program reviews, and spatial analysis techniques to develop recommendations to assist Prince George’s County as it seeks to address the future housing needs of its seniors. The multimodal research design allowed us to uncover new ideas and considerations that may be beneficial in helping to house and better serve low-income seniors in the area. The findings have shown there are indeed issues with respect to affordable senior housing in the County, and therefore, Prince George’s County will need to concentrate its efforts on tackling the problems associated with funding for existing and future housing, determining locations of future senior housing development, and developing a more accurate system of record and data management, with respect to senior housing complex inventories and total number of seniors in the County. Following are recommendations that may be useful in confronting potential future need and spatial mismatches within the County’s senior housing environment. Recommendation 1: Address Prince George’s County’s Current and Future Need for More Affordable Senior Housing
Setting Funding Priority for Senior Housing How much more senior housing needs to be built in Prince George’s County to accommodate the future senior population growth? Based on our projections, the County will need to build 0.74 to 2.23 affordable senior complexes housing (averaging 120 units) per year until 2030. In other words, between 17-52 new senior affordable housing complexes would need to be built by 2030, based on the different senior housing population growth scenarios. However, given that the County currently has 37 senior housing complexes, and that historically HOME funds have not been specifically directed toward senior housing production, it is clear that this goal will not be realized. Nonetheless, in order to begin, the County needs to set senior housing production as a top funding priority within the HOME program and other housing funding programs with explicit production goals to provide a sense of accountability. In order to guarantee the effective use of HOME funds, the County must target those senior residential communities in need of adequate neighborhood based amenities and social services, as well as affordable housing. As argued throughout the report, the location of housing is a critical element in determining the state of the senior housing environment. Matching senior housing with a strong social support environment greatly enhances seniors’ quality of life. The results of this study demonstrate the importance of using spatial analytic techniques, to help target limited funds toward this effort. Preservation of the existing affordable senior housing stock is essential if the County plans to address the growing need of elder residents. One source of funding that can be used for the preservation of multifamily senior housing is CDBG funds. In order to

Planning for Senior Population Growth in Prince George’s County
56
allocate CDBG funds to existing and new affordable senior housing facilities, strict federal and county guidelines must be implemented that sets senior housing preservation/production as a top priority within the CDBG program. The County must also dedicate flexible capital resources and tax credits toward senior housing preservation/production. For example, in addition to using multi-layered financing with tax-exempt bond allocations and low income housing tax credits, the County should on a case-by-case basis determine the financial feasibility of waiving impact fees, granting Payments in Lieu of Taxes (PILOTS), or deferring real estate taxes for a set number of years to entice developers to produce and rehabilitate senior multifamily complexes. Figure 41 below shows the CDBG eligible block groups, the Councilmanic Districts, and the 37 affordable senior complexes. Of the 37 complexes only 21 are in block groups that are eligible to receive CDBG funding, meaning more than 40% of the complexes are not able to access CDBG monies. Figure 41: CDBG Eligible Block Groups and Location of Affordable Senior Complexes

Planning for Senior Population Growth in Prince George’s County
57
Build New Senior Housing in Projected Senior Hot Spots and Preserve Existing Homes as Senior Housing– Especially Inside the Beltway Providing adequate senior housing in areas where seniors live is vital in assuring a state of independence and maintaining ties to home, community and family. Figure 26 on page 35 above shows large numbers of seniors projected for the County by 2030. This image demonstrates that the County should focus its attention on the area inside the Beltway. A complicating factor regarding the need to build housing where the senior population is expected to grow, is that these same areas, in and around the Beltway are locations in which large tracts of land may not be readily available to build new housing complexes. With this in mind, the County, along with developers and non-profit agencies, will have to find alternate ways to provide an adequate housing supply for seniors in the future. One suggestion to address this demand is to put in place funding or incentives to rehabilitate the existing housing stock throughout the County, and especially within the Beltway. For the most part, housing values inside the Beltway are below the County median, which would help make this process feasible. In addition, amenities such as access to public transportation are more widespread inside the Beltway, and would provide future seniors with access to shopping, medical offices, and other critical services. Additionally, the County should consider developing an inventory of vacant public land and structures to better able identify potential locations for senior complexes Two other issues, both beyond the scope of this report, should be considered in the placement of affordable senior housing. The County should attempt to include low-income seniors and the accompanying affordable housing into mixed-income neighborhoods. In addition, the County should study and consider the impacts that may result from concentrating low-income seniors and affordable housing complexes in particular neighborhoods or portions of the County. It may be that concentrating seniors is not the most effective or beneficial course of action. Recommendation 2: Address the Mismatch between Senior Housing Locations and Services A premium must be placed on improving and increasing the transportation environment as it relates to Prince George’s County’s senior housing population. An emphasis on better transportation amenities will encourage seniors to lead more independent lifestyles, and thus lead to an overall enhancement in their quality of life. An added benefit would be a positive change for the entire community. Achieving and maintaining a high level of senior pedestrian service in the areas surrounding the 37 senior housing developments studied can take place through a number of policy implementations. Comprehensive surveys of the quality of sidewalks and crosswalks 1/4-mile from each of the senior housing developments, is a first step toward

Planning for Senior Population Growth in Prince George’s County
58
ensuring the safety of elder pedestrians. Similarly, audits can be performed of the roadways surrounding the senior housing developments. Those deemed unsafe are candidates for any number of traffic calming measures. It is equally important to provide destinations to which elder pedestrians can walk. This means making certain that business and economic development occur primarily in pedestrian-friendly communities. Safe sidewalks and crosswalks are of little use if they lead nowhere. An effective way of enhancing the environments surrounding existing elder communities would be to provide incentives to those developers that introduce desirable retail interests. Examples of incentives include a reduction of property taxes on acquired land or fees associated with the development and construction of senior housing facilities.55 In addition to accessible commercial development, it is also important that residents of these developments have access to transportation. For seniors that do not drive nor receive rides in personal vehicles, relying on alternate modes of mobility is a way of life. A thorough audit should be carried out across all senior housing complexes to determine whether they have features and amenities such as a 1/4mile walking distance to a Metro bus stop, 1/4-mile walking distance to a Metro rail stop, or some form of private transportation service. Once the results of the audit are ascertained, those developments found to be lacking can be the focus of improvements. An excellent method of addressing those improvements would be to partner with nonprofit organizations to fill in the gaps. Non-profits could be recruited to provide bus and taxi service to the residents of those developments that are not as readily serviced by local public and private transportation options. Considerations for New Construction of Senior Housing Complexes
Construct Senior Housing Facilities near Transportation Centers Policy makers should look into the possibility of locating new senior housing facilities within transit-oriented development (TOD) areas, usually within a 1/2-mile buffer of the transit station.56 TOD is denoted by its high density development, mixed land use and biking/pedestrian street design which can best meet the needs of the elderly. As a principle of TOD, it is recommended that commercial centers and senior housing complexes be located adjacent to a transit station. This makes the trip distance for the elderly to shopping centers and other daily needs services shorter than in sprawling, disconnected development patterns. A pedestrian-friendly street design within the transit area, aimed at promoting public transit, also provides a senior-friendly environment with amenities such as sidewalks, safe crosswalks, and bus stops.
55 Frank Martz, “Development Incentives.” The City of Altamonte Springs. 2005. http://www.altamonte.org/development/incentives.asp; Internet; accessed 29 November 2007. 56 This 1/2-mile TOD standard is distinct from the standard walkability measure of 1/4-mile.
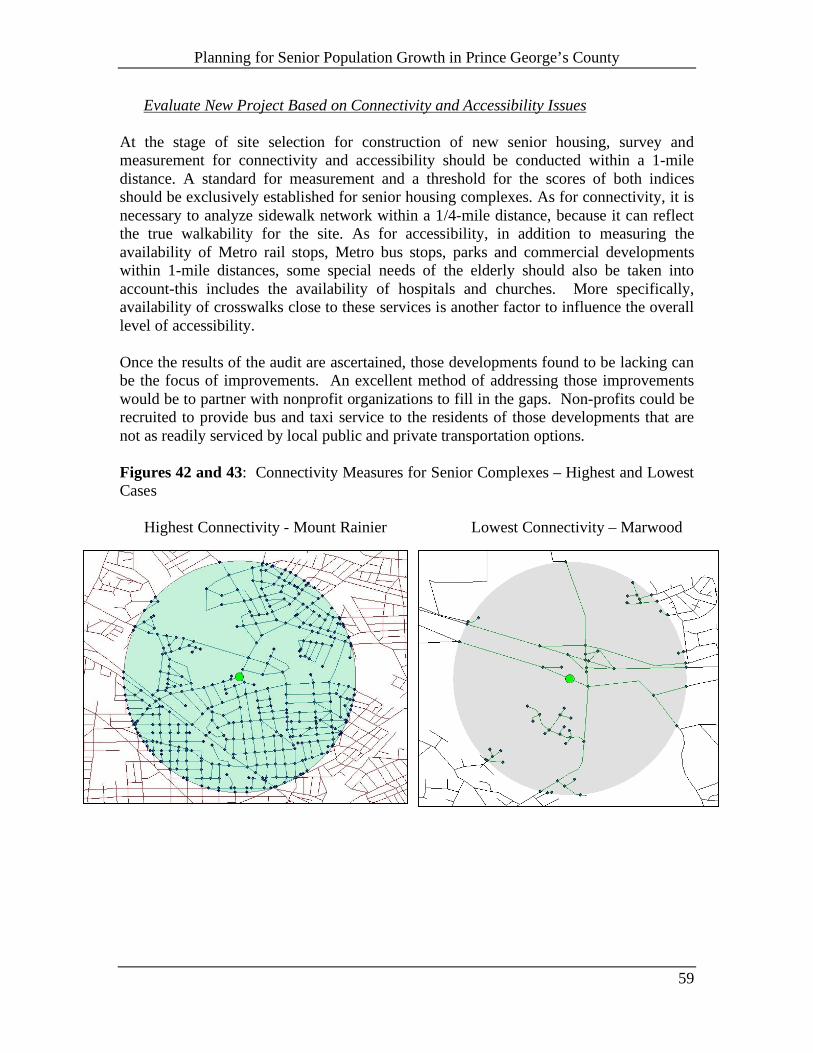
Planning for Senior Population Growth in Prince George’s County
59
Evaluate New Project Based on Connectivity and Accessibility Issues At the stage of site selection for construction of new senior housing, survey and measurement for connectivity and accessibility should be conducted within a 1-mile distance. A standard for measurement and a threshold for the scores of both indices should be exclusively established for senior housing complexes. As for connectivity, it is necessary to analyze sidewalk network within a 1/4-mile distance, because it can reflect the true walkability for the site. As for accessibility, in addition to measuring the availability of Metro rail stops, Metro bus stops, parks and commercial developments within 1-mile distances, some special needs of the elderly should also be taken into account-this includes the availability of hospitals and churches. More specifically, availability of crosswalks close to these services is another factor to influence the overall level of accessibility. Once the results of the audit are ascertained, those developments found to be lacking can be the focus of improvements. An excellent method of addressing those improvements would be to partner with nonprofit organizations to fill in the gaps. Non-profits could be recruited to provide bus and taxi service to the residents of those developments that are not as readily serviced by local public and private transportation options. Figures 42 and 43: Connectivity Measures for Senior Complexes – Highest and Lowest Cases Highest Connectivity - Mount Rainier Lowest Connectivity – Marwood
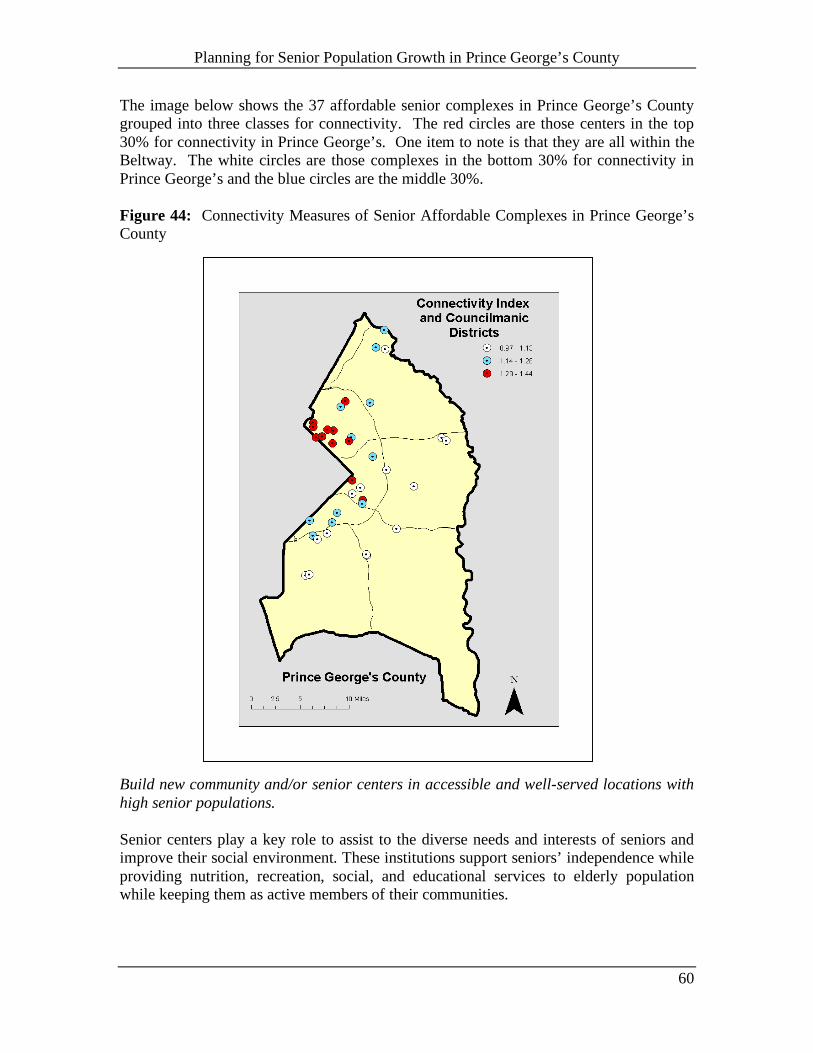
Planning for Senior Population Growth in Prince George’s County
60
The image below shows the 37 affordable senior complexes in Prince George’s County grouped into three classes for connectivity. The red circles are those centers in the top 30% for connectivity in Prince George’s. One item to note is that they are all within the Beltway. The white circles are those complexes in the bottom 30% for connectivity in Prince George’s and the blue circles are the middle 30%. Figure 44: Connectivity Measures of Senior Affordable Complexes in Prince George’s County Build new community and/or senior centers in accessible and well-served locations with high senior populations. Senior centers play a key role to assist to the diverse needs and interests of seniors and improve their social environment. These institutions support seniors’ independence while providing nutrition, recreation, social, and educational services to elderly population while keeping them as active members of their communities.

Planning for Senior Population Growth in Prince George’s County
61
To assist future elder-communities and promote a better social environment, the number of senior centers should increase in accordance with the growing senior population in the next 23 years. Through the present analysis several areas have been identified as senior population hotspots by 2030, some of these future hotspots currently lack of any sort of community or senior places to support future elder populations. Therefore, it will be necessary to provide centers to assist the new senior population.
Whether the new senior centers will be new or renovated buildings, they need to be accessible to assure convenient access to programs and services for older adults. Ideally, senior centers should be built in areas with good connectivity and accessibility and be within a walking distance. However, among the most basic accessibility issues to be considered while thinking of senior centers are adequate transportation, parking, and hours of operation.
Moreover, future senior centers should be able to adapt to meet the needs and interest of the new generations of seniors. New programs such as fitness activities and internet training are becoming popular among new seniors. Creating partnerships between senior centers and existing institutions within communities like libraries, universities, and sport centers can provide an opportunity to increase the range and quality of services for elders. Finally, along with senior centers, areas with high concentration of seniors should be well connected to services to create a good environment for future senior populations and natural occurrence retirement communities. If areas with seniors aging in place do not count on a good level of services such as libraries, churches or shopping areas, free transportation for seniors should be provided. As mentioned before, forming partnerships with local agencies can supply transportation options to connect seniors with services. Recommendation 3: Address Issues of Regulatory Policy Regarding ADA Standards for Senior Housing Facilities With regard to senior housing, many federal laws, design standards, County building codes and zoning regulations, that have been established to regulate the construction and modification of public and private dwellings, have limited powers of enforcement. For example, the 1990 Americans with Disabilities Act only requires that portions of senior housing complexes designated as places of public accommodation (i.e. leasing centers, clubhouses or meeting rooms) meet certain ADA requirements, excluding senior complexes themselves. Along with this, the Act only covers buildings and facilities designed and constructed for first occupancy after January 26, 1992, excluding all constructions prior to this date. The 1988 Fair Housing Act limits its scope to multifamily residential housing complexes designed and constructed for first occupancy after March 31, 1991, while also excluding independent living buildings and facilities. Aside from zoning allowances for senior housing in the County’s Consolidated and Annual Action Plans, and isolated cases in which some housing developers are required to follow certain County building codes, there is no established countywide regulation on the construction and modification of senior housing. In fact, under current county regulation senior housing is discretionary, in that it is constructed solely on a developer’s own inclination to create dwelling places for seniors.

Planning for Senior Population Growth in Prince George’s County
62
The availability of housing suitable to the needs of the elderly is an issue of great importance to Prince George’s County. As a way to encourage the construction of more senior housing, stronger regulation on the County level could be put in place. For example, when updating its Consolidated and Annual Action Plans, the County could research the feasibility to insert regulations that would create a category for areas zoned ‘Senior Multifamily Residential’. Accordingly, County building codes could be modified in a way that would require all developers and builders of senior housing to comply with accessibility and other types of regulations and undergo all necessary construction standard and code enforcement inspections. Recommendation 4: Improve County Methods for Data Management and Record Keeping of Housing Facilities and Social Services for Seniors Improve coordination of data collection and record updating As another way of addressing seniors’ housing needs, it is recommended that the County focus its energies on improving its current system of data collection and record maintenance. As explained earlier in the report, data used for research was gathered from many different sources, and was slightly inaccurate. A major reason for this inaccuracy could be the lack of information sharing among departments and agencies within the County. Perhaps, as an option, one agency could be designated to maintain data and records pertaining to seniors and senior housing in the County, then all data would be concentrated at a single source. Gather and update data annually In order to provide adequate housing and services that address seniors’ needs, the County needs to have a clear and full understanding of what those needs are. While surveying residents at the 37 housing complexes was out of the scope of this research, the County should nonetheless conduct an annual survey of residents and apartment managers. For this purpose, the County should create a standardized survey form that assesses both the physical and social support environments of senior communities. This survey would ensure that the County has up to date information about affordable apartment locations, rental rates, application procedures, and nearby services. By including questions assessing levels of transportation, health care and social services, the County can more accurately assess the needs of this growing population. To gain insight on seniors’ future needs, the County could use a similar assessment tool to evaluate the needs of both seniors aging in place and those living in non-senior apartments. This survey would include questions about current place of residence (location and type), future housing preference (single vs. multifamily), monthly income, social networks, etc. All of these data, combined with information obtained from residents already in affordable senior housing, could be analyzed and used as a tool of analysis when reviewing new senior housing communities and their abilities to meet seniors’ needs and preferences

Planning for Senior Population Growth in Prince George’s County
63
Another important factor in the County’s senior housing environment is the physical environment surrounding each senior housing complex. Similar to the survey used in assessing the 37 senior housing complexes in this study, the County could design a standard form for evaluating physical infrastructure. A survey would take into consideration the walkability of the surrounding area by assessing the condition of sidewalks, crosswalks and roads. Provide Senior Housing Resource information on the Prince George’s County website The studio team’s surveys of affordable senior housing complexes in the County examined the physical condition of the exterior, services offered to residents, and proximity and accessibility to nearby services. These and other data are of interest to current and future residents, and are pertinent to the decision-making process when choosing one’s future place of residence. As in many instances these data were not accessible on organizational websites, the County and agencies and organizations vested in providing housing programs and services for seniors should look into the possibility of making more web accessible information on housing developments and social services.

Planning for Senior Population Growth in Prince George’s County
64
VII: AREAS FOR FURTHER RESEARCH There are topics related to the senior housing environment that this study, due to time and resource constraints, could not address. In addition, there were findings from the data analysis that point to areas that may warrant further investigation. As such, themes and findings that were not addressed in this report are as follows: Foreclosures While this report focuses on the current and future rental housing environment for seniors in the County, it is important to note the present tension in the owner-occupied housing environment due to the increased level of housing foreclosures. In order to more accurately gauge the impact that foreclosure may have on seniors who choose to age in place, the County should conduct a study to determine whether there is a critical mass of seniors in the County who are losing their homes during this national housing crisis. Housing Affordability While this report focuses on all affordable rental housing complexes for seniors in the County, it is important to note the differences between tax-credit development complexes and complexes that house residents who use Section 8 vouchers. The Low Income Housing Tax Credit (LIHTC) program is a supply side subsidy program that allocates tax credits to developers to raise equity for the financing of affordable housing projects. LIHTC developments have rents that range from 30% to 60% of the area median income (AMI). The Section 8 Voucher program is a demand side subsidy program that requires the tenant to pay only 30% of their income. During the research and interview phase of this report the team learned that many advocates, seniors, and property managers are finding that LIHTC rents are not affordable for low-income seniors in the County. The county should conduct research to understand how many low-income seniors will be able to afford rents at LIHTC developments, to identify successful programs that provide short term subsidies to seniors waiting for more permanent rental subsidies such as section 8 vouchers, and to identify financing techniques and incentives that would entice developers to produce more LIHTC units at 30% of the AMI. Use of more current data This report relies heavily on two data sources for its GIS spatial analysis, U.S. Census 2000 and the 2006 ACS. As previously stated, the US Census 2000 provides the demographic data for this analysis. Unfortunately, the data are very old, as the next census is scheduled in approximately two years. These data do not reflect the rapid demographic, social and economic changes that have been occurring in Prince George’s County during the past seven years. For this reason, the County may wish to use this report as a basis for conducting another investigation to assess the senior housing environment after the 2010 census.

Planning for Senior Population Growth in Prince George’s County
65
Populations in Other Geographic Locations within the County The focus of this study was primarily on seniors who are located in areas in or around the Beltway in more urban and suburban settings. The scope of this study did not allow for the research to include populations in the rural areas of Prince George’s County. The research findings revealed that there are a substantial number of seniors that live in the southeastern part of the county, areas that are primarily rural. In the future, the County can replicate this study to analyze the needs of the rural senior population in order to address the specific needs of this group. Walkability Although the issues of neighborhood connectivity surrounding senior housing complexes and the accessibility to transportation for seniors have been discussed in this report, there is no analysis of walkability. A walkability study would focus on walking distances between the senior complexes and local amenities. Determining the walkability of senior housing complexes as it relates to the overall senior housing environment would help policy makers decide how best to allocate resources to those facilities that lack local services. In addition, the County may decide to partner with local organizations to provide services for senior housing complexes whose residents are without immediate access to local amenities.

Planning for Senior Population Growth in Prince George’s County
66
VIII: REFERENCES The Brookings Institution Center on Urban and Metropolitan Policy. (1999) A Region Divided: The State of Growth in Greater Washington, D.C. [Electronic version] Washington, DC: The Brooking Institution. DeRenzis, B., Rivlin, A. (2007). A Pathway to the Middle Class: Migration and Demographic Change in Prince George’s County. [Electronic version] Washington, DC: The Brookings Institution. Metropolitan Washington Council of Governments. (2006) Growth Trends to 2030: Cooperative Forecasting in the Washington Region. Accessed on November 8, 2007. http://www.mwcog.org/uploads/pub-documents/8llaXQ20061010135838.pdf. Washington Area Housing Partnership. (2005) Prince George’s Rental Housing Survey 2005. Accessed on October 11, 2007. http://www.wahpdc.org/reports/2005%20Prince%20George's%20Rental%20Housing%20Survey%20Report.pdf. Prince George’s County, Maryland (2006) “Annual Action Plan FY 2006” Prince George’s County, Maryland (2006) “Preliminary Application Requirements, Home investment Partnership Program” Prince George’s County, Maryland (2006) “Consolidated Annual Performance & Evaluation Report (CAPER) fiscal year 2006) http://www.hud.gov/offices/cpd/affordablehousing/programs/home/index.cfm “ HOME Program Summary” Prince George’s County Department of Housing and Community Development. (2007) Consolidated Annual Performance & Evaluation Report (DRAFT). Accessed on November 1, 2007 http://www.co.pg.md.us/Government/AgencyIndex/HCD/PDF/FY%202007%20CAPER%20DRAFT%20-%20Version%201.pdf Prince George’s County Department of Housing and Community Development. (2007) Community Development Block Grant Application. Accessed on November 1, 2007 http://www.princegeorgescountymd.gov/Government/AgencyIndex/HCD/PY%2033%20Application%20(new).doc Prince George’s County Department of Housing & Community Development. (2007). Community Development Block Grant. Accessed on October 1, 2007 http://www.co.pg.md.us/Government/AgencyIndex/HCD/cdbg.asp?nivel=subfoldmenu(3,2) Richardson, Todd. (2005). CDBG Formula Targeting to Community Development Need. [Electronic version] Washington, DC: Office of Policy Development and Research U.S. Department of Housing and Urban Development.

Planning for Senior Population Growth in Prince George’s County
67
U.S. Department of Housing and Community Development. (2007) Community Planning & Development- Community Development Block Grant Program. Accessed on October 5, 2007 http://www.hud.gov/offices/cpd/communitydevelopment/programs/ U.S. Department of Housing and Community Development. (2005) Use of CDBG Funds by PRINCE GEORGE'S COUNTY, MD FROM 07/01/2004 TO 06/30/2005. Accessed October 21, 2007 http://www.hud.gov/offices/cpd/communitydevelopment/budget/disbursementreports/md/04_PrinceGeorgesCountyMd.pdf U.S. Department of Housing and Community Development. (2006) Use of CDBG Funds by PRINCE GEORGE'S COUNTY, MD FROM 07/01/2005 TO 06/30/2006. Accessed October 21, 2007 http://www.hud.gov/offices/cpd/communitydevelopment/budget/disbursementreports/md/05_PrinceGeorgesCountyMd.pdf Lawton, M. Powell. Planning and Managing Housing for the Elderly. New York City: John Wiley & Sons, Inc. 1975 Libson, Nancy. “Sad State of Affordable Housing for Older People”. Generations Vol. Winter 2005-2006 Miller, K. Tyler “Subsidized Housing for the Low Income Functionally Disabled Elderly” Journal of Real Estate 2001 “Types of Housing & Care”, Senior Housing Net.com <http://www.seniorhousingnet.com/seniors/kyo/;$sessionid$OPM0PBECGJNQ0CQAQUCCFFQ> Maryland Department of Housing and Community Development “Housing Development-Maryland Affordable Housing Trust” http://www.mdhousing.org/Website/programs/maht/maht.aspx. United States Department of Heath and Human Services-Administration on Aging, “Older Americans Act: Title III Regulations-Subpart A—Introduction-Sec. 1321.1 Basis and purpose of this part”. United States Department of Justice FHA Title 24 C.F.R. 100.205-Design and Construction Requirements United States Department of Justice ADA Title III Regulation 28 C.F.R. Part 36-Appendix A to Part 36-Standards for Accessible Design

Planning for Senior Population Growth in Prince George’s County
68
Council On Tall Buildings And Urban Habitat. (1992). Building Design For Handicapped And Aged Persons. New York, New York: McGraw-Hill, Inc. AARP Public Policy Institute. (2005). Beyond 50.05 A Report to the Nation on Livable Communities: Creating Environments for Successful Aging. Washington, DC: AARP McNulty, Robert H. (2005). Livable Communities & Aging In Place. Washington, DC: AARP Hansen, Chris. No Place Like Home: AARP’s View on Livable Communities. AARP. Providence, Rhode Island. September 2005 LeaMond, Nancy. Public Policy Challenges to Creating Livable Communities. AARP. June 2005 Disch, Joanne. The Challenges of Long-Term Care: A Search for Solutions. AARP. Hyatt Regency Washington on Capitol Hill, Washington, DC. October 2003 AARP. “Beyond 50: Livable Communities Quiz.” Retrieved October 3, 2007, from the World Wide Web: http://www.aarp.org/families/housing_choices/other_options/a2005-06-20-livable_communities_quiz.html

Planning for Senior Population Growth in Prince George’s County
69
IX: LIST OF APPENDICES APPENDIX A: Resources in Prince George’s County for Seniors APPENDIX B: Inventory of 37Affordable Senior Complexes in Prince
George’s County APPENDIX C: Regional Census Data - 2000 to 2006 APPENDIX D: Population Projection Method APPENDIX E: Checklist for Site Visits to Prince George’s Senior Complexes APPENDIX F: List of Senior Complexes by Councilmanic District and CDBG
Eligible Block Groups APPENDIX G: Prince George’s County - Block Groups with Highest Density
of Seniors per Square Mile – 2000 APPENDIX H: Prince George’s County - List of Top 25% of Block Groups by
Senior Density per Square Mile - 2000 APPENDIX I: Prince George’s County – Image of 1-Mile Connectivity for
Each Senior Complex APPENDIX J: Prince George’s County – Image of Services within 1-Mile for
Each Senior Complex APPENDIX K: Maps Used in the Report plus Additional Maps APPENDIX L: Photo Inventory of the 37 Affordable Senior Complexes APPENDIX M: Presentation Power Point - 10 December 2007 APPENDIX N: Digital Copy of Final Report