Planning Design HEPP Norplan
159
1. 1 ' 1 1 i 1 ¡ r 1 . 1 i r . ¡: 1 1 L 1 \ ,' / 1 1 NORWEGIAN HYDROPOWER TECHNQLOGY SEMINAR PLANNING AND DESIGN OF HYDROPOWER PROJECTS [¡!] NORPLAN A.S Consulting Engineers and Planners Odd Guttormscn EditOJ'
-
Upload
laura-elgarrista -
Category
Documents
-
view
87 -
download
6
Transcript of Planning Design HEPP Norplan

1.
1 '
1 1
i 1 ¡
r 1 .
1 i
r .
¡ : 1
1 L 1 '~
\ ,' /
1 1
NORWEGIAN HYDROPOWER TECHNQLOGY SEMINAR
PLANNING AND DESIGN OF HYDROPOWER PROJECTS
[¡!] NORPLAN A.S Consulting Engineers and Planners
Odd Guttormscn EditOJ'

NORWEGIAN HYDROPOWER TECHNOLOGY SEMINAR
PLANNING AND DESIGN OF HYDROPOWER PROJECTS
Odd Guttormscn Editor
[¡!] NORPLAN A.S Consulting Engineers and Planners

NORWEGJAN HYDROPOWER
TECHNOLOGYSEMINAR
COSTA RICA
17-22 Octobcr 1994

1
PLANNING ANO DESIGN
OF HYDROPOWER PROJECTS
1 1
'
1
NORPLAN

\
Con 1.240 MW.Ia central llidroeléctrica de Kvilldal es la mayor de Noruega.
Rotor Pelton foto· grafiado en la sede central de SF en Hevik, Noruega,
Statkraft Engineering
En 1993, el personal del Departa· mento de Tecnología y Desarrollo de
Statkraft SF (el Consejo Noruego de la Energía) se organizó como un organls· mo Independiente: Statkraft Englneerlng. Junto con su casa matriz Statkraft SF y otra compañía filial del grupo, Stat· kraft Anlegg (construcción), cuentan con una plantilla de 1.200 personas y manejan centrales hidroeléctricas con una capacidad Instalada de 8.500 MW y una capacidad máxima de enbalse de 30 TWh.
Cuatro pilares
Además de los departamentos de Finanzas, Marke· ting y Control de Calidad, Statkraft Engineering tiene cuatro departa· mentas de ingeniería:
• Permisos y Me· dio Ambiente: estudios de impacto medioambiental. permisos y adquisición de terrenos
• Ingeniería Civil: presas y excavaciones de túneles y cavernas edificaciónes
• Mecánica: turbinas, válvulas, compuertas y estructuras en de acero
• Eléctrica: generadores, transformadores, conmutadores y sistemas de control
Empresas de gran calibre
Como empresa líder en obras hidroeléctricas en Noruega, Statkraft Engineering es hoy una autoridad en modernos planes hidroeléctricos. La mayoría de estas obras han comprendido la excavación en Roca de túneles y cavernas.
Los cien empleados de esta nueva empresa acumulan 70 años de experiencia trabajando en más de 50 proyectos de construcción de centrales hidro eléctricas. Su experiencia abarca todas las
fases del proceso de construcción de una central:
• Escudios de prefactibilidad y factibilidad
• Estudios de impacto medio-ambiental • Licencias y permisos • Adquisición de terrenos • Ingeniería y diseño • Especificaciones • Negociación de contratos • Direcciórt y supervisión de proyectos • Dirección de obra
A su servicio
Statkraft Engineering ha desarrollado soluciones técnicas poco convencionales, que tratan de ahorrar dinero y energía. Está especializada en ingeniería de excavaciones y puede suministrar plantas completas llave en mano y realizar estudios especiales o subcontratar obras. Cuenta con una amplia experiencia en la modernización. rehabilitación y ampliación de plantas antiguas.
Impresionante récord Entre las princrpales centrales hidroeléctricas de Noruega en las que ha intervenido Statkraft Engineering, están:
• La de Svartisen, de 350 MW (con el mayor grupo generador de Noruega, de 410 MVA)
• La de Kvilldal (4 x 310 MW), con una presa de hormigón de doble curvatura de 255.000 m3
• La de Jostedal, de 288 MW, con la caída de mayor altura de Europa del Norte (1.200 m)
• La de Mauranger (2 x 125 MW), a la que el agua llega directamente de un glaciar
• La de Saurdal (4 x 160 MW), con dos grupos reversibles, para bombeo y turbinado
N0flllfGfl EXPORTA' Pr~·-: .. - " -¡,. _,,...,.,,¡~-:.¡ ,-,
STATKFRAFT ENGINEERING AS P.O. Box 191 N-1322 Hovlk Noruega
Tel.: 0747 67 57 7010 Fax.:07-47 67 57 70 11
SERVICIOS DE INGENIERIA Y DIRECCION DE PROYECTOS
El espectacular salto de Veringsfossen, de 183m. que cae directamente sobre una garganta rocosa.
Hicieron falta 255.000 m3 de hormigón para construir la presa de Farrevass. de 1.300 m de largo.

' 1
: 1
: 1
: 1
' 1
1 1
1 1
1
1
1
1
LIST OF CONTENT:
l.
2.
3.
GENERAL ASPECTS OF UNDERGROUND HYDROPOWER PLANTS
INVESTIGATIONS 2.1. Topography (Surveys and mapping) 2.2. Engineering geological investigations
2.2.1. Geology, materials and sediments 2.2.2. lnvestigations for underground works 2.2.3. The engineering geological report
2.3. Hydrology 2.3.1. Hydrological data 2.3.2. Design flows 2.3.3. Floods 2.3.4. Methods of analysis 2.3.5. Operation studies
DESIGN OF CIVIL WORKS 3.1. Dams
3 .2.1. Types of dams 3.2.2. Geotechnical investigations for design 3.2.3. Selection of dam type 3.2.4. Spillways
3.3. Waterways (Tunnels) 3.3.1. General considerations 3.3.2. Design trends in tunnellayout 3.3.3. Unlined pressure tunnels and shafts 3.3.4. Lake taps 3.3.5. Air cushion surge chambers 3.3.6. Unlined tunnel hydraulics 3.3.7. Arrangement of gates and steelworks in tunnels
3.4. Pressure transients, surges and turbine goveming 3.4.1. Surges in shafts 3.4.2. Pressure rise at the turbinc 3.4.3. Regulation stability
3.5. Underground powerhouse layout 3.5.1. Generallayout 3.5.2. Powerhouse arrangements 3.5.3. Powerhouse structures
PageNo.
4 4 5 5 8
13 15 16 17 19 21 24
27 27 27 35 39 40 41 41 45 46 47 49 51 55 58 59 60 61 63 63 65 69

1
4. ECONOMIC ANAL YSIS IN HYDROPOWER PLANNING 71 4.1. Project appraisal 71
4.1.1. Discounting factors 73 4.1.2. Discounting methods 75
4.2. Optimization of project elements 76 4.2.1. Marginal cost and income analysis 76 4.2.2. The optimization process 77 4.2.3. Optimization of reservoir volume 78 4.2.4. Turbine and generator capacities 82 4.2.5. Optimization ofheadrace/tailrace tunnels 84
5. THE PLANNING PROCESS 87 5.1. The hydropower development cycle 87 5.2. Reconnaissance studies 89
5.2.1. Personnel 90 5.2.2. The study 91 5.2.3. Check list for reconnaissance studies 93
5.3. Prefeasibility studies 95 5.3.1. Water studies 96 5.3.2. Various studies 97 5.3.3. Engineering 98 5.3.4. Check list for prefeasibility studies 99
5.4. Feasibility studies 1 o 1 5.4.1. Jntroduction 1 o 1 5.4.2. General considerations 101 5.4.3. Project plans 103 5.4.4. Estimates and schedules 104 5.4.5. Remarks on feasibility studies 107 5.4.6. Reports 108 5.4.7. Summary and check list for feasibility studies 108
6. LIST OF REFERENCES 112
1

1. GENERAL ASPECTS OF UNDERGROUND HYDROPOWER PLANTS
When planning hydropower projects the main concern and objective is the final product - to achieve a power project which can be operated at design capacity with minimal problems ovcr its entire Ji fe. A lot of planning expertise goes into achieving this goal.
Project economy is an importan! parameter and the construction cost is normally the most importan! single factor influencing project economy. The construction process is therefore an importan! planning element which must be given careful attention, when establishing project layout.
The layout ofthe project must Jcnd itselfto uncomplicated and fast construction. Thc construction methods which can be adopted to the established layout will influence both construction cost and construction time.
Suitable construction methods are introduced at an early stage of planning and are actively used in formulating the project layout. In some cases available construction methods not only influence, but even determine layout and project clements.
Hydropower projects are madc up of a number of project elements, such as dams, waterways, power houses, etc.
The list of element categories is not extensive but each category of elements has a large number of element types to choose from. As each hydropower project has to be adapted to the actual si te conditions, there is Jittle possibility for standard layouts and solutions. Each project is virtually tailormade and the skill and experience ofthe planncrs are csscntial to sclecting the right project clements for the situation and conditions at hand and establish a workable projcct layout.
Some of the main layout options for hydropower projects are shown in Fig. 1.1.
The two main development options are:
Direct development, with no permanent diversion involved. This "inriver" development is used both for run-of-river installations and installations with some regulation or pondage.
Diversion development, which allows a whole range of Jayouts. In the figure four layout options are indicated. They al so illustrate the teclmological development over the Jast fifty years.

2
From the water resources study the stream flows are determined, applying adequate safety factors if historical records of acceptable reliability are not available. Such streamflow data are adj usted for water abstraction for stipulated multipurpose uses and losses caused by leakage, spill to secure a mínimum flow in the river, evaporation from reservoir surface, etc.
Operation studies will be undertaken to study the anticipated operation ofthe project. Together with the adopted production criteria resulting from the power studies a study of the power operation is made. From these studies the need for and size of regulation will be determined.
1 f regulation is identifíed as a project fea tu re and accepted under environmental criteria, storage of suffícient volume must be made available.
Two methods are used to create storage volume:
Construction of dams to crea te artificial reservoirs Tapping of naturallakes to crea te artificial storage
In many cases a combination of "damming" and "tapping" will be used to provide storage. The two methods are illustrated in Figure 1.2.
For the purpose ofthe power operation study, for optimisation ofdam height, for estimating evaporation losses and similar, reservoir data are needed. For this purpose the reservoir area and volume curves are dcveloped. These curves give the relationship of reservo ir volume and surface at various storage levels.
The necessary storage volume as well as the program for operation of the reservo ir is obtained from the operation studies.
In many cases reservoirs are used for flood mitigation by retaining flood peaks in the reservoir. To this end reliable flood prediction must be available in order to create storage space for flood retention.
To protect the regulation works from destruction by floods flood figures must be estimated for use in the hydraulic studies.
One is the design flood and its hygrograph. This is used in calculating and designing spillways and ancillary structures. The other flood parameter concerns the care of the I'Íver during construction ofthc regulation works, diversion works, cofferdams, etc.
The design flood is often defíned as the flood which is expected to occur once during a pcriod of 1000 years, or the 1000 years flood.
3
Which flood size to use in connection with construction depends on the river in question and how erratic the floods are. For predictable rivers the 20 year flood may be used, for others the 50 or cven the 100 years flood are adopted for the design of diversion works, cofferdams and similar.
Care of river during construction means to manage the river so that the construction of the various structures in the river can proceed unhampered by floods. Severa! techniques are used for this purpose.
The main options are:
Staged construction. Part of the structure, dam or similar, incorporating facilities for letting the flow pass through ata later stage, is constructed behind cofferdams while the flow passes in the unobstructed part of the river. 1 n the next stage the flow is passed through the airead y completed part while the rest is constructed behind new cofferdams.
Construction in one operation is used in case of favourable topography or when the structure is sensitive to flooding or will not allow subdivision by stages (e.g. fill dams). The water flow is in this case di verted around the construction si te which is protected behind cofferdam upstream and downstream, securing a dry construction si te over the whole width of the river.
Dam structures come in a variety oftypes. Physical conditions will influence the choice of dam type for a particular damsite. The topographic condition may exclude some dam types while the foundation conditions may reduce options and restrict the choice lo one main lype only. Availability of acceplable construction material al or near the damsite will also influence the choice as will transportlength, construction conditions, construction time, environmental issues, etc.
Previous studies may have reduced the options and narrowed down the choice. Still, considerable time and effort will, during the feasibility study, go into finding the besl dam type for the actual si te. On the other hand, the best dam type for construction purposes, material availability and other purposes may influence the choice of damsite, which again will ha vean impact on project layout as a whole.

4
2. INVESTIGATIONS
Flow data and data on topography provide the base for establishing production figures and the generation capability of contemplated projects. The demand forecast and supply system are al so involved when the size of the installation and number of generation units are determined.
Detailed knowledge of the geomorphology and geology of the project arca and si tes are needed in connection with planning ofproject layout and dcsign ofthe structures and facilities which make up hydropower projects. Only by having suffícient and reliable data and knowledge of geotechnical, geological, seismic conditions, sediment loads, etc. can practica! and sound layouts and structures be planned and designed. Knowledge of subsurface conditions are a! so needed in order to plan foundations of project structures and underground works and installations.
Long term data on hydrology and meteorolgoy are used in determining river discharges, flood and similar occurences. Such data and knowledge of future load conditions are used in determining regulation needs and facilities for flood controL
2.1. Topogrªphy (Surveys and mapping)
In hydropower terms the m a in characteristics of water resources are flow (Q) and head (H) as demonstrated in the power equation:
Power = e X H X Q when e is cocfficient of efftcicncy
The flow situation can to a certain extent be improved for hydropower purposes by means of regulation, i.e. storage ofwater in the wet seasons for use during dry time. The flow parameter (Q) is cstablished through the hydrology study.
The head (H), which means the difference in leve! between inlet and outlet of a hydropower installation cannot be increased or improved on. The head o ver a distance, the gradient, can of course be concentrated in one place by means of a dam, but is otherwise a physical feature which cannot be altered.
The head together with the flow determine the size of the water resource in hydropower terms. The size of the head mus! therefore be determined at an early stage as this planning parameter is of vital importance in the planning process.
The first planning step is usual! y, by means of existing maps, to determine which par! of a watercoursc is of interest and then by field measurements to establish the river profile. For quick reference barometric levelling is used but as soon as possible more reliable and accurate levelling must be carried out.
Topographic surveys of catchment arcas, reservoir, dam si tes, major structures si tes, and project land arcas involved will be carried out and con tour maps in appropriate sea! es constructed.

1 1 5
Catchment areas are usually detennincd from existing maps. Maps for large reservoirs should ha ve a scale of 1 :25,000 with 5 meters contour intervals, or better. Small rcservoirs should be mapped ata larger scale and ha ve smaller con tour intervals, preferably 1: 10,000 with 2 meters con tour intervals.
Dam si te topography ata sea le of 1 :2,000 with onc meter contour intervals will usually be adequate for preliminary dam design. Major structure si tes should be mapped ata scale of 1:1,000 with con tour intervals of one half to one meter.
Arcas proposed for irrigation should be mapped ata scale of 1:10,000 or 1 :25,000 with one halfto 2 meter contour intervals in order to facilitate the land classification surveys and design of the distribution system. The con tour interval selected will depend on the slope and relief of the arca. Actual land classi fication mapping is best done on aerial photographs at a scale of 1: 10,000.
Satisfactory locations and estimates of canals, transmission lines, railroads, highways, cte. can be made from 1 :25,000 sea le topographic maps if supplemented by fiel el inspection ofthe route and use ofadditional cross slopes and more detailed topography at critica! points. 1 f adequate topographic maps are not available, field survcys consisting oftraverse and strip topography will be needed.
2.2. Engineering gcological inycstigations
Geology, in addition to hydrology and topography, is the most importan! physical parameter in planning and design of water resource projects.
Knowledge of the geology and data on physical prope1iies of the surface and the undcrground are needcd carly in the investigation process. Field investigations must therefore start as early as possiblc but must be coordinated with topographical surveys and project pla1111ing.
2.2, 1, Geology. materials and sediments
The first step in geological and geotechnical investigation ofprojects is the preparation of geological maps. Such maps are usually based on topographical maps and surface observations supplemented with information from laboratory analysis of collected samples. When the geology is complex or the surface is covered, subsurface investigations may be needed.
Such investigations are, however, very expensive and should never substitute geological expertise. There should always be a well founded and flexible program established befare subsurface investigations start, including definite siting aod definition of purpose.

6
Subsurface examinations of dam, canal and waterway locations are conducted to determine the nature of foundation conditions and the materials to be encountered. Pmticular attention is paid to unusual construction difficulties and possibility of leakage.
The availability of construction material, su eh as earth, el ay, sm1d, filter materials, concrete aggregates, cement, timber and rock are major factors influencing selection of type of structure and construction costs. Deposits of material of satisfactory quality should be located, tested and mapped.
The most commonly used subsurface explorations methods are sampling by means of boring, core drilling, exploration shafts, trcnches and tunnels. The samples derived from such explorations are subjected to laboratory tests from which data on engineering properties etc. are obtained.
Seismic refraction investigations and electric resistivity measurements are frequently used in order to obtain data on overburden thickness, rock quality, faulting etc.
The water tightness of subsurface formations is often of great importance and leakage testing is carried out in connection with boring and core drilling, to obtain leakage values (Lugeons). These are used to determine the formation's suitability for waterways and to estímate leakage preven ti ve measures.
For underground installations destructive tests are carried out to measure the strength of the roe k at points subject to abnormal stresses. Such tests, termed "hydraulic fracturing", are performed to verify ifthe interna! strcsses ofthe rock body are sufficient to allow design ofunlined pressure waterways, shafts and tunnels. In these tests the rock is subject to stresses until rupture to obtain the required design parameters.
Reservo ir Tightness and Slope Stability In some instances seepage losses from reservoirs cause problems which require serious consideration. If the losses are small and if structural stability is not affected, the los ses may be ignored or considered part ofthe reservoir release. Where the losses are high, and especially where they increase dueto piping or solution of foundation materials, they can affect the practicability ofusing the reservoir si te. All geological studies of dam and reservoir si tes should carefully evaluate probable seepage losses.
Thc slopes of a reservo ir may be subject to severe conditions during rapid impounding and drawdown, duc to changcs in thc ground water table. The question of slope stability during such adverse conditions must thcrefore be thoroughly studied in case of stccp gradients.
Seismicity . In many pa1ts of the world seismic activities presenta problem with respect to future stability of structures, cte. Measures to offset the effect of earthquakes must be taken into account, and structures, waterways, etc. must be designed to withstand the effects of earthquake induced stresses.

7
For planning and design of reservoirs, data on annual sediment transpmi is needed. For the design of small reservoirs, diversion facilities, canals, etc., for which flushing opcration is part ofthe design criteria, knowledge ofthc grain size distribution ofthc transponed material is importan t. Flushing is only possible if the bed load is reasonably free from coarse grave!, pebbles and rack. The sampling program must be planned accordingly.
Frequently, no sediment data exist at the start of investigations. A sampling program initiated as part of projcct investigations will only provide two to four years of data coverage. Also, as reliable sediment transport data are difficult to acquire, it is normal to have to base planning of sediment handling on a few data, often of questionable quality.
Comparison with data from other, similar catchments, is then a possibility which is frequently used. Though often necessary, this technique must be applied with care, considered catchment background geology, human activities, etc.
Particular attention should be given to sampling during flood stages. For most river, the majar part of the total annual sediment load is transported during floods, sometimes by a single flood.
For most planning purposes the sediment discharge is normally expressed in terms of weight ofsediment per unit oftime, while sediment deposits are expressed in volume. Knowledge of the nature of the sediments as determined from size anal y ses will be needed for the design of structures and turbines.
Practica] means to remove sediment deposits from medium or large size reservoirs are not available at present. lf such means beco me available in the future it will be of vital importance for design of reservoirs.
Sediment accumulation will occur in varying degrees in all parts of the reservo ir. Space reserved for this purpose should therefore be defined asan incremcnt of reservo ir capacity.
As sediments accumulate, storage capacity will be affected. lt may then be necessary to operate the reservoir at successively higher levels with resulting increases in water surface area and evaporation losscs.
Much of the sediment deposition will occur at the reservo ir inlets and in the form of deltas. Here an opportunity will arise for extensive growth ofphreatophytes (water plants). Consequently hcavy transpiration losses may result. In regions of critica] water supply, these losses may be significan! and control ofphreatophytes or removal of sediments may be justified.

8
Sediment problems in structure design The discharge of comparatively sediment-free water below reservoirs or other detention structures may cause serious scour or channel erosion, known as degradation, in which case consideration will have to be given to protective measures and grade control structures.
Consideration will ha ve to be given to the design of diversion works which may effectively exclude the heavier sedimcnts. Desilting works may be necessary, or it may be possible to cause the scdimcnt to be clcpositcd in the initial reach of the canal or tunnel for perioclic removal by sluicing.
Sediments ancl sediment transport often create problems in connection with hydropower installations. In most cases with heavy sediment loads, it is neccessary to build sediment excluders and sedimcnt traps to avoid siltation ofwaterways and reduce turbine wear.
2.2.2, Investigations for underground works
The main goals of engineering geological investigations for underground hydropower plants are to obtain:
a) The necessary input for the evaluation of si te and alignment alterna ti ves and for the overall planning of the scheme
b) A basis for evaluation of potential stability problems and the necessary input parameters for stability analyses and planning of rock support
e) A basis for cost evaluation and for preparation of tender documents.
The geological conditions may vary widely. Eaeh site has its own eharaeteristics, ancl hence there is no "standard investigation procedure" which will be the only right one cvery time. When it comes to engineering geological investigations, tlexibility is thereforc an importan! keyworcl. This tlexibility represents a considerable cost-saving advantage in geo-investigation practicc.
Engineering geological investigations related to tunnels and underground openings are carried out in two main stages:
Preconstruction phase investigations Tunnelling has not yct started and all information has to be collected on or from the surface
Construction phase investigations Through tunncls bcing excavated the rack masses are accessible for inspection and sampling.

9
As shown in Table 2.1. each of the two m a in stages can be divided into two substages. The characteristic investigations for each ofthe four substages are briefly listed in the table. Types of reports are al so indicated.
Not all investigations ha ve to be canied out for all tunnels. A short tunnel through rocks which can easily be mapped on the surface does not necessaryily need two-stage preconstruction investigations. On the other hand, for a hydropower scheme with severa! alternative tunnel alignments and complicated rock conditions, the preconstruction investigations are often divided into more than two stages.

1
1
... 1.
~.
10
Table 2.1 Engineering geological site investigation stages
PRECONSTRUCTION PHASE INVESTIGATIONS Information collectcd on or from the surface
Feasibi!ity study explora! ion Desk studies of:
- geotechnicalliterature
- topography and gcological maps
- aerial photos
Dejinite plan study investigations Engineering geological mapping along tunnel alignment:
- types and quality of rocks
- oricntation, spacing and character of joints
- orientation, thickness and type of Walk-over survey for preliminary mapping of weakness zones soil cover, rocks, jointing and wcakness zones.
Investigations at key points for tunnels:
- entrances
- intakes and outlcts in lakcs, fjords and rivers
- arcas of small rock cover
- check of soil thickness in critica! points
Feasibility study report:
- review of geological and geotechnical conditions
- evaluation of feasibility for different altematives
- plan and cost estimates for detailed invcstigations
- need for more maps and aerial photos
- ground water condition
Special investigations:
- refraction seismic survey
- core drilling
Sampling and laboratory testing of rocks:
- strength - drillability - blastability Definite plan study report:
- Description (with maps and cross sections) of all topographical and geological factors that may influence construction and use of tunnels and openings
- estimates and preliminary plans for cxcavation rcquirements, rock support and lining
- plans for use of rock material

11
Tab1e 2.1 (cont.) Enginccring gcologica1 sitc invcstigation stagcs
CONSTRUCTION PHASE INVEST1GAT10NS Rock masses can be inspected in the subsurface
Detailed subswface investigations Tunnel mapping Sampling and testing ofrocks and infilling Mapping in tunne1 of: materials from joints and faults.
- types and quality of rocks Supplementary investigations: - orientation, spacing and character of joints - rock stress measurements - orientation, thickness and type of - premeability tests of rock masses weakness zones
- convergence measurements of openings - water seepage
- stress included problems Control and revision of reports from preconstruction phase investigations. Registration of all rock support, lining and
rock improvement. Recommendations of permanent rock support and lining. Evaluation of excavation performance.
Recommendations for grouting.
Recommendation for excavation through highly unstable rock masses. Supplementary reports from construction Final report with tunnel-map and review of phase investigations. rock support.
Report on permanent rock support and lining. Evaluation of preconstruction phase investigations.
Preconstruction phase investigations
The initial site exploration is based primarily on the designer's prefeasibility study. The aim is either to study the feasibility of a planned tunnel, or, more often, to evaluate and reduce thc number of possible alternatives in a scheme based on geotechnical information. Few decisions are made as yet, and sketches are more typical than drawings. This is a very challenging phase. Importan! decisions are taken, often based on limited informal ion. Experience from similar projects and similar is thercfore of particular value.
At this early stage it is importan! to collect all existing relevan! information from literature and technical reports. Desk studies of topographical and geological maps as well as aerial photos are also made. Such studies will seek to discover where the bedrock is covered with soil, the locations and directions ofthe more importan! weakness zones and information about the stress situation in the area.

12
As far as topographical maps are concerned, the scale 1 :50,000 will be the best alternative for regional investigations. For more detailed investigations larger scales are used. Unfortunately, since hydropower schemes are often located in remole and mountainous arcas, "blank spots" are not uncommon. In such cases topographical maps have to be made exclusively for the project.
When good geological maps of the area airead y exist, this m ay reduce the need for field mapping. The desk study is therefore an importan! too! in this connection.
The desk studies will normally be followed by a walkover survey to investigate certain key points in the actual area.
Rock sampling for simple classification tests is done, and the most importan! joint information is collected. Depth ofweathcring and ground-water conditions are also studied during this walk-over survey.
Close cooperation between the engineering geologist and the designer is very importan! during this early stage of the investigations. At this stage it has to be decided whether or not to follow up with more expensive investigations.
Based on the feasibility study report, the client, in cooperation with his consultants, will decide if further planning should be carried out, and if so, what alternatives should be investigated. Additional aerial photos are taken ifrequired, and better maps are drawn. The engineering geologist will normally need aerial photos and maps covering a larger area than is strictly necessary for the other planning operations.
For the definite plan study investigations a detailed engineering geological field mapping is carried out. This mapping should include all factors which are likely to cause difficulties in the project. In all cases rock types, weakness zones and jointing represen! impmtant factors, and rock stresses and groundwater conditions will normally require special attention.
The time and effmt spent on field mapping will to a great extent depend on the complexity ofthe geology, and hence will vary considerably from si teto si te.
The most importan! task for the engineering geologist at this stage is to produce engineering geological maps and pro files covering the different parts ofthe project. For this purpose sampling and analyzing rcpresentative specimens ofthc different rocks and soils are necessary. It may be necessary to supplement purely surface-based mapping with special investigations like core drilling, various geophysical measurements and measurements from dril! boles like water pressure tests.
Fig. 2.1. shows a section of the engineering geological pro file of a hydropower plant which was recently excavated in Central Norway. In this cxample the estimated locations of rock type boundaries and weakness zones are shown, and the position of core drilling is also indicated.

13
The results from the detailed surface investigations are collected in a report which is nonnally a part ofthe tender documents. This report contains engineering geological descriptions, evaluations of construction and stability problems in the different parts of the project andan cstimation of ncccssary rock support. Rcsults from lield measurements, sampling and laboratory testing are presented and evaluated.
Conslruclion phase invesligalions
When the construction work has stmied and the tunnel can be entered, the possibilities for the engineering geologist to obtain better information increase considerably. The construction phase investigations should thcrefore start as early as possible.
Stress measurements in rock mases should preferably be carried out in underground openings and tunnels. Such measurements are therefore good examples of the type of detailed investigations which have to be delayed until tunnelling has started. For unlined high pressure hydro tunnels hydraulic jacking tests are used to decide the necessary length of steel lining.
Hydropower tunnels are difficult to inspect after they have been put into operation. For the owner it is therefore useful to have maps and drawings describing the inaccessible parts ofthe project. Such maps should contain all geological elements that may influence the stability ofthe tunnel such as majar joints, faults, zones ofcrushed rocks, water leakages and areas with rockburst problems, in addition to rock types and information about support work.
The construction phase investigations, and the tunnel mapping in particular, are importan! elements in the process ofbuilding up enginering geological experience. The preinvestigation methods can only be improved ifthe prognoses are carefully controlled through the construction phase investigations. Whcre the prognoses have been wrong, it is particularly importan! to Jlnd the reasons for this in arder to avoid similar mistakes in the future. When an underground project is completed and all construction phase investigations carried out, a final report is often made containing all experience gained during the planning and construction period. Attached to the report are maps and drawings as earlier described.
2,2.3, The engineering geological report
The reports of the various investigation stages represen! very importan! documents for the planning and operation of underground hydropower plants. Hence, considerable effort should be put into preparing good rep01is.
The optimum layout of a report will depend on severa! importan! factors such as investigation stage, complexity of the geology, complexity of the actual scheme etc. Hence it is difficult to define general guidelines. However, for an underground

14
hydropower scheme, the engineering geological repm1 from the definite plan study investigations is often dividcd into the following chapters;
l. Introduction Describes background material (literature, maps, aerial photos, etc.), time when the different investigations were carried out, descriptions of the soils in the area, unless this is dealt with in a separate chapter.
2. The rocks Deals with the age and the mineralogical composition of the rocks, specifying the content oftechnically importan! minerals (qumtz, calcite, micas, etc.), and the distribution of the different rocks in the actual area.
3. The mechanical prope1ties of rocks Sets out thc results ofthe sampling and the laboratory analysis. Evaluates the strength values and the calculated índices for drillability and blastability; which rocks can be used in road construction, etc.
4. The jointing Describes the different joint systems and their character like roughness, content of infilling materials, orientation and spacing, etc.
5. Weakness zones This is a general description of the tectonic situation in the area. Detailed descriptions of each single weakness zone that may intersect the underground openings and tunnels.
6. The stress situation Describes the stress situation based on analysis of the topographical conditions. Presents stress models or stress measurements if such are carried out.
7. Water Evaluates the risks of water leakages into the tunnels during construction and leakages out of the tunnels in the operation stage. Ice and frost problems.
8. Support and tunnel lining Describes and lists the different types and the amount of support measures and linings which are prescribed.
9. Construction phase investigations Describes the investigations which should be carried out when access to the underground is made possible.

15
2.3. Hydrology
Hydrology studies will provide data on the flow ofwater, one ofthe main parameters used in hydropower planning.
Precipitation and therefore water supply, varies widely between geographic locations, from season to season and from year to year. Each of these variations has a profound effect on the plmming for the control and use of water resources.
Al! planning in hydrology tenns is predicated on the assumption that the past history ofwater occurrence will be repeated in future. In other words, plans for control and use ofwater are based on the assumption that the precipitation and stream flow conditions which havc bcen observcd in thc past can be cxpccted to occur, within reasonable limits ofsimilarity, in the future, cxcept ifstream flows are modified by acts ofMan.
It is self-evident that planning and developing water resources cannot always be delayed for a long period of observation and record accumulation. On the other hand, the hazards of overdevelopment and faulty designare equally evident. There are many examples ofprojects which failed to reach anticipated goals because oftragic structural failures attributable to insufficient recognition of flood possibilities.
The problem is to determine the extent to which the expansion and interpolation of records are justifiable as a basis for planning and development. The agencies responsible for reviewing, approving and financing proposed projects must rely on the integrity, ability and judgement of the planners.
For the present purpose, surface water may be defined as water flowing continuously or intermittently in surface channels from definite sources ofsupply, and water flowing through lakes, ponds, and marshes as integral pa11s of a stream system. When water is stored in lakes or reservoirs, its movement is merely retarded or halted temporarily for future release.
Surface water and groundwater are el ose! y related, as surface water may become groundwater through percolation and groundwater may, through seeps, springs or wells become surface water.
The generation of hydropower does not imply consumption of water except as a result of incidental evaporation, especial! y from reservoirs. The extent to which power production will affect the use of water for other purposes will depend on a number of factors such as:
the location and capacity of power plants the nature of power to be produced, that is, run of river power, firm power or peaking power the amount of forebay and afterbay regulation provided and the relative prefcrence assigned to the uses of water for various purposes.

1 1
1
1 1
16
The determination of the water requirement for power production is probably best accomplished by "tria] and error" methods including incremental analyses and will require el ose coordination and integration of power studies and economic and social studies.
2.3.1. Hydrological data
Documented information on water resources in a region is normally availablc from central national agencies, i.e. Annual Data Books and other statistical records.
Thc rccords needed are historical series of daily or monthly flows. Short or fragmentary records may be filled in and extended by correlation tcchniques utilizing records from neighbouring areas.
Rainfall data Rainfall data are used to support fragmentary flow data. The records needed are historical series of monthly and annual totals of rainfall.
For various reasons, the proper estimation ofrainfall representativc for a broader area may Jead to very approximate results.
Rainfall (mm/year) can be turned into flow (m3fyear) when the characteristics ofthe catchment area are known. However, this procedure is not advisablc unless for preliminary estimates and when no other flow data are available.
Supp/ementmy gauging For project identification and studies at reconnaissance Jevel, an approximate estímate ofthe river flow is normally sufticient. When moving on to feasibility designs for dams, waterways, electro-mechanical equipment and, in particular, the calculation of energy production, a probable seasonal distribution of flow has to be established.
lf no previous records of flow exist ofthe river to be developed, or from a catchment close by, the alternative approach is to establish a short-term river gauging station in the near proximity of the si te for the proposed hydropower project. This requires measurements to be carried out, manually or by automatic equipment, over a period of 1-2 years.
Establishment of j/ow records Short-term records will be related to long-term observations of flow or precipitation from a si te within the same hydrological region. By modern statistical correlation techniques one is able to extend the observed records toan acceptable period of time.
In general, rainfall measuring stations have been in operation much Jonger than river flow measuring stations, and may therefore be used as means of extending a short tenn flow record.

17
2.3.2. Design Flows
The river flow characteristics to be developed and assessed are:
Overall average flow Seasonal distribution of flow Minimum flow Design flood flow
The o vera// average .flow When starting investigation of water resources, the state of the hydrology data is normally one of the cases listed below. The mcasures to be taken are indicated in each case:
1) Flow records ha ve heen estahl ished near thc project si te: The average recorded llow is transposed to thc project si te (intake) after adjusting for difference in catchment sizc.
2) Flow records ha ve been established in an adjacent river: The average recorded llow is transposed to the project si te after adjusting for difference in catchment size. lfreliablc rainfall rccords are availablc for the two catchments, corrections are made for possible differences in rainfall distribution.
3) No flow records exist in the arca: The estimated average flow has to be based on measured or estimated rainfall, multiplied by the appropriate runoff factor for the catchment. Supplemcntary gauging is promptly initiated lo obtain records for design.
The seasonal distribution of .flow The seasonal distribution ad described by the records observed in the river itself oras transposed from adjacent catchments is norrnally adequate for simulation of energy production.
1 f the se heme is run-of-river, daily flow figures should be sought during the flow record establishing process. Monthly values might overestimate the energy production by as muchas 10-20%.
The minimum.flow The minimum flow and its statistical prohability can be cstimated by analysing Jow flow records from thc region. Small catchmcnts have very specific Jow flow conditions. These can only be determined by direct measurements in the river concerned.

18
Flows Records of stream discharge provide the basic information for most water resources studies. The records should be continuous for a period of time which will be typical for the conditions to be anticipated in operating the project. For a project where the use of water by direct diversion from an unregulated stream is planned, a prolonged period of critically low flows willlimit the extent to which a dependable water supply can be furnished. A period corresponding to the critica! period should be analyzed in the investigation.
If a project is envisioned to include storagc reservoirs to regulate the varying stream tlow so that they approach average conditions, a period should be selectcd for study which includes a period of critically low tlows preceding and following the critica! years. Similarly, ifflood control is included as a function ofthe project, the study period should include a period of abo ve normal stream flows.
Run-off estima/es Estimates can never be cmployed as fui! substitutcs for records of stream flow. However, in sorne instanccs where there is an urgent and immediate need for a project, accurate, well founded and reliable estimates may be acccptable. Thcre are many methods of estimating runoff. Thcir accuracy is dependen! u pon the accuracy and uniformity ofthe available data and the ability and judgement of an experienced observer in detennining conclating factors which will produce a realistic synthetic record.
Good practice requires primarily the use of the nearest or most representative station record as a correlating factor, extending operations to more distan! stations as necessary. lt is frequently possible to obtain better estimates by independently refening to two stations and comparing and adjusting thc results obtained. In selecting stations for correlation, recognition must be given to al! factors which relate to runoff, such as exposure to stonn movement, depth and character of soils, vegetation cover, pattern of land use, topography, altitude, etc.
Reconstructions ofjlows A second type of study goes beyond the determination of historical stream flows. Often a prolonged period ofrecorded or estimated flows will reflect changing conditions ofwater use or water management. For example, the observed stream flows during the latter part ofthe record may have been influenced by diversions, storage or other regulation not experienced during the earlier parts of the record. In order to provide a common base, it will be necessary to adjust the historically recorded flows to conditions which would have prcvailed throughout the study period. These may be any preselected conditions; however, it is usually more convenient to adjust al! records to virgin or undepleted conditions.
Consumption o.f water, evapotranspiration The sum of the vol u mes of water used by vegeta ti ve growth in a given area in the transpiration or building of plant tissue, and that evaporated from adjacent soil, snow or intercepted precipita! ion on the area in any specified time is callee! evapotranspiration.

19
Loss of water through evaporation and seepage are items to be considered in water resources planning. Estimates of probable evaporation losses should be made by reference to actual records of evaporation pans with adjustment to evaporation from a free water surface. If evaporation records are not available, analytical estimates should be based on the relationship to other meteorological factors for which records are available.
2,3,3, Floods
Flood studies in feasibility investigations involve those phases of hydrology, meteorology and statistical analysis which perta in to the estimation of tlood vol u mes, discharge rates, duration, stage and frequency under hypothetical conditions.
lt is not the purpose ofthis section to discuss the detailed procedures and techniques of tlood studies, but rather to present the nature and scope of the studies needed. The study of tlood constitutes a highly specialised branch of hydrology and should be conducted under the close supervision of a well qualified tlood hydrologist.
Flood studies will be needed for two general purposes:
(1) Flood control, where a principal or incidental project function may be protection of Jand, communities or other economic values from recurring tlood damage.
(2) Hydraulic design, with the objective of providing information for the safe design and construction of dams and spillways, di k es or other structures.
Flood routing The process of progressively determining the shape and timing of a flood event as it passes successive points along a stream is known as "flood routing". Ifthe only detention or storage of the flood is that provided by the stream channel or valle y flooding, the process is called "stream routing". Ifthe tlood wave is passed through a reservoir, the process is called "reservo ir routing".
Severa! methods of flood routing have been developed. Although the various methods may differ in details, they are basically alike in that they fumish solutions for the fundamental equation: "inflow equals outtlow plus change in storage for a unit of time".
In routing studies, sound judgement should be applied in a conscientious effort to appraise correctly the conditions which are Ji k el y to prevail at the design tlood. In tropical or sub-tropical regions, the most advcrse condition would be the onset of the flood following a prolongcd pcriod of heavy precipitation and run off.
Under such adverse conditions, soils would be asswned to be saturated and storage facilities full to capacity, in which case the tlood would impinge on the structure site or natural channel with a mínimum ofnatural dispersion or retardation.

20
In high altitudes, or regions subject to heavy snows and freezing temperatures, a condition of frozen soils and sudden snow melt occasioned by a warming trend might produce similar critica! conditions.
In reservoir routing studies, the outflow during the passage ofthe flood may, under proper circumstances, includes the discharge of service outlets as well as spillway discharge. Flood retardation with associated reduction in peak discharge may be considered ifthe cost ofproviding superstorage for this purpose is less than the cost of greater spillway capacity.
Diversion during construction When hydraulic structurcs, dams or similar constructions are to be built in a river, it will be necessary to divert or otherwise control the normal stream flows and such floods as may be anticipated during the construction period. For this purpose, the designer should be furnished with flood hydrographs for anticipated floods with frequencies of 5,1 O and 25 years. For extreme! y hazardous conditions, larger floods may be considered.
Hydraulic design studies Any structure or work which changes the regimc of a stream will affect orbe affected by the passage of flood and adequate consideration should be given to floods in the design of such structurcs and works. Nonnally the designer will be concerned with the retcntion or safe passagc of the flood both with respect to the safety of the structure itself and with a view to minimising the flood hazard in the downstream reaches.
Designjlood The tenn "design flood" refers to the flood hydrograph or peak discharge value finally adopted as the basis for design of a particular project or section thereof after full consideration has been given to flood characteristics, frequencies, potentialities, and the economic and other practica! considerations entering into selection of the design discharge criteria.
The design flood estimate adopted as a basis for determining spillway capacities for Jarge dams, failure of which would result in disastrous property damages or hazards to life, should correspond to the maximum probable flood.
In sparesely developed areas or under other conditions where the risk ofloss oflife or widespread property damage resulting from failure of the dam structure, or overtopping of dikes is not serious, the design flood selected may be somewhat less than that for maximum probable flood. The magnitude of the design flood will be influenced by economic considerations such as balancing the construction and maintenance costs ofthe spillway and other protective works against the cost of replacement or repair of damage to the structure arising from the passage of excessive floods.

21
When the construction of a dam or other works is planned in such relation to urban or rural areas that its failure would probably result in serious losses of human life or widespread property damage, the structure should be designed to accomodate the maximum probable flood. In this case, the design flood and maximum probable flood are the same.
The design flood and its statistical probability can be estimated by analysing flood records from the region. When relevant flood records are not available, the Rational Formula can be used, incorporating the size ofthe catchment, the rainfall intensity and an estimated fraction for run off.
Large reservoirs will reduce flood peaks. For the dimensioning of spillways and intakes it is necessary to describe the inflow pattern. There also are methods for designing synthetic diagrams for such floods.
2.3.4. Methods of analysis
Before hydrologic data can bccome meaningful to the engineer, they must be processed. In the following sorne general procedures of analysis which are particularly suitable for the study of runoff variability for the design of storage reservoirs are discussed.
Dura/ion curve When the values of a hydrologic event are arranged in the order of their descending magnitude, the per cent of time for each magnitude to be equalled or exceeded can be computed. A plotting of the magnitudes as ordinales against thc corresponding per cents of time as abscissas results in a duration curve.
The slope ofthe duration curve depends greatly on the observation period used in the analysis. Daily data will yield a much steeper curve than annual data as the latter tend to group and smooth off the variations in the shorter-interval daily data.
Establishment of a annual flow-duration curve based on daily data is illustrated in Fig. 2.2 a. It is convenient first to compute the frequency data by tabulating the number of days for which the daily discharge has been observed between chosen limits, as indicated in the figure. The shape of the resulting frequency graph is of course influenced by which discharge intervals which are chosen for the analysis. The duration curve is established as the commulative curve of the frequency graph.
The annual duration curve does not give any information asto which time ofthe year a specific magnitude of flow occurs. This is an importan! matter in river regulation studies and is illustrated in Fig. 2.2. b. The two different hydrographs shown in the figure produce the same duration curve. The first case requires larger storage capacities for water than the second with two distinct flood seasons. Reservoir capacities can in the latter case be utilized twice ayear and seasonal duration curves should be established.

22
Duration curves for different years may vary considerably and it is therefore necessary to construct average curves. There are severa! ways of computing such curves and the result will differ greatly depending on the method used in the computation.
Fig. 2.3. illustrates two types of average curves. Curve a is defined as !he average dura/ion curve compuled as !he average duralionfor given discharges. This curve will show the highest and lowest flow registered during the entire observation period. The duration of such extremes will, however, be short and the curve will get a comparatively steep gradient towards the extreme high and low flow. The curve will not resemble any ofthe single annual curves from which it is derived.
Curve b is defined as !he average dura/ion curve compllled as !he average discharge for given duralions. This curve has the same shape as the curves for the individual years and it will often be possible to find a curve for a single year which nearly coincides with the average curve. Curbe b shows at its extremes the average high and average low flow. It is less steep than curve a.
Fig. 2.4 shows a typical average flow-duration curve (curve a). lf the flow is to be regulated by a maximum draft of, say qr, at all time, the regulated flows computed on the basis of a given storage function can be used to construct a regulated flow-duration curve as shown in Fig. 2.4. 1 f there were no evaporation los ses or leakage of water, the area below the unregulated curve and above the regulated curve should be equal to the area below the regulated curve and above the unregulated curve. It can be seen that there will be excess ofwater about 37 per cent ofthe time.
The Summation Curve (Mass Curve) The summation curve ( or mass curve) is a method that can be used to study the effect ofvarious storage capacities provided for the development ofa waterpower project. lt is a graphical method that has been extensively used in Norway up to recent years. The method is still used but other simulation methods which require extensive use of a computer have gradually taken o ver, especial! y for complex water power systems.
The summation curve gives the accumulated discharge for a river-gauging station from a set time which is usual! y chosen as at the commencement of the observations. Daily discharges are added together in a suitable unit, selected in accordance with the size of the run-off. Commonly used units are millions or thousands of cubic metres. The curve is plotted with time 1 as abscissa and the accumulated discharge Q as the ordinate.
The curve is an integral curve, and if q denotes the rate of discharge, Q can be expressed as follows:
From this can be derived q= dQ dt

23
The rate of discharge is thus expressed by the slope of the tan gen! at any point of the curve. The average discharge between two arbitrary points on the curve (tm, Qm), and (tm+ 1, Qm+ 1) will be accordingly:
q = Qm+l- Qm tm+ 1 - tm
Fig. 2.5 shows three successive "water regulation years". This is a time unit commonly used in hydrology when analyses are carried out on these curves. A water regulation year has no fixed length. lt may vary from year to year and may even exceed ayear depending upon the designcd degree of regulation and the annual distribution of runoff. lt may therefore be defined as a period of time from the beginning of a regulation in one year to the end of that regulation.
In Fig. 2.5 a line is drawn from the first mínimum turning point (t¡, Q¡) to the foUJ1h (14, Q4). This represents the average discharge for the three complete regulation years and can be expressed as follows:
q =tan a=
At all points where the tangent to the curve is parallel to this line, the discharge is equal to the three-years average. A steeper slope of this tangent indicates a higher discharge than the three-years average discharge and vice versa. lt will be evident that if the river goes dry, the curve will be horizontal during that period.
1 f the observation period is two or three years only, the curve can be plotted as shown in Fig. 2.5, but if data extend over a longer period, !he curve cannot be fitted within the limits ofthe paper. In such cases it can be plotted as the accumulated sum ofthe deviations from the mean. The main trace of the curve will thus be horizontal and it can be plotted on a roll of graph paper (Residual mass curve).
Regula/ion curves Regulation curves are a convenient too! to evaluate the effect o fa reservoir on a regulation. The principie with a regulation curve is illustrated in Fig. 2.6. A certain reservo ir with capacity S is filled up during the high water season. This storage is depleted during the following low water period to obtain a certain regulated discharge qr. By varying S and compute the corresponding values of qr, we can construct a annual regulation curve. An example on annual regulation curves is given in Fig. 2. 7. Each curve starts with the mínimum observed flow in the regulation year, corresponding to zero storage. The curve ends with thc storage required to obtain a steady regulated flow the whole regulation year.
As illustrated in Fig. 2.7, differcnt years produce highly different regulation.curves. This means that the same storage corresponds to different regulated flows during the observation period.

24
Fig. 2. 7 gives figures for the regulation curves in percentage of the average. Storage capacity is calculated as a percentage of the annual average volume of water recorded in the river, and the regulated flow is given accordingly in percentage of the average rate of flow. This is done in arder to facilitate extended use of the regulation curve. Experience has shown that catchments of approximately the same hydrological character produce nearly equivalen! regulation curves when expressed in percentage values. This often permits the use ofthe regulation curve in an adjacent area and for other locations in the same river course.
When observations are available for a great number ofyears, the basic data for the regulation curves can be grouped in various ways, see Fig. 2.8. Under such conditions !he establishment of the "median curve" will be found to be practicable. The available years of observations are then grouped into two equal parts ofwhich the one half (50%) shows more-favourable and the other half (50%) Jess-favourable regulation conditions than the median curve. This curve is applied in cases where a water deficit can be permitted in halfthe number ofyears.
The "leas! favourable regulation curve" is very importan! in many instances, when great safety is required as in the case of a water-supply scheme. This is determined as the upper enveloping curve for the total series of available data.
Depending upon the degree of safety required in water estimates, various kinds of regulation curves can be established. A 90% safety curve or "defining curve" is commonly used in Norway. This means that the power plan! in question, under the suggested river regulation, will not receive enough water in one out often years to yield full capacity.
2.3.5. Operation studies
Operation studies of water resources are undertaken in arder to make it possible to visualise the manner in which the project plan will function under anticipated conditions. Basically, operation studies are a simple accounting for water income, losses, expenditures (use) and reserve balance (storage). In its final fom1, the operation study presents a picture of the past and water requirements assumed for the future.
In the course of formulating the project plan, a trial operation plan will be needed for the purpose of analysing and adjusting the various elements of the plan to pro vide the optimum development ofthe water resources. The amount and reliability ofthe basic water resource information needed for the operation studies have already been discussed.
Period ofstudy Operation studies for feasibility investigations are usually made on a monthly basis. However, under critical conditions and for spccial analyses, daily operation may be needed. The study period to be used will be partially dependen! on the availability of stream flow records and other data. The period should be long enough to represen! a cycle of operations realistically and include a period of critical flows which will demonstrate the abilitics ofthe project adequately. ·

25
For a direct flow or "run ofriver" project, the critica! period for water use will usually be a period of abnormally low flows.
Where storage is a project function, the period should be long enough to demonstrate the optimum use of storage facilities. l f the project visualises long term holdover storage, the study period may include various cycles of low flow in order to detetmine the physical and economic limits of carryover storage.
Reservoir Opera/ion Reservo ir storage is usually required to approach maximum utilisation of stream flows. The primary purpose of storagc is to regula te the stream flow to meet, as accurately as possible, the demands for water by the various uses. The extent to which it is possible or desirable to provide regulation is determined by the reservo ir operation studies and economic considerations (cost of dam, spillway etc.). This particular process is often called reservoir optimisation.
There are two general types of storage reservoirs:
"On-stream" reservoirs located on the stream which they regulate, and "Off-stream" reservoirs located away from the main stream and supplied by diversions from the main stream or other rivers.
The principal difference between the two types is in the inflow characteristics. The inflow to off-stream reservoirs is restricted by the capacity ofthe diversion works, and limited to the surplus water in the main stream. Normally it will not be feasible to divert full river flows at flood stages. ·
The main elements of the reservo ir operation study will be:
total inflow storable inflow (total inflow less flow which must be passed to meet previously established water rights or uses) reservoir losses (evaporation, lranspiration and seepage losses) releases to satisfy the requirements of the various project purposes and reservo ir spills.
Under some circumstances, seepage losses and reservoir spills may be used to help meet commitments to earlier water rights.
In the operation of reservoirs in which flood control is a primary purpose, the space allocated to flood control must be considered inviolate where the flood occurrence cannot be predicted. Where flooding is seasonal and predictable, flood control space may be encroached upon for other purposes provided sufficient space can be.safely evacuated as needed lo handle the predicted flood. Such joint use is particular! y aplicable where the flood volume is dcrived from snow melt which can be predicted from surveys.

26
Where sedimentation is severe, allowance should be made in the operation study for its encroachment on reservo ir space. Although the reservo ir may have becn dcsigncd without reduction ofusable capacity during the economic life ofthe project, the accumulation ofsediments willnccessitate the operation ofthe rescrvoir at succesively higher levels. This change in operating leve! will be reflected in greater evapora! ion and other losses. In the operation study, these changes in operating conditions may be accounted for by periodic adjustments or by assuming an average condition for the period of analysis.

27
3. DESIGN OF CIVIL WORKS
3.2. Dams
Regulation of run-off is an importan! aspect of hydropower projects which must be addressed early in the planning phase, as a part of project formulation. It is practica! to settle this issue early in the planning process as regulation of tlow has such a large intluence on other project features.
When variation in run-off is considerable regulation becomes necessary. It is used to improve utilization of the tlow by reducing spill and to adapt the tlow to power supply system requirements. The need for rcgulation is thus set by variation in run-off over the year as well as system demand and demand pattems.
Flow regulated to match the requirements of the supply system is a great advantage and is associated with increased value ofthe generated energy. Storage ofwatcr is needed and storage vol u me is a prerequisite for regulation of tlow. Storage reservoirs ofthe required size must therefore be provided and included in the project plans if regulation is a project feature.
Regulation reservoirs are formed by damming a river or valley, by tapping of an existing lake or by a combination of both. In either case the environmental impacts are considerable, particularly in the case of dammed reservoirs. Damming involves inundation of land and thus crcatc larger impacts than lake tap reservoirs if such are yiable alternatives.
I fa storage reservo ir is not accepted, which often is the case, the option left is a run-ofriver development, with this altcrnative's restriction in respect to utilization ofthe power resource.
3 .2,1. Types of dams
In the most general scnse, a dam may be defined as a barrier built across a water course for impounding water. This dcfinition implies no restrictions upon the purpose, materials used, or size of thc barrier. Thus, si lis and weirs could al so be covered undcr the general umbrclla providcd by thc word "dam". In practice, however, dams are considered barrier structures, more complex than si lis and weirs, and thcy require for their design, construction, operation, and maintenance the concerted effort of a number oftechnical disciplines.
Dams can be classified according to their purpose, the type of material used in their construction, and their geometry. Dams are built for power production, water supply, tlood and river control, pumped storage, irrigation, recreation, and industrial waste disposal purposes. They may be conceived for permanent (long-term) life, or temporary operation. Regarding construction matcrials, dams may be classified as follows:

28
Fill dams (Embankment dams) of which there are a variety of types:
- Earth dams, made complete! y out of earth from borrow areas near the dam si te, with or without a rock facing as erosion protection.
Rock fill dams. The dam body is normally made of quarried rock providing the weight and incorporating a watertight medium such as;
Clay core, protected on each side by sand/gravel filters. Normally such cores are placed in the middle ofthe dam body, sloping downstream.
Concrete. A vertical wall ofreinforced concrete placed centrally in the dam body, oran upstream concrete slab, also reinforced.
Asphalt. An upstream asphalt concrete slab placed continuously in severa! layers or a central asphalt concrete core, placed continuously by special equipment and protected by filter on each si de.
Concrete dams Ofconcrete dams there is a multitude ofvariation, ofwhich only the main types in use are mentioned here:
- Gravity dams, usually made of mass concrete, are u sed for normal foundation conditions.
- Among concrete gravity dams a new type, the "rollcrete" variety has emerged in recen! years. For these dams, fill dam construction techniques are used. Stiff lean concrete, placed by earth moving equipment in layers, is roller compacted. Formwork is not required.
Arch dam, are thin dam structures exerting high pressures on the foundations. They may be simple or double curved, require good foundation conditions and have special damsite topography requirements as their curvature distributes forces to the abutments.
Further variations within the above broad classifications are presented in Table 3.1, which is based on the definition of the Technical Dictionary on Dams (ICOLD) Cross section oftypical dams are presented in Figs. 3.1 through 3.3.

29
Table 3.1 Classification of Dams by Construction Materials ' ...
Embankment dams Earth dam Embankment dam in which more than 50 percent of thc total Any dam constructed of excavated natural vol u me is formed of compactcd fine grained material obtained. matcrials or of industrial waste matcrials from a borrow arca.
Rockfill dam Embankment dam in which more than 50 percent of the total vol u me is composed of compactcd or dumped pervious natural or crushed stones.
Hydraulic-fill dam Embankment dam constructed of materials, often dredged, which are conveycd and placed by suspcnsion in water.
Industrial wastc dam Embankment dam, usually built in stages, to creatc storage for thc disposal of waste products from industrial processes. Embankmcnt materials may be conventional natural soils or products from mining operation. Material placemcnt can be cither by hydraulic methods or by standard cmbankment compaction methods.
Masonry dams Masonry dam Any dam constructed mainly of stone, brick, or concrete blocks jointed with mortar.
Rubble dam A masonry dam in which the stones are unshaped or uncourscd.
Crib dam A dam built up ofboxcs, cribs, crossed timbers, or gabions, filled with earth or rock.
Concrete dams Gravity dam Arch gravity An arch dam only slightly thinner than a
Any dam constructed of rcinforced or A dam which re líes on its gravity dam
unrcinforccd concrete wcight for stability Curved gravity Dam curved in plan view Cellular Outward appearance of a gravity dam but
of hollow construction
13uttress darn Flat slab dam or A buttress dam in which the upstrean1 part A dam consisting of a Ambursen dam or is a relatively thin nat slab usually made watcrtight face supported dcck dam of reinforced concrete at intervals on the down· strcam side by a series of Arch buttress dan1 A buttress dam curved in plan. buttresses or curved buttrcss
dam
Multiple-arch dam A buttrcss dam the upstream part of which comprises a series of arches.
So lid head buttress A buttrcss dam in which thc upstream end dam of cach buttress is enlarged to span thc
gap between buttresses.
Arch dam Constant-angle An arch dam in which the angle subtended A concrete or masonry arch dam by any horizontal section is constan! dam which is curvcd in throughout the wholc height of the da m. plan so as to transmit thc majar part of the water Constant-radius An arch dam in which evcry horizontal load to the abutmcnts arch dam segment or slice ofthe dam has approxi-
mately the same radius of curvature.
Doublc-curvature An arch dam whicl} is curved vcrtically as arch dam wcll as horizontally.
RCC Dams Darns built with concrete of no·slump consistency, and compactcd with vibratory rollcrs.

30
Gravily dams Prior to the middle ofthe nineteenth century, dams were designed by rule ofthumb with little concern for the principies of mechanics of materials, and, as a result, they were usually much more massive than necessary.
Fig. 3.4 is a simplified free-body diagram of !he cross section of a gravity dam. The forces shown are the weight for the dam W, the horizontal components of hydrostatic force Hh, the vertical components ofhydrostatic force Hv, uplift U, ice pressure Fi, the increased hydrostatic pressure caused by earthquakes Ew, and the inertia force caused by the carthquake on thc dam itselfEd. The vectorial resultan! ofthese forces is equal and opposite to R, the equilibran!, which is the cffective force ofthe foundation on the base of the dam. A gravity dam may fail by sliding a long a horizontal plane, by rotation about the toe, or by failure ofthe material. Failure may occur at the foundation plane or at any higher leve! in the dam. Sliding (or shear failure) will occur when the net horizontal force above any plane in the dam exceeds the shear resistance developed at that leve!. 1t is good construction practice to step the foundation of a dam to increase resistance to sliding. Overturning and excessive compressive stress can be avoided by selecting a cross section of proper size and shape. Typical working stresses employed in the design of concrete dams are about 6 MPa for compression and O MPa for tension. Tensile stresses are avoided by keeping the resultan! of all forces within the middle third ofthe base.
Keyways, Fig. 3.5,are provided between sections to carry the shear from one section to the adjacent one and make the dam actas a monolith. Metal or plastic water stops are also placed in the vertical construction joints near the upstream face to preven! leakage. lnspcction galleries to pcnnit access to the interior ofthc dam are formed as thc concrete is placcd. Thcsc galleries m ay be necessary for grouting operations, for operation and maintcnance of gates and val ves, and as intercepting drains for water which seeps into the dam.
When concrete sets, a great deal of heat is liberated, and the temperature of the mass is raised. As the concrete cools, it shrinks and cracks may develop. To avoid cracks, speciallow-heat cement may be used. Very lean mixes are also used for the interior ofthe dam. In addition, the materials which go into the concrete may be cooled before mixing. Occasionally, further cooling is accomplished by circulating cold water through pipes embedded in the concrete, although this is expensive and is generally used only on large gravity dams.
Arch dams An arch dam is curved in plan and carries most of the water load horizontally to the abutments by arch action. The tluust thus developed makes it essential that the sidewalls of the canyon be capablc of resisting the arch forces.
Structural analysis of arch dams is complex, and the computations are lengtby. In principie an arch dam is visualized as consisting of a series ofhorizontal arches transmitting thrust to the abutments ora series ofvertical cantilevers fixed at the foundation, Fig. 3.6. The horizontal componen! ofthe water load is resistedjointly by the arch and cantilever action. The distribution oflhe load bctween thc are hes and the

31
cantilevers is usual! y determined by the trial-load method, which begins with an assumption as to the load distribution. Near the bottom of the dam most of the load is carried by the cantilevers, while near the top the arches take more ofthe load. After assuming a division of the load, the resulting deflections of the arches and the cantilevers are computed. The deflection of the arch at any point should equal the deflection ofthe cantilever at the same point. Ifcomputed deflections are not equal, new loads are assumed until a distribution is found which produces equal arch and cantilever deflections at al! points. Stresses in the dam and foundation can then be computed on the basis of this load distribution.
There are two main types ofarch dams, conslanl-center and variab/e-center, Fig. 3.7. The constant-center arch dam, also known as the constant-radius dam, usually has a vertical upstream face, although some batter may be provided near the base of large dams. Intrados curves are usually, but not always, concentric with extrados curves.
The variable-center arch dam, also known as the variable-radius or constant-angle dam, is one with decreasing extrados radii from top to bottom so that the included angle is nearly constan! to secure maximum arch efficiency at al! elevations. This design often results in an overhang of the upstream face near the abutments and sometimes ofthe downstream face near the crown ofthe arch. The variable-center dam is bes! adapted to V -shaped canyons since arch action can be depended u pon at al! elevations. The constant-center dam is sometimes preferred for U-shaped canyons as cantilever action will carry a large portion of the load at the lower levels. The formwork for a constant-center dam is much simpler to construct, but the increased arch effíciency of the variable-center dam usual! y results in a saving of concrete.
The same forces which act on gravity dams also act on arch dams, but their relative importance is different. Because ofthe narrow base width ofarch dams, uplift pressures are less importan! than for gravity dams. However, interna! stress caused by ice pressure and temperature changes may beco me quite importan! in arch-dam design.
The simples! approach to arch analysis is to assume that the horizontal water load is carried by arch action alone. Most early arch dams were designed on this basis. Fig. 3.8 represents a free-body diagram of the forces in the horizontal plane acting on an arch rib ofFig. 3.6. Since the intensity ofhydrostatic pressure is p = yh, the total downstream componen! of hydrostatic force on a rib of unit height is
/Íh"' yll2rsin;
This force is balanced by the upstream componen! of the abutment reaction
Rr = 2Rsin (3_ 2
Since '[.F,. = O,

32
2R sin~= 2yhr sin~ 2 2
or R =yhr
If the thickness t og the arch rib is small as compared with r, there is little difference bctween the average and maximum compressive stress in the rib and a"' R/t. The required thickness ofthc rib is
yhr 1=-
<Jw
Where a ... is the allowable working stress for concrete in compression. This indicates that the thickness ofthe ribs should increase linear! y with distance below the water surface and that for a given water pressure the required thickness is propportional to the radius of curvature.
When minimizing the volume of concrete required, theory gives 8 = 133°34' for a rib of mínimum volume. This is the reason why a constant-angle dam can be designed to require less concrete than a constant-center dam. In practice the central angles of arch dams vary from l 00 to 1400.
Rigorous analysis of an arch dam involves many factors not considered in the preceding approximate analysis. The cantilevers are actually trapezoidal in cross section, and their deflection includes that dueto shearing action as well as bending. Deflection of arch ribs is caused mainly by the water load, but it is al so greatly affected by temperature changes. Shrinkage and plastic flow of the concrete must al so be considered. Yielding of the foundation or abutments affects the structural behavior of arch dams. If thc foundation yields relatively more than the abutments, cantilever action is suppressed, while if the boundary conditions are reversed, arch action plays a lesser role.
The foundation of an arch dam must be stripped to sol id rock and the abutments should be stripped and excavated at approximately right angles to the line of thrust to preven! sliding of the dam. Seams and pockets in the foundation and abutment are grouted in the usualmanner. Since the cross section of an arch dam is relatively thin, care must be taken in thc mixing, pouring, and curing ofthe concrete in order to secure adequate resistancc to sccpage and weathcring. A !ayer of mortar is usual! y placcd between lifts to cnsure better bond. Small arch dams are provided with only radial construction joints, while large arch dams ha ve circumferential joints as well. All joints must have keyways, and water stops must be provided to prevent leakage. To minimize temperature stresses, the closing section ofthe dam is poured only after the heat of setting in the other sections is largely dissipated.

33
Buttress dams A buttress dam consists of a sloping membrane which transmits the water load toa series of buttresses at right angles to the axis of the dam. There are severa! types of buttress dams, the most importan! ones being thej/at-slab (Fig. 3.9) and the multip/earch. These differ in that the water-supporting member in one case is a series of flat reinforced-concrete slabs, while in the other it is a series of arches which permit wider. Buttress dams usually require only one-third to one-half as much concrete as gravity dams ofsimilar height but are not necessarily less expensive because ofthe increased formwork and reinforcing steel involved. Since a buttress dam is less massive than a gravity dam, the foundation prcssures are lcss and a buttress dam may be used on foundations which are too weak to support a gravity dam. Ifthe foundation material is permeable, a cutoff wall ex lending to rock may be desirable. The upstream faces of buttress dams usually slope at about 450, and with a full reservo ir a large vertical componen! of hydrostatic force is exerted on the dam. This assists in stabilizing the dam against sliding and overturning. The first reinforced-concrete slab and buttress dam was built by Nils Ambursen in 1903, and this type of dam is often called an Ambursen dam.
Buttress dams are subjected to the same forces as gravity and arch dams. Because of the slope of the upstream face, ice pressures are not usually importan! as the ice sheet tends to slide up the dam. Uplift pressures are relieved by the gaps between the buttresses. The total uplift forces are usually quite small and can generally be neglected except when a mat foundation is used.
Embankmenl dams A rockfill dam is defined asan embankment dam comprising ofmore than 50% by volume of fill obtained from rock quarry or rock excavation or from natural stones or boulders (JCOLD).
An earthfill or grave! fill dam is defined as an embankment dam comprising of more than 50% by volume of fill obtained from clay, silt, sand, or grave! borrows (ICOLD).
Moraine or glacial till, which Norway possesses in abundance, has been the predominan! material u sed in the construction of the impervious element. However, in the past decade asphaltic concrete cores have come increasingly into use. They are less susceptible to adverse weather, which makes construction work easier, and potential scars in the landscape from borrow pits are avoided. In Norway today, there is a continuous process of research and development in the design and construction of rockfill dams.
Various terms used in connection with embankment dams are explained in Fig. 3.1 O.
Impervious elements may be designed by use of earth, clay, concrete, asphaltic concrete, bitumen or even steel, wood and more recently synthetic membranes. The impervious element may be cmbcdded within the fill or placed on the surface of the

34
upstream slope ofthe embankment. Dcpending on the type and placement ofthe impervious element, the dam may for instance be characterized as a rockfill dam with central moraine core, ora rockfill dam with concrete facing. Yarious types ofrockfill dams described by cross-section are shown in Fig. 3.11.
Most Norwegian embankment dams are rockfill dams with impervious core of moraine. Moraine or glacial till is a scoured material, dcposited beneath the ice during the last glaciation, it is a broadly graded mixture of boulders, stones, grave!, sand, silt and clay.
A typical rockfill dam is shown in Fig. 3.1 O. The cross-section comprises of: 1) impervious core ofmoraine, 2) filter zones of sandy grave!, 3) transition zoncs of fine blasted rock, and 4) supporting shells of blasted rock.
Moraine cores are so widely used as the impervious element of embankrnent dams in Norway because deposits of loose material in mountain areas where most dams are situated, usual! y consist of either glacial ti lis or fluvial deposits. The fluvial deposits are sand or grave! which may be suitable filter materials, but are too permeable for waterproofing. Moraine deposits on the other hand have the fines content required for materials of sufficiently low permeability.
In places where suitable moraines do not exist within an economic hauling distance fro the dam si te, other impervious materials ha ve to be employed. Examples of dams with various altematives are shown Íl\ Fig. 3.12. Marine clay, for instance, was used in the frontal blanket of the Manika Dam as shown on top of the figure.
Marine clay is found in areas raised above the present sea leve! after the last glaciation. In Norway, the land has risen most, about 220m, in the south-east. In other regions the rise varies from 25 m along the western coast to about 100m in mid-Norway and 25 to 75 m in the No1th.
In some cases it may prove economical to crush soft rock to sufficient fineness for use as impervious material. Crushed phyllite has been utilized for impervious cores in two dams in Western Norway.
Severa! dams ha ve impervious facing on the upstream slope ("frontal decks"). Materials used in the facings are asphaltic concrete (Yenemo ), wooden planks (Aursjo) and reinforced concrete (Grondalsvatn). During the 1980s severa! rockfill dams were built with a central core of asphaltic concrete.
A) Lille Manika Dam, frontal blanket of marine clay. Completed 1964.
B) Venemo Dam, frontal deck of 15 cm asphaltic concrete. Completed 1963.
C) Grondalsvatn Dam, frontal deck of cement concrete. Completed 1971.

35
D) Grasjo Dam, test section with stone-bitumen core. Completed 1969.
E) Styggevatn Dam, central core of asphaltic concrete. Completed 1990.
3.2.2, Geotechnical investigations for dam design
The failure of a full-storage reservo ir would result in considerable loss of life and prope11y. lt is, therefore, impcrative that thc retaining structurc be designed in such a way that the possibility of failurc is mini mal. 1\ safe dam requires that both the structure itself and the soil or rock foundation on which it is built are safe. lt is bccause of this requirement that extensive geotechnical invcstigations ata proposcd dam and reservoir si te should precede the design ofthe structure.
Severa! factors (economic, environmental, hydrologic, hydraulic) are considered in the selection of a reservoir si te from among a number of possible candidates. After the general reservoir si te selection is made, attention is directed to the study of the type of dam best suited to alternative dam si te locations. Geotechnical considerations strongly influence the latter decision. Questions relatcd to the characteristics of the foundation and its required treatment, embankmcnt volume, practicality of construction of embankment and appurtenant structures, and availability of construction materials need to be answered. Thesc questions cannot be resolved without adequate geotechnical information. The objectives of the geotechnical investigations are, therefore,
• To characterize the distribution and the cngineering properties (strength, compressibility, and permeability) of the soils and rocks which comprise the darn foundation and the abutments at alternative sites, and
• To study the extent and characteristics of available construction materials for embankments and for concrete
The scope and the cost of the geotechnical investigations vary from si te to si te, depending on the complexity ofthe geology and on the variability ofthe soil and rock foundations. They also depend on whether the project is in the feasibility, design, or construction stage. During the feasibility stage, geotechnical investigations must be undertaken at each si teto the extent that is necessary to permita fair comparison ofthe costs of differcnt types of dams on altcrnative sitcs. Once this phase is completed, and the type and location ofthe dam and ofthe appurtenant structures are defined, more detailed geotechnical information is obtained in order to proceed with the design of the facilities.
So urce of Infomwlion Asan initial step, available information concerning the si te area should be collectcd including topographic, geologic, ancl soilmaps ancl aerial and Landsat photographs.

36
A search should be m a de for those maps covering the areas of the reservoir, the dam si te, and the potential borrow areas. The location and elevation of exploratory boles, trenches, and pits and significan! physical features, such as rock outcrops, landslides, or roads, trails, etc., can be placed on the m a p. The topography of the storage basin is used to determine the reservoir storage volume availablc below various levels and the presence of any saddles along the perimeter of the reservoir. The topography of the dam si te can be used to estímate amount of excavation and embankment materials and to lay out the dam, appurtenant structures, and access roads.
Geologic maps are prepared for the region where the project is located and for the dam si te proper. The information and the detail provided by each are different. Severa! types of geologic maps are available. Maps showing a plan view of the bedrock in the ara is a bedrock geologic map. Generally such maps depict visible boundaries of rock formations and undifferentiated overburden. Surficial geologic maps differentiate the overburden according to its origin, such as stream alluvium and glacial or wind deposits. Structural geologic and tectonic maps indicate the location and characteristics of geologic faults and, generally speaking, of lineaments which can be recognized from physical features such as offset ofbeds and dikes; presence of gouge, or zones of badly fractured rock; or topographic features, such as linear trenches or sag valleys, offset alignment of rivers, and vegetation.
Related to structural geology is the issue ofthe seismic activity within the region. Catalogs of historie seismicity should be compilcd for the region for later study and correlation with structural geologic and tectonic maps.
Air photos are primarily used to identify surficial features: topography, drainage and erosion patterns, vegetative cover, landslides, lineaments, joint systems, and fault zones. In some cases, however, experienced individuals are able to interpret surficial features reliably to predict deep underground conditions such as the prescnce of karstic formations.
Explora/ion Methods Following the study of the information provided by maps and photos, a program of field exploratory work (including testing) can be prepared. This program should consist of a detailed field reconnaissance and mapping by engineers and geologists, and the execution of subsurface explorations, and soil and rock sampling, including boreholes, test pits, trenches, adits, geophysical surveys, in si tu soil and rock permeability, and strength testing.
Rotary drilling equipment is manufacturcd in a varicty of types from lightweight and highly mobile, to heavy, stationary units, and with capacity and attachments capable of drilling holcs in soils and rocks from lcss than 2 cm to more than 1 m in diameter. Undisturbed soil samplcs and rock cores can be rctricved from the boreholes. At the same time, the borings can be uscd for pcrmeability tcsting, density tests, modulus of deformation tests etc.

37
Open test pits and trenches are of great use for visual observation of stratigraphy, for perfonning tests, and for recovery ofsamples. These methods are highly recommended for dam foundation investigations and geologic fault studies, and are, in fact, a very expeditious method of sampling and observation in deposits containing gravels and cobbles.
Adits ha ve two advantages: they pennit the visual inspection of the subsurface soils and rock, and, if required, they allow thc performance of a variety of in si tu tests. The walls, floor, and roof of the adits can be mapped and photographcd, and the direction of scams, discountinuitics, and rock jointing observed. Adits are especially use fu! in the investiga! ion ofthe soil and rock conditions a long the abutments of a dam.
Geophysical Surveys are used to supplemcnt and extend infonnation obtained from borings, trenches, and adits. Velocities correlated with known stratigraphy can be used to delineate the thickness of overburden, zone ofrock weathering, unstable slopes, and variations in general stratigraphic trends. Geophysical surveys provide an invaluable means of obtaining data from which the low-strain compression and shear elastic moduli of soils and rocks can be calculated.
In many cases, where properly done, fíeld tests provide the bes! means to obtain highly reliable information on in si tu soil and rock prope1ties, either because a larger mass of material is involved in the fíeld determination or because of diffículties in obtaining good samples for laboratory testing. Typical examples include permeability tests (in pits or boreholes), defonnation tests, large shear tests, in si tu density of sandy and gravelly soils, and test fílls.
The procedures for laboratory testing of rock, soil, and aggregate are well developed. Equipment and procedures, standardized by internationally recognized associations, are available which provide means to identify and characterize the strength, compressibility, pcrmeability, durability, and in general the adequacy ofmaterials encountered in nature for use in the construction of embankment and concrete dams, and the study ofthe foundation materials at proposed dam si tes.
Because ofthe variety ofsubsurface conditions and the materials that may enter in the construction of dams, thc design of every ncw dam ca lis for individualized treatment. There are, howcver, certain "musts" that thc geotechnical investigations should address. For reference purposcs, Table 3.2 provides a unifíed view of importan! issues that mus! be addressed by the geotechnical investigations.

38
Table 3,2 A Checklist for Required Geotechnical Investigations
Objective of the investigation Comments
Rack foundations
Crushing and shearing strengths Adequate for small dams; possible exception; shales and siltstones. lnvestigate weathering and microcracks and fissures; rack strength in the laboratory may differ from mass-rock strength. lnvestigate extent, nature, and properties of clay seams, including residual strength, effect of saturation. lnvestigate brecciated zones.
Rack foundation characteristics Determination in the laboratory (modulus ofelasticity) and in situ mass-rock and residual stresses deformation as affected by presence of fissures, seams, etc. Residual stresses to be
determined by field testing.
Pcrmeability lnvestigatejointing, seams, and bedding in the field. Hydrologic investigations required for determining the nature of groundwater, whether nom1al, perched, or artesian. Perfom1 field-permeability tests in boreholes. lnvestigate presence of karstic formation, limestone, other cavities.
Active tectonic faults Studies to be done both at the dam site and within the reservoir arca. Carry out trenching to observe possible fault displaccment in Holocene deposits.
Soil foundations
Strength and compressibility Granular soils: requires determination of in si te densities and/or a field-test-correlatable densities with strength parameters such as standard penetration resistance, Becker penetration tests (for gravels), and cone penetration tests.
Fine-grained soils: primarily based on laboratory test data.
Penneability Proper definition requires an accurate picture ofthe stratigraphy, anda series of field-permeability tests (Lugeon, Packer) or well-pumping tests.
Construction materials
Location ldentify distance toda m site, access road; thickness of overburden to be wasted, excavation difficulties, water table difficulties, in situ moisture content, blasting characteristics (in the case ofrocks).
Properties Characterization ofthe engineering properties for use in embankment construction oras an aggregate for concrete is done in the laboratory.
Prior to, or during initial stages of, constn1ction test fills are often carried out to verify adequacy ofproposed construction procedures.
Properties to be investigated include gradation, plasticity, moisture/density relationships, permeability, static and dynamic strengths, compressibility, durability, chcmical makeup. Quality ofmaterials for preparation ofconcrete.

39
3.2.3. Selection of dam type
As far as technical feasibility is concerned, often more !han one type of dam is adequate for a selected dam site Jocation. The final selection, then, is either based on economic considerations, on preferences of the designer or owner, or on the decision of a consulting board. Following is a list of factors which the dam designer mus! consider in selecting the most appropriate structure for a si te:
• Topography • Dam foundation • A vailability of construction materials • Flood hazard • Seismic hazard • Climate • A vailable resources
Topography. Narrow valleys with high rock abutments favour concrete dams. Low rolling hills favour earth dams. Hydraulic fill dams are frequently associated with wide, tlat alluvial plains with minimal topographic relief.
Da m Foundation. Rock foundations, properly cleaned of weathered material and treated for water tightness, are ideal for any type of dam.
Dense sand-and-gravel foundations are adequate for all embankment dams, and for small concrete dams when proper seepage control measures are implemented.
Compressible silt and clay foundations preclude the consideration of concrete dams and require special care for rockfill dams.
Loose sand foundations in a seismic environment are subjected to potential seismic liquefaction and are inadequate for any type of dam. lfthe loose materials are excavated, or their physical conditions improved, then an embankment dam could be considered.
Available of Construction Materials. Materials are required for the construction of !he embankment ( core, shells, filters, slope protection) and manufacture of concrete. When adequate materials are available near a si te, embankment dams can usually be built ata lower cost !han concrete dams.
Availability of sands and gravels, but absence of impervious clays may favour the choice of a concrete dam. On the other hand, if an impervious soil is readily available, the design may favour a homogeneous embankment dam with a few interna! granular filters provided for seepage control.

40
Flood Hazard. The possibility of flooding during construction favours either a concrete type of dam ora rockfill dam with or without downstream reinforcing. Associated with flooding is the spillway requircment. Often the cost of constructing a spillway is high. For such cases, combining spillway and dam into one structurc (concrete dam) may be advantageous. In other cases, where the excavated material from a separate spillway can be used in the construction ofthe embankment, an earthfill embankment may be advisable.
Seismic Hazard. Potential fault rupture a long the dam foundation precludes the consideration of any rigid structures such as a roller-compacted or a concrete-type dam. Ernbankment darns with large zones of sand and grave! are recommended in these cases. Potentially strong earthquake ground motion may rule out the consideration ofrigid structures (concrete) or cmbankment dams built with loosely placed granular soils (hydraulic and tailings darns).
Clima te. Construction of embankment dams during the rain y season is often lirnited to the pervious zones, making rockfill dams more appropriate. During freezing weather, precautions must be taken to avoid damage to freshly poured concrete in concrete darns. Rockfill dams may prove to be cheaper to construct in severe clirnates.
Diversion Works. Valley configuration, hydrologic, and schedule considerations can often pose serious construction difficulties which require expensive works.
Available Resources. At sorne sites, neither skilled contractors for a specified construction nor adequate labour force may be available. For exarnple, a country rnay ha ve neither the experiencc nor thc cquipment necessary for the construction of a roller-compacted concrete dam or for the concrete face in a rockfill darn. In such cases, a simpler earth embankment dam rnay be more appropriate.
3 .2.4, Spillways
The spillway is designed to pass flows larger than can be used for hydroelectric generation. The importance ofthe spillway cannot be overemphasized. Most dam failures have occurred because the spillway was incapable of passing a particular flood, with the result that the dam was overtopped and breached. Many spillways with adequate capacity ha ve failcd bccausc severe eros ion occurred at the base of the spillway, resulting in damagc to thc spillway, the dam, or both.
Overtopping ofeaithfill darns will usually result in their breaching, unless the overtopping is of very short duration. such as that produced by runup of waves. Concrete dams may, howevcr, withstand modcrate overtopping providcd the foundation is adequate. Rockfill dams may withstand mínima! overtopping.
Frequently, two spillway structures will be provided. The first, a scrvice spillway, may be a small overflow concrete structure. This spillway will be designed to pass all small floods which produce no dangcr of overtopping the dam. A second spillway, an emergency spillway, may be locatcd offthc dam mid will be designed to supplement

41
the service spil1way during the 1arge design flood. Some damage should be expected if the emergency spillway operates.
The simples! and most dependable form ofspillway is an uncontrolled crest. lfthe design discharge for the spillway is large, the rcquired length ofthe uncontrolled crest may be very long. lfthe required crest length cannot be developed at the site, it may be necessary lo provide gates on the crest which control the flow, except when large flood flows must be passed. Flashboards, stop logs, rectangular gates, and radial gates are commonly used on small dams.
From the standpoint of operation, radial gates are easiest to opera te. The resultan! of pressure forces acting on the radial gate is normal to the circular surface, thus causing no moment about the trunion. Only the weight ofthe gate itselfmust be lifted when the gate is opened. Fig. 3.13 shows a typical radial gate installation.
Rectangular vertical gates can be constructed as roller gates, which makes it possible to raise them under fui! hydrostatic pressure. However, slide gates without rollers can be very difficult to operate under pressure because ofthe large friction forces developed. Fig. 3.13 shows a typical vertical gate installation.
Stop logs are nan·ow rectangular beams which can be placed in slots on the spillway eres! to raise the reservo ir surface. Because of friction in the slots, they are very difficult to install or remove under overflow conditions. They should not be used in situations where unexpected floods can occur, since advance warning is required to remove the flashboards prior toa flood. Fig. 3.14 shows a typical stop-log installation.
Flashboards consist of individual boards which are held on the spillway eres! by vertical pipes or columns anchored to the crest. The flashboards can be designed to fail ifthe leve! in thc reservoir reaches a given leve!, thus providing an automatic operation. lfthey are not dcsigned to fail automatically, sufficient warning time must be possible to allow remo val of the flashboards befo re a flood arises.
Riprap will be requircd in the channcl downstrcam from the spillway to control erosion unless the channcl is rock. To prcvent crosion ofthe dam, the spillway should be extended downstream from thc toe of thc dama sufficient distance to ensure that velocities near thc embankment are below the magnitude which will produce scour. In some cases, riprap protection at the toe of the dam may be required.
3.3. Waterways (Tunncls)
3.3.1. General considerations
Waterways conduct the water from the intake lo the power station and back to the river. Normal! y they are arranged in such a way that both the inlet and the outlet may be closed. The inlet, called intake, may be incorporated in the dam or regulation works orbe arranged as a separate structure. They are fitted with trash racks to keep out floating debris and gates to regula te the access of wáter to the waterways.
42
The waterways upstream the power station are called the "headrace" while the downstream pa1i is called "tailrace". Normally the headrace is furnished with valves at the end ofthe headrace, inunediately in front ofthe turbincs. The tailrace is equipped with gates at both ends. The upper will isolate the turbine outlet, draft tu bes or turbine pits, from the tailrace. The lower ones will isolate the tailrace from the river.
Options for waterways are many. The main alternatives are:
• canals • culverts • tunnels • shafts • penstocks
Canals for hydropower projects are normally open and lined. Tunnels and culverts can also be designed to opcrate as open canals but will be object to headloss in case of headwater leve! fluctuation. The other waterways are normally designed to be opcrated completely fi llcd to reduce headloss and achieve ease of operation.
Headloss, or loss of gradient, is loss of water pressure ca u sed by friction and adverse hydraulic conditions when the water is conducted through the waterway.
Headlosses are proportional to the square of the water velocities and related to the surface smoothness ofthe waterways. They are also susceptible to other hydraulic conditions such as abrupt changes of section, sharp bends and similar.
The most effective way to reduce headlosses is to increase section and/or improve surface smoothness of the waterway. 1t is al so costly and in dimensioning the waterway the present valuc ofheadloss over time must be compared to the incremental construction cost for increase of section and improvement of surface.
Many rivers carry heavy sediment loads and all particles larger than what can be kept in suspension must be removed befare the water is allowed to enter the waterways. This has a dual purpose. As the water vclocity is small in the waterway, to reduce headloss, the large sediment particles may settle and accumulate in the waterway. If reaching the turbine such particles may cause wear and reduce the lifetime ofthe hydraulic equipment.
To effect the removal ofthe heavy sediments costly sand excluders and sediment traps are built between the intakcs and the waterways. Most such traps are based on the simple principie that thc heavicr scdiment particles will settle when the water velocity is sufficiently rcduced. The traps therefore consist of severa! long compartments, each of which may be isolated from the others for flushing of scttled sedimcnts in arder to maintain a continuous opcration of the sediment trap and the power plan t.

43
The headrace part of the waterway is often a tunnel conducting the water under small inclination towards the power station while the last part is a strongly inclined pipeline, called penstock if located outside, called pressure shaft when situated underground.
The pressure variations in the penstock during load variations are mainly determined by the length of waterway counted from the nearest open water surface. An open surface tank, a surge tank or similar is therefore incorporated in the waterway, as near the turbines as possible, i.e. at the top of the penstock. Thus it will not be necessary to vary the velocity in the tunnel as muchas in the pcnstock, the difference will be balanccd by fluctuation of the water leve! in the surge tan k.
Quick turbine load increases mean immediate increase of water flow to the turbines. The water in the headrace represents a heavy mass and time is needed to accelerate this mass ofwater. For a start the turbines are supplied with water from the surge tank itself, making the water leve! in the tank drop, thus increasing the gradient between intake and surge tank, increasing the acceleration.
The new load situation requires more water through the tunnel, increasing velocity and headloss thus reducing the water leve! in the surge tank. Due to inertia, the leve! will sink lower than needed for balance, the water masses are retarded and the water load in the tank will rise again and oscillations around the new balance leve! are induced. The oscillations are, however, normally dampened and the amplitude is quickly reduced.
At quick load reductions the opposite will occur. The water in the tunnel only retards slowly. Surplus water fílls the surge tank and raises the water leve!, thus reducing the gradient between the intakc and the surge tank. The gradient may even become "negative" and work in the direction against the intake thus hastening retardation. However, also in this case the water leve! will oscillate around thc new balance leve! before it settles down.
The surge tank must be dimensioned to accommodate both the highest and lowest water levels which may occur.
Ifthe tailrace is a tunnel ofsome length, a surge arrangement may also be needed here.
In preparing the plans for tunnel waterways many physical factors must be considered. Ifcanal solutions are possible the alignment is toa degree dictated by the topography. The canal may be long and lead to high headlosses. A basin (forebay) has to be arranged at the top ofthe penstock, including spillway and facilities for evacuation of surplus water. A tunnel alternative may presenta viable solution and will operationally be more attractive than a solution with headrace canal.
The waterway alignments will be studied and traced on con tour maps of appropriate scale, taking care that thc proposed alignment. in case oftunnels, is situatcd-in sound rock below the weathered zone with suffícient cover to support the water pressure in the tunnels. The tunnel alignment must also allow rational excavation and facilitate division into headings ofsuitable length using excavation adits where neccssary.

44
When designing the section of a water turmel consideration must be given to severa! requirements, as shown on Fig. 3.15.
The stability ofwater tunnels in rock is complicated. Only through the last 20-30 years has this problem been treated in a rational, systematic and scientific manner. The modern engineering geology approach has drawn much of its early experience from water tunnels. New methods, material and equipment ha ve been developed for dealing with the various problems specific to water tunnels. New tested types of rock support are available as are methods, material and equipment for dealing with leakages, inflow of water, and similar problems.
The new concept in rock engineering is to use the rock as a structural element in planning and design ofunderground works. This concept is based on a detailed knowledge of the geology in the tunnel, the rock properties and rock mechanics on which the tunnel support etc. is designed.
The new concept differs considerably from the old which prescribed full concrete lining for all water tunnels thus accepting the highest cost solution in the beliefthat the concrete lining is water1ight. The rock mass surrounding the lining is justas watertight as the lining which have numerous contraction fissures.
lf the concrete lining is not needed to preven! leakages in a well situated tunnel, e.g. below the ground water line, its remaining purpose is tunnel support for which far less costly alternatives are available.
Under the new concept the water tunnel is only concrete lined where absolutely necessary for stability reasons. The lining is then placed at the face immediately after the blast thus serving as temporary work support as well as permanent tunnel support. By combining these two in one operation the costly temporary steel ribs support, lagging, etc. are avoided and considerable savings are achieved.
The new concept, however, relies heavily on engineering geology expertise to be successful. Such expertise must be permanently available during construction of tunnels and other underground work. This situation is known as the "design as you go" method. The permanent tunnel support is designed as the excavation develops and the geological conditions become known in detail.
The last part of the headrace, the penstock, is normally a supported or embedded pipe made of steel. Other materials can al so be used, c.g. wood, cast iron and glass fibre reinforced plastics. The penstock may be one pipe serving severa! generating units, in which case a manifold is required, or one pipe for each unit. Each turbine pipe is furnished with a valve. Penstock pipes are often supplied with closure anangement at the top, automatically triggered in case of pipe failure.
The above ground penstock is often replaced with an underground shaft solution, vertical or inclincd. This alternativc is known as "pressure shaft" and under acceptable geological conditions prcferred beca use of flexibility, safety and cost. The pressure shaft is either fui! y, partly or unlined but is invariably steel-lined from the bend,

45
including the manifold and turbine pipes. The steellining is normally embedded in concrete but penstocks placed in open shafts are also encountered.
The head race surge arrangement for tunnel waterways are afien vertical or inclined shafts of varying section, open to the atmosphere at the top.
Nearly allmajor hydropower plants constructed in Norway after World War 11 are placed underground, meaning that more than 80% of the total installation is now under ground.
The next sections will deal with the design of unlined tunnels in rack, emphasizing the later trends in design and the experience gained from applying some unconventional design features.
3.3.2. Desi¡¡n trends in tunnellayouts
The hard-rock tunnelling could be used as the hallmark for present-day design of hydropower plants in Norway. In any modern high-head power development, tunnels are used not only as supply conduits from an intake in a reservoir towards a powerhouse, oras tailrace out from a powerhouse, but even more extensively as drainage collectors fram the remate parts of the catchment area to a reservo ir or supply tunnel, oras pressure tunnels, powerhouse access tunnels and for cable conduits.
Fig. 3.16 demonstrates the principie of using tunnels as collectors of drainage from majar mountain streams passing over the tunnel, by intercepting the stream-flow with a small dam andan intake, togcther with a shaft lcading from this intake pond down to the tunnel. Some projects may ha ve more than 30 km of such diversion tunnels and more than a dozen stream interceptors.
lt should be mentioned here that rack tunnelling in Norway refer to tunnels that are basically unlined. This is of course partly dueto the reasonably sound rack conditions that prevail, but is al so dueto the thrifiy philosophy of installing rack support only as required by stability and local conditions (as recorded after excavation), contrary to the principie of installing tunnellining or other supporting measures in accordance with a preconceived design, without regard to the actual conditions encountered.
We shall take a closer look at the following cost-saving features related to tunnelling, features developed in Norway and presently in general practice throughout the country:
• unlined pressure tunnels and shafts • a ir cushion surge chambers • lake taps

46
3.3.3. Unlined pressure tunnels and shafts
Historie deve/opment The layout for Norwegian high head powcr plants built before World War 11 normally included an unlined supply tunnel from the intake to a surge tank structure on the surface, located in the mountain-sidc above the powerhousc, and from there a steel penstock on the surface clown to the powerhouse, al so located abo ve ground. The supply tunnel was located at a high leve! and subjected only to a low interna! water pressure.
According to new design ideas that carne up around 1950, the entire watcrway including surge chamber and powerhouse was put underground, while the steel penstock was maintained but with the spacc between rock and steel liner filled with concrete. In thc next stage the steel liner was abandoned, and the unlined pressure shaft emerged.
In the most recent layout, the unlined pressure shaft has been replaced by an unlined pressurc tunnel, a design providing a shorter waterway and improved constructability, since a tunnel can be excavatecl with nonnal equipment in contras! to the somewhat complicatecl machinery necessary for a shaft. Also, this tunnel can now be attacked from the power station area, limiting the Contractor's plan! to that area ancl eliminating any neecl for a transport road up the mountain-sidc to where the headrace tunnel would otherwise be located. Such roacls are costly and may have an adverse impact on the environment. Fig. 3.17 ancl 3.18 clemonstrate the difference between pressure shaft and pressure tunnel.
Where a surge chamber is required in the upstream waterway, this in now frequently constructecl as a re1atively small, unlined a ir cushion chamber and p1aced as el ose to the powerhouse as permissib1e.
The total result of these new design features have been significan! savings in the cost of civil works ancl of steelliner for the waterway. This statement refers of course to the cost leve! for services, steel and other matcrials in Norway, but is probably true for the conditions and the economy in any country. Other advantagcs are the small maintenance costs compared to an abo ve grouncl penstock, and the improved safety against acts of war.
Experiences Unforcseen cleformations and/or uncontrollable leakages ha ve occuned in unlined conduits as late as 1968, 1970 and 1971 during the filling ofthe systems. Most leak ages occurred 1-3 days after the filling had taken place, the principal cause being insufficient rock and/or unfavourably located joints.
Pressure conduits designed with adequate rock cover and with all its pervious zones carefully sealcd will, however, ha ve only negligible permanent leakages, rarely more than 5 1/s, se e Table 3.3 below:

' 1
1
Tablc 3.3
47
Summary of layout, gcology and leakage control results from six hydropowcr plants with unlincd prcssure tunnels/shafts.
Power Plant Max head Layout Gcology Predicted Mcasured Calculatcd on unlined Jeakage in Jeakage mass pcr-rack (BAR) 1 -1 •S in mcability
1 -1 ·S /ll·S-1
J0RUNDLAND 28 2,0 km pressure precambrian granite - 1 1·10 9
1971 tunnel and gneiss
SKJOMEN 36 2,6 km pressure precambrian granite - 1-2 3·10-9 1973 tunnel
BORGUND 25 2,9 km pressure precambrian gneiss - 3-4 1·10-8 1974 tunnel
LEIRD0LA 45 0,6 km pressure precambrian gneiss - 0,9 ¡.¡o-• 1978 shaft
LO MI 59 0,7 km pressure ordovician mica schist 1-5 3-6 5·10-8
1979 shaft
SK!BOTN 44 4,0 km pressure ordovicia 2-10 10-18 3·10-8
1980 tunnel on mica schist
Brief design principies The design ofthe first unlined high pressure shafts was based on a simple equilibrium state of stress. This critcrion ca lis for thc weight of the rock mass overburden to exceed the water pressure in the shaft at any point, in order to counter hydraulic splitting. A survey from 1972 of 45 unlined pressure conduits, most ofthem with pressure heads above 100m, is plotted in the diagram Fig. 3.19, where also the design criterion for rock cover is shown.
In 1972, a better too! was developed for the design of high pressure tunnels/shafts. This method is based on tinite element analyses of two-dimensional models, and one ofthe design criteria is that the interna! water pressure in the conduit shall not exceed the mínimum principal rock stress.
Fig. 3.20 shows an example ofsuch a model where the criticalline Ho/H is 0.7. The unlined pressure shaft is placed on the inside ofthis criticalline, with a safety factor of 1.4.
3.3.4, Lake taps
\Vhen the last ice age in Norway ca meto an end so me 10,000 years ago, theglacial activity left behind landscapes of unweathered bedrock with little or no overburden, anda large number of natural, deep mountain lakes, suitable as hydropower reservoirs. By means ofthe principie called submerged tunnel piercing, or lake tapping, many such lakes havc bccn cxploited using thc storage volume that is located below the

] !
1 (
48
natural (original) water leve l. If a similar storage volume should be provided abo ve the natural water leve!, this would require construction of a dam, an alterna ti ve that is generally the more expensive one. The principie is demonstrated in Fig. 3.21. In many cases the optimal soiution appcars to be a Iow da manda lake tap reservo ir.
A piercing is effected by excavating a tunnel in rock under the lake bottom, up to a preselected point, from where a controlled holc-through is made by a final round of blasting. A control structurc in !he tunnel, gatc or bulkhead, mus! be installed prior to the piercing.
Lake tap design When planning a lake tap, it is wise to consider any sccondary effects ofthe future drawdown, such as the risk ofearth- and rock slides, wave erosion ofthe new shoreline, and ground water erosion.
Selection ofthe penetration point requires extensive geologic mapping, soundings, seismic refraction measurements, and possibly exploratory drillings to find thc extent and nature of overburden in the lake bottom. The penetration point should have as little overburden as possible, and the topography should be such that no sliding of material into the opening can take place in the future.
Determining the size ofthe charge for the final round is an essential part ofthe submerged tunnel piercings. Overcharging is normally required to break through the outer shell that is not drilled into, or the sediment !ayer on the outside, if any, but moderation is al so imperative to preven! harmful effects from interna! pressure due to overcharging. 3 to 5 kg of explosives per m3 is mostly used.
Two basic types of piercings are normally applied:
• open system piercing, and • closed system piercing
The difference between the two types is demonstrated in Fig. 3.22.
In an open system piercing, thc gate or bulkhead is placcd on the downstream side of !he gate shaft, leaving a direct communication between the tunnel face and the atmosphere.
In order to preven! rock debris from reaching the gate, it is absolutely necessary to fill the tunnel partly with water prior to the blasting. The degree of filling must be weighed against thc upsurge in the shaft, which shallnot be allowed to reach the !loor ofthe gate house (condition 2). This upsurge can be calculated quite accurately. When filling the tunnel before piercing, an air pocket mus! be left against the tunnel faceto preven! any harmful shock transmittecl to the gate. This will normally restrict the leve! to which the tunnel m ay be fi llcd to avoid the a ir in the pocket being squeezed out through the plug into the atmosphere (condition 1 ).

49
In a closed system piercing, the gate or val ve is placed so that the tunnel volume is confined from the atmosphere. This system requires a relatively long stretch oftunnel between the plug and the gate, to prevent damage to the closing structure from the maximum pressure produced by the detonation. The maximum pressure from inrushing water against the gate decreases with increasing tunnel length. Closed piercings can be made with empty or partially filled tunnel.
3.3.5. Air cushion surge chambers
Principie and pe¡formance It was previously explained how the development of supply tunnels had resulted in deep-lying, unlined pressure tunnels. This concept has necessitated new ways to ensure hydraulic stability in thc system under operation, and the conventional surge shaft and chamber has thercforc bcen replaced by a deep-lying chamber containing a volume of compressed air which acts as a shock absorber.
Fig. 3.23 demonstrates how this new design influences the general layout of the plan t. A steep pressure shaft is replaced by a modera te! y inclined tunnel, not steeper !han 1 :8. The closed air cushion chamber, unlincd likc thc tunnel, is placed above the tunnel in the vicinity of the powerhousc.
After having filled the tunnel system with water, air supplied from a compressor plan! is pumped into the surge chamber. The compressed a ir acts as a cushion in reducing the waterhammer effect in the waterways and the hydraulic machinery, ensuring hydraulic stability.
The world's first high pressure air cushion surge chamber was pul into opera! ion in 1973 (Driva Power Plan!) and the second in 1974 (Jukla Power Plan!), both working successfully. Eight more air cushion plants havc been constructed since then, and today a total often Nonvcgian plants are cquipped with this type ofsurge chamber. These plants are listed in Table 3.4.

50
Table 3.4 List of closed, unlined surge chambers with air cushions
N ame Year Excavation Air volume A ir Air loss Type of volume pressure rock
(m3) (m3) (bar) (Nm3/min) Driva 1973 6,700 3,000 42 non e Gneiss
Jukla 1974 6,200 4,000 24 0.01 Gneiss
Oksla 1980 17,000 13,000 45 none Gneiss
Sima 1980 6,200 4,000 50 0.1 Gneiss
Evilldal 1981 136,500 88,500 42 1-4 Gneiss
Nye Osa 1981 12,500 10,000 18 6-171) Granite
Tafjord K5 1981 2,000 1,000 75 large 2) Gneiss
Brattset 1982 10,000 - 23 non e Mica schist
Ulset
Torpa
1985 4,900 - 25 0.4 Mica gneiss
1989 17,400 - 42 5 Meta silt-stone
1) Before grouting 2) Possibly dueto hydraulic splitting
The performance of these plants ha ve in general been good. At Nye Osa sorne initial problems related to leakage of a ir out of the pocket ha ve now been sol ved by grouting the surrounding rock, while a similar problem at Tafjord K5 still remains to be solved.
Designfeatures The air cushion chamber should be located as el ose to the powerhouse cavern as is considered safe by the
• rock mass quality • interna! pressure • topography and rock cover
Prior lo chamber excavation, core drilling with water pressure testing is normal! y perfonned from the face of the adit into thc prospcctivc chamber area. Cernen! grouting is often requircd to ensure the imperviousness ofthe si te.

51
The chamber cross section should be detennined with a view to the geological conditions and the equipment available for rock excavation. The axis of the chamber should be perpendicular to the jointing. The floor leve! of the chamber should be more than 2m above the leve! ofthe tunnel ceiling, and the design nonnal operational water leve! in the chambcr should be from 1 to 2 m above the floor leve!.
An example of an air cushion layout is shown in Fig. 3.24.
Technical and economical considerations The air cushions presently in use rcquire Jonger stops in operation during revisions of the supply tunnel systcm than do the conventional surge chamber anangements. This problem is closely tied to the choice of compressor capacity, a factor that governs the time lag between filling the system with water and stm1ing the operation.
A ir cushions al so involve a risk factor, as a blowout from the compressed air chamber into the supply tunnel is possible, in case a malfunctioning ofthe compressor regulator should occur. To ensure against such accidents, thc design must therefore include instrumentation for gauging of air volume, air pressure, etc.
Conventional surge chambers are normally maintenance- free, while inspections and maintenance are required to sorne degree for air cushion plants, pmicularly for thc compressors and instrumentation. Power consumption for filling and refilling of air into the cushions is normally quite moderate and does not represen! any significan! expense.
3 ,3 .6. Unlined tunnel hydraulics
The most commonly used tunnel area pro file has vertical walls and a semicircular roof: The width-height ratio will often be adapted to fit the contractor's equipment, such a type of truck, ventilation anangement etc. The hydraulically preferable area shape is obtained when the hydraulic radius has its maximum, conesponding to mínimum head loss. This will be the case when the tunnel width is equal to the tunnel height, Fig. 3.25.
From Fig. 3.25 (area)
P = 1tR + (2n + 2) R (wetted parameter)
1 A -7t+2n
R" =- = 2 R (hydraulic radius) P 7t+2n+2
For head loss calculations in unlined tunnels, the so-called Manning formula has been commonly used. The formula rcads.

52
v2 • L
h1 = M 2 • R 413 (SI units) h
where v =average velocity (m/s) L = length of tunnel (m)
M= _!_ =Mannings roughness coeffisient (mlf3Js) n
RJ¡= hydraulic radius (m)
For normal shaped tunnel cross sections we often put
Another more general formula is the Dareey-Weisbach fmmula:
L v2
h¡=/·-·-4R¡, 2g
where f = friction coefficient g = acceleration of gravity (mfs2)
The value off m ay be found by help of the so-called Moody-diagram.
The Manning formula has some rcstrictions regarding roughness range, and should be used with care outside this interval.
The friction loss in unlined tunnels varies with many factors. Among them we consider the major ones to be the rack quality, defined by the type ofrock, fault zones, stratification, etc., the method used for excavation and the leve! oftraining ofthe personnel. In Fig. 3.26 we have shown measured friction factors for tunnels excavated in Norway and Sweden in the period 1950-1970 using rather light drilling equipment. Recen!, not completed research shows a clear tendency of increased roughness, which is assumed to be the result of heavy drilling equipment and longer drilling holes.
Very often the rouglmess will be different around the periphery. For instance the floor of the tunnel may be smoother than the rest. In such cases we have to carry out a subcalculation first to find a resulting rouglmess factor.
A formula for such calculations can be developed by dividing the total area in subareas each having its specific constan! reoughness. When assuming the same average velocity and cncrgy grade line for all areas, it is casy to derive a formula for resulting roughness factors, Fig. 3.27 Sol ved for the resulting roughness coefficient MR we anive at the Einstein formula:
M"= (

53
In long head-race and tail-race tunncls the friction loss is predominating. This does not mean that singular losses should be neglected. Ifa part ofthe tunnel needs to be lined, for instance when crossing a ft1ult zone, this lining will change the head loss. In Fig. 3.28 are shown the formulasfor calculation of head loss at a sharp-edged inlet and at the outlet of a lining.
As such linings generally do not reduce the tunnel cross section by more than 10-20%, the linear friction loss in a lining will be smaller than in the unlined tunnel. Ifthe lining is long enough, the total head loss will be smaller than if the same tunnel reach could be left unlined. Short linings will increase the total loss.
In Fig. 3.29 the change in total head loss has been plotted versus relative tunnel reach and lined area ratio. The relative tunnel length is defined as the ratio: tunnel length to the square root ofthe tunnel arca. For example ifthe area reduction is 20%, the total head loss will increasc ifthe relative length ofthe lined reach is less than 6.
Tunnel blasting will usually follow a specified minimum area. Actual blasted area less than the theoretical will usually not be accepted. A certain overbreak (surplus area), is therefore unavoidable but, provided that the minimum area is sufficient, much overbreak implies a rough tunnel giving high head loss. We ha ve tried to correlate thc overbreak area to the blasted area for tunnels excavated from 1950 to 1970 but with doubtful results, Fig. 3.30. Some explanation for the vague correlation could be the fact that m u eh of the spoil has been u sed for thc tunnel !loor and has not been removed when the cross sectional arcas were measured.
During the construction period, spoil from the excavation serves as a roadway foundation and sometimes also as a road surface. However, it may be neccssary to bring additional material into the tunnel for maintcnance ofthe road either because the rock quality is not adequate or beca use water leakage has removed material from the road surface.
The finishing criteria for the tunnel !loor has been:
1) No treatment or remo val of tunnel spoil. The disadvantage of the method is that sand transport from the spoil may cause severe damage to the turbines.
2) Thc tunnel spoil has been partly removed down to the rock peaks. This mcthod has been prcfercd because it is cheaper to increase the area this way than by blasting. The disadvantage is the sand transport problem mentioned above. The increased roughness will very soon be leveled out by the water flow. lftoo much ofthe spoil is removed, the rack peaks will cause a permanent increased roughness.

54
3. The tunnel spoíl has been completely removed. The advantage is obvious. The severe sand transp011 problem is eliminated. The disadvantages are:
the procedure is expensive, the friction loss will increase, access for inspection and possible repair or maintenance work will be more complicated.
4. The tunnel spoil has been covered with asphalt lining. The method is new in Norway and we have recently finished a study to find the dimensioning criteria for the thickness ofthe asphalt lining. Sorne ofthe advantages are:
no sand transport problem, no access problem during inspection or maintenance, reduced head loss.
If spoil from the excava! ion has no! been removed complete! y from the tunnel floor, there will be a sand transport problem when the tunnel comes into operation with normal water velocity.
To reduce the damage to the turbine a sandtrap is recommended. Two types have been commonly used in Norway. The open type is shown in Fig. 3.31. This type has no! worked in satisfactoríly manner as only coarse material is trapped. A major par! of the fine fractions will pass the trap and enter the pressure shaft. Ifthe mineral is ofa hard type e.g. quartz, the turbine may ha ve unacceptable damage. The efficiency of the sandtrap can be considerably improved ifa system ofribs or beams is arranged at floor leve! as shown in Fig. 3.32. This type ofsandtrap takes care ofmost ofthe bottom transport, but can do nothing to stop suspended material.
lf spoil from the excavation is left on the tunnel !loor or sand may enter the tunnel from the intake or from a secondary intake, e.g. a brook intake, we usually recommend a sandtrap with beams to be built. The open type can only be accepted ifthe sand transport problem is considered to be minor. lnclined pressme tunnels need special care with respect to sand transport.
Head-race tunnels usually have a mild slope. In sorne cases, for instance ifthe power plan! has an air cushion surge chamber, the slope may be steep, as muchas 1:1 O. In such cases spoil from the excavation should not be left at the tunnel floor unprotected. Ifthis is done, the spoíl will sooner or later be flushed down during a filling or emptying operation regardless what the instruction may say.
We therefore recommend that steep tunnels be thoroughly cleaned before the power plant is put into operation. Another possibility is to line the tunnel !loor with asphalt or concrete.

1
1
55
3.3.7. Arrangement ofgates and steelworks in tunnels
In the planning and design process ofthe tunnel system for an underground power plant close cooperation between the civil and the mechanical engineers in necessary. A main goal is to create a safe and economical plant that can be operated and maintained in a practica! way.
Norwegian power plants constructed today have often long tunnel systems given by the geographical and topographical situation. The cost oftunnelling may represen! a considerable part of the total costs. Hence it is necessary to adopt the tunnel lay-out which is most favourable, both economically and technically. Such lay-outs may require anangements for thc hydraulic steelworks which are more demanding to design and to maintain than usual. Very high pressure on gates and difficult access to trashracks and sandtraps are typical examples. However, good cooperation between planners, contractors and operation staff has becn very useful, anda large variety of practica! solutions has been found.
The structures treated in this section are bottom outlet gates, intake gates, lrashracks, revision gates and bulkheads. Structural strength, scaling, operational function and maintenance are the most importan! aspects to be considered.
Discharge gafes
In most underground power schemes bottom outlets from reservoirs are necessary. Such gates are often working under very difficult condition. Because of large variation in hydraulic head tunnel gates are most conunon. Typical problems are cavitation, vibrations, aeration and energy dissipation. According to our experience slide gates of rugged design have proved to be the best solution, but sometimes radial gates with top sea! are used for larger cross sections while val ves are used for smaller discharge.
Fig. 3.33 shows an ordinary slide gate in a concrete plug in an unlined rock tunnel.
To maintain the discharge gate a revision gate can be set in the tunnel closer to the reservoir. This gate is lowered from the top ofthe shaft and set at no-flow condition. In the gate body a filling valve is installed which is operated by the hoisting wire.
For operational safety two discharge gates are sometimes used. With two discharge gates the revision gate may be avoided to save the cost of an extra shaft, provided that the chances of rock-fall in the short upstream tunnel are found to be negligible. However, to be ablc to maintain and change seals on the upstream gate there must be a practica! possibility ofhoisting ifabove the reservoir leve! when the downstream gate is closed. Because of this the gate slots, bottom sil!, top of the frame and upstream steellining is made from stainless steel and is considered to be maintenance free.

56
lntake gafes
Many of the intake tunncls to power plants are run into the full reservo ir by "lakc piercing". Conscqucntly it is impossiblc to build an intakc structurc in the reservoir itself. The intakc gate is thereforc placed in the tunnel a short distance away from the reservo ir where it is possible to blast or dril! a vertical gate shaft frorn a suitable point above the reservoir leve!.
A normal design is to arrange a revision gate and a gravity closing wheel gate in the same shaft as shown in Fig. 3.34. The wheel gate acts asan erncrgency closing device ofthc reservoir, while the revision gate is lowered in special guides from the top ofthe shaft whcn the equipmenl in the shaft or the whcel gale shall be inspected or maintained. The revision gatc has a built in filling val ve connected to the lifting wire for filling the space between the two gates and the shaft. Filling of the downstream headrace tunnel is done with the wheel gale when the revision gate is lifted away. An aeration pipe is mounted in the shaft for ventilation of the tunnel during filling or dewatering.
lfthe headrace tunnel has a pressurized air surge charnber instead ofa surge shaft there might be a need for an extra evacua! ion shaft for air. A ir can escape into the tunnel frorn the a ir charnber in case of uncontrolled operation of the intake gate and the turbine. This situation has to be analyzed by special calculations as it can be a rnost dangerous situation.
Sorne power schernes ha ve severa! intake reservoirs or smaller secondary intakes from brooks. The lunnel systcrn often has a considerable length, and each reservoir has its own intake gale, gales that sornelimes musl operate under back pressure, Fig. 3.35. In such cases it can be inconvenient to empty the wholc tunnel system lo get access to the prcssure shaft. lt can also be necessary to operate the tunnel systern to allow transfer of water from onc reservoir into another in the llood season, while maintenance work has to be done on for inslance the penstock or tha main turbine val ve. The solution has been to install a separa te intake gate/valve at the top of the pressure shaft, e ven if this is costly and no! needed for safety. The econorny is calculated frorn the risk of loosing water or having an unwanted stop for emptying the whole tunnel systern.
An intake gate concrete plug is designed to give a rninirnum of head loss. To have econornical gates !he gate cross-section is smaller than the tunnel cross-section. Hence a diffuser is made downstream the gate to recover sorne of !he velocity energy in the gate opening. The dirnensions are found from a cost-benefit analysis, i.e. minimizing the sum of capitalized hcad losses plus the costs of the concrete with steel equipment.
The operating chamber for the gates is norrnally placed above the reservoir leve!. Thus hoisting rod lengths of 100m is no! unusual, but in case of higher heads !he hydraulic operating cylinder has bcen placed submerged sornewhere down in the shaft, A concrete plug in the shaft anda stuffing box for the hoisting rod can then be practica!,

57
but it involves normally a pump drainage system unless there is access and self draining from somewhere downstream the dam. Automatic aeration val ves are then needed. The revision gate with hoisting rod can only be taken up for maintenance when the reservoir leve] is below the stuffing box level.
Sometimes the design head of the revision gate can be higher than the corresponding maximum reservo ir leve! because the pressure rise, caused by blasting the final rock plug into the reservo ir (lake piercing). This has to be taken careo f. Under such conditions higher stresses than normal working stresses may be allowed in the gate.
Trash racks
The purpose of the trashrack is to protect the turbine from debris and foreign matters that can do damage or clog in the francis runner or in the nozzle of a pelton turbine.
Often two trashracks are installcd, one for a rough fíltering in the headrace tunnel and one for the final fíltering near the intake ofthe stecllined conduit lcading to the turbine. lt is necessary to have access to both through bulkheads in adits. When necessary it may be practica! to build a sandtrap in connection with one of the trashracks.
To detect unnormal headlosses across the racks a differential pressure measuring equipment is usually installed. The manometcr/monitor is mounted outside the access bulkhead.
To reduce the head loss across the rack a moderate design velocity, approximately 1 mis, is used.
A design pressure difference of about 1Om head has often been used. The supporting frame and beams are normally designed a bit stronger than the racks.
Bulkheads
For the tunnel excavation a number of access tunnels (adits) are made to the main tunnel. Concrete plugs with steel bulkheads for access are installed, and to be able to drive into the tunnel with a tracto~openings of2,8 m x 2,8 mis frequently used.
It can be practica! to install the plug ata certain distance away from the main tunnel to avoid that heaps of depositcd sand make difficulties when the bulkhead shall be opened.
Depending on the design pressure the bulkhead can be designed as a pi ate with ribs, a segment of a cylindrical shell ora spherical cap, Fig. 3.36.
The steel frame supporting the bulkhcad is cmbedded in the concrete plug, and the load between steel and concrete must be thoroughly calculated to avoid cracking of the concrete when the hydraulic hcad is high, i.e. 500 m of water. In extreme cases with large support loads on the frame a part of the load can be transferred from the m a in

58
frame seat through the steellining into the neighbouring rib which is well stiffened. Then both thc elasticity of steel and concrete must be taken into account, and the case is analogue with the force distribution ofthe threds ofa screw.
The steellining downstream the bulkhead is normally made short. For safety it is designed for the full water pressure betwcen lining and concrete. lt can be an integrated part of the frame, only ment for supporting the concrete near the frame.
The upstream lining has mainly the purpose of sealing between lining and concrete, and the length is limited to what is necessary to give room for a sufficient number of sealing ribs, 2-3 ribs pr. 100m ofwater head. This lining is only designed for pressure from concreting and grouting.
The length ofthe concrete plug is designed to limit the shear force between concrete and rock and to eliminate the risk of leakage between the rock and the concrete.
Draji tu be gates
The draft tu be gate(s) in an underground power station does not differ from what is found in other power plants. Thc gates are rcvision gates, set at no-flow conditions at the end of the draft tu bes. The gate is lowered from a special gallery blasted downstream the power station cavern, Fig. 3.37. The gatc shaft usually acts as a surge chamber so the maximum oseillations has to be taken into account.
The gate itselfis an ordinary revision gate, but spccial attention has to be paid to the seals. They havc to cnsurc good conlact wilh thc scats bccausc lhcre is no pressure differcnce when the emptying ofthe draft tube sta11s.
The draft tu beis fílled from the tailwater, and a filling val ve in the gate operated by the hoisting wire is a practica! design.
3.4. Prcssure transicnts, surges and turbine goycrning
By "surges" and "pressure transients" we usually mean large amplitude transients, caused by the largest and worst possible load variations.
In governor stability analysis we consider nearly constan! load operation: The time variables (load, head, discharge, speed etc.) ha ve only small amplitude deviations from their stationary mean values.
We deal with exactly the same physical system in the two cases. We also use the same basic equations for conslructing theoreticalmodels of the system in the two cases. But there is a great difference in the methods of analysis and calculation: Considering small amplitude variations we linearize all equations (i.e. we use the tangent in the working point ofa curve, in stead ofthe curve itselt). \Vhen investigating large amplitude variations this is of course not permissible; it would lead to totally erroneous results. ·

59
Let us consider full laod rejection of a turbine: The rotational speed n rises quickly and the governor almos! immediately goes into "saturation". This means: the servomotor closes the guide vanes with the maximum possible, constan! speed:
d~ Xmax =
di
Here x is servomotor stroke, or guide vane opening. Te, the closin¡¡ time, normally is 5-l O sec. (Te may be as long as -30 sec. for Pelton turbines).
Correspondingly there is a maximum opening speed for load admittance, with opening time T 0 of the same order of magnitude as Te.
Considering load rejection or admittance, the following responses are importan! fcír the design ofthe hydraulic system and turbine.
• max speed deviation • max pressurc rise at turbine • max pressure drop on suction si de of turbine • max surging of water levels in shafts
For turbines with long pressure conduits, Pelton- and high head Francis turbines, water is by-passed the turbine runner during closure (deflector/reliefvalve) so that a relatively long closure time can be used without having excessive speed rise.
By Pelton turbines the speed rise after load rejection has no influence at all on the hydraulic transients in the head race water-system. These transients are dependen! of needle movement only.
On the other hand, by full-flow turbines the hydraulic characteristics ofthe machine are in general dependen! on the rotational speed. So, for these turbines both guide vane movement í!ill! speed deviation influence the hydraulic transients. And, it is necessary to know the machine characteristics, al so outside the region of normal working conditions, to be able to compute the transient functioning ofthe whole system.
3.4.1. Surges in shafts
By surges we mean water leve! variations in surge chambers, shafts, and tunnels flowing partly fui l. (The latter is a water-wave phenomenon).
Surges are slow. Typical oscillation periods are a couple of minutes. We therefore always use rigid water thcory to compute thcm.

60
For preliminary rough calculation of max surges in surge shafts the following simple formula is useful:
z = L'.QJ'I,(l 1 a) g·A
Here óQ is discharge reduction (or increase), the 'I,(I 1 a) accounts for the inertia of
the water masses which cause the surge, and A is the are a of the surging water surface. The formula does not account for friction or secondary shafts. However, it will often give a ± 1 0% con·ect result, e ven i f small secondary shafts are present. (The formula of course is based on rigid water theory).
The formula also can give usa rough estímate ofpressure rise caused by upsurge in a compressed a ir surge chamber. For the water surface area A we then ha veto use the equivalen! shaft area Aequ in the formula. Dueto the nonlinearity of air-compression, thc pressure rise will always be somewhat higher than one gets from the above equation.
Therc cxist other, more complex formulas, but we willnot recommend them neither for preliminar nor final dcsign use. In complcx systcms thc time history ofthe surges should always be calculatcd. This is thc most cxact mcthod, and, what is not less importan!: it gives thc dcsigner a good feeling of how !he waterway-system functions during transient conditions. The time history is calculated numerically on a digital computer.
3 .4.2. Pressure rise al the turbine
Accelleration or retardation ofthe water masses in the pressure shaft (or in the draft tube) cause pressure variations at the turbine. These pressure transients are relatively rapid. For instance by load rejection the turbine closing time may be -1 O sec. , and the pressure peak usually comes at the end of the closing time. So, apart from low head plants with short pressure shafts, we ha ve to use elastic water theory for the calculation of these pressure transients.
A simple formula, based on elastic water theory, for pressure rise by fullload rejection is the following:
Here Q0 initial discharge, ¿ (/ 1 a) is takcn from the turbine up to the nearest free
water surface, and Te is turbinc closing time. By inspection it can be seen that:

61
is another version ofthe same formula. Here Tr' is the upstream (ofturbine) part ofthe penstock time constan! T r given in the next part.
The formula above can be used for rough estimates of maximum pressure rise by turbine load rejection (or valve closure) for both low- and high-head systems. The accuracy m ay be of the order ± 1 O - 25%.
3.4,3, Regulation stability
In order to have some idea ofhow the turbine functions as part ofthe total dynamic system, we write the familiar equation for turbine power output:
,;(x..jH}H
This means: We consider the turbine as a function with input variables x (= guide vane opening) and H (= net head), and output variable E(= power output).
Non-stationary conditions in the conduits will cause the head H to vary. E.g. during an increase ofthc load, H will decrease dueto thc inertia ofthe water. lt is then possible that the relative reduction in H 3/2 is temporarily greater than the relative increase in x. In that case the output E will decrease when the guide vane opening x increases. The control system is then unstable and therefore unuseable.
The problem of governing stability can not be sol ved by adjustment of the governor only. The stability aspect imposes certain minimum requirements on the dynamic properties of the water conduit system. Two elements of the conduit system are directly influenced: penstock and surge tank,
Fig. 3.38 schematically gives the pressure situation in penstock and draft tube when the guide vane opening x increases. Part ofthe gross head H0 is needed to accelerate the water in the penstock and the draft tube, ha= haJ+ha2· Then the remaining head H = H0 -ha, must be large enough so that the output E does not decrease. Thc inertia of the water column must therefore not be to large. The inertia of the water in thc penstock and draft tube can be exprcssed by the penstock time constant:
T,= Q. ·'l)lla) gH,
The index "o" indicates steady state average values, normally taken at fullload
condition. In the tenn L:U 1 a), 1 is length anda is cross section for uniform parts of
the conduit.
T r represents the time required to accelerate the water in the penstock and the draft tu be from zero up to thc actual dischargc Q0 , under influence of the actual head H0 .

62
The term (1/a) is accumulated from the nearest free water surface upstream, through the turbine, lo the nearest free surface downstream ofthe turbine.
The requiremcnt for penstock time constan! will be nearly thc same foral! power plants:
T, S !.Osee
lt is no! always sufficient to consider !he water as an incompressible liquid, or pipes and tunnels as rigid. The elasticities mus! be taken into account either because the penstock is long or beca use the tenn (1/a) of thc surge shaft makes up a large part of
the total L:Ut a). The requirement on Tr will then be more stringent, say Tr <0,6 ... 0,9
sec. Other conduit requirements, no! mentioned in this lecture, are al so possible.
The requirement Tr $ 1.0 sec. yields normal conditions with large and medium size Norwegian power plants. However, a larger T r can be compensated by a larger time constan! for the rotating masses. T a is called the acceleration time, and can be interpreted as the time it takes to accelerate the generator from zero to normal speed. In most cases T a = 5-6 sec. General! y the requirement for normal good governing conditions is:
T,IT,, s0.2
rather !han T r $ l. O sec. The use of this requirement, with T r >> l. O sec. m ay be relevan! for small, or otherwise special power plants. In order to obtain Ta >> 5 sec., extra inertia will have to be added to the rotating shaft, or coupled electrically to it.
In most cases the total water column between the upper and lower reservoars is far too long to meet the requirement Tr S 1 sec. The distance between the upper and lower free surfaces then has to be shortened with the help of a surge tank or shaft. This will, however, cause new problems. The intake, the tunnel and the surge tank will create a U-tube system in which transients will cause gravity/mass oscillations. The resonant frequency of this oscillation system is:
/,, = J A·L:~lla) A is the surface area of the water in the surge tank, ¿ (1/a) represents the inertia of
the water in the U-tubc.
These oscillations create a problem for the control ofthe turbine, because they cause variations in the head and consequently also in turbine output. In order to have damped

63
mass-oscillations, and thus stable turbine governing, the practica! requirement is a mínimum free water surface area in the surge shaft. In a simple system with reservo ir, tunnel and one shaft the required area is given by
M 2 5/J
A""00125 ·a , H o
where a(m2) is tunne1 cross section area, H0 (m) is net head and M is Mannings roughness coefficient. This formula is derived from the so called Thoma-formula, and gives ca. 1,5 x the Thoma-area.
An enclosed air chamber has a similar dynamic effect asan open shaft on the tunnel. The air chamber is dynamically caracterized by its equivalen! shaft area, which is approximately:
Y0 (m3) is the air volume. h po (m water-column) is the absolute air pressure.
The design variable is primarily the volume Y0 . It can be estimated by letting Aeq =
A.
3.5 Undcrground powerhousc layout
3.5.1 Generallayout
Planners and designers who are new lo the underground power house solution tend to interpret this concepl by excavating an underground cavern and place a power house of above ground design in the cavem. This is obviously the wrong approach and is also costly. Under the modern underground structures concept a power house design, developed for underground application has becn perfected, utilizing all the advantages the underground solution may present.
In the case of the underground power house there is less environmental complications. Once underground the restrictions are few, and with the exception of the geologica1 conditions, they are of a project design nature. An underground alternative is se1dom contemplated ifthe geological conditions are not favourable. The main concem in this rcspect is the general orientation of the power house cavern in order to avoid costly support work. Otherwise great flcxibilily is possible when planning underground layouts. It must, however, be kept in mind thal the working conditions and safety aspects are extremely importan! in connection with underground inslallations. In case ofaccidents thc escape routcs are lirnitcd and distancc to lhe oulside may be considerable.

64
There are many alternatives and solutions in underground layouts; the flexibility is great and the options are many. Thc hydropowcr planner, the engineering geologist and thc underground construction engincer will prepare the main layout with input from the mechanical and the electrical cngineers.
In the power house itselfthe electrical enginecr will have the main input with respect to room programs and dimension rcquiremcnls. The mechanical engineer will give all input with respect to turbines, cooling, drainagc, tire protection, ventilation, cranes, gates and valves. However the whole planning process will be based on team work coordinated by the hydropower planner.
Local ion, oriental ion and shape o.f caverns
Dueto topographic conditions it is frequently required to place underground powerhouses under deep rock cover where the rock slresses may be subslanlial. This trend has been accentuated with the introduction of unlined pressure shafts and tunnels, which have necessitated increased distance from surface to powerhouse. To counter any adverse conditions and preven! excessive supporting measures dueto high rock stresses, it has become steadily more importan! to analyze the principal rock stress conditions in advance for the purpose of tinding the most favourable orientation of the cavern.
Equally importan! is of course a detailed geologic mapping of jointing and fault zones. The final orientation ofthe cavern will sometimes become a compromise between the optimal "stress-orientation" and thc oplimal "joint-orientation".
For Francis-type turbines which are prcscntly used for a wide rangc ofheads, betwecn 50 and 600 m, one way to decrease the width of the powerhouse cave m is to place the pressure conduits approach into lhe cavern al an angle differcnt from 90° to the units centerline. The purpose is lo give the closure val ves al the turbine inlet better accessability for installation and disassembly. An angle of 600 has been found to be near the optimal. Local recesses in the upstream rock wall will in mosl cases be required to accommodate the valves, as shown in Fig. 3.39.
Almost all hydropower turbines/generators installed after 1955-60 have vertical shafts. Exceptions are certain types of small hydro units. This vertical shaft concept has strongly influenced the general layout of power stations, and governed the shape of modern underground powerhouses; high and narrow caverns, in contras! to the wide and shallow shapes ofthe past. Fig. 3.40 illustrates lhis.
65
Tailrace gafes
For Francis installations it is customary lo place the primary closure arrangement for !he tailrace si de al !he cnd of the draft tu be, whcre the max. water velocity is approximately 2 m/s. The distance from !he centerline of the unit to the gate may be from 20 to 40 m.
As shown in Fig. 3 .41, the gate hoist chamber is placed al !he top of a gate shaft, which mayal so be expanded lo actas a surge shaf1 if that should be required. This arrangement has two obvious advantages:
The volume of water to be drained prior to revision work is very small. The combined use of !he gate shaft as surge chamber and by that saving of volume of rock excavation.
3.5.2 Powerhouse arrangements
Tramformer loca/ion
Severa! different solutions ha ve bcen used for placing !he transforrners as shown on Fig. 3.42.
• on the powerhouse !loor leve!, opposite the power unit, which requires increasing the width of the cavcrn.
• below !he powerhouse !loor leve!, between the units, which requires increased spacing of units.
• in a gallery along the access tunnel approach to the powerhouse, which may require increasing the width of the access tunnel beyond the powerhouse width.
• in a separate cavern, located near and parallel to the powerhouse.
Generator circuil breaker
In order to ensure quick disconnection between generator and transforrner in case of faults occurring, it is now customary to install generator circuit breakers in alllarge or significan! power stations. This breaker equipment is rather space-consuming and will normally ha ve a certain bearing on the powerhouse layout.
Ventila/ion
The ventilation systcm in an underground powerhouse shall serve two purposes, cooling and comfort.
66
One purpose is to convey the surplus energy radiated from equipment in the powerhouse. This is encrgy loss which is not taken care ofby the dircct water cooling system of generators and transformers.
The need for cooling ofthe air depends on the temperature distribution and heat conductivity ofthe surrounding rock. It appears that evaporation from exposed rock surfaces in some cases has a significan! cooling effect. Also accepted maximum temperature in the powerhouse and the middle temperature in the arca affect the need for cooling.
A number for Norwegianunderground powerhouses have been investigated recen ti y with respect to cooling requircmcnt. A conclusion is that additional to the direct water cooling ofthe equipment the ventilation system should have capacity to convey about 1 o/oo of maximum generating effect.
The air supply is provided in different ways depending on the tunnellayout.
In the case of free-surface tailrace tunnels the air is taken through the tailrace. This is advantagcous because the air will always have a temperature above freezing point of water (0°C) when it reaches the powerhouse even during low temperature (-30--400C) periods in winter.
In the case of a pressurized tailrace tunnel which is often the case with variation in downstream water leve!, ventilation air supply must be provided through a cable shaft or by a separate a ir conduit in the main access tunnel.
To preven! exhaust gases from vehicles to penetrate the powerhouse the main access tunnel is invariably used for air evacuation.
Condensation will inevitably take place on inlet valves and other steel parts on the turbine floor during the cold season. By reducing ventilation toa mínimum and installation local dehumidifying units on this floor, dry conditions for painting and other maintenance is secured during part of the year.
Monitoring equipment and automatic control devices ensure that the ventilation system is shut down momentarily in case of fire or other irregular events, to be started again only after the problem has been identified.
The need for air supply for comfort will normal! y befar less than the need for cooling provided that exhaust gases from vehicles are evacuated through the main access.
This means thc cooling may be providcd by a heat cxchangcr in a interna! air circula! ion system in thc powerhousc. In cases whcre supply air from outside must be preheatcd to prcvcnt icing problems such interna! systcms oftcn turn out to be an economic solution.

67
In cases with air supply over a freesurface tailrace tunnel the preheating ofthe air is provided by the water and involves no extra cost. Therefore in such cases an interna! heat exchanger system in the powerhousc will not be of any saving.
Personal safety
The safety ofworking staffhas gained increasing attention in Norwegian underground powerstations during thc last decades. This is part of general effo11s to make all work as safe as possible through law ami regulations. In the case ofunderground powerhouses the question has been accentuated because deep seated powerhouses will ha ve long adits. Also there ha ve been a few accidents with casualtics after explosions in underground powerhouses.
The hazards to be encountered are explosions, tire and tlood.
As a rule there shall be two altemative escape routes from any part of the powerhouse out to the surface. These ro u tes will be arranged differently in di fferent cases according to the total tunnel layout.
In case of a free surface tailrace an emergency escape route by a small boat along the tailrace tunnel has been prearranged. In case of a separate power transmission shaft this also will serve as alternative exit. In some cases the main access is divided in two sections, one for transport, the other for power transmission cables. In such cases each section is regarded as one possible escape route. The escape ro u tes shall be equipped with emergency lighting to enable people to escape even during blackout of ordinary power supply.
In the powerhouse one room shall be prepared asan emergency salvage room, equipped with pressure resistan! doors, emergency oxygen supply, tirst aid kits etc.
The transformers and accessories ha ve turned out to be the greatest hazards with respect to explosions. Therefore the transformer enclosures are designed to withstand explosive loads. Furthermore explosive pressure and gases from an explosion should be released through separa te ducts without damage or penetration to the machine hall.
The most difficult problem in case of explosion or tire will probably be to preven! the smoke from penetrating the powerhouse and main access. Some stations are equipped with a reversible ventilation in arder to keep the main access free from smoke. Experience so far shows that working staff willneed access to emergency oxygen supply shortly after an accident. Therefore in big powerhouses a distributed emergency oxygen supply should be prepared.
Some years ago underground powerhouses were equipped with control rooms separated from the machine hall by glass panel walls. Toda y this is regarded as a special hazard to working staff in case of explosion. In new powerhouses this kind of control room design has been left.

68
Most underground powerstations are today operated by remole control. Therefore there is no longer a continuous supervision by operating staff in each powerhouse. Today the control room is often replaced by control desks on the machine hall !loor next to each unit. In new powerhouses with scparatc control rooms the former glass panel walls are replaced by small reinforced windows, and dueto thc dcvelopment of electronic equipment !he space requirement for the control room has been reduced radically.
Tunnellayout
The tunnel layout wi 11 be adapted to two sets of rcquirements.
One is the need for transport, ventilation etc. to carry out thc construction and erection work.
The other represents thc future functions of the power station after commissioning. These needs are accesscs to different parts of the power station for operation, control and maintenance, ventilation, emergency exits, power transmission, surge chambers etc.
An importan! recognition is that excavating a tunnel sloping downwards means a few inconveniences. The m a in one is the continuous need for pumping of water from the working face. Therefore instead of a constan! moderate slope downwards a consentrated steeper slope usually will be preferable. By Norwegian construction practice a downward inclination 1 :9 is regarded asan optimum slope if a steeper slope does not involve a saving in tunnellength. !fa steeper s1opc gives shorter tunnel a maximum slope 1 :7 sometimes is used.
On the contrary any s1ope upwards between 2 o/oo and 1 :8 is used adjusted to the circumstances. At least 2 o/oo should be chosen to have the tunnel drained by gravity without problem.
To minimise the total cost multipurpose aspects of the tunnel layout should be kept in mind. Every tunnel and shaft may serve severa! functions and different functions during construction and after commissioning.
The tunnellayout adjacent to the powerhouse may greatly intluence the efficiency of excavation construction and erection.
Some examples of multipurpose tmmellayouts for powerhouses of moderate capacities are shown in Fig. 3.43 and Fig. 3.44. Similar layout will be applicable for big capacity schemes.

69
3.5.3 Powerhouse structures
Crane beams bolted to rack wa/1
lt is very time-saving to have an overhead crane available in the powerhouse cavem at an early time for the concrete work, the erection of spiral cases, etc. In order to achieve this, two obstacles have to be overcome:
• support for this crane must be provided without the aid for any powerhouse concrete substructure, and
• the support (assuming concrete girders) should be constructed economically, i.e. without the use of high scaffolding.
Various solutions have been used in Norwegian powerhouse construction over the years; the most recen! design is shown in Figs. 3.45 and 3.46.
After having excavated the top heading for the powerhouse cavern and installed the rock support in the ceiling, long rock bolts of large size are placed and grouted in both sidcwalls as anchoring for the rcinforccd concrete crane girders. Model tests have confirmcd the feasibility of structurcs of this type, which ha ve then Jater been installed and successfully u sed in Jarge powcrhouses with maximum crane wheel Joads of 73 ton.
Implemenlalion of concrete works
Where the construction schedule and other conditions permit, it is highly preferably to ha ve the major part of the concrete work in the powerhouse cavern completed before the start of machinery erection. This is beca use of the inconveniences brought about i f both activities, construction and erection works, are to be perfonned in the same location to the same time.
The conrete embedment for the spiral cases and the concrete support for the generators will necessarily have to be placed after the spiral case installation. Even so, it is normally no problem to plan the main concrete structures in such a way that they pro vide the needed support for the floors, including the assembly area on the powerhouse floor.
Utilizing of conslruction adits
The excavation of underground power plants will often require construction of adits as temporary access or attach points. Such adits may in some cases be incorporated in the pennanent plant. An adit from the access tunnel down to the tailrace may for instance be converted into a tailrace surge chamber, andan adit from thc access tunnel up to the top heading for the powcrhousc cavcrn may likcwise, in part, be used as a cooling water reservo ir.

70
In order to reduce costs and save time it is impOitant to keep an eye on the possibilities of such combined uses airead y at the design stage, while one is still free to choose location and alignments for the construction adits.

71
4. ECONOMIC ANALYSIS IN HYDROPOWER PLANNING
4.1. Project appraisal
Hydropower projects are appraised at various levels of investigation and for various purposes. Normally appraisals are madc using criteria which, although dealing with different aspects, are entirely interdependent.
Appraisals will normally cover the following main aspects:
• Technical • Environmental • Economic - Financia!.
Of these !he technical project appraisal is the most comprchensive. lt covers the natural qualities ofthc project, the soundness ofthe project plans and the safety aspects both during construction and the operation to follow the commissioning ofthe project.
The technical appraisal is based on the presented project plans and therefore contains as such an assessment of the performance of the planners as well. Both the planners' ability to utilize the natural qualities of the project si te and the soundness and practicability ofthe project plans.
The environmental appraisal of the project plans is el ose! y interwoven with the technical appraisal. The environmcntal disturbance and impact to be evaluated is an anticipated result of the intention to implement the project and the environmental soundness of the project plans.
Ifimplementation ofthc project plans is found to incur unacceptable environmental disturbance and impact, the project will be judged as technically infeasible because of the detrimental effects on the environment. The effects may be of a physical nature, such as inundation dueto a rcgulation dam, or more of a sociological nature, such as displacement ofhabitants resulting from the regulation.
Theoretically the total environmental effects, resulting from the project, should be included in the appraisal, the positivc as well as the negative sides. lt should, however, be realized that impartiality is difficult to achieve in these matters. The consideration of various aspects, cnvironmental issues and thcir relative importance in particular, are easily swayed by the views of the appraisor.

72
Compared to the technical and environmental appraisals, the economic and financia! appraisals are less exposed to the views of the appraisers. They are, however, al so influenced by the project plans as the economic and financia! performance ofprojects is interrelated to:
• Project income (sales of generated power) • Project costs • Implementation time • Operation and maintenance costs
Financia! project performance is also very much influenced by interest rates and financing conditions.
The economic-financial appraisal is basecl on thc cash flows generated by the project, ovcr its lifetime. 1-!ydropowcr projccts, likc othcr infrastructurc projccts, will have to compete for financing, as investment capital is normally in short supply.
In order to compare hydropower projects mutual! y and to compare hydropower projects with other infrastructure projects competing for financing, a measuring system for economic ancl financia! performance has been developed.
Thc economic performance of a project reflects the project's economic impact on the whole economy (society). Financia! performance, however, concerns the owners alone. 1t illustrates the effect of the projcct on the flow of funds to and from the owner organization.
Economic and financia! appraisals are based on the same project accounts. There is, however, one big difference. The cash flow tables to be used for economic analysis will not include taxes and duties, nor financia! costs, etc., while subsidies and similar are added to the accounts. The financia! cash flow tables include al! real costs to the developer/owner. Financia! costs, interests in particular, and financing conditions will influence the financia! performance of a project. This means that projects which show good economic performance may perform differently in financia! context.
Preliminary economic and financia! tests can be carried out on projects for the purpose of assessing their performance in these fields. The result of such tests will indicate the economic and financia! performance lo be expected and provide a basis for comparison of projects competing for the same resourccs and funds available for capital investment.

73
4. 1.1. Discounting factors
Single-paymenf factors
In applying discounting to convert cash flows toa single number suitable for use in comparing altematives, the basic objective is to conve11 a valuc at one date toan equivalen! value at another date.
The single-payment compound-amount factor indicates the number of dollars which will have accumulated after N ycars for cvery do llar initially invcsted ata rate of return ofi perccnt. Thc functional notation is (F/1', i%, N) where F implies a future and P a prcscnt amount. Ifonc wcrc to dcposit P dollars initially, after one year
F = P (1 + i)
Each year the amount must again be multiplied by (1 + i) to account for that years's interest; therefore after N years
F= P(l+i)N
The desired factor becomes
F =(l+i)N p
The single-payment present-worth factor indicatcs the number of dollars one must initially invest at i percent to ha ve $1 after N years. The factor is the in verse of the previous factor, i.e.
p =--"'"
F (l+i)N
Uniform-annual-series factors
All discounting problems can be soled by applying the two single-payment factors. However, additional factors can be dcveloped to greatly reduce the required work. As an example, one may take a hydro power plant having an equal power value each year for say 40 years. Forty separate single-payment present-worth factors would have to be applied to find the present worth of this uniform annua1 cash flow. The task is made much shorter by developing unifonn-annual-series factors.
Uniform-annual-series factors indicate equivalence between the value atan earlier date, P, and equal amounts A at thc end of each of the N years, or between the N equal values of A andan accumulated amount F, Fig. 4.2.

74
Sinking-fund Factor. The sinking-fund factor indicates the number of dollars one must invest in uniform amounts at i percent interest at the end of each ofN years to accumulate $1. The functional notation is (A/F, i%, N). lf one were to apply the single-payment compound-amount factor individually to each of the N values of A in Fig. 4.2 and sum the rcsults to obtain F, the result would be
F= A[l+(l+i)+(l+i)' ++(l+i)N·I]
where the last value of A accumulatcs no intcrcst because it is withdrawn immediately u pon deposit and thc first value of 11 accumulatcs interest for N - 1 years. Multiplying both sides by 1 + i gives
( 1 + i)F = A[ (1 + i) + ( 1 + i)' + ( 1 + i) 3 + +( 1 + i) N l The relationship may now be converted from a series toan explicit expression through term-by-term subtraction to give
iF = A[(l +i)N -1]
The desired factor becomes
A i =
F (l+i)N-1
Capital-recovery Factor. The capital-recovery factor indicates the number of dollars one can withdraw in equal amounts at the end ofeach ofN ycars if$1 is initially deposited at i percent interest. The functional notation is (A/P, i%, N). Because
A AF ~:::::--
P FP
then by substitution we get
A i(l+i)N = .......0......,--;c'---
p (l+i)N -1
Series Compound-amount Factor. The series compound-amount factor indicates the number of dollars which will accumulatc if cxactly $1 is invcsted at i percent interest at the cnd of each ofN years. The functionalnotation is (F/A, i%, N). The factor is the inverse of the sinking-fund factor, or
F (1 + i)N -1 =
A

75
Series Present-worth Factor. The series present-worth factor indicates the number of dollars one must initially invcst at i percent interest to withdraw $1 at the end of each ofN ycars. Thc factor (P/A, i%, N) is thc invcrsc ofthc capital-recovery factor or
4.1.2. Discounting methods
The procedure in wich discounting factors may be systematically applied to compare alternatives (either different projects or different sizes ofthe same projcct) is called a discounting method. The threc conceptually corree! discounting methods are ( 1) the prcsent-worth method, (2) the rate-of-return method and (3) the benefit-cost ratio method. Each method, ifuscd corrcctly, leads to thc same evaluation ofthe relativc merit. However, each has advantagcs and disadvantages.
Present-worth method
The present-worth method selects the project with the Jargest present worth PW ofthe discounted algebraic sum ofbenefits minus costs over its Ji fe.
11 p PW= L;(-,i%,t)(B,-C,)
t=l F
where C1 is the cost and B¡ thc benefit in the subscripted year, n is the period of analysis in years, and i is discount ratc. Whcn the annual nct benefits B = B¡ - C¡ are constan! o ver the project lile except for thc initial cost K, the formula may be simplified to
PW=-K+B(p i% n) A' '
Calculation of present worth from a cash flow diagram is purely a mechanical process. However, certain rules must be followed in comparing the calculated present worths to make corree! choices.
Rate-ofreturn method
The rate or return is the discount rate at which the present worth equals zero as found by tria! and error. Sorne decision rules apply when comparing alternatives by the rateof-return method.
The rate-of-return method willnot Jead to the same dicisions as the present-lvorth method unless an incremental analysis is u sed in place of selecting the mutually exclusive alterna ti ve with the highest rate of return. The rate-of-return method must be applied with caution beca use more !han one rate of return exists when annual costs exceed annual bencfits in years aftcr annual benefits first exceed annual costs. The

76
water resources planner needs to be ale11 to this problem in comparing stage construction or non-structural alternatives by the rate-of-return method.
Benefit-cost ratio method
The benefit-cost ratio PWb/PWc is the present worth ofthe benefits PWb divided by the present worth of the costs PW e· Annual values can alternatively be u sed without affecting the ratio. The present worth PWb of annual benefits Bt is
11 p PW¡, = 'L,(-,i%,t)B1 ,,, F
The present worth PW e of the costs Ct is
u p PW,. = 'L,(-,i%,t)C1
t=l F
The decision on whether particular cash flows should be considered costs or negative benefits is sometimes arbitrary and affects the benefit-cost ratio. It is importan! to recognize that the best project has the grcatcst net benefits, not the largest bencfit-cost ratio. Severa! authors havc suggcsted that the benetit-cost ratio method leads to different decisions than the othcr tcchniques do. Howcver, this conflict only occurs when the incremental-cost principie is neglected.
4.2. Optimization of project clemcnts
For assessing thc rcntability of hydropowcr projccts, data on total costs and total incomes are needed. Total costs include development costs as well as the cost of running the project, i.e. operation and maintenance costs.
Rentability analysis will, however, not reveal whether the presented project is the best economic solution, whether it is well dcsigned or whether the size and dimensions represen! the optimum solution.
To secure optimum solutions techno-economic analysis are performed during planning and design ofprojects and project elements. Such analysis are based on marginal cost and marginal income considerations.
4.2.1. Marginal cost and income analysis
In hydropower engineering, as pm1 ofthe planning and design process, marginal cost and income considerations are used quite extensively. They are used for determining the cconomic size of projects and the cconomic dimensions of project elements and structures. Economic in this context means optimum, the optimum size, dimensions, installations, etc.

77
Under the marginal cost and income consideration concept, optimum is achieved when the cost ofan increment is equalized by the utilitarian value ofthe same increment.
The data on cost and income mentioned above reflect an established size or dimension of the project. Based on this the rentability of the project can be assessed. The quality ofthe project is, however, still undecided. A changed layout ora different size may improve the rentability and increase earnings.
The normal goal of a developer is to maximize the net return on the investment, i.e. to make the difference between total income and total costas large as possible. lnformation about this optimum situation can be gained through computing the diffcrcnce al various steps and thus idcntifying thc maximum diffcrence. A better way is, however, to utilizc the marginal considera! ion concept to search for the optimum solution.
As airead y defined, optimum occurs when the marginal cost of an increment matches the marginal income (or marginal value) ofthe increment. Marginal cost and marginal income are obtained by derivation of the total cost and income functions. Total costs and incomes are developed as functions of size, see Fig. 4.1, where they are arranged as curves in a diagram.
The corresponding marginal cost and income curves, obtained by derivation of the total cost and income curves, are also displayed in the diagram in Fig. 4.3. The requirements to optimum size are met where these two curves intersect. The optimum size also corresponds to where the maximum diffcrcnce betwecn the total income and cost curves occurs, al the point on the curves where their tangcnts become parallel.
4.2.2, The optimization process
Optimization of hydropower projects and project elements is an importan! part of the planning, design and implementation process. lt is an integral part of planning and embraces all development phases, at various levels of accuracy.
Optimization is used in connection with sizing of project elements, such as:
• Reservoirs and Dams • Generation Installation, Unit Size • Waterways and Structures, etc.
The optimization process is al so used for refinements of project forrnulation, for comparison of alternatives and establishment of least cost alternative.
As there is a strong dependency between the various elements it is easy to realize that one element cannot be dimensioned independently of the other elements. Design is in principie a gradual, stepwise, approximation towards the optimal dimension. Simple methods are used initially to identify the ureas of interest. Such methods are followed

78
by more advanced methods as planning work develops, e.g. computerized simulation, used to establish exact dimensions.
Optimization is a continua! iterative process. Having designed the reservoir, the power station and waterways are re-examined. The storage volurne is then re-checked using !he computed values for generation installations and waterways.
In such a planning proccss it is logical to start with available water, the run-off volumes and how thesc may be adapted to the system demand and demand patterns o ver the years.
4.2.3, Optirnization of reservo ir volumes
lt is assumed that the hydrological basis is established for ofthe drainage area and that it has been investigated in respect to possible reservoir and dam sites. The situation is then that one or severa! actual reservoirs mus! be investigated in respect to size and eventual distribution of storage between the identified reservo ir altematives. This investigation is discussed in the following:
The rationale in starting optimization of a hydropower project with the regulation works is that this componen! will govern !he dimensions of other project components. This derives from the fact that the regula! ion works decide available run-off and its distribution. As mcntioncd befare a certain interdcpendcnce exists so that the size of the generation installation and watcrways will infiucncc optimal storage volume. This infiuence, howcvcr, is far lcss significan! than thc infiucncc thc storage volume will ha ve on these parameters, !he sections of tunnel waterways in particular.
The need for reservo ir volume for storing water results from the fact that the run-off usually has a different distribution over the year compared to the demand for electricity. In Norway, for example, the demand is largest during the winter months, considerably smaller in the summer. Fig. 4.4 shows the variation over the year in production of electric energy (GWh/week) in Norway. The figure al so shows variation in run-off and storage o ver the year.
lt is interesting to note tha large storage volumes, in a normal year coiTesponding to some 80% of the annual production of energy. The large storage is a necessity resulting from the prevalen! climatic conditions.
In other countries, under different climatic conditions and other composition of industry and public consumption, !he distribution of demand will be different, as will !he need for storage.
In Norway !he run-offis at its lowest during wintcr, considerably larger during spring and summcr when accumulatcd snow melts. 1 f electricity production was to keep pace with the infiow it would be completely out of stcp with demand and large volumes of energy would ha veto be stored for use during the winter months. Storage of large vol u mes of clcctric cncrgy is not possiblc undcr prescnt technology. An acceptable

79
solution to the problem is to store the energy as water in reservoirs at a certain leve! abo ve sea leve!, thus maintaining the potential energy intact.
To measure the energy stored in this manner, i.e. how much water is stored in reservoirs and at which elevation, area and storage volume curves are used.
The are a curve shows the reservo ir surface are a as a function of the surface elevation, the arca usually expressed in km2, see Fig. 4.5.
I fin addition to damming, storage is provided through lake tapping, !he arca curve has to start as far down as tapping may be of interest. The natural water leve! will in this case appear a way up on the curve.
The storage volume curve is obtained by integrating the arca curve. lt shows the storage vol u me as a function of the regulation levels. The volume curve thus starts at !he same leve! as the arca curve.
To construct arca and volumc curves ofrcasonable accuracy, topographical maps in scale 1:10,000 or bettcr, are necdcd, with 5 metres con tour intervals.
In case lake tapping is involved in the provision of storage volumc, the topography below natural water leve! needs to be surveyed and maps constructed of the lake bottom.
Storage Cosls
When providing storage by means of dams, the main storage costs are related to construction of the storage dam. Other costs are acquisition of land and compensation for damages resulting from inundations, etc. In some cases there also are costs in connection with protection of the reservo ir, avoidance of slides, erosion control, etc.
In the case of lake tapping the actuallake piercing and tapping arrangement figure as the main storage costs. However, costs similar to those experienced in connection with dam reservoirs may al so be relevan!.
All dams need freeboards, i.e. they need to be higher !han the maximum flood water leve l. Freeboard size depends on type of dam. Knowing the actual dam type the dam height for eacb high water leve!, HWL, can be cstablished.
Having sited the dam and knowing thc topography of thc dam si te, the main dam volumes can be determincd. Bascd on <tvailable cost records from the actual dam type the dam costs for each rcgulation step can then be computed. Reservoirs formed by tapping are treated in the same manner.
To the dam and tapping arrangement costs the various other costs are added and a total storage cost is obtaincd as a function ol'thc various regulation levels. The storage costs are often presented in a diagramas a storngc cost curve.

80
For some cases two different dam types may be suitable for the site at hand, e.g. concrete and fill dams. The storagc cost is then prcsented in the same diagram, see Fig. 4.6.
Based on the total storage costs the marginal cost can be computed. The marginal costs may be computed for an increment ofthe regulation leve!, for example a regulation increment of one metre or, if expcdient, the marginal cost of a storage increment of one m3 can be calculated by using the storage volume curve.
The marginal costs can al so be represented as "present values" oras annual cost (annuities). Care must be taken that identical units are used when comparison is made and optimal dimensions established.
Storage Value
So far the cost ofthe storage reservoir as a function ofthe storage volume has been discussed. To develop the economic analysis the value of the storage space must al so be established, i.e. the income it can providc. For hydropower projects the storage value is tied to the production of electric power and energy. The relation between the storage volume and production of electricity must thercfore be established so that the amount ofenergy can be computed. With knowledge ofunit prices for electricity the value of the stored water can then be computed.
lt is there assumed that the inOuence a storage reservo ir has on unregulated run-off is known and that regulation curves, their uses and how they are established is also known.
Regulation curves are no longer used directly in hydropower planning after computer simulations became available. The use of regulation curves will, however, be referred toas they in a simple manner illustrate how the storage volume inOuences energy production. The regulation curves are useful in converting storage volume to storage values.
Normal! y the reliability requirements for supply of firrn power are that rationing should occur only one year in ten as a maximum, i.e. power shall be supplied in 90% of the number of years.
A regulation curve established under this criterium means that the regulated Oow must be rnaintained for nine years out often. Such a curve is usual! y established for Oows corresponding to the demando ver the year. Manual preparation of such regulation curves is quite work intcnsive. Such a regulation curve is shown in Fig. 4.7.
Based on the regulation curve, the amount of finn power and secondary power which the various storage volumes will provide is computed. A storage volurne of70% of mean annual inOow will in this case givc a regulated Oow corresponding to approxirnately 80% of the annual inOow. Thcse 80% can be sold as firm power while

81
the rest is considered secondary powcr. Some of the 20% unregulated water may, however, be lost as spill in so me yars.
lt the storage percentage is increased to 90% the corresponding regulated flow will attain approximately 87%, i.e. the finn power increases while the secondary power decreases correspondingly.
1t instead ofthe regulation curve, computer simulation is used, the total amount of energy and the distribution between finn energy and secondary energy will resultas a function ofthe size ofthe storage volumes. The simulation program will in addition compute flood losses.
Using simulation, the procedure is to stepwise increase the storage volume while other parameters are kept constan!. The result is the total and firm power as a function of storage volume for the parameters used.
The next step in the procedure is to repeat the simulation with other parameters, e.g. genera! ion installation size, etc. to see if thc energy increases when a new set of parameters is used. This way the maximum production with different storage volumes is obtained. Using one or the other method the amount of energy, finn and total, is established as a function of storage volume.
The next step is to determine thc value ofthe produced energy. With known price per kWh for finn ancl secondary energy, the total production value per year can be computed as a function of storage volumes.
Oprima/ Storage Volume
Knowing thc annual production value for various volumes, the optimal storage can be found, i.e. !he storage which givcs the maximum net profit.
The criterium for optimality is that the marginal production value equals the marginal cost.
The marginal storage costas a function of regulation leve! is established, and the marginal production values also need to be determined, i.e. the marginal production values must be expressed as a function of the same variable, the regulation leve!, see Pig. 4.8.
The two marginal cost curves intersect where the marginal costs equal the marginal production value and the optimal size ofthe storage reservoir is established.
So far only the costs related to the storage reservo ir ha ve been considered. When the storage volume increases it will be possible to supply more finn energy. To accomplish this the generation installation might lmvc to be increascd. leading to incrcascd powcr housc, watcrways. etc. In addition to incrcased cost in the storage arca, thcrc will be incrcascd costs in othcr pm1s ofthc powcr projcct. Thcsc incrcases

82
in total marginal costs must be taken into account as well. They are found when these project components are optimized.
In Fig. 4.8 the total marginal cost is shown as a broken line. Where this curve intersects the curve for the marginal production value, the corresponding optimum regulation leve! is found by drawing a horizontal line from the intersection point to the ordinate axis.
As can be seen, the optimal regulation leve! will be somewhat reduced when the additional cost from other projcct components is includcd.
4.2.4, Turbine and generator capacities
We need to know how the power production should be distributed throughout the year. The load is nonnally highcr during the day than during the night. In Norway the load is higher during the winter time than during the summer time. In tropical countries the load probably wi 11 be higher during the hot sea son than during the temperated season dueto airconditioning etc.
To get a complete view of how the load varíes during seasons, weeks and nights/days it is necessary to make use of statistical records from the electricity distribution.
lfwe from these records pick the highest peak load for each year and the total power production during the same years, we may find 2 very common parameters:
First the "utilization time" for the peak load. This parametre we find by dividing the armual power production (kWh) by the maximum peak load (kW). This parametre tells us how many hours the peak load must have been kept in full operation to produce the total quantity of annual cnergy.
One year consists of 8760 hours, and ifwe take the ratio between the utilization time and 8760 hours we find the other parametre, the "load factor".
Ifthe utilization time is 6000 hours, the load factor is 6000/8760 = 0.68. This means that the average load is 68% of the maximum load.
lt should be stressed that we hardly find any other electric generating altemative that givcs cheaper peak load capacity !han hydro power plants.
We must have in mind that the maximum peak load should be provided even in the future. Thcrefore it is importan! to ha vean idea of how the system will be composed in thc future. lfwc through an analysis ofthc load statistics have found that the load factor for thc wholc intcgratcd systcm is 0.68. it might be rcasonable to assume that this will be near thc truth evcn in thc future.
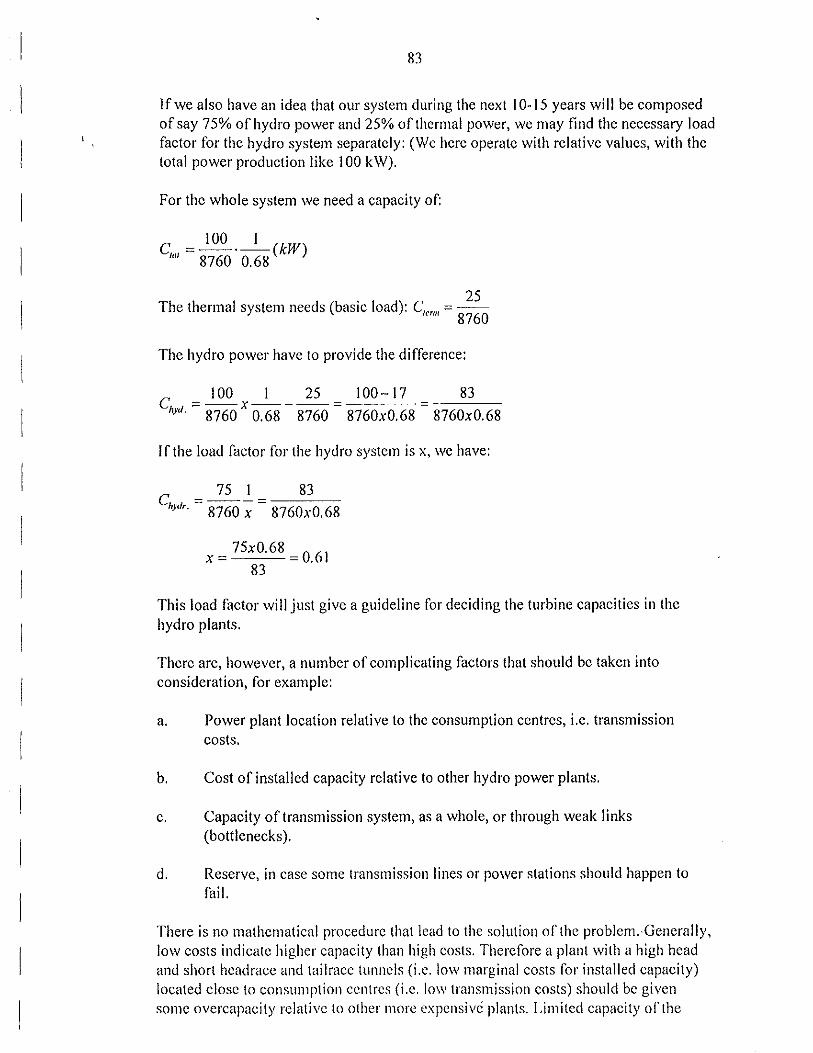
83
If we al so ha ve an idea that our system during the next 1 0-15 years will be composed ofsay 75% ofhydro power and 25% ofthennal power, we may find the necessary load factor for the hydro system separately: (We here operate with relative values, with the total power production like 100 kW).
For the whole system we need a capacity of:
e =~·-1-(kW) '"' 8760 o. 68
The thermal system needs (basic load): e""" = 8~~0 The hydro power have to provide the difference:
e -~x-~--~- 100-17 hyd. - 8760 O. 68 8760 - 8760x0. 68
83
8760x0.68
I f the load factor for the hydro system is x, we ha ve:
e = _22_ _1_ = 83 h>•"· 8760 x 8760x0.68
x = 75x0.68 = 0.61 83
This load factor will just give a guideline for deciding the turbine capacities in the hydro plants.
There are, however, a number of complicating factors that should be taken into consideration, for example:
a. Power plan! location relative to the consumption centres, i.e. transmission costs.
b. Cost of installed capacity relative to other hydro power plants.
c. Capacity of transmission system, as a whole, or through weak links (bottlenecks).
d. Reserve, in case some transmission lines or power stations should happen to fail.
There is no mathcmatical procedurc that lead to the solution ofthe problem.-Generally, low costs indicatc higher capacity than high costs. Thercfore a plant with a high head and short headracc and tailrace tunncls (i.c. low marginal costs for installed capacity) locatcd close to consumption centres (i.e. low transmission costs) should be given so me ovcrcapacity relative to other more expensivc plants. Limitcd capacity of the

1
84
transmission system may make it necessary to consider limited areas separately to ensure that each area gets enough peak load capacity (bottleneck problems). The reserve problem depends on the number and capacities of plants operating on the transmission system, and it depends on the transmission system itself.
Consequently, there is not exact measurements to apply in our case study. Our computed load factor, 0.61, should at least be givcn a "reserve" adjustment. Putting thc
10°1 1 1 d r b 0·61 O 55 TI '1' . . h reserve to ;o, t 1c oa ,actor ecomes: -- = . . 1e ut1 1zat1on tune t en 1.1
becomes: 0.55 x 8760 = 4818 hours.
4.2.5, Optimization of headracc/tailrucc tunncls
Thc water is lead from the intake to the power station through the headrace tunnel, and preasure shaft, and away from the power station through the tailrace tunnel.
The headloss during this transport is found from the Manning formula:
( g_ )'. L h = 1 413 where:
M ·R
q is the waterflow (m3fsec) A is the cross section of the tunnel (m2)
( q) is the average water velocity (m/sec) A
L is !he total !Uimel length (m) M is the Manning coefficient (for unlined tunnels, 30<M<40) R is the hydraulic radius (m)
The headloss represents a loss in capacity (kW), which may be expressed:
9.81·r¡· L ·' 3 = A' . M' . R413 • q = constan! ·q
for q max we get:
Cmax = constant • q3max
e max constan! = -., -
({ max
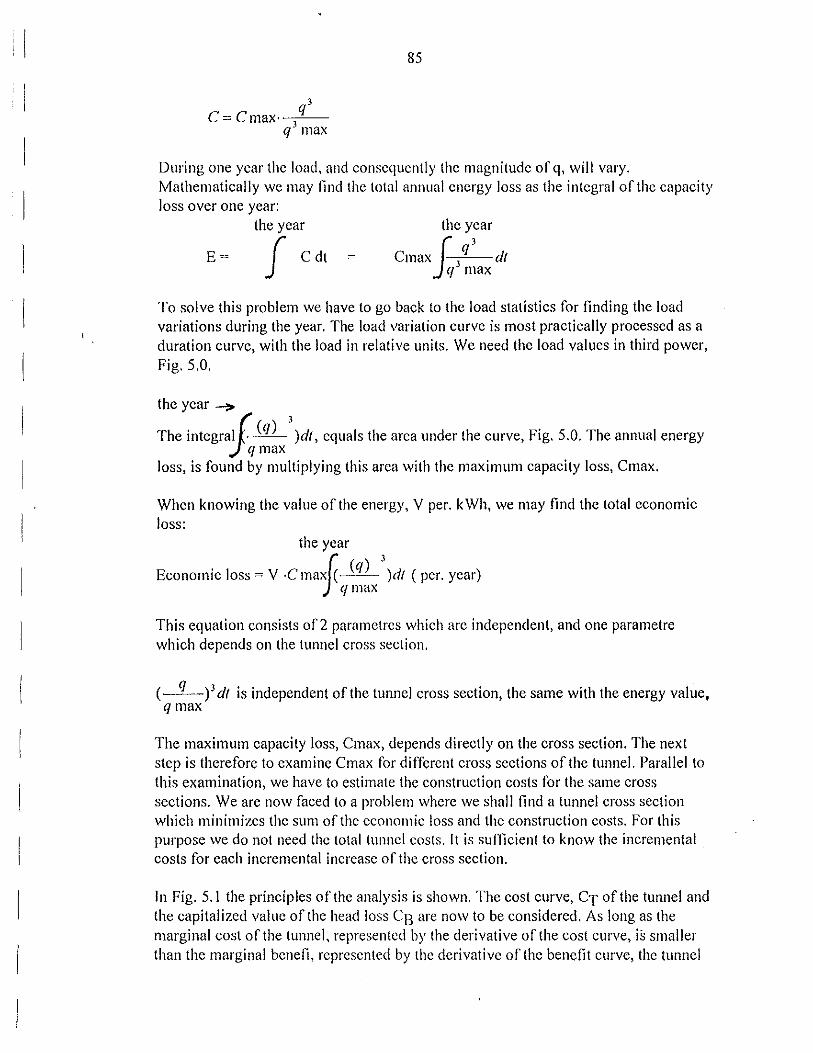
q' e = e max. ~'-----
q3 max
85
During one ycar thc load, and conscqucntly thc magnitudc of q, will vary. Mathematically wc may find thc total annual cncrgy loss as the integral of thc capacity loss o ver one year:
the year
E= J Cdt =
the year
Cmax ( 3 q' di
jq max
To solve this problem we have to go back to thc load statistics for finding thc load variations during the year. The load variation curve is most practically processed as a duration curve, with the load in relative units. We need the load values in third power, Fig. 5.0.
the year-
The integral ( (q) 3
)di, equals the arca under the curve, Fig. 5.0. The annual energy 'Jqmax loss, is found by multiplying this arca with the maximum capacity loss, Cmax.
When knowing the value ofthe energy, V per. kWh, we may find the total economic loss:
the year
Economic loss =V .emaxrc__iq_L' )di ( per. year) ')\¡max
This equation consists of2 parametrcs which are independent, and one parametre which depends on the tunnel cross section.
(-q-) 3 di is independent ofthe tunnel cross section, the same with the energy value, qmax
The maximum capacity loss, Cmax, depends directly on the cross section. The next step is therefore to examine Cmax for different cross sections ofthe tunnel. Parallel to this examination, we have to estímate the construction costs for the same cross sections. We are now faced toa problem where we shall find a tunnel cross section which minimizes the sum ofthc cconomic loss and the construction costs. For this purpose we do not need thc total tunncl costs. lt is sufficient to know the incremental costs for each incremental increasc of the cross section.
In Fig. 5.1 the principies ofthe analysis is shown. The cost curve, Cr ofthe tunnel and the capitalized value of the head loss Cg are now to be considered. As long as the marginal cost of the tunnel, representcd by the derivative of the cost curve, is smaller than the marginal benefi, represcnted by the derivative of the benefit curve, the tunnel

86
cross section should be increased. Thc economic optimum has been attained when both derivatives are cqual in magnitude, i.e. b.C7 = b.C11 This means that the economic optimum cross section is at thc minimum point ofthe curve showing the sum oftunnel cost and benefit.

87
5. THE PLANNING PROCESS
5.1. The hydropower development cycle
The hydropower development cycle consists ofthree main parts, each covering one of the three periods in the life ofhydropower projects:
• Preconstruction • lmplementation • Operation
Devclopment of hydropower follows well defined stages. Each stage takes the project a step forward in the development cycle, based on the findings from the actual and previous stages.
The majar part of investigations, planning and design takes place in the first phase. Normally, the investigation and planning ofhydropower projects pass severa] milestones befare projects are accepted for implementation.
There may be many projcct possibilities anda large numbcr of alternatives to be investigated. Each project has different physical properties and conditions which have to be considered in arder to obtain a good basis for planning and design.
Project investigation, planning and design are normally organized in severa] consecutive studies which are listed here in increasing arder of detail, importance and reliability:
• Reconnaissance Studies • Prefeasibility Studies • Feasibility Studies
Planning and design of hydropower projects involve so many different sciences and technical, environmental, social and economic expertise that investigations have to be organized in a rational and structured manner. However, thc result ofproject investigations may prove negative and investigations are therefore arranged in selfcontained steps or phases.
In each development phase, the projects are investigated to the depth necessary for reaching a conclusion on their capability and suitability for the stated purpose. In each subsequent invcstigation phase, the depth and detail of investigation is increased. The projects pass a new suitability criterium and are either included in the catalogue of possible projects or passed on to the next phase of investigation.
This gradual dcvelopment ofthe plans will ensure that all probabilities have-been investigated and examincd. 1t will also, when conducted in a rationalmanner, ensure that unsuitable projects are not pursucd longer than necessary. Unsuitable projects or project alternatives should be discardcd befo re reaching the conclusion of the planning phasc, thus avoiding unnecessary expenditures. ·

88
The stepwise and sequential development of hydropower project planning is, whi le being technically sound and economically prudent, very time consuming. Ifprojects are urgently ncedcd the time elcment must be given priority. Reduction ofplanning time is often achieved through reduction ofplanning steps. However, some reliability may be lost in the process.
Planning time may be saved by joining reconnaissance and prefeasibility studies. The definite plans may likcwise be included in the feasibility study to gain time. The feasibility study itself is, however, always kept intact and organized as a selfcontained independent study. This is necessary as decision on implementation is based on the feasibility study.
The sequential screening and sclection process described is illustrated in Fig .5.1.
This procedure is the normal one when severa! options are available. In cases where options are few, or limited to one project, the process can be shortened considerably. With sufficient data and information available, the whole planning phase can then be carried out in one operation.
The second phase, Implementation, covers engineering and construction ofthe project. The main activities of the second phase are:
- Design and Procurement consisting of:
• Definite Plan Study • Final Design • Tender/Contrae! Documents • Tendering and Contracting
- Detailed Design and Work Drawings consisting of:
• Detail Design and Preparation of Work Drawings for Civil, Structural and Transmission Works
• Detail Design and Preparation of Shop Drawings for Electro-Mechanical and Hydro-Mechanical Equipment and Works
- Construction of Civil, Structural and Transmission Works
-Manufacture and Erection ofEiectro-Mechanical and Hydro-Mechanical Equipment
- Commissioning and Start-up of lnstallations
The last phase in the life ofhydropower projects, and by far the longest phase, is Operation. lt conunences when projects are completed or, in case of staged development, when the first stage is operational.

89
The whole hydropower development cycle is arranged in consecutive order as illustrated in Pig .5.2, showing the main clcments ofthc cycle.
5.2. Rcconnaisance studics
The first stage of hydropower investigations is the identification of projects. l f this has not been done as part ofthe resource inventories, it must be carried out as part ofthe reconnaissance study.
Reconaissance studies are normally the llrst stcp of project oriented planning. Such studies are of a preliminary nature as their purpose is not to investigate projccts in detail, but like basic hydropower investigations, to identify and investigate the available hydropower resources.
Unlike basic investigations carried out in conncction with hydropower inventaries, reconnaissance studies are carried out for speci tic purposes and ha ve dellned terms of reference. Their degree of details and data rcquirements is, however, littlc more than provided by basic investigations, ifsuch are available.
Reconnaissance studics are organizcd along thc same lines as the planning studies to follow, prcfeasibility, feasibility, cte., but with much lesser dctail and accuracy requirements. I-laving all planning studies similarly organized will facilitate investigations as well as reporting.
lfthc result ofbasic invcstigations is availablc for the arca ofinterest this is a great advantage for the planning opcration as a lot of information, knowledge of the area and data on the hydropowcr resourccs airead y cxists. l f this is not thc case, basic investigations are carried out as pmi of the reconnaissance study.
At this early stage of planning it is necessary to rely on very experienced hydropower planners in order to formulate well balanced projects. The investigations are normally headed by engineers with extensive expcrience from planning, design and construction ofhydropower projects. Contractor experience is valuable as it provides background in costing and scheduling. lt also pro vides knowledge of and experience in the execution of civil works. This will help the planners to arrive at practical engineering solutions, well balanced layouts etc.
As a first screening attempt, river courses are scrutinized, by dividing them into stretches ofvarious hydropowcr capacity, e.g. MW per unit Jength ofthe river. Such screening will give indication ofwhere to concentrate the investigations.
Projects studied in the course ofthe reconnaissance study, including altematives are "kept on the books" ifnot excluded by thc selected project. Thcy are included in the study reportas part of the resource invcntory for future use. lt mayal so be useful to ha ve such projects documentcd to veril)' if contcmplatcd project changes will infringe on or exclude identified project possibilities.

90
The m a in objectives of reconnaissance studies m ay be Iisted as follows:
• to identi fy suitable power projccts for thc stated purpose
• to investigate and study thc various projects and project altcrnatives to the confidence leve! required
• to compare the candidatc projccts and formulate the project best suited for the stated purposc
• to record lower ranked projects and project alternatives for future referrence
• to provide preliminary cost figures and implcmentation schedulcs for the selected project
The main activities involved in the performance of reconnaissance studies are explained in the following:
5.2. l. Personnel
Top expertise is needed to carry out a reconnaissance study in a rational manner. This applies to al! main sectors ofthe study. Top quality personnel is necessary as basic data may be lacking or inadequate for the purpose. Many decisions have to be based on short-cut methods backed by strong personal experience and sound judgement on the part of the planners. However, only a few experts are fui! y engaged in the performance of rcconnaissance studies of hydropower projects. A large part of the expertise needcd is covered by specialist consultations.
The normal project team would include the following experts as a minimum:
• Hydropower Planncr/Tcam Leadcr • Hydrologist/Enginecring Hydrologist • Geotechnical Expert/Engineering Geologist • Experts covering various fields and specialists • Support Personnel
The hydropower planner would, based on planning data and input from other team members, fonnulatc a project, suitable for the stated purpose. He would also be responsible for providing project description and the necessary drawings to illustrate project lay-out and project components. Based on this material, preliminary cost estimates and implementation schedules are prepared as are estima tes of power and energy production.
The hydropowcr planncr/team leader is normally rcsponsible for reporting. He will get inputs from other team members and outside cxperts consulted but will himself structure the study repmi, coordinate and control the text and do the final editing.

91
5.2.2. The study
The study will start with collecting all relevan! data and infonnation. Such data and information are grouped under the following subjects:
Data col/ection
• General data and information • Power market • Hydrology • Topography • Geology and Geotechnical Engineering • Environment • Socio-Economy
Desk study The next step is a desk study. Based on thc available data and information the planners define the main projcct clements and prepare a tcntativc layout ofthc project.
Appropriate maps are needed for the desk study. The minimum requirement is topographical maps ofthe area ofinterest, at the scale 1:50,000 (or better) with 5 meter con tour intervals. A erial photographs are al so of great val u e for the general study, geological assessment and project formulation and layout.
The first concern of the planners is, by means of the available data and infonnation, to establish the main planning elements or parameters for the project. The main elements are:
• Power demand • Flow • Head • Regulation needs • Environmental constraints
lfplanning parameters were to be ranked in order to importance, hydrology would probably come out on top. 1-lydrology deals with the occurrence and availability of water and in hydropower terms aims to answer three importan! questions:
• where • how much • when
All planning involving hyclrology is basccl on the assumption that past history will be i" ... i m ca in !he futurc. Hydrology data are thcrcforc based on long term now rccorcls. lfsuch data are availablc, thc hydrologist's work is rclatively easy.

92
In many instances, however, planning and development of hydropower cannot be delayed for long periods of obscrvation and record accumulation. In the absence of flow records the hydrologist must resort to other means, making his own flow estimatcs.
1-laving cstablishcd tentative planning paramcters and elements, basic planning ofthe project can start. In reality these activities go hand-in-hand because ofelement interdependence.
During planning the project elements are sorted out. Some project elements are conunon to all hydropower projects, such as:
• Dams and intakcs • Waterways • Power Station
Other project elements are project particular, such as:
• Regulation works • Water transfer • Multipurpose elements, etc.
The actual project planning starts with a tentative project layout. Severa! alternative layouts are usually testee! until onc is found which fits si te conditions and makes provisions for the various planning elements. Attention must be given to the practicability of the layout with respect to construction and supply, acccss, transport, environmental disturbance, etc.
Ifregulation ofriver flow is idcntified as a projcct clement, data on dam and reservoir sites are needed, including rcservoir arca/volumc curves. Tentative storage levels, dam heights, reservoir volumes, spillway sizc and layout, etc. are established during the desk study.
Field work and design The desk study plans need verification in the field and the desk study is normally followed by field trips. The proposed project layout and structures are then visualised in their natural surroundings. Alternative solutions are checked, compared and generally so11ed out.
Particular attention is paid to "care of thc river" problcms in connection with construction of dams. Divcrsion of water during construction, including arrangement of cofferdams, should be well substantiated ata relatively early stage.
In thc case oftunnel waterways and underground works, special attention is paid to engineering geology aspects as well as access to work si tes, adits, etc.

93
Importan! environmental and socio-economic aspects are al so addressed, as are multipurpose uses ofthe land and water resources. These aspects are importan! and may beco me decisive in judging project suitability.
Estimates and schedu/es As pmi ofthe study a preliminary cost estimate is prepared. The objective ofthe estimate is not only the construction cost but to make a survey of the total cost involved in developing and implementing the project under study.
The cost estimate should in addition lo construction costs al so include all preconstruction costs, field invcstigations, cnginccring, acquisition ofwater rights, land and rights of way, management, owner's costs, etc.
At this leve! of investigation only the main project components are known. Allowance for physical contingcncies mus! therefore be made. At reconnaissance investigation leve! 25% on civil works and similar is considered a normal budget allowance. On shop manufacturcd goods, engineering and other items, 10% is the accepted contingency allowance.
An implementation schedule is al so part of the study. lt should give an overview of the total time requirements involved in dcveloping and implementing the project. An cxample of such a schedule is shown in Fig. 5.3.
Economic assessmenl For reconnaissance purposes only, simple economic parameters are produced to rate the economic capability ofthe project. Normally power unit cost (cost per kW installeld) and/or unit cost ofannual generation capability (cost per kWh ofannual generation) are provided. These are used for ranking of projects and comparison with other similar purpose projects.
In the following a checklist for reconnaissance leve! studies is provided.
5,2,3, Check list for Reconnaissance studies
l. Data and il¡(ormation Work starts with gathering and evaluation of all pertinent data and information on the projeet and its environs. Data collection and processing are followed by:
2. Desk study Planning clements and parameters
The main project planning elements and parameters are detcnnined after appraisal of:
• power demand • water resources • storage needs and possibilities • power potentials

94
Project Layouts, Elements and Structures
Tcntative project layouts and project elemcnts based on thc established planning paramctcrs are preparcd and tcsted. The desk study plans need vcrification in the field. The clesk study is followccl by:
3. Field inspections
Proposed project layouts are visualised in their natural surroundings. Alternatives are checkecl ancl comparcd. Ncw ideas on layout arrangements, location of facilities, installation and structure are studied in si tu and evaluated, covering:
• infrastructures, existing and project related • regulation, diversion and transfer ofwater • intake, permanent dams and cofferdams • waterways, surge arrangements and outlet works • power station, type, location and equipment • transmission works
Attention must be given to access, transport, construction methods and materials, si te arrangements and facilities, communications, etc. Supplementary field data should be obtained cluring field visits.
4. Reconnaissance study report The report often starts with an Executivc Summary or Synopsis. The stated purpose of the project is rcferrccl and documentcd. All main project data and information are also referrecl and clocumentation provided on the elements and parameters used in the planning process.
The chosen layout and the main project features and elements should be described and illustrated by drawings, including discarded solutions and al terna ti ves.
The project report should also cover and substantiate implementation cost and time aspects.
The main purpose of the project is generation of electricity. lts suitability and practicability for this purpose must be assessed, taking into account its performance in adapting to environmental constraints.
The report concludes with finn statement on:
The technical, economic and environmental feasibility of the project.

95
5.3. Prefeasibility studics
The second organised stcp in hydropowcr investigation and planning is called Prefeasibility study. In this phase onc or more iclentifíed projccts are brought one step further in the plmming process.
The purpose ofprefeasibility investigations is to:
• Establish the need and justifícation for thc project • Formulatc a plan for devcloping the project • Determine the tecbnical, economical and environmental practicability of the
project • Define the limits of the project • Ascertain local interest in and tbe dcsire for the project • Make recommcndations for fmiher action
Having selected identifíed projects for further study means that they are found interesting in hydropower tenns and may become dcvelopment material. lt also means that further invcstigations and proccssing are neecled. When severa! projects are involved it al so means they are part of a selection process in order to find the best project for the purpose.
Identified projects normally have alternative solutions, layouts and structures which were not properly investigated in the fírst pbasc. In thc second phase, during prefeasibility investigations, such alternative solutions, evcn concepts, will be studied and tcstcd in arder to improve thc projcct plans. Various layouts, features and structures will be identifíed, adapted to site conditions, analyzed and tested to arrive at plans and designs which are suffíciently fínn io merit detailed field investigations.
During the prefeasibility study, identified proj.ects may change considerably both in respect to siting, layout and structures. This is a natural development, a result ofthe planners getting familiar with the projcct area and doing their job, continuously trying to improve their product. There is thercfore little sense in doing in-depth field investigations at this stage. Costly fíeld investigations, such as core drilling and similar, sbould be postponed until firm knowledge is obtained in respect to where the various project structures will be situated.
The prefeasibility investigation will proceeclmuch along the same lines as the fírst phase investigation, except that in the second phase the projects have already been located, identifíed and given names.
lt may be an advantage ifthe fírst phase team or persons continue on the prefeasibility investigation to provide continuity. IIowcvcr. ncw pcople with differcnt backgrounds and cxpericnce mayal so prcscnt an aclvantagc in introducing new ideas and concepts, being less bound by previous rcsults.

96
The purpose of prefeasibility investigations is to select and appraise possible projects wotihy of further consideration. These investigations provide the basis for formulating overall plans for basin development. llowcver, reconnaissance investigations will often be m a de of individual projects to determine their worthiness of further study, to define their physical possibilities and limits orto rank thcm with other comparable projeets.
The basic studies engaged in formulation ofhydropower installations are shown in Fig. 5.4.
Prefeasibility investigations are usually bascd on available infonnation and data, often of varicd quality, supplementcd, where needed, by a mínimum of rcconnaissance grade field survcys. Thc investigations should, however, be made in sufficient detail and the data presented should be of sufficient accuracy to pro vide adequate support of the conclusion reached.
lf a preliminary appraisal shows no data or if sufficient data are not availablc, the prefeasibility investigations must await the accumulation ofthe mínimum of data required.
Mínimum in the case ofhydropower projeets means an overall idea ofthe demand for electric power and cnergy and available water .Topographic maps of suitable scale and basic knowledge of the geology are al so required.
5.3, 1, Water studies
Water supply studies as part ofprefeasibility investigations are concerned with the souree, amount, occurrence, variability and quality ofwater for use in connection with the project. 1 n these studies the planner is dependen! on hydrology data.
The ideal source of information on surface water is a long term record ofthe run-off of the stream under study at the location of thc contemplated projeet. Beca use this ideal condition is seldom found, it is frequcntly necessary to estima te the run-off at the desired location.
For prefeasibility investigations the run-offrecords should, ifpossible, show monthly flows. The period of record m ay be short; it should, however, pro vide adequate information to establish maximum, minimum, average and critica! conditions. If there is no sufficicnt record covering a pcriod which may be critica! in relation to utilisation, it may be necessary to synthesise such a record.
In planning for new or increased utilisation of water, proper allowances should be madc for cxisting uses. Established rights to the use of water should be recognised and protectcd or lcgally subordinatcd to ncw uses with a higher order of preference.
The cost of acquiring the right to utilize the water for hydropower purposes should be estimated and includcd in the project costs.

97
5.3.2. Various studies
F/ood control Reconnaissance investigations are concerned with:
• The rnagnitude, stage and frequency of anticipated floods for use in deterrnining the desirability of including flood control as a project purpose.
• The design flood to be considered in thc design ofhydraulic structures
• The rnaximurn probable flood to be expected during construction ofthe project
Estirnates of flood flows for these studies may be based u pon envelope curves of recorded floods in the general region wilh the application ofadequale safety faclors. In the absence of recorded floods, othcr rccngnised melhnds of eslimaling flood flows may be uscd.
Sediment studies Where rccords are nol available, estimatcs of thc sedimenl load lransported by strearns may be bascd on drainage arca or average annual discharge using data from similar streams.lfthe strcam under study is an unusually heavy carrier ofsedimenl a limited sampling program m ay be needed.
Changes in river regime resulting from construction of dams or other works may crea te silting or erosion problems which will require special attention.
In some cases comprehensive sediment traps and facilities are needed to reduce sediment content to an acceptable leve!.
Operar ion studies Water operation studics are carried out in order to make it possible to visualize the manner in which the project or basin plan will work. In operation studies, various assumptions as to water supply and water requircments are compared under anticipated operating conditions. Basically, the study is a system of accounting for the water income and expenditures which presents a picture ofthe project in action based on run-off conditions experienced in the past.
The operation study should be based on monthly flows, ifsuffícient data are available. The length of thc period of study m ay partly depend on avai Jable stream flow records and olher data, butlhe study should include a period of crilically low flows and extend through a period prior and subsequent to thc low flow period suffíciently long to represen! a realistic cycle of operations.

98
5.3.3. Engineering
Surveying and Mapping Modern topographic mnps ata scale of 1 :50,000, with 1 O meter con tour intervals are now available in many countries. In arcas covered by such maps, the surveying needed for reconnaissance investigations will be greatly reduced. Vertical aerial photography with stereoscopic coverage is helpful, in particular if adequate topographic maps are unavailable.
Reservo ir arcas and capicities (volumes) can be estimated from the abo ve mentioned topographic maps. Whcrc maps are not availablc a limited number of cross sections will provide information for estimating capacities.
Reconnaissance estimates of dam volumes may be based on a pro file ofthe dam axis. 1 f the topography of the da m si te is unusually irregular, rough topographic surveys may be needed.
Satisfactory "on paper" locations of canals and waterways can be made from the available topographic maps. The location on paper should be supplemented by field inspections and observation of cross slopes and cross drainage requirements.
General geology General geologicalmapping ofthe arca undcr investiga! ion will be ofvaluable assistance in interpreting land classification data, groundwater information and many other factors which influence the physical plans.
Foundation geology The suitability of foundation conditions for dams or other majar structures should be determined from field examination by a competen! engineering geologist. Test pits or bore boles may be necdcd if qucstionable conditions are encountered. Seismic refraction measurements are used in this investigation phase, bu! seldom core drilling.
Construction malerials The location and size of suitablc deposits of construction materials; earth, rock, concrete aggregate, etc., should be macle by competen! engineers and geologists during a field examination.
Projec/ plan A comprehensive project plan will be described and illustrated with adequate drawings from which quantities and vol u mes are picked for use in estimating costs.
Cost esimates Construction costs, can usually be estimated from a consideration of majar construction items such as excavation. embankmcnt, concrete, number of size of generating units etc. Thc total cost of a. comparable recently built existing facility can be expressed in terms of majar construction itcms thereby providing a unit cost for use in estimating !he proposed structure.

99
The estímate will be modified to reflect unusual construction problems such as accessibility to shipping points, climatic conditions affecting construction time or method, altitude which may affcct cfficicncy of cquipment and manpowcr, availability oflabour and suppliers, cquipmcnt rcpair facilities and location and quality of construction materials.
The cost of establishing construction camps, land acquisition and the resettlement of displaced people should be estimated and included in the project costs.
Annual operation, maintenance and replaccment costs can be estimated from experience with similar projccts in the arca. Otherwise a percentage figure ofthe construction cost is used, 1-2% is an acccpted figure.
lt is sometimes necessary to divide costs in local and foreign currencies, either for item by item or as percentages of the total.
5.3.4. Check list for prefeasibility studies
Col/ection and evaluation ()( existing data on:
• Existing infrastructure • Power market (existing demand- future demand) • Topographicalmaps • A erial photos and other pilotos • Hydrology rccords • Evaporation rccords • Meteorology rccords • Geology records
Gelogicalmaps, general geological description ofthe arcas, soil maps, previous field investigation rccords (for instancc in connection with prospection, mining. road building, etc.)
• Sedimentation and erosion records • Seismicity records • Existing plans for hydropower developments in the area • Environmcntal aspects • Present and future multipurpose considerations:
Flood Control, Irrigation, Water Supply, Navigation and Transport, Fisheries
Field Investigations Field investigations needed to complete the data bank for reconnaissance grade planning.

1
1 1
100
The above data and information should be compiled and a pended the Prefeasibility Report, which shall cover:
• River Basin Plan: A development plan for the whole basin, based on a river basin survey, wherc al! idcntificd projccts investigated ha ve been includcd. Thc purpose is to rank thc projccts aJl(l lo establish the effect implemcntation of one project will ha ve on the others and thc basin as a whole.
• Plan Formulation of thc individual projects, based on: Evaluation ofwater rcsources, storage possibilitics, powcr output, reconnaissancc lcvel survey and basic design of power plant(s), divcrsion, intake ami watcrways, surge arrangcmcnts, pennanent dams, cofferdams, access facilities, transmission systcm etc. Cost estímate, implementation program.
• Economic and financia! evaluation.
• Alternatives: Alternative solutions to individual projects and basin plan are forrnulated and discussed. Alternative supply in the case ofhydropower projects should also be covered.
• Enviroimlental Aspects: The environmental aspects, usual! y the object of separa te investigations should be considered and a program for ecology studies should be made.
• Further lnvcstigations: Field Investigation programs for the next phase, the feasibility study, should be made, including cost estímate. Tcnns of Refcrcnce for the feasibility study and cost estímate is also included.
The prefeasibility study report should close with firm statements on the suitability of the project in development context and its practicability for the stated purpose. A concise recommendation on the project's further development role is al so required.
Once the Prefeasibility Study has been concluded and the project is found to be attractive for further considcration, thc ncxt step in thc investigations of thc project is the Feasibility Study.

1 o 1
5.4. Fcasibility studics
5.4.1. Introduction
The next stage, or feasibility investigation, is a comprehensive analysis and detailed study of the contemplated project, directed towards its ultimate authorization, financing, design and construction.
Thc purpose ofthe investigation is to establish and define the specific engineering and operation plan and to determine whether the potential devclopment has technical, economic and environmental feasibility and justification under anticipated economic conditions. Feasibility investigations include analyses of resources:
• Esimates ofnet economic values to be produced • Estima tes of cost of development and construction • Estimation of cost of operation, maintenance and replacement • Assessment ofthe impact implementation ofthe project will have on the
environment and the cost ofmitigating the effects.
Analysis ofthe practicability ofthe plan and appraisal ofthe revenue from which reimburscmcnt of construction costs and paymcnt of annual operation, maintenance and replacement costs will be derived are also included.
The feasibility investigation should provide firrn, detailed and reliable information u pon which the Government or Owners can base authorization of the project for devclopmcnt and from which lending agencies can determine thc desirability of financing the cost of devclopment.
The data upon which the investigation is based must be of such quality and quantity as will assure the ability ofthe project to produce at Jeast the values estimated and to ensure that it can be constructed, operated and maintained at no more than the estimated costs.
The feasibility study plans must be sufficiently firm to ensure that no major alteration or modification which would significantly increase costs or otherwise impair the feasibility of the projcct will be found necessary during the course of final planning and construction; hence, so far as practicable, plan formulation studies should reduce altemative plans, facilities or materials toa mínimum.
5.4.2. General considerations
The physical feasibility and the cost of the works necessary for control and use of water and Jand rcsourccs are critica! factors in dctennining the practicability ofa proposed projcct. The extent and dctail of enginecring surveys, geological explorations, dcsigns and estima tes of costs unde11aken in connection with feasibility investigations should be sufticient to assure the reliability ofthe project plan anda guarantee that thc project can be built at the estimatcd cost. The actual design is call'icd out toan accuracy Jcvcl usually tcrmcd "preliminary".

102
The m a in physical data input needed for planning of hydropower development are listed in Fig. 5.5.
In hydropower terms, as mentioned earlier, the two most importan! characteristics of a water resource are head (H) and flow (Q) as shown by the equation for electric power:
P=E·H·Q(kW)
H is ned head in meters. Q is flow in m3Jsec. The factor E (approximately 8) includes the gravitational constan! g (9,81 m/sec.2) and generation equipmcnt efticiency.
Data on topography consist ofmaps and similar. and include information on access, infrastructure and communication. Data on flow is obtained through hydrological investigations.
The first step ofthe feasibility investigations is to make a thorough review and analysis ofthe prefeasibility study report followcd by compilation ofnew information and data relevan! to the project. The new data are assessed and controlled before incorporation in the project "data bank".
Power Markel Survey In connection with feasibility studies for hydropower projects the power demand which can be supplied by the project under investigation must be established atan early stage.
There may airead y exist an overall power market survey and power demand forecast, in which case the task is easy, as many ofthe necessary data and much ofthe information will be known and available.
The following aspects have to be addressed in a power market survey carried out for the purpose of demand forecasting:
• Existing studies, collection and evaluation • Hist01y and condition of the market • Classification of load into consumer groups (households, industri, etc.)
As much information as possible on: • Historical trends and growth rates of the various consumer groups • Population growth projects • Anticipated future level of economic development • Tariff, tariff policy • Substitution loads (if competitive price of new supply) • Demand forecast with anticipated variation in load • Load distribution by geographical arcas • Other supply alternatives and their price

103
5 .4.3. Project plans
Simultaneously with ficld investigations the work on the project plans will start. Thc prefeasibility study plans will form the basis, be improved on and optimized. Alternative solutions will be analyscd, adapted and tested. Selection by comparison will be made. In respect to the main project features choice of type, shape, fonn and size must be made and the adapted solution presented. For example, ifthe damsite is suitable for severa! types of dams the choice must be made which dam to include in the project plans.
Any new alternatives and solutions which may come up during the work on the plans will al so be investigated and included if they represen! improvements lo the project, lhe object being to arrive al the oplimallayout.
Desk studies combined with si te visits will be used lo compare alternative solutions and to ensure that they functíon in the field as well as on paper.
The work on the project plans, field verification and field work go hand in hand .The work on one will be adapted to the result of the other.
A lot ofwork goes into finding the best layout for the project. The criteria being to establish a project which will be safe and easy to operate and maintain and which can be constructed at the estimaled cost within lhe time allowed. To achieve this, considerable thought and insight go inlo preparing a layout that is uncomplicated and conducive to the use of rational and flexible construction methods and processes.
The design leve! for feasibility studies is norrnally termed "preliminary design". It should be sufficiently detailed to ensure realistic and practica! solutions and reliable cost estimales.
The main parts of hydropower projects are:
• Regulation Works • lntake and Waterways • Power House and Switchyard • Transmission Works
The main pm1s are made up of various components, such as:
Regula/ion works Division works (cofferdam, diversion tunnels, canals, etc.). Permanent dams wilh spillways, bottom outlets, gates, log floating facilities, navigation facilities (locks), fish bypasses, etc

104
lntake and waterways Headrace consists of intake with trash racks, stop logs, gates, spillways, sedirnent traps, etc. and waterways consisting of canals, culverts, tunnels, surge or forebay anangements, rock and sand traps, pressure shafts or penstocks, val ves, etc.
Tailrace consists of draft or turbine pits, back water gates, surge anangements, tailrace tunnels, culverts or canals, outlet works, etc.
Power sta/ion The power house constains: Mechanical equiprnent, such as tm·bines, regulators, cooling systern, ventilation, drainage, cranes etc.
Elcctrical equiprnent, such as generators, witchgear, transforrners, auxiliary power supply, power cables and control cables, conununication, protection and control equipornent, switchyard, etc.
Transmission works Transmission works consist of transmission lines, including communication facilities, substations, dispatch centers, etc.
Parts and componenls of an auxiliary nature are: Access to project si tes (roads, bridges, rail, ship, air), telecommunication, etc. Also offices, workshops, housing, utilities, recreation areas, etc.
Further, and of a more provisional character; construction camps and mobilisation arcas, dcposits for cxcavatcd material, borrow arcas for construction material, contractors plants, cte.
5.4.4. Estimates and schedules
Construction schedule and construction cost estirnates will be rnade based on rnain construction and equipment items and miscellaneous costs. The cost of the rnain civil works are based on cornputed volumes and intemational unit prices adapted to the actuallocation. Miscellaneous costs cover all the costs not included in the main iterns. These will be defined as percentages ofthe rnain iterns.
The cost ofthe perrnanent equipment will be adjusted pre-bids based on prelirninary equipment descriptions and performance speciftcations, obtained frorn approved manufacturers and suppliers. Comparison with the planner's own cost figures of similar equipment will be rnade and adjustments made if necessary.
Construction Cost Elements:
• General costs and infrastructure • Civil works • Equipment (manufacture, transpo11 and erection) • Taxes and import duties • Engineering fees ancl supervision costs

105
• Administration and Legal costs • Insurance • Land acquisition, rights ofway, resettlement • Surveys and investigations • lnterest during construction (for financia! evaluation)
Both construction schedules and cost estimates will be cxpanded to include all work and costs involvcd in the investigation, planning, design, purchasing (tendering) and construction of the work as these figures will be used in the economic analysis.
The cost figures should be prescnted in the cost estímate uncluttered by contingent costs. Contingency allowances should be made at cost summary leve!, preferably included in the implemcntation cost estímate only.
Inflation is not accounted for when establishing the price basis for cost estimates. lt is therefore importan! to date such estima tes so that they can be tied to their validity date.
Sometimes, when foreign currency is in short supply, it is necessary to distinguish between outlays in local and forcign currency. The foreign currency portion of cost items is therefore assesscd and shown in the estímate.
Operation, maintenance and replacement costs of hydropower projects are cost items which must be included in thc economic analysis of projects. lt would, however, serve no purpose to make a detai Jcd estímate of such costs as there is sufficient experience figures to re! y on. For the purposc of feasibility investigation these costs per year are set at 1% of the construction costs.
Gross power revenues represen! the income from the sale of energy and peaking capacity. Power and energy should be sold at the Jowest possible rates consisten! with sound business principies. Ratcs should be establishcd which will pay all annual costs and permit repayment ofinvestment costs in a reasonable period oftime. Ifrequired, and other conditions warrant it, power revenues may be used to pay part ofthe costs of other project purposes. The rates established should not be greater than the rate schedules for commercial electric power in the market area.
A higher and a Jower ratc is often used in the economic analyses to investigate how sensitive the rentability of a project is to variation in rates.
Feasibility Economic feasibility is defincd as positive when project benefits exceed costs over the Ji fe of the project.
Financia! feasibility is considered proven when the project is able to secure the financing needed for implementation. It must al so be clemonstrated that the revenue receipt pattern will provicle clebt service ata reasonable rate ofreturn on Joans incurrecl and on equity capital investecl in the projcct.

106
Precise! y defined projects are acts of investment, combined with other actions to realise certain development objectives. Economic analysis play a role in clarifying the economic worth of hydropower projects but the decision to go ahead with a project can not be based on this alone. A well-chosen project usually passes a number oftests which are not necessarily quantitative, e.g. how the project fits in to the national economic plan. Public utilities, however, should avoid deep involvement in projects unless there is strong indication that they will do well in an econornic analysis, i.e. the econornic analysis can be considered as a final test.
Cashjlow The basis for cconornic and financia! tests is cash now tables, they show the cost and income streams ovcr the life time ofthc projcct. The economic tests are not concemed with the source of the moncy invested, nor with interests or rcpaymcnt. Only thc disbursemcnt schedule is of interest, and it forms the main cost strcam.
In the case of financia! analysis, the debt service, the service of the investcd capital, and loans will be included in the cash flow table, not the investment itself.
lt should be noted that compounded interests on loans and quity accumulated during construction period are added to the principal.
The principies for developing cash flow tables are illustrated in the following two figures: Fig. 5.6 and Fig. 5.7.
Opportunily cost of capital (OCC) 1t is not possible to attach significance to the results of economic analysis without a standard. The standard is the opportunity cost of capital. The OCC is thc lowest acceptable retum which capital should be expected to earn in a given country, as represcnted by the earning power of capital in the marginal, or last-included project in a country's optimum investment program. In practice, the OCC is nota precise figure, it depends, for example, on risk.
In most countries the OCC will fall within a range of 8-15%. When projects can shown interna! economic returns of say 12% or higher, it is not necessary to estímate the OCC for comparison purposes. At rates below 12% specific reference to the OCC would normally be made. Therc may occasionally be countries whose OCC falls outside the range cited.
Leas/ Cost Alternatives In accepting projects for financing authorizing agencies prefer "least cost" alternatives. Feasibility investigations will therefore include least cost comparison studies when appropriate. The process is illustrated in Fig. 5.8.
Finding the least-cost project consists of calculating the present worth ofthe. investment value and the system operating cost streams associated with possible projects such as hydro and thermal schemes for a range of discount rates. The possible

107
projects will have had feasibility studics. The preference changes (the equalising discount rate) are comparcd with the opportunity cost for capital to identify the Jeastcost alternativc.
lt should be noted that the Jeas! cost supply may be a combination ofhydro and thermal, or supply by extension oftransmission systems. Only power supply alternatives having identical supply capacity can be directly compared.
5.4.5. Remarks on feasibility studies
From the foregoing text it is understood that feasibility studies play an imp01iant role in investigation of projects. Their importance for decision makers are also undisputed.
A great deal of expertise has been involved in preparing the feasibility study, and since hydropower planning involves so many fields of expertise. as many as 20-30 different experts have taken part.
The implementation ofthe project, !he first step ofwhich is the Definite plan study, requires fewer experts with wide allround experience background than the Feasibility study. For implementation the expertise needed is more concentrated on design, construction and manufacture.
The major components of any hydropower project are from the fields of heavy construction and electro-mechanical equipment manufacture. Specialists in these fields are required for the further development of !he project.
A comprehensive and well prepared feasibility study gives the Owner the foundation he needs on which to base his decision. The properly prepared feasibility study will prove the project's technical capacity and its economic viability. The economic and financia! feasibility analysis should be done in such a way asto prove the economic capability ofthe project as well as provide easy comparison with similar and other projects which are competing for financing.
lfthe investigated project can be constructed and equipped, operated and maintained over the Ji fe ofthe project and no! in any way represents any danger or risks (except calculated risks) to the environment, the people concerned and the public in general,such a project is stated to be: "Technically Feasible".
The second main criterium for feasibility studies concerns the economic and financia! viability ofthe project.
To be judged economically and financially sound, a project must be able to "earn its own way". This means that the project must be sufficiently attractive economically to raise investment funds.

108
5.4.6. Reports
In the fíeld ofwater resources investigations, repo1is provide a permanent record of work accomplished. These reports are frequcntly presented for the considcration by governmental and other bodies responsible for long range development.
As these repmis from the basis for authorising further action, including the construction of projects, they must be predicated on a sound foundation. A basic principie of reporting is that reports are of no greater value or reliability than the underlaying investigation and, converse! y, that the fíndings of the investigation are of little worth unless presented in a clear, readable and understandable manner.
Hydropower planning reports may conveniently be classifíed into three general categories:
Basin reports, which cover the needs, resources and potential development of an en tire river basin or sub-basin.
Project reports, which are concerned with the development of specific projects. They may be ofa reconnaissance nature covering only a preliminary analysis ofthe project, or they may be full scale feasibility reports supporting recommendations for construction and development.
On completing the feasibility study a major part of project planning is brought to its conclusion. However if the project is authorized for implementation, the following planning and design work is needed to prepare the project for construction:
Definite plan study, a complete study ofthe authorized project, presenting detailed information to guide the design, construction and operation ofthe project. Final designs and specifications from which construction contracts can be awarded are included, as are the basic principies from which operating and repayment agreements can be negotiated.
5.4,7, Summary and check list for feasibility studies
J. Mobilization
• mobilize study team • establish liaison and cooperation with Owner • establish study organisation and liaison with Authorities
2. Data and il¡(ormation
• collect relevan! studies, data and information • review prefeasibility study data • screen and control new data and establish project data bank on:
• power market • existing infrastructure

109
• hydrology and meteorology • topography and maps • geology, soil and materials • multipurpose aspects • environment disturbance and constraints • socio-economic conditions
3. Project formula/ion
• review prefeasibility study plans • revised and update prcfeasibility study plans ancl prepare preliminary project
formulation based on all relevan! data and information, employing upgraded planning parameters and critcria.
• verify the project fonnulation in thc field and adjust it to physical field conditions, new information, restrictions and requirements.
4. Fie/d invesligations
• review and adapt existing investigation program • approve contrae! documents for investigation works • assist Owner in engaging contractors for field work • start, monitor and supervise field work • arrange for laboratory testing of samples • interpret results and adapt the field investigation program
5. Projecl /ayol/1
• update and revise planning parameters • prepare desk project layouts • reconnaitre in the field for alternative layouts • establish layout and main project componcnts, verify in field • obtain Owner's approval for project fonnulation, layout and main components and
facilities • adjust field investigation to accepted layout
6. Engineering design
Preparation preliminary design ofthe project and optimize layout and the main project components, such as:
• river transfer and diversion • regulation works • intake and waterways • power house and appurtenant facilities • transmission lines and substations • permanent si te installations

11 o
Estab1ish dimensions and describe main and auxiliary project equipment and prepare performance specifications for the complete outfitting ofthe power plant; hydromechanical as well as electro-mechanical and auxiliary equipment: • turbine and valvcs • generators and swi tchgear • transformers, power cables, switchyard and substations • auxiliary equipment for monitoring, protection, control, etc,
7. Scheduling {1/Jd estima/es
• prepare construction plans and implemcntation schedules • prepare cost and price study;
• establish main item volumes • establish unit prices for main items • establish percentual (%) additions needcd for supplementing main
items/elements to complete the estimate • estimate the "general cost" components • establish estimate confidence leve!, volumes, prices, etc. and establish
contingency factor levels.
• make equipment cost enquiries to suppliers of electro-mechanical and other equipment
• prepare cost estimates for project implementation, including:
• civil works • hydro mechanical works • electro mechanical works • transmission works • environmental and resettlement costs • land acquisitionlrights ofway • investigations • engineering and management • contingencies
The above estimates are compiled into an implementation cost estimate or budget:
• arrange disbursement schedules, based on the cost estimates and implementation schedules.
• establish cost figures for annual operation, maintenance, rehabilitation and administration costs
• establish market value of electricity at places where changes in ownership occur. • establish annual income streams from sales after correcting for losses and pick-up
rate, etc.

111
8. Economic andjinancial analysis
Prepare cash flow tables showing project costs and income streams over the lifetime of the project:
• cash flow for economic analysis • analysis of financia! terms and equity and debt service • cash flow for financia! analysis • carry out economic and financia! tests and establish EIRR and FIRR for the project
base case. • carry out sensitivity analysis to register the effects of changes in primary
parametcrs • Jeast cost project considerations • formulate statement on economic and financia! feasibility
9. Addilional and opera/ional works
To complete the feasibility investigations all or some ofthe following items should be covered: • preparation of investigation program for definite plan study, including cost
estima te • financing study ( optional) • tariff study ( optional) • report on geo-investigations and other investigations carried out during project
investigation.
1 O. Repor/s
The Owner/executing agency is periodically informed through progress reports. Changes and similar and their approval are documented with intennediate reports.
The feasibility study report shall comprehensively document the feasibility study investigations, the findings and the infonnation they are based on and shall attest firmly to the quality ofthe study. The report shall contain firm statements on teclmical, economiclfinancial and environmental feasibility and recommendations on project suitability and outlook.
Feasibility study reports are quite comprehensive documents andan executive summary is often prepared to make them more accessible to the public.
A feasibility study flow chart has been prepared and is displayed in Fig. 5.9, Feasibility study flow chart.

112
6. LIST OF REFERENCES
The material contained in these Jecture notes are mainly refened to the following publications: Hydropower Development Series; Norwegian lnstitute ofTechnology (NTH):
-No. 1:
-No. 2:
-No. 5:
-No. 9:
-No. JO:
Hydropower Development in Norway; Vidkunn Hveding
Investigation of Hydropower Resources; Jarle Ravn, Erik Tóndevold (to be published)
Planning and Implementation of Hydropower Projects; Jarle Ravn
Rock Engineering; Bji:irn Nilsen, AlfThidemann
Rockfill Dams; Bji:irn Kjrernsli, Tore Valstad, Kare Hi:iegh
Lecture notes, N ORAD course in Hydropower Development at NTH:
Turbine Governing and Transient Flow; Torbji:irn Teble
Technical-/Economic Analysis in Hydropower Planning; Ola Gunnes
Powerhouse Design; Sverre Edvardsson
Arrangements of Gates and Trashracks in Tunnels, Leif Vinnogg
Other publications:
Norwegian Soil and Rock Engineering Assosiation: Publication No. 3: Norwegian Hydropower Tunnelling (Tapir NTH 1985) Publication No. 5: Norwegian Tunnelling Today (Tapir NTH 1988)
Hard Rock Underground Engineering; Seminar Chengdu, China, 1985, lectures prepared by FHS-group ofNorway.
Technicai-Economic Considerations in Planning ofHydropower Plants; Odd Guttonnsen (in Norwegian).
Hydropower Engineering Handbook; John S. Gulliver, Roger E.A. Grundt, editors; McGraw-Hill, 1991.
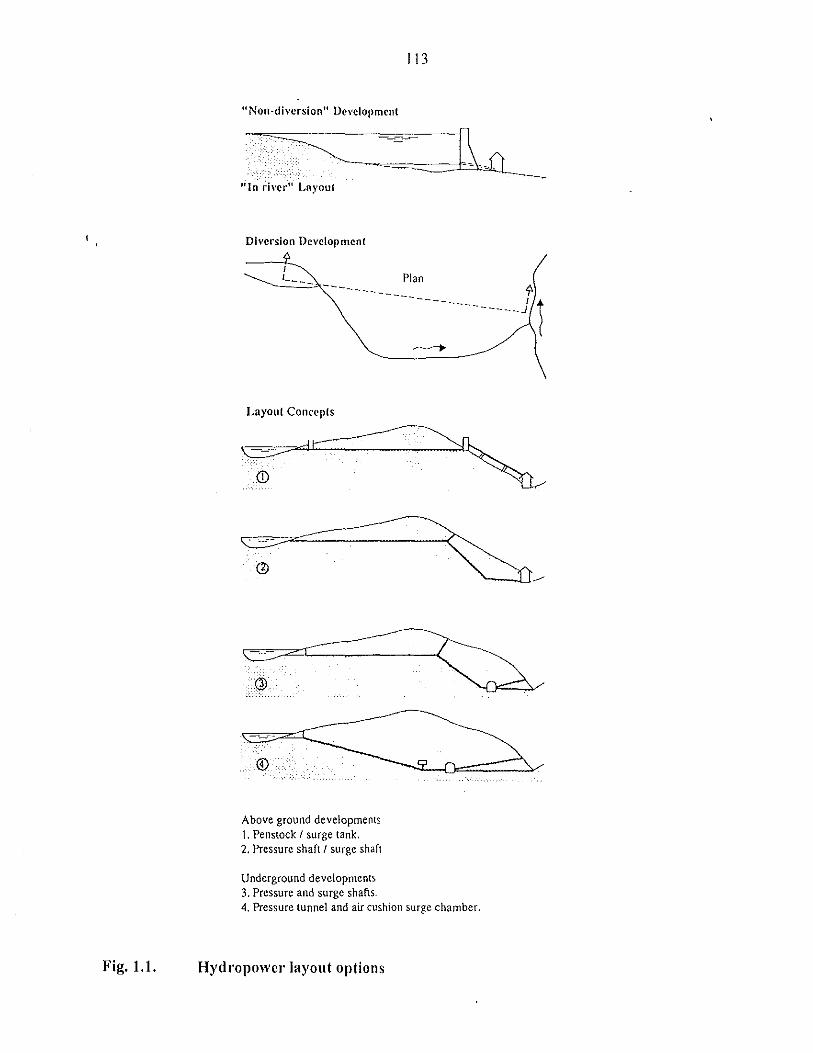
Fig. 1.1.
11 Non-divcrsion" Ocvclopment
"In rivcr" Layout
Divcrsion Dcvclopmcnt
Layout Conccpts
Above ground developments \, Penstock 1 surge tank. 2. Pressure shaft 1 surge shaft
Underground developments 3. Pressure and surge shafts.
1 13
Plan
----
4. Pressure tunnel and a ir cushion surge chamber.
Hydropowcr layout options

Fig. 1.2.
Fig. 2.1
114
lhun Ht•st•rroir
l.akc Rt•.wrvoir. T:~pping
Da m Dammtng
Tapptng
Lakc Ht•srrvnir, Comllincd Damming and T:tppinl.!
Storage options
Corc drillhole
f Sand5lOnf' f
1 Qt,. o
f f
u {surge u u H
189.0
1 km
Engincering gcological profile based on detailcd surface investigations

Fig. 2.2
a)
b)
Annual hydrograph
Time
Annual hydrograph One flood season
A·:::.·_·:::::::::::: n·----------------r -~:.;·-------------
/ \-------------/ ,-----------
/ "'-------Time
115
Flow-duratíon curve
Annual hydrograph Two flood seasons
Establishment of a flow-duration curve
Frequency graph
Res u 1 t ing flowduration curve
~ "-...
' "' "--..
a) b) Two different hydrographs producing equivalen! duration cun·cs
Fig. 2.3
Curv a
1\
' !.... Curve b
Per cent of time
Average duration cm·ves.
~
1

Fig. 2.4
§ u. u. o ' 5 a. o Ul
\¡
~ ~
Fig. 2.5
!16
1 1 1 1 1
' 1 ' 1 1 1
\\ \\ kUnreguloted \
\
' :, "-~ \
Reguloted#, t":>-..- -· - -! --~ ¡
20 40 60 80 lOO
Per cent of time
Unregulated and rcgulated flow-duration curves
1
REGULATION YEARS / 1 "' :1'1 1 3\' :r ' l ' ' [\'~·0•)-'
,, -:; ""' ' ... _J._ 1 ¡l / v ' ' LJ T 1 ..'M',0.¡y ' ' ' 1 =:! '~xt // i -~ ' ' -: ·{;"' '9 . -' r~ ' V ' /:, Pí /:~:.. 1---~[-' ' ' ' : 1 /~ V ' - f-·
1
!.t ~~ -·- '
·--· A,. ~) 1 . TIME SCALE, OAYS(f)
Threc successive water rcgulation years

Fig. 2.6
Fig. 2.7
117
'\nax -
Storage (S)
_Flo~ p~od_ Low water period ----
Tapping period
qmin- - - - - - - -
Time
Sketch showing sorne basic terms
:> " o 00 .-<
""' " " •rl
" <l)
00"
"' 1-< <l)
10
~ il
.... .. o
" "' "' " •rl .. » ,. w
•rl
" (J
g_ JO
"' " (J
H lO ,..¡
o " ;. ~ 10
1 .56159 : 1 ,',S1JSI
11 j J ~6/S7
¡ :'1 :: : :MS6 "1'
,: :: ..
/ J/ ,' ¡' ~~ IU //:l ,' ¡, ., '
,:- ¡: :' 1 •"
/: ¡'{S9160 '. . , 1 •• . . . .. ' '
....... ' :·
....
"' ~ .~~~~~;:~~~~~=-~~~~~ 10 lO )O "O SO liO 70 t() 90 100 1\0 lliJ IJO 1~0
Reg, discharge in % of average runoff
Annual rcgulation cun•cs for a NonYcgian hydrological station for the pcriod 1951-64
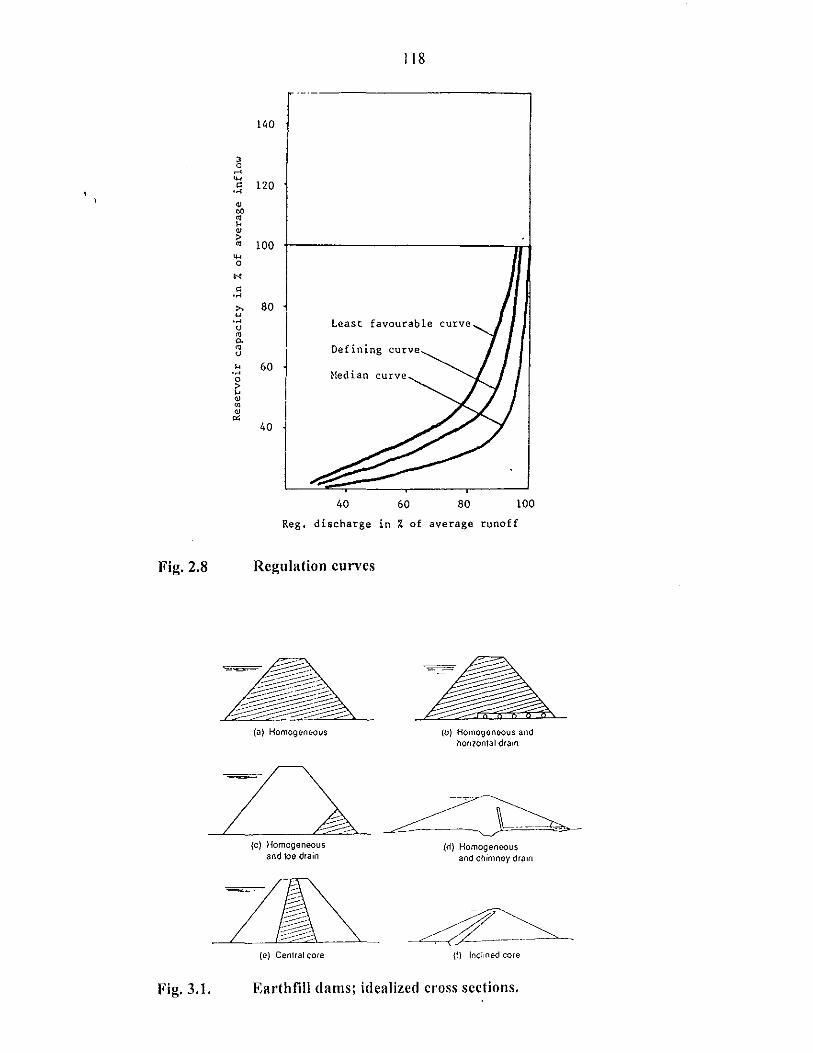
, o ~
"' " •-<
• "' " k • , " "' o
"' " ,.,
"' u ,., u
" o.
" u k
'" o , k • ~ • "'
Fig. 2.8
Fig. 3.1.
118
140 r --
120
100
80
1
Least favourable
60 j Hedían curve
1
i 40
40 60 80 100
Reg, discharge in 7. of average runoff
Regulation curves
(a) Homogeneous
{e) Homogeneous and toe drain
(e} Central core
a (b) Homogenoous and
hoflzontal dra1n
{ti) Homogencous and chimney dra1n
--~----Earthfill dams; idealizcd cross scctions.
'

Fig. 3.2.
Fig. 3.3.
119
~· /
'%'
~~-(a) Cen1ral coro {b) Sloping sor e
(C) Oiaphragm
Rockfill dams; idcalizcd cross scctions.
Type
Gravity
Arch
Buttress
Material of Construction
Concrete, rubble ntasonry
Concrete
Concrete falso timber and steel¡
Concrete dams
Typical cross section
..... ~ ... B ............ .. Slab-... Buttres!'.
Plan view

1 1
Fig. 3.4.
1 1
Fig. 3.5.
120
R
Frcc-body diagram of thc cross scction of a gravity da m.
formed vertical
up~lrcam 1 rT--, •. ,_,_,
~\~" '-----jdownstrcam
face facc
200 mm dia drain
200 mm dia bitumcn·fillcd hole
addiliona_l down~!ream grouc rctemion watenrop Í\ frtled rf joint\ are j!fllUI<'d. J\ IHl ;lffh d.1rn\
Keyways and waterstops for dams.

Fig. 3.6
Fig. 3.7
(a) Series of horizontal arches
121
ibi Series of vertical cantilevers
Structural elcments of an arch da m
Constan! center arch dam
Vanable center arch da m
r- ¡oo· ---1 ___ "" 580 __ r'W¡oo· ----1 -- Elev. 560 ---
- Elev. 540 --
-- Elev. 520 ----
-- Etev.500 ~60'~
U·shaped canyon
1 1 1 8 o o .., .X ~
Plan view
Crown section
Types of arch dams
V-shaped canyon
1 1 1 1 1
ll o
o t ;¡,
¡;¡ 580
'.t~ 1"0 ~~ ~
Plan view
1L Crown section
1 o ~ ~

Fig. 3.8
Fig. 3.9.
122
y
1
8/2 8/2
~B~ R R
Frcc-body diagram of an arch rib
Slab assumed to be a series of horizontal beams ex lending A Portian of this componen! 1 may be
between the buttresses translerred lo the bullress
Buttress assumed to be a series of curved columns
"·'~·- Be a m load componenr
Cross section of a typical flat-slab buttress da m.

Fig. 3.10.
Fig. 3.11
123
[
Freeboard
Max. water leve l. 421 _L_ Top ot dam, 424+6h (camber)
L Foundation (rock)
CD Core @ Rip-rap
@ Filler zona ® Crown cap
@ Transition zone (J) Dam toe
@ Supporting fill
Explanation of terms rclating to embankmcnt dams. Cross-scction of a typical rockfill da m with a central corc of morainc.
--''------./oo''.' ",•
fi¡:}'}{; '•··
ROCKFILL wlth central core of moraine
ROCKFILL with upstream lace of concrete or asphalt
ROCKFILL with central core of asphatt
Typical cross-scction design of rockfill dams
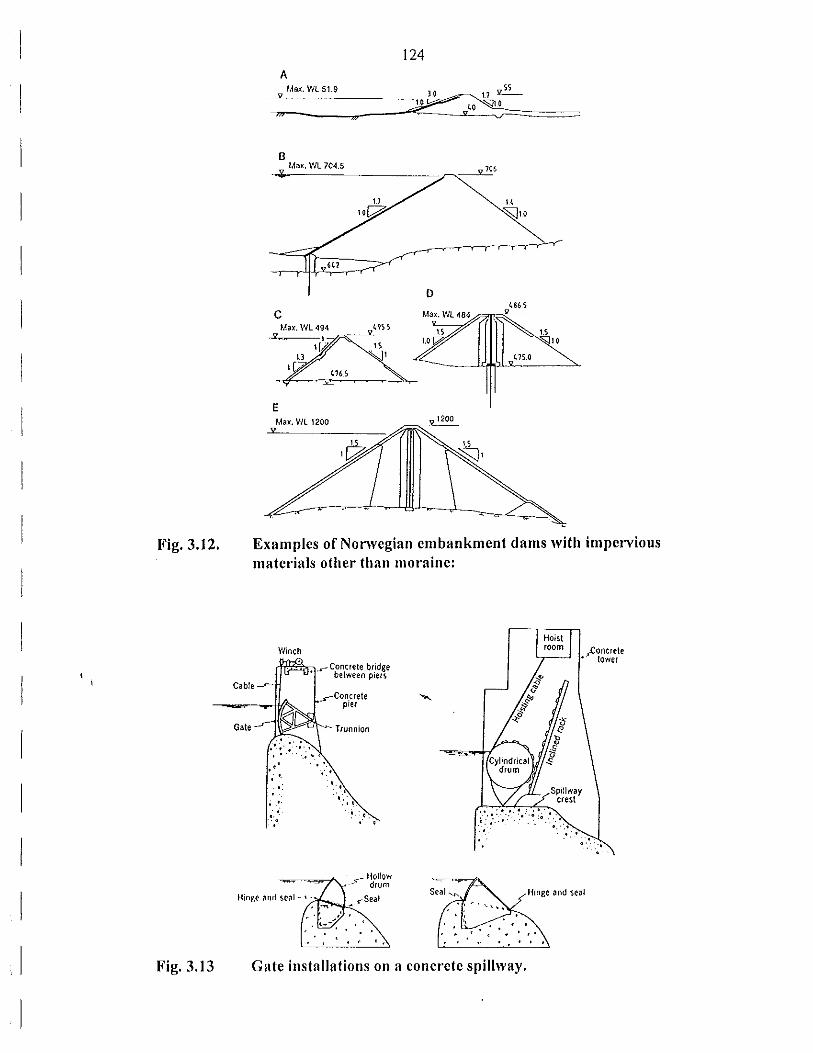
Fig. 3.12.
Gate
Fig. 3.13
124 A
Max. Wl51.9
,,
8 Ma:o:. WL 704.5
~~---------------------~~~6
e .-3 Max. WL 494 ~9S S
4 76 S
E
IS '\,)1
D
" ~lO
Examplcs ofNonvcgian cmbankmcnt dams with impcrvious matcrials other !han moraine:
Winch
. ' ' .:
. . .... .
.s-Concrete bridge between piers
_r-Con.crete
.. ~ . .. •. -.-_. '
prer
Trunnion
• • " . - ~ •
._-- Hollow - drum
.-seal
'
Hinge and seal
. ' .. Gate installations on a concrete spillway.

Fig. 3.14
Fig. 3.15
Grooved pier
•' ., ¡¡ '• ,,
., " .,
" " '·
125
Rubber strip
Plan v1ew
Stop log , ·¡ -~
"-sp111way eres! ·'
ttevation
Flash board installations on a concrete spillway.
o o o o
Hydraulic considcrations, thc circular scction givcs thc smallest circumfcrance for a givcn arca, and the smallcst hcad loss,
Excavation, a high rectangle will accomodate thc transport and equ ipmcnt bes t.
Slability, a high elliptical section will funclion well for most rock conditions.
A modified "horsc shoe" section will pcrmit a workable compro mise and is ofren adopted for water tunnels.
Tunnel Waterways, Sections

126
The Ulla · Ferre scheme: Profile
1200 ELEVATION (m)
1000
800
600
400
200
o ~rr--=", I<VIl.LDIIL POWEA STATION 1240 MW
POWER STATION 160 MW
HJORTELAND PUMP STATION 4.4 MW
Fig. 3.16 Tunnclling system for largc hydropowcr plant
SURGE SHAFT
RESERVOIR H
NOT TO SCALE
Fig. 3.17 Layout for powcr plan! with hcadracc tunnel and pressurc shaft

' 1
1
1
1
1
1
127
RESERVOIR AIR CUSHION SURGE CHAMBER
Fig. 3.18
Fig. 3.19
HWL
Layout for a powcr plant with prcssurc tunnel
1,0
e o,g ·e o,e 2 3l 0,7
0,6
o.~
0,4
0,3
0,2
0,1 o
o-
10
o o o
o
1l o
• 20
• A o
V A
"" -~ -110
• lO
"' o
/ .....
•
d ~ 1 •. ~. ·, ",.;.';~ ¡'--
lo< 18
l~·~.O /e'
A
ft' r-BIO i.EAKAOE t ¡-NO LfAKAOE • ó h• 40-100 • o h. 100-200 6 A h• 200·300
V h• 300-500 o h• 500-700
CCESS TUNNEL
Performance of unlined tunnels/shafts, with the ovcrburden dcsign critcrion

1,1
1.l -H/H, ' 1,5
128
~/H' 1,0
...... 0,9 ·---- --·· ~-- - - ----, '~ l!._!JQ '0,1 1--, ' ' f::-..-_ H - 600
' ' - ' ' ' ' ~1 '~ '¡-., ' ' ' ' ' ' '.1' ~,.,,.
'- '~ ' ~ ' ' ' ' '
' ' ' '
~ --1':--· ' ' ' '~ - - __ ,._._ -"'" - o l
' ' ' ~' ',' ':J-~ ' ' ' ' ' ' ' ·--' ~ ~~- ' ' ' ' ,'--; ,_ ...... ~ ' .... , ' ' ' ' ' '
' ' ' ' ' -~- -~ ,"-/,., - ~- "---<.-
' ' ' ~; ' ' ' ' - '......... ..... .......... -.:--:;; ~!!~ ' ' ' .... '-... · ..... ___ ---
- ' ···--· .. - . - -- --- -·-·· -,----_ -- ~ --=--~ ~ ""=-' ' ' ... ---L 100 - - '
~'-~ ?_'!L....; OOm -. ---- ---
·---
H ' 600
Ho= 430m
~ --- ---;;-- ------ ----= --- -- ---- - ---- - - - -
Fig. 3.20 Leirdola Hydropowcr Plan! (Norway). Model bascd on finitc clcment mcthod.
AM
GATE
SUBMERGEO PIERCING NATURAL LAKE CJJTLET
Fig. 3.21 Rcscrvoir bclow or abovc naturallake waterlcvcl
m
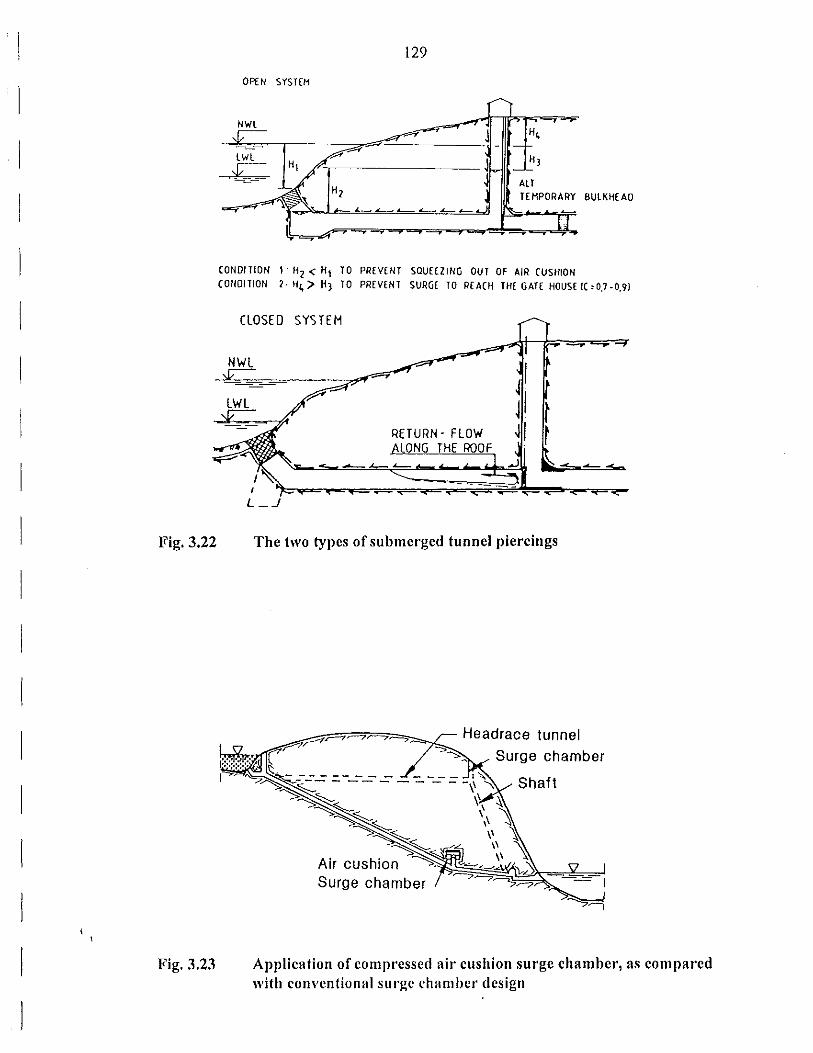
Fig. 3.22
Fig. 3.23
129
OPEN SYSHH
NWL
LWL
.f:: _¡'~,----~~~~~~- J!Hií__J_H¡
ALT TEHPORARY SULKHEAO H¡
CONOJTION 1. H¡ < H1 TO PREYENT SOUEEZING OUT OF AIR CUSHION COIIOJTION ¡, H4 > H¡ TO PREYENT SURGE TO REACH TH[ GATE HOUSE 1(,0.7-0.9)
CLOSED SY> TEH
Thc two typcs of submerged tunncl picrcings
Headrace tunnel
Surge chamber
Application of comprcssed a ir cushion surge chambcr, as comparcd with convcntional surge chambcr dcsign
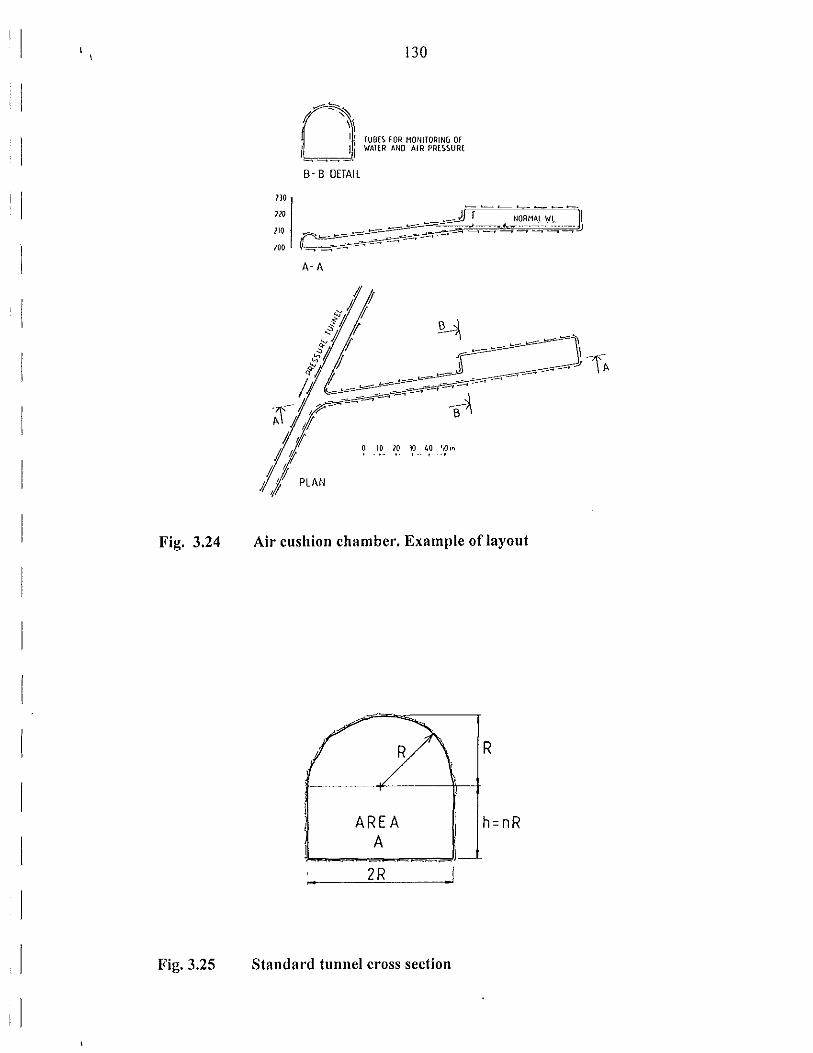
1 1
1
1
1
Fig. 3.24
Fig. 3.25
}JO
no
130
Os.~
f TUB[S FOR MONITORING Of /.__. ._____, ~ ~~ \riAT{R ANO AIR PRESSUR{
B- B DETAll
110 ......-o::,_....,~
100 ; -=~
A-A
NORMA.t ~l 1 -!)
Air cushion chambcr. Example of layout
R
2R 1
Standard tunnel cross section

4 o
:L 3 Vl L:l z z 3 z < :L
2
5
o
r J
o
Fig. 3.26
Fig. 3.27
131
- ---.-l _./
., . . . : .. ,- • • • -- t-o y: . .. ---~ ¡-._ -----~ ..... .._¡>
,;:;- o .... , 1, •' u
o
25 50 75 100 125 150 175 200 A m
Meas u red fl'iction coefficicnts M= _!_as a function of mean tunnel n
area Am
P, As Ms
We assume v1 =v2 =----Ys
S, = Sz = -- -- Ss
Compositc cross scction and rcsulting Manning cocfficicnt

132
A1 v.~ )A, A.)~ V, Al \., .... ,"-· ·.• ... :~ ·.·
SHARP EDGE INLET LOSS:
OUTLET LOSS :
h=05(1-.A.)~ 1 . Al 2g
Fig. 3.28
0,5
Fig. 3.29
Hcad loss in sharp edgcd inlct and outlct
L
,.-.. . . <1 A' . A0
1 [:,.._;___. ·, . • ,.1 '
+ = Reduced heod loss
O A o_ 1 med oreo
1 --' A · unlmed oreo
0,9
0,8
;. = lncreosed heod loss
kt. vol = heod loss m unl1ned stretch-29 heod loss 1n l1ned stre tch
Hcad loss changc in a lincd strctch

Fig. 3.30
133
f 15~----~--~----~ 6A( m2)
• 0~-+-----+--------r-----~
o 50 100
Measured ovcrbrcak in tunnels 1950-1970
COARSE MATERIAL
Fig. 3.31 Sandtt·ap, open typc (low cfficicncy)
0.5 .fA

¡.
134
Fig. 3.32 Sandtrap with bcams, opening 50% (high cfficicncy)
FLOW -
DUA!L 8
AL TERNA TIVE ACCESS TO
,., ••. ,.._GA TE HOIST.
BY PASS TUNNEL WITH POWER STAliON ~~~ 8UILT LA TER.
--lntl.,.-- DET AIL 8 DISCHARGE GATE.
AIR VENT.
~ell:cr~·;tr ---1 ----... .
DEl AIL A AL TERNA TIVE ARRANGEHENl WllH lWO REV!SION GA TE. OISCHARGE GA TES.
Fig. 3.33 Bottom outlet tunncl with gates

135
RESERVO/R
~ , Al TERNA TIVE ~[? ... ~
---- ' / ACCESS ANO ORAINAGE l.l. , ( ~----_-:_ 00\o/NSTRAH OAH.
-~'\! __ i'
' '
Fig. 3.34 Intake gafe arrangement
---
T All RACE.
POWER STA TI ON
Fig. 3.35 Intakes from severa! reservoirs and brooks
HOUSE ABOV[ RESERYOIR LEVEL.
AIR VENT.

Fig. 3.36
DRAFT TUBE
136
AL TERNA TIYE, STRUCTURES: SEGMENT OF CYLINDER SHELL
Bulkhead in adit
MAXIMUM OCCILLATION LEVE L.
FREE SURFACE SHAFT.
Fig. 3.37 Draft tube gatc
VERTICAL SECTION.
PLANE.
S TUFFING BOX.
CLOSEO SHAFT.

137
Fig. 3.38 Prcssurc conditions by water acceleration.
Fig. 3.39 Position of prcssure conduit and turbine valvcs

Fig, 3.40
Fig. 3.41
138
PELTON HORIZONTAL
PELTON VERTICAL
Developrnent in shape of caverns
---
HWL
~
Draft tu be gate Iocation. Example
FRANCIS VERTICAL

139
Fig. 3.42 Location of transformers
t-1ain access. Power transmission. Air evacuation. Signal and remote control.
Construction adit to top heading and embedded penstock. Sealing and drainage gallery. Power transmission. Store capacity.
Construction adit to tailrace. Emergency exit.
Tailrace tunnel. Ventilation air supply. Emergency exit.
Transformer enclosure.
Fig. 3.43 Tunncllayout for 50 MW Pelton unit

l>lain access. Air evacuation. Signal and remate control.
Construction adit to top heading and cable shaft. Gate chamber.
construction adit to tailrace. Surge chamber.
Tailrace.
Power transmission. Ventilation air supply. Emergency exit.
Transformer enclosures.
140
Fig. 3.44 Tunnellayout for 2 x 50 MW Francis units
Fig. 3.45 Top hcading with eran e beams
r (

Fig. 3.46
Fig. 4.1.
141
GROUTED ROCK BOLTS
PERMISSIBLE OVERBREAK
Anchoring of cranc beam
Ji /¡ 1
i' discoun1 rote
p
k---- N yeors
Single-paymcnt factors
' l 1' 1- \ 1 'J \
F
Singlc-payment compound-amount factor= F/P Single-payment prcscnt-worth factor= PIF
/ " / 1

1
1 1
1 1
Fig. 4.2.
Fig. 4.3
p
142
i' discount rote
N yeors -----------~
Uniform series factors. Sinking-fund factor= AIF; compound-amount factor= F/A; capital- recovery factor= AIP; present-worth factor= P/A.
MAX. NET RETlJRN
Cost and income curves SIZE
F
A

Fig. 4.4
Fig. 4.5
143
Water inflow and production of electricity in Norway during a normal ycar, in GWh/week
1 1
/
/
1 1
/ //
AREA (km2)
\t 1-1~1
y~ ¡=(H)=jA·J<+~ (~),¡1-1 L'RV
RESERVOIR VOLUME (mill. m3) ~
Rcservoir arca and volumc curves

Fig. 4.6
Fig. 4.7
144
t ;:¡ -vii' " • ~"~-"'"' e
~ """"-,,e?. "e'!--.-e o•~--
-----NARURAL WATER LEVEL
rl
" • e ~
\
\ ~ TAPPING
-. ~L-------------------~
TOTAL RESERVOIR COST ~
Storage cost curves
REGULATED FLOW (%) ~
Regulation curve for dctennining year and uncvcn draw off

Fig. 4.8
Fig. 4.9
145
MARGINAL COST RESERVOIR
TOTAL MARGINAL COST
MARGINAL PROD. VALUE
MARGINAL COST AND PROD. VALUE
Marginal production val u es and marginal storage costs as a function of regulation leve!
Load, relative uni ts
l. O
0.68
0.25x0.68=0.l7
o
l.
Hydro po~<er 75 Gl~h
Therma l po~<er 25 Gl~h
l year
Load variation in a mixed system
l. O
0.61
o
'1
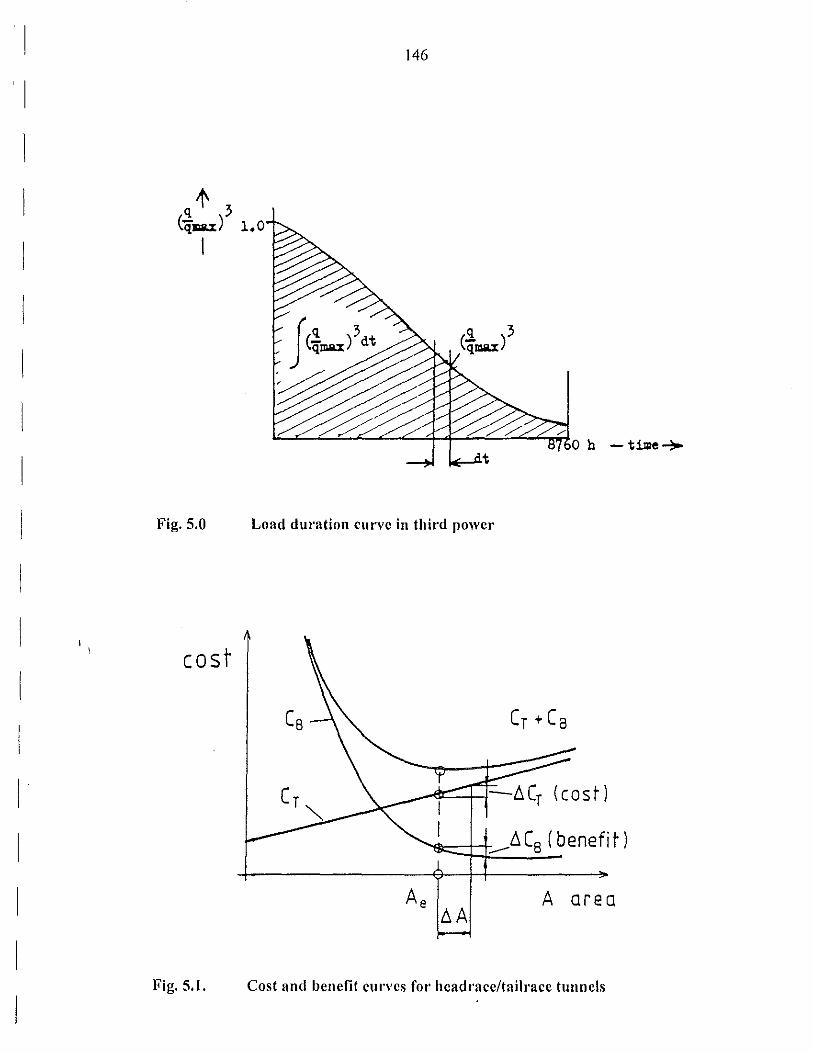
146
oh -time~
Fig. 5.0 Load duration curve in third power
cost
1
Cr +Ca
1
:--.6 C8 ( benefi t)
A orea
Fig. 5,1. Cost and benefit curves for headrace/tailrace tunnels

147
Projects ldentified and r¡l D lnvestigated L.:...J
Selected for Prefeasibility lnvestigation
Feasibility lnvestigation
Defi ni te Study 1 lmplementation
Fig. 5.1. Hydropower resources investigation and sclection of projects
Project Planning i i Projcd lmplemcntation !1
Project Operatlon
.-------T~--~ 1 DEFINITEPLAN kNGINEER~ ~ DETAILDESIGN 1
1 S11JDY / .....
1 1~ WORK DRAWINGS
¡ 1 i 1 FEASIBILTY STUDY 1 CONSlRUCTION MANAGE- l l 1 MENT · SUPER VIS ION OP
~ PREFEASJBlLITY
ILSTUDffiS
RECONNAISSANCE STUDffiS
3. 4 years
1 WORKS 1
1 1 1 í-1 ----1 1 1 DESJGN ANO ~CONSTRUCTJON\...S"'"coMMlSSIONL'\0\._ OPERATIONOF 1 PROCUREMENT / j ANDSUPPLY // OFWORKS / L\:STALLATIOJ'\S
1 1 1 1 1 1
1 4 • 6 ycars 1 40 • 60 ycars
1 1
Fig. 5.2. Hydropowcr devclopment cyclc

148
v .... 1 l 3 ~ S 6
ReconnaiJUlOCe Study -PrefeasibiUty Study
Feasibülty Stduy
Definite Plan Study Definíte Plans ~
Final Design Tender Document.s
Teodering & Contract.lng --Corutruction
Equipm. Deslgn & Manufacture
Er«:tion & Conunhsiooing -Preooruln!ctioo T lmplemeotation
Fig. 5.3. Hydropower implemcntation schedule (normal progrcss)
Fig. 5.4.
MBTEOROLOOY
HYDROLOOY
SEDIMBNT
MARKBT SURVBYS
DE.MAND PORBCASTS
ALTP.RNATIVB SUPPLY
Project formulation
POWUR& ENHROY
BALANCE
7 8
-
ation

Fig. S.S.
cosr ESTL\iATE
a>NSTRilCllON .SCIIE:PIJl.E
WATER sruon:.s
rownR sruoms
rowrn surrtY SYSTE~{
PROJECT SUf'f'L Y ROLE
Fig. S.6.
GENERAL DATA SOCIO ECONOMY
POWER MARKIIT (Demooo)
TARIFFS
149
HYDROLOOY (Q)
TOPOGRAPlfY O lo)
OEOLOGY (Soils, Matcri.ils)
L_E_NYIR __ o_NME_NT _ _.JI LI_INFRA __ srn_v_= __ E_¡
Main data for hydropowcr planning and dcsign
DISDURSI!MENT SCIII:DULE
ANh'UAL OPERA TION & MAIN'TENANCE COST,
f'R01t;CT OJ:NE· RATIO};' CAPACrrY
POWER SYSHM J\'Etf)
cosr srnEAMS
SYSTTIM EI\'I:RGY ln>.TI f'RICE
E/\'CRGY urrAKr: CSALES f'ORCCAS'I
Economic analysis, construction of cash flow
lt'COMf: STRE!AMS

cosr ESnMATE
CO:-i~rRUCriON SCIIEI>VLE
WATUR SlUDI!!."i
f'OWER STUDIES
f'OWERSUPPLY SYSlCM
PROlECf SUPPLY ROLE
Fig. S. 7.
Fig. 5.8.
DIS!lURSEMI!l\T SOl r:DlJLI!
PROlCCf e¡¡;:-,-¡:. RATION CI\PI\CrrY
150
SYS'TIM I!NI:ROY t/!--Tf PRICE
11'\COME SI'RI:I\MS
I'OWI:R SYSTI!~I
NI!Er>
Financia! analysis, construction of cash flows
"ffiANSMISSION SCHEMES H SELECmDSUPPLY
¡ TilERMAL r (BEST COMBINATJON)
SUPPLY
1 POWERMARKET· f-- LEASTCOST 1--
DEMAND f{)RECASTS CALCULATION ANDCOMPARJSON
1 POTENTJAL 0
1 @~ H SEl..ECTED
1 POTENTIAL POTENT!AL
POTENTJAL ,_
Selection of supply, leas! cost comparison
COST STl<EIIMS
PROPOSEO PROJECf

)RMÚLA110N PROJECTLAYOUT
3' H 11
¡ T_ ... Swilchyatd and <O¡ ""'"" ...........
,. '
~ 1 "''"""""" ~-· 1
,_.,....., ~ "'""""· P\c:k-up ralo ol-or
~NUEHTAI..$"1\!0Y: &vltcnmonlal Olslutbance. EnvirC)I'II'II(Wibll~et ~ Dofinillon ol t.Aitigatory Mouuros and Costs
. ENGINEERÍNG DESIGNS ES11MA11NG
D""""""' OFPROJECT
V.YOUT
Oosign hoad and ta~r.aco.
Surgo arrangcrmool$
1 Ooslgn poworhol.rso ~ al'ld ~vxiliaty lns1al- ...... ~~ b-
D<monsloning anc1
""""'"""' "'""' 1ot moch&rloeal equipml.
Oimcnsioning :and peti'Otmance SI)OC$. lor eloctrical oqipmt.
DEFINmoH
~ ¡ ....... __ ~,, tnainlon;anoo and " ~tloncosts.
SOCIAl.. ~~lolsodo eco 10mlc SCOPEOF IMPACT lmpad,Roso~costsand
ST\lOY ASSESSNEHf! mlliga!Oty tn0a$UI'OS
ECONOMIC ANO FlNANCIAL ANAL V$1$ 1 REPORTING
¡ ~ASHF\.OW. ¡ "7··· .. Economlc ,_ ;' an:J.Iysis
'
Fig. S.'t Feasibility Srudy. Flow Chan

ORDEN DE PROCEDER
Definición y ámbito de aplicación de la evaluación ambiental
Definición y ámbito de aplicación de la investigación de campo
Implementación del Programa de Investigación
Investigación del mercado de energíaCurva de demandaFactor de cargaPrevisiones de demanda
Duración del flujo. Estudio de agua y electricidad. Parámetros de planeación
Necesidades reglamentariasPosibilidades de almacenamientoSimulaciones de Operación
Caudales turbinable y de avenida
Criterio de diseño y optimización.Factores de seguridad
Condiciones físicas del sitio y de los accesosExistencia de infraestructura y de facilidades
Condiciones de las fundaciones, sismicidad. Aspectos de Sedimentación
Disponibilidad de materiales de construcción, técnicas y recursos
FORMULACIÓN DEL
PROYECTO
Capacidad de generación. Tamaño de las unidades
Contenido de los sedimentos y las medidas de control
Proyecto de diseño y optimización
Definir las perturbaciones del medio ambiente
Predimensionamiento hidráulico
Ruta de la línea de transmisión
Red de distribución
Número de equipos auxiliares
Tratamiento del agua
Acomodo de los edificios y estructuras
Incluir medidas de mitigación en el diseño del proyecto
Dimensionamiento y pre-diseño del equipo hidromecánico
Patio de distribución y subestaciones
Balance potencia -energía. Energía entregada a red
DEFINICIÓN DEL PROYECTO DE DISEÑO
Diseño de las obras de regulación Toma y separador de sedimentos
Diseño de la caída, desfogue y arreglos para la oscilación
Diseño de casa de máquinas e instalaciones auxiliares
Diseño de las instalaciones de construcción y las permanentes
Dimensionamiento y realización de las especificaciones del equipo mecánico
Dimensionamiento y realización de las especificaciones del equipo eléctrico
Diseño preliminar del equipo hidromecánico
Estudio de costos y precios unitarios
Costo de equipos. Investigaciones y estimaciones
Planeamiento de la construcción y programación
Desglose de cantidades de los items más importantes
Estimación de costos de inversión, contingencias, etc.
Estimación de los costos de operación, mantenimiento y de administración
Programa de desembolsos
ESTABLECER LOS PARÁMETROS ECONÓMICOS DEL PROYECTO COSTO / INGRESO
REPORTE DE LAS INVESTIGACIONES DE CAMPO
VALUACIÓN DEL IMPACTO SOCIAL Y MEDIOAMBIENTAL
Presupuesto del proyecto en base anual
Ingresos del proyecto anualmente
Proyecciones financieras
Precios sombra
Últimas consideraciones del costo y soluciones
Comparaciones del beneficio (Análisis de Sensibilidad)
FLUJO DE CAJAAnálisis Financiero
FLUJO DE CAJAAnálisis Económico
REPORTE DE INVESTIGACIÓN
DE LA FACTIBILIDAD
INVESTIGACIONES DE CAMPO: Datos e información Hidrológica, Metodología, Sedimentos, Levantamientos Topográficos, Mapeos, Rutas de Acceso, Línea de Transmisión, Levantamiento de Infraestructura, Levantamiento Geológico y Mapeo. Investigaciones Geotécnicas, Suelos y Materiales, perforaciones, pruebas en fosos, trincheras, Análisis de Laboratorio.
FORMULACIÓN DEL PROYECTO DISEÑO DEL PROYECTO DISEÑOS DE INGENIERÍA PRESUPUESTACIÓN REPORTE / ANÁLISIS ECONÓMICO - FINANCIERO
ESTUDIO AMBIENTAL: Alteración del Medio Ambiente, Estudio de Impacto Ambiental, Definición de las medidas de mitigación y Costos.
DEFINICIÓN DEL OBJETIVO DEL
ESTUDIO
Estudio del Impacto socio -económico, costos de reasentamiento y medidas de mitigación.
ESTUDIO DE IMPACTO SOCIAL