Planning & Control Maintenance Dredging in the PtfRttdPort ... · Planning & Control Maintenance...
28
Planning & Control Maintenance Dredging in the P t fR tt d Port of Rotterdam Arie Noordijk Arie Noordijk Head of the Dredging Division Port of Rotterdam 1
Transcript of Planning & Control Maintenance Dredging in the PtfRttdPort ... · Planning & Control Maintenance...
Planning & ControlgMaintenance Dredging
in theP t f R tt dPort of Rotterdam
Arie NoordijkArie NoordijkHead of the Dredging DivisionPort of Rotterdam
1
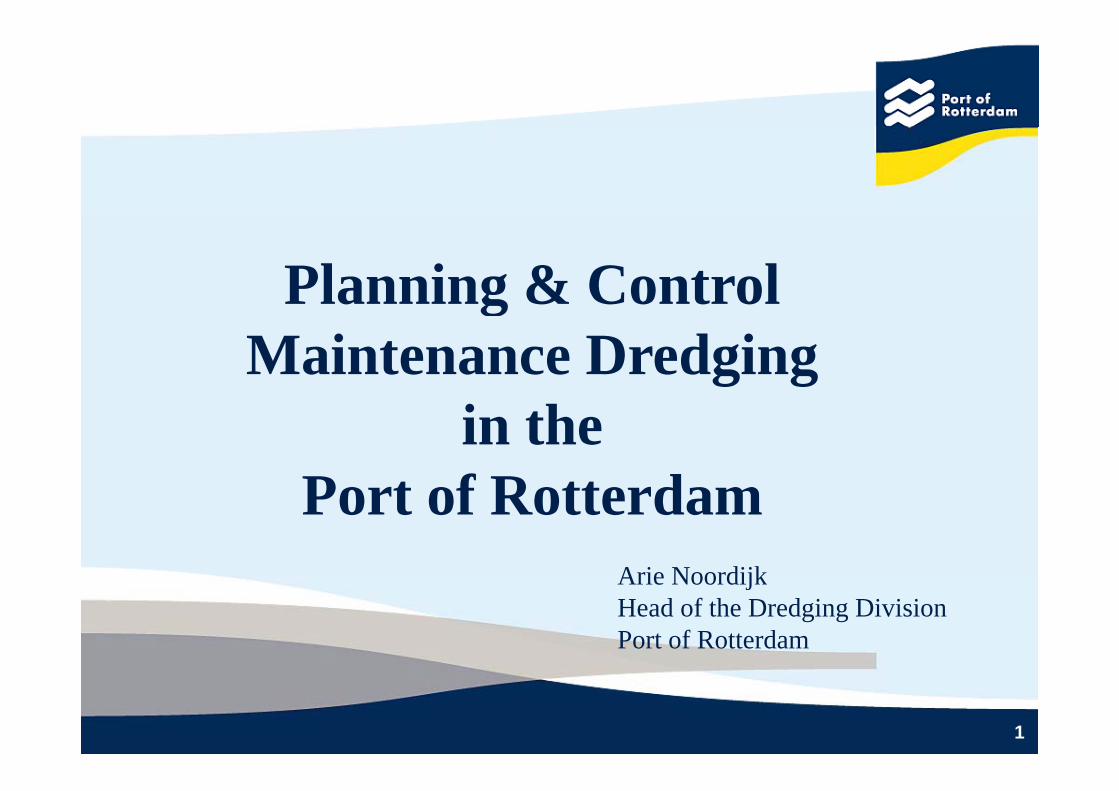
Contents of this presentation
Overview Port of Rotterdam (numbers)
Sedimentation process and dredging activitiesp g g
Maintenance model, Planning and Control
S if th ti iti- Specify the activities
- Need for information, Performance Indicators (PI’s)
- Controlling the Dredging Process
Ultimate goal value driven maintenance- Ultimate goal, value driven maintenance
2

Rotterdam Port area MV2 (f t h b ) i l d dMV2 (future harbours) included
3
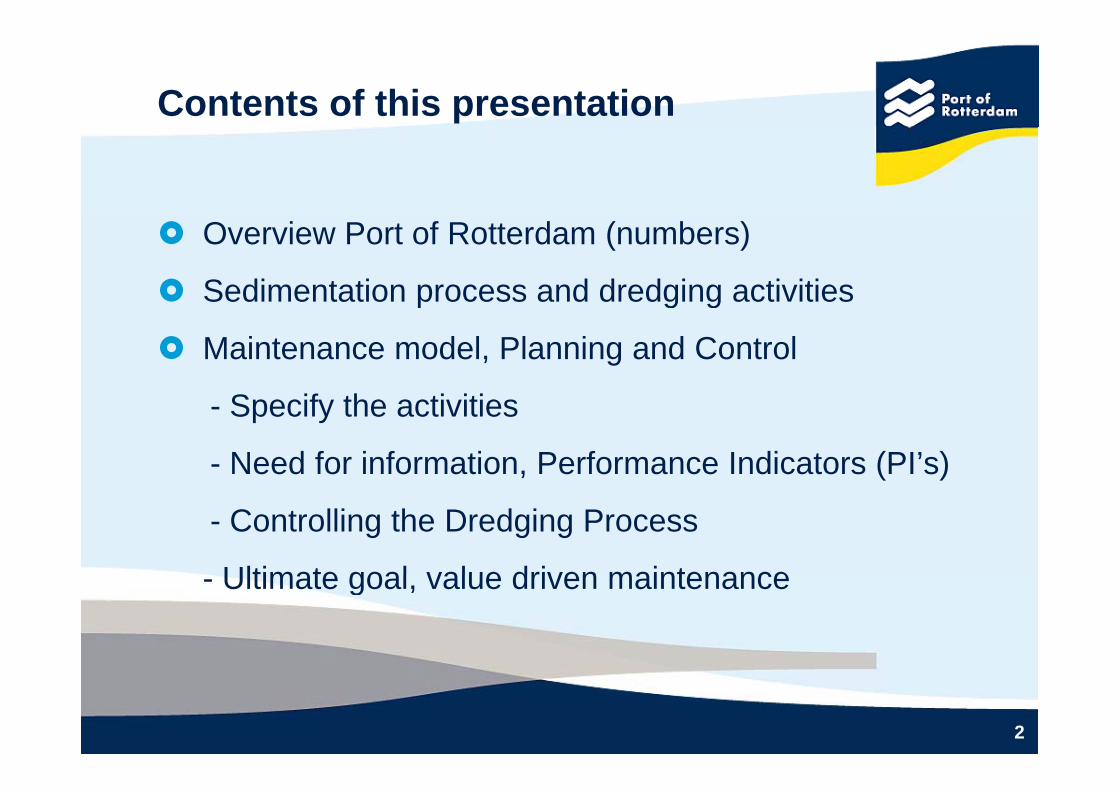
Port of Rotterdam in numbers(without Maasvlakte 2)
Total harbour area 10,500 ha
Industrial complex 5,040 ha Industrial complex 5,040 ha
Harbours and fairways 3,500 ha
Length of Rotterdam Port 40 km Length of Rotterdam Port 40 km
Total length of the quays 77 km
Total length borders 185 km
Pipelines 1,500 km
Storage area (x 1.000) 1,813 m²
Annual dredging quantities 4 – 7 million m3
4
g g q
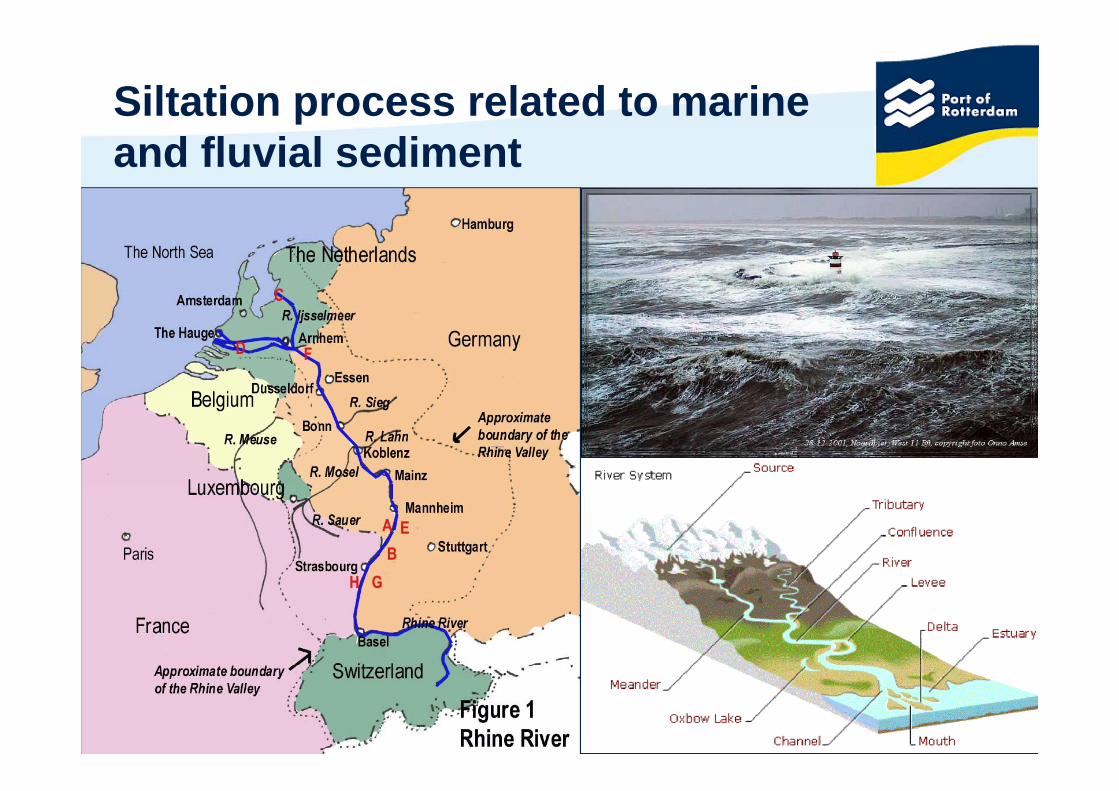
Siltation process related to marine and fluvial sediment
5
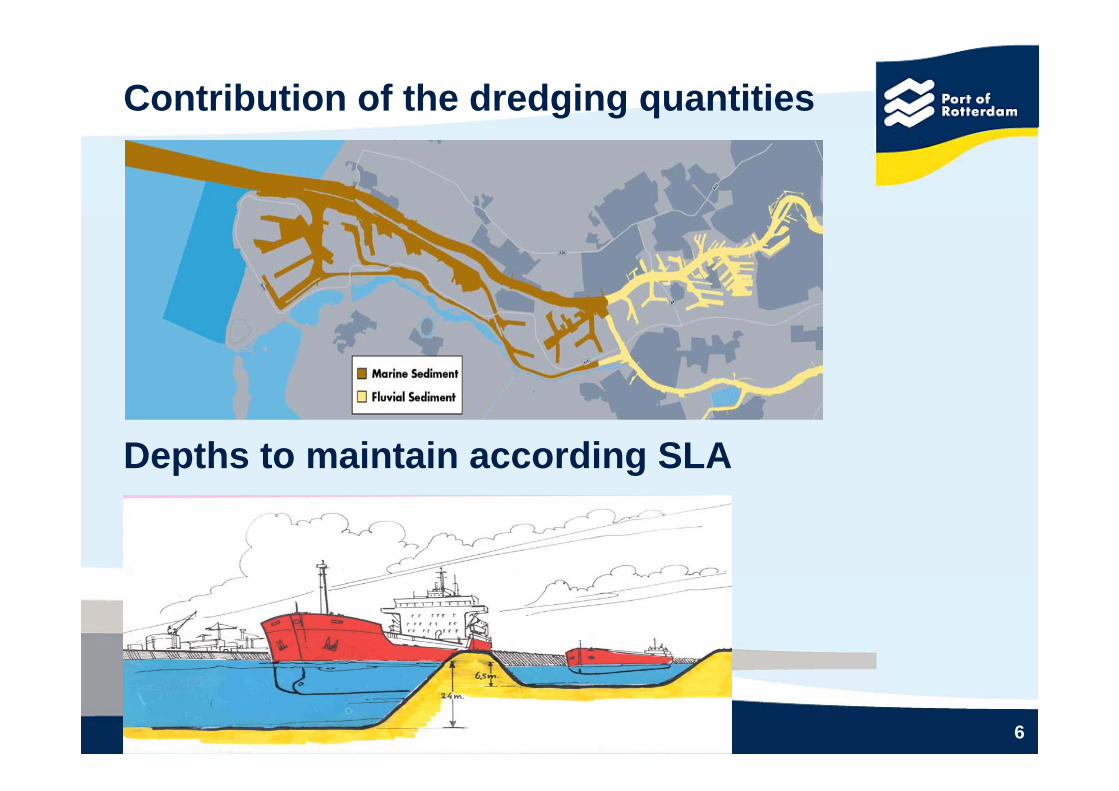
Contribution of the dredging quantities
Depths to maintain according SLA
6

Performance requirement - Accessibility Survey results compared with guaranteed maintenance depth (SLA)
7
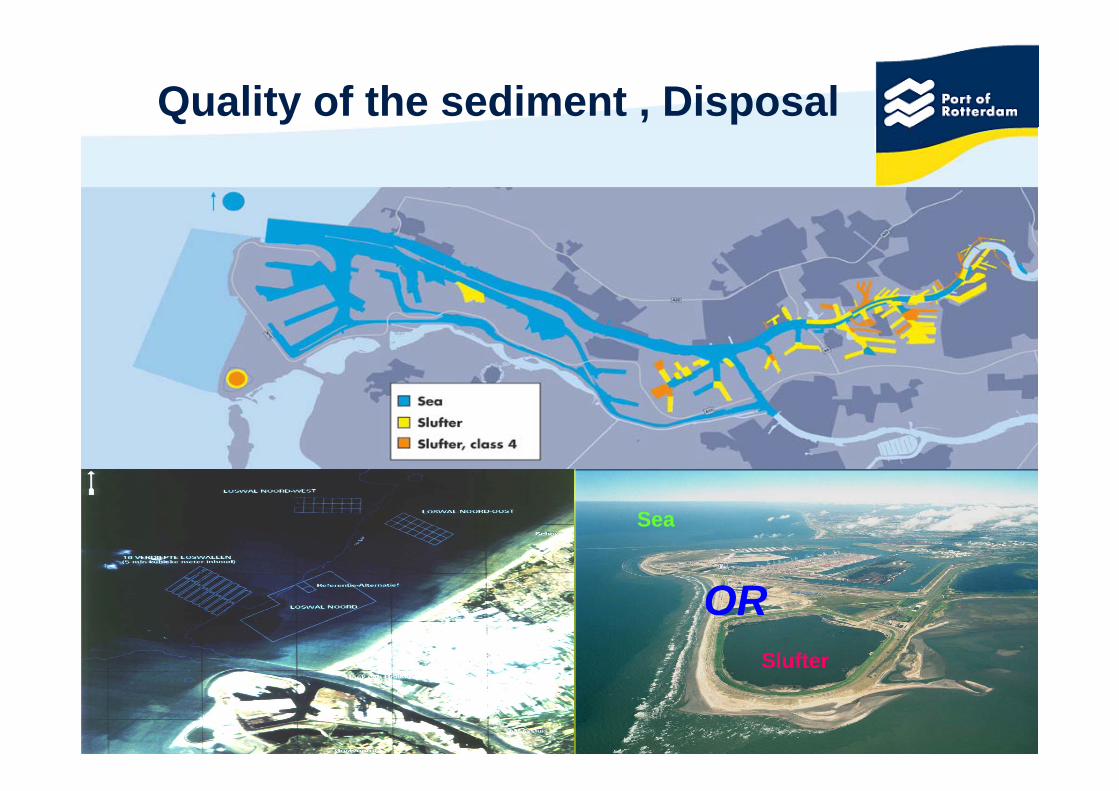
Quality of the sediment , Disposal
Sea
Slufter
OR
8
Slufter

9
Integrated Maintenance modelV l D i M i t
3. VGWM 3. VGWM
Value Driven Maintenancebeheer
Objectprestatieplanning
Onderhoudsbudgettering
beheer
Objectprestatieplanning
Onderhoudsbudgettering
Analyse Kosten
2. Beheer onderhoudsconcept
4 K t1 ObjectAnalyse Kosten
2. Beheer onderhoudsconcept
4 K t1 ObjectAnalyseprestatieverliezen
Kostenanalyse5. Melding, planning
& voorbereiding
6. Uitvoering en registratie onderhoud
4. Kostenbeheersing
1. Objectprestatiebeheer
Analyseprestatieverliezen
Kostenanalyse5. Melding, planning
& voorbereiding
6. Uitvoering en registratie onderhoud
4. Kostenbeheersing
1. Objectprestatiebeheer
Bewakingobjectprestatie
Kostenbewaking
registratie onderhoud
Bewakingobjectprestatie
Kostenbewaking
registratie onderhoud
9. Skill- & capaciteitsbeheer
10. Configuratie- & kennisbeheer
7. Voorraadbeheer & inkoop
8. Onderhoudsuitbesteding
9. Skill- & capaciteitsbeheer
10. Configuratie- & kennisbeheer
7. Voorraadbeheer & inkoop
8. Onderhoudsuitbesteding
10
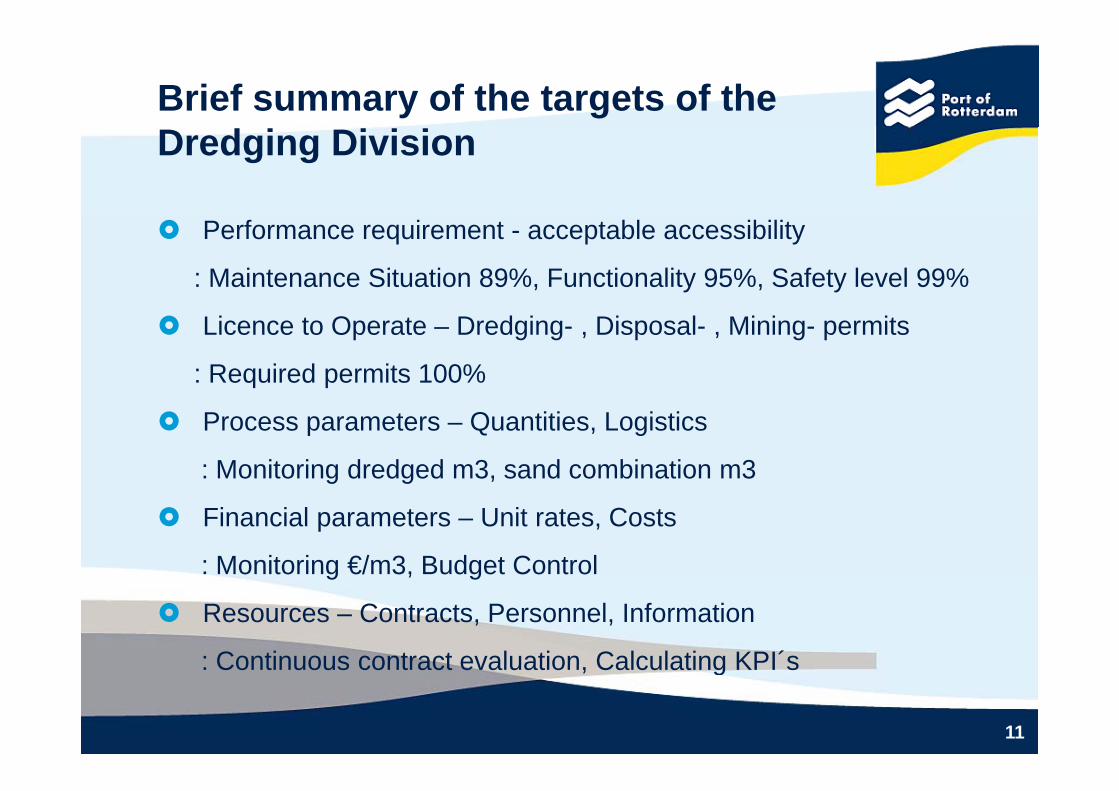
Brief summary of the targets of the Dredging Division
Performance requirement - acceptable accessibility
: Maintenance Situation 89%, Functionality 95%, Safety level 99%
Licence to Operate – Dredging- , Disposal- , Mining- permits
: Required permits 100%
Process parameters – Quantities, Logistics
: Monitoring dredged m3, sand combination m3
Financial parameters – Unit rates, Costs
: Monitoring €/m3, Budget Controlg , g
Resources – Contracts, Personnel, Information
: Continuous contract evaluation Calculating KPI´s
11
: Continuous contract evaluation, Calculating KPI s
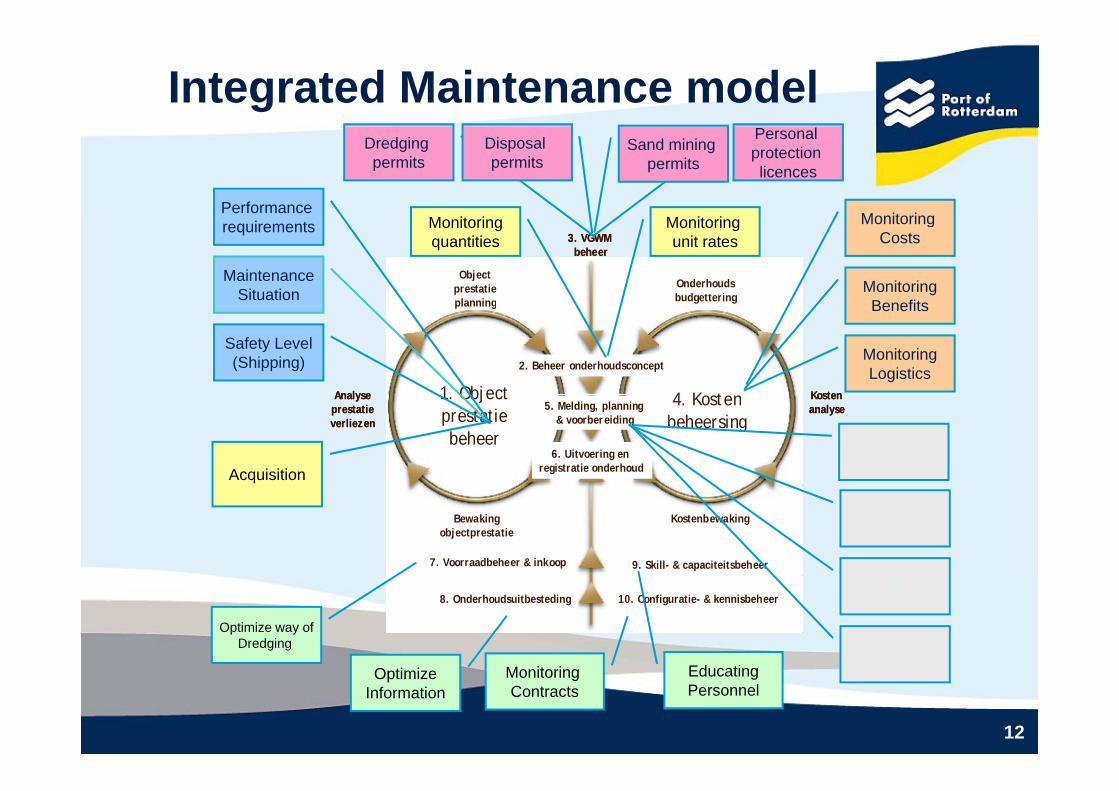
Integrated Maintenance model
Performance
Dredging permits
Disposal permits
Personal protection licences
Sand mining permits
Monitoring3. VGWM
beheer
Objectprestatieplanning
Onderhoudsbudgettering
3. VGWM beheer
Objectprestatieplanning
Onderhoudsbudgettering
requirements
MaintenanceSituation
Monitoring unit rates
MonitoringBenefits
Monitoringquantities
Monitoring Costs
planning
Analyse Kosten
2. Beheer onderhoudsconcept
4 Kosten1 Object
planning
Analyse Kosten
2. Beheer onderhoudsconcept
4 Kosten1 Object
Safety Level(Shipping)
Benefits
MonitoringLogistics
Analyseprestatieverliezen
Kostenanalyse5. Melding, planning
& voorbereiding
6. Uitvoering en registratie onderhoud
4. Kostenbeheersing
1. Objectprestatiebeheer
Analyseprestatieverliezen
Kostenanalyse5. Melding, planning
& voorbereiding
6. Uitvoering en registratie onderhoud
4. Kostenbeheersing
1. Objectprestatiebeheer
Acquisition
Bewakingobjectprestatie
Kostenbewaking
9. Skill- & capaciteitsbeheer7. Voorraadbeheer & inkoop
Bewakingobjectprestatie
Kostenbewaking
9. Skill- & capaciteitsbeheer7. Voorraadbeheer & inkoop
10. Configuratie- & kennisbeheer8. Onderhoudsuitbesteding 10. Configuratie- & kennisbeheer8. Onderhoudsuitbesteding%
Optimize way ofDredging
12
EducatingPersonnel
Monitoring Contracts
OptimizeInformation
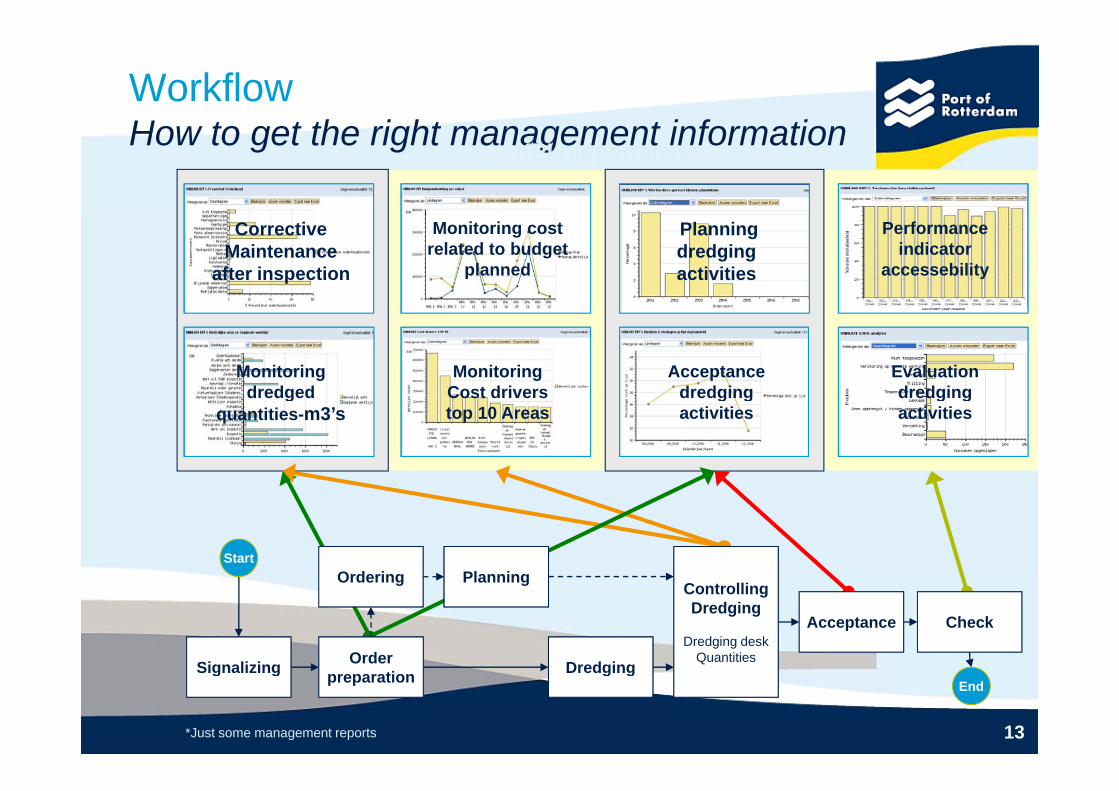
WorkflowHo to get the right management informationHow to get the right management informationKPI rapportages*
Performance indicator
accessebility
Monitoring cost related to budget
planned
Corrective Maintenance
after inspection
Planning dredging activities
Evaluation dredging
Monitoring Cost drivers
Monitoring dredged
Acceptance dredging dredging
activitiesCost drivers top 10 Areas
dredged quantities-m3’s
dredging activities
StartOrdering Planning
Signalizing Order Dredging
ControllingDredging
Dredging deskQuantities
Acceptance Check
Ordering Planning
13*Just some management reports
Signalizing preparation DredgingEnd
Planning and Control: - Sand mining and dredging projects
Sandmining m3's
0500.000
1.000.0001.500.000
m3 Norm
Standlijn
Profit Sandmining €
500.000
1.000.000
1.500.000
€ NormStandlijn
01 5 9 13 17 21 25 29 33 37 41 45 49
weken
New numbers New numbers
01 5 9 13 17 21 25 29 33 37 41 45 49
weken
ProcessProces Proces Proces Proces Proces
Control Measures
Control Measures
Process step
Process step
Process step
Process step
Process step
14

Predicting Annual Result 2008 (KPI) in October License to Operate
Norm Reality
Predicting Annual Result 2008 (KPI) in October
100% 100%
FinancialOH-budget Prognoses
PerformanceOH-norm Reality
89% 87 8%
3. VGWM beheer
ObjectO d h d
3. VGWM beheer
ObjectO d h d 8.7 M eur. 8.6 M eur.
Sand profit Prognoses1.069 M eur. 1.069 M eur.
Profit Prognoses460 K eur 315 K eur
89% 87.8%Functional l
95% wiuSafety level
98% wiu
prestatieplanning
Analyseprestatieverliezen
Onderhoudsbudgettering
Kostenanalyse
2. Beheer onderhoudsconcept
5. Melding, planning & voorbereiding
4. Kostenbeheersing
1. Objectprestatie
prestatieplanning
Analyseprestatieverliezen
Onderhoudsbudgettering
Kostenanalyse
2. Beheer onderhoudsconcept
5. Melding, planning & voorbereiding
4. Kostenbeheersing
1. Objectprestatie
460 K eur. 315 K eur.Profit Realities>15% 52%
98% wiuOND Q-Slufter Reality
<15% 6,3%Bewaking
objectprestatieKostenbewaking
6. Uitvoering en registratie onderhoud
9. Skill- & capaciteitsbeheer7. Voorraadbeheer & inkoop
gbeheer
Bewakingobjectprestatie
Kostenbewaking
6. Uitvoering en registratie onderhoud
9. Skill- & capaciteitsbeheer7. Voorraadbeheer & inkoop
gbeheer
ProcessMaintenance
m3 Prognoses
Used capacity ( €)Maintenance Prognoses
75% 69%
PersonnelSFI Reality
12.5 fte 11.8 fte
10. Configuratie- & kennisbeheer8. Onderhoudsuitbesteding 10. Configuratie- & kennisbeheer8. Onderhoudsuitbesteding
m3 Prognoses4,7 Mm3 5.0 Mm3Sand m3 Prognoses1,0 Mm3 1,4 Mm3
combination Realities
Sand Mining Prognosesp.m. 13%
Projects Prognoses10% 11%
Ext projects Prognoses
Absence % Reality4.6% 4.28%FG % Reality90% 91%
15
20% 29%Vraaggestuurd Realities
25% total 18.3%
Ext projects Prognoses15% 7%

How to become ´In control´How to become In control
16
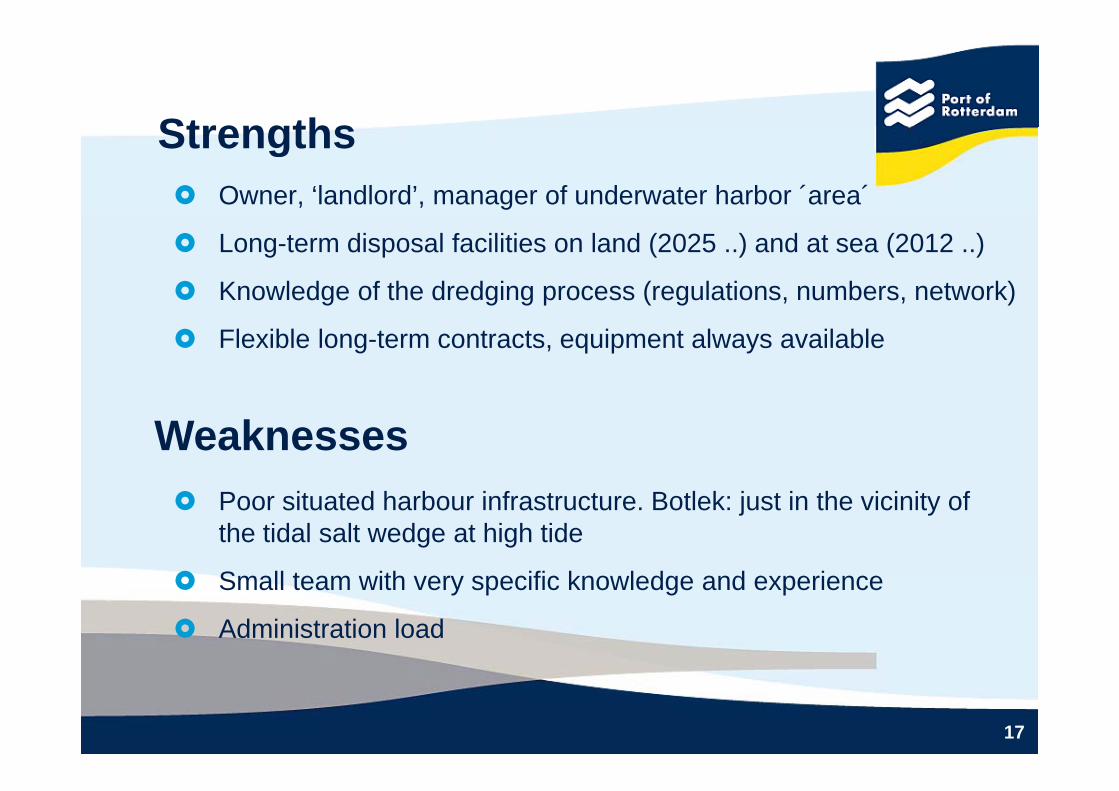
Strengths Owner, ‘landlord’, manager of underwater harbor ´area´
Strengths
Long-term disposal facilities on land (2025 ..) and at sea (2012 ..)
Knowledge of the dredging process (regulations, numbers, network)
Flexible long-term contracts, equipment always available
Weaknesses Poor situated harbour infrastructure. Botlek: just in the vicinity of
the tidal salt wedge at high tide
S ll t ith ifi k l d d i Small team with very specific knowledge and experience
Administration load
17

Opportunities Changing infrastructure preventing or controlling siltation
Opportunities
Logistic optimization of the dredging cycle, sand mining
Changed regulations for the re-location of dredged material Changed regulations for the re location of dredged material
Tendering policy, innovation, other ways
Threats Sit ti th d d i k t (fi t h lf 2008) Situation on the dredging market (first half 2008)
Variation of the oil prices, effects app. 25% of the costs
Changing regulations, changes in disposal destination (permits)
Economic crisis, less demand for sand mining
18

CONTRACTINGDominant Value Driver: ResourcesC t l Fl ibl C t tControl measures.… Flexible Contracts
USE OPTION CHARTER
Max. cap
Average cap.
Max. cap.
BASIC CAPACITY
ALWAYS WORK
Min. Cap.
19
ALWAYS WORK
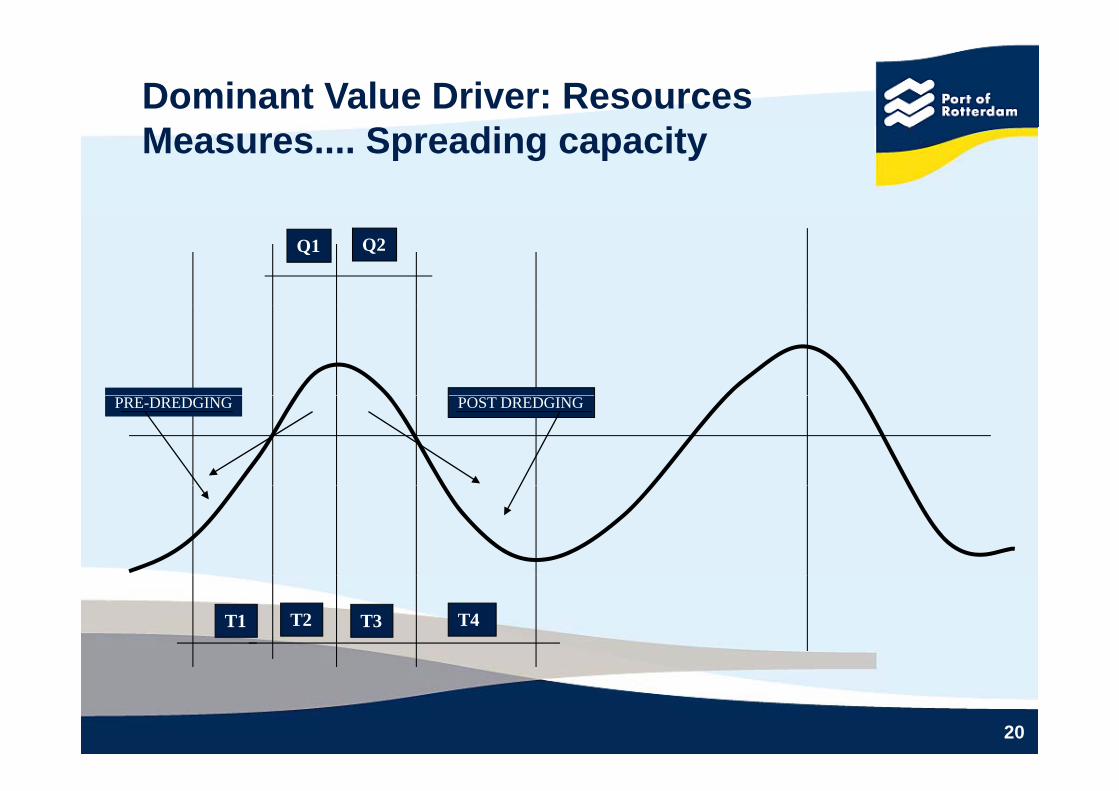
Dominant Value Driver: Resources SMeasures.... Spreading capacity
Q1 Q2
PRE-DREDGING POST DREDGING
T2 T3 T4T1
20
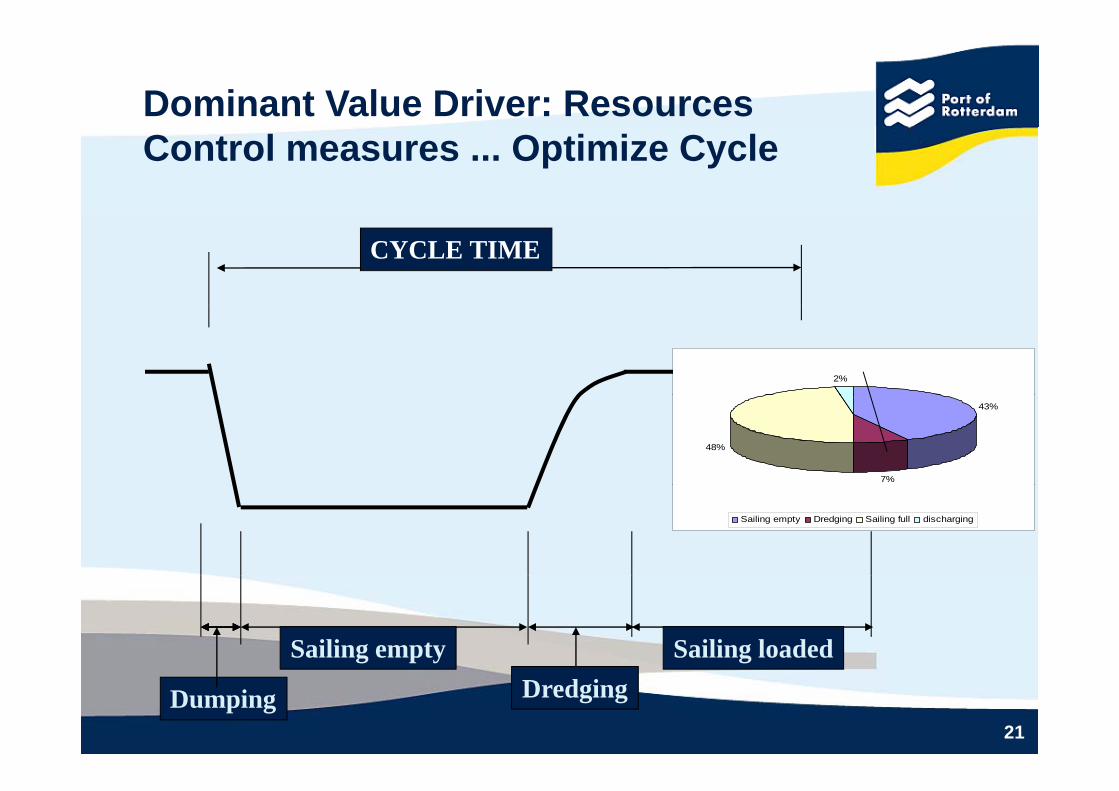
Dominant Value Driver: Resources Control measures ... Optimize Cycle
CYCLE TIME
2%
43%
7%
48%
Sailing empty Dredging Sailing full discharging
Sailing empty Sailing loaded
21Dumping Dredging
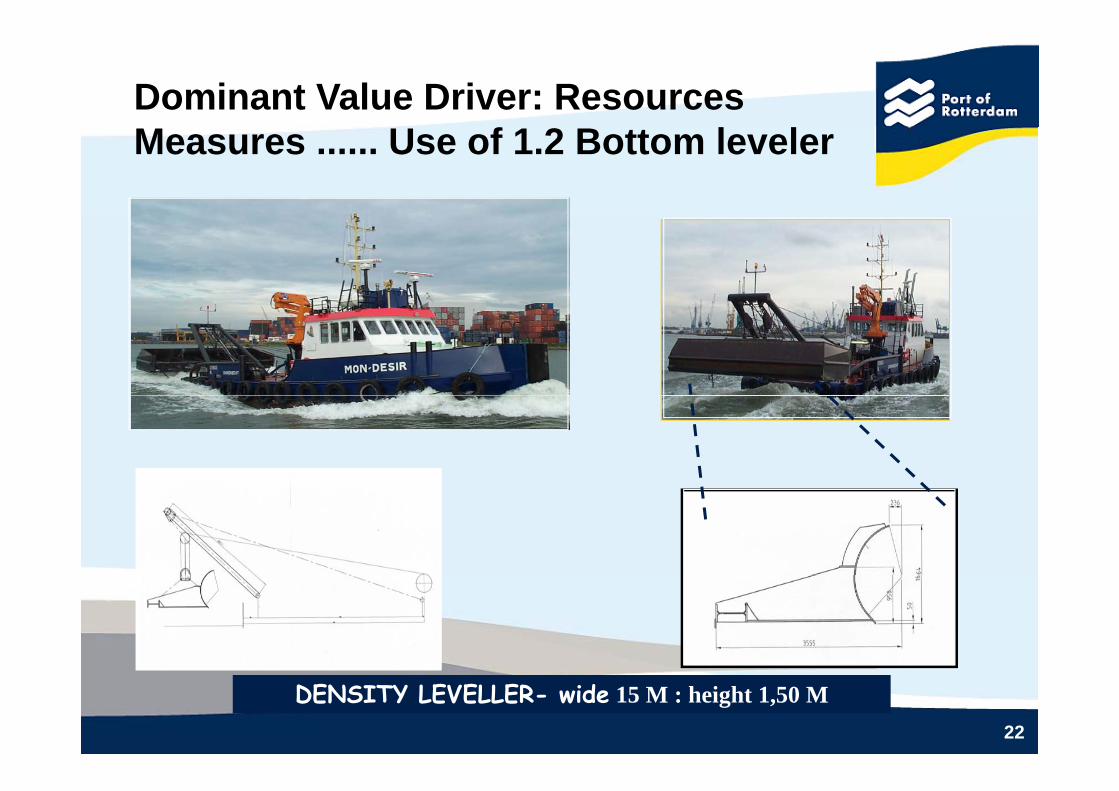
Dominant Value Driver: ResourcesMeasures ...... Use of 1.2 Bottom leveler
22
DENSITY LEVELLER- wide 15 M : height 1,50 M

Dominant Value Driver: ResourcesRemote control (Dredging Desk)
contractdiepte
+0,5m
23
pte-0,5m
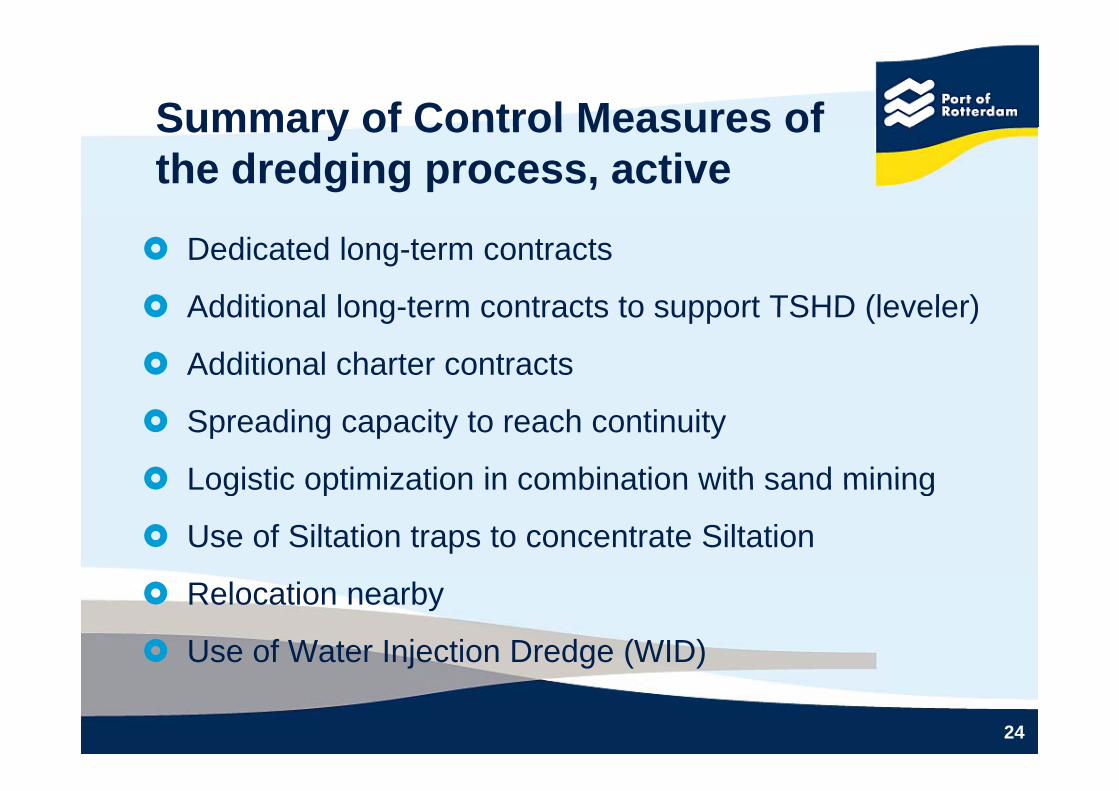
Summary of Control Measures ofSummary of Control Measures of the dredging process, active
Dedicated long-term contracts
Additional long term contracts to support TSHD (leveler) Additional long-term contracts to support TSHD (leveler)
Additional charter contracts
Spreading capacity to reach continuity
Logistic optimization in combination with sand mining Logistic optimization in combination with sand mining
Use of Siltation traps to concentrate Siltation
Relocation nearby
Use of Water Injection Dredge (WID)
24
j g ( )
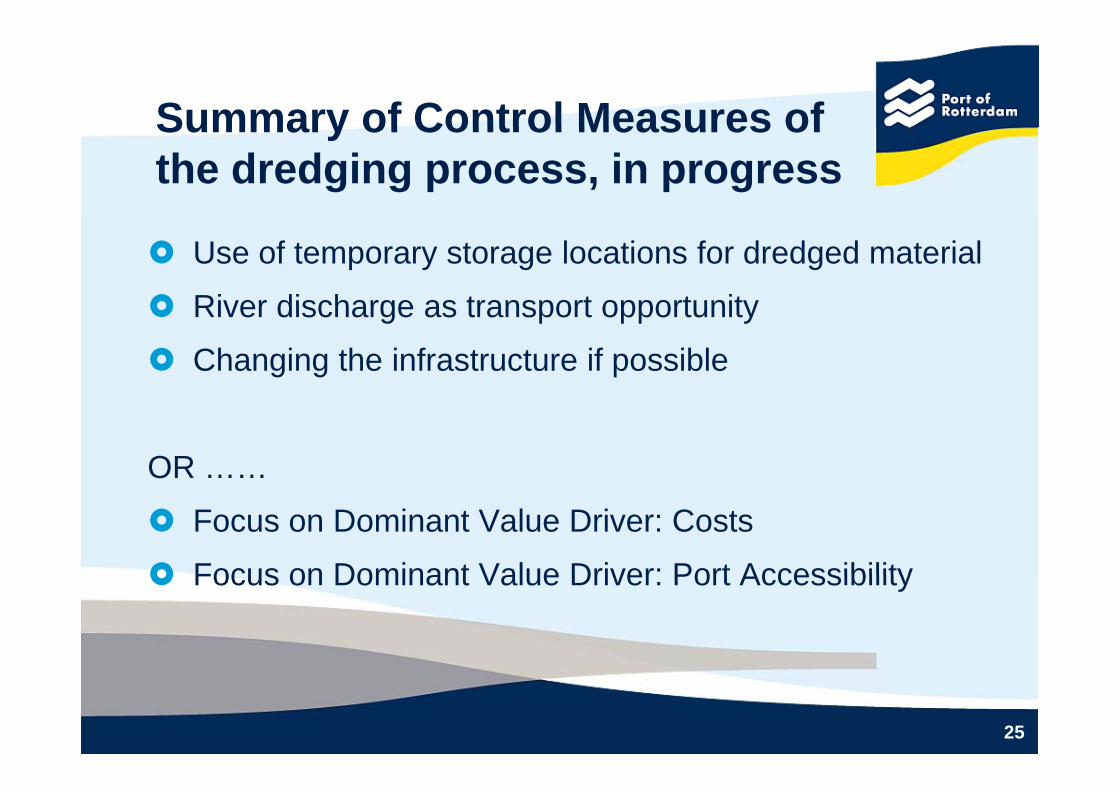
Summary of Control Measures ofSummary of Control Measures of the dredging process, in progress
Use of temporary storage locations for dredged material
River discharge as transport opportunity River discharge as transport opportunity
Changing the infrastructure if possible
OR ……
Focus on Dominant Value Driver: Costs
Focus on Dominant Value Driver: Port Accessibility Focus on Dominant Value Driver: Port Accessibility
25

Dredging Division - Port of Rotterdamthanks you
for your attentionfor your attention
26
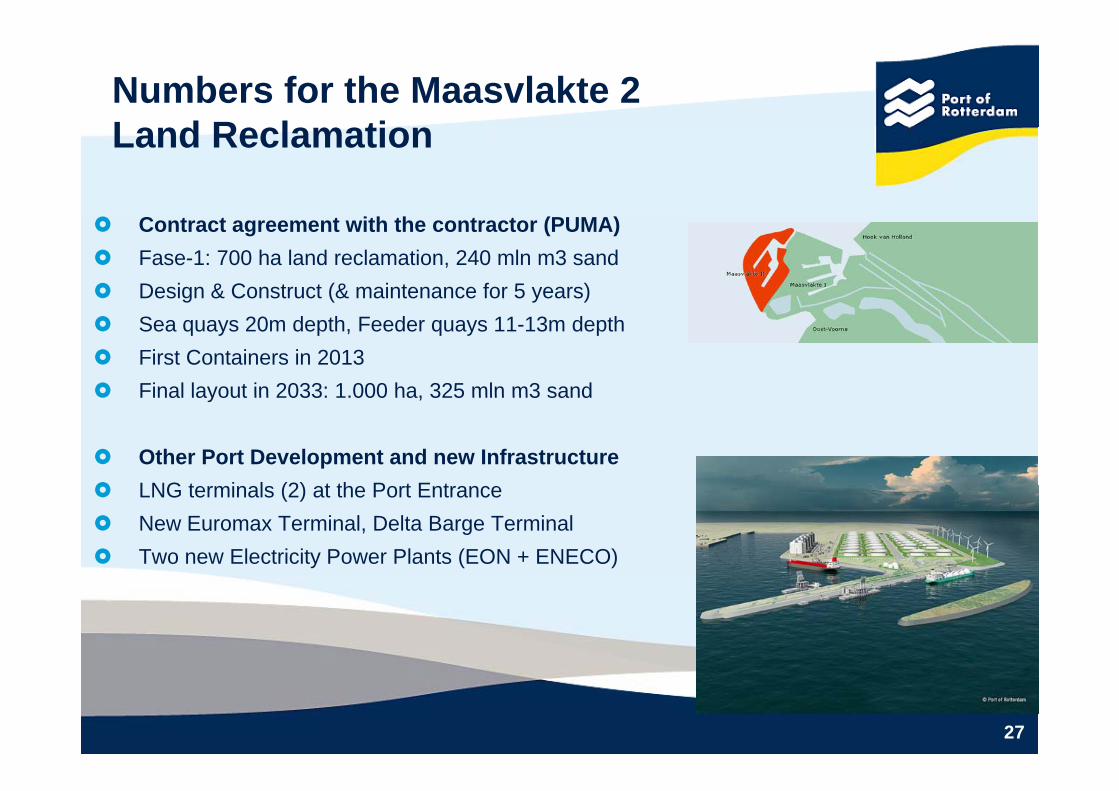
Numbers for the Maasvlakte 2 L d R l tiLand Reclamation
Contract agreement with the contractor (PUMA) Fase-1: 700 ha land reclamation, 240 mln m3 sand Design & Construct (& maintenance for 5 years) Sea quays 20m depth, Feeder quays 11-13m depth First Containers in 2013 Final layout in 2033: 1 000 ha 325 mln m3 sand Final layout in 2033: 1.000 ha, 325 mln m3 sand
Other Port Development and new Infrastructure LNG t i l (2) t th P t E t LNG terminals (2) at the Port Entrance New Euromax Terminal, Delta Barge Terminal Two new Electricity Power Plants (EON + ENECO)
27
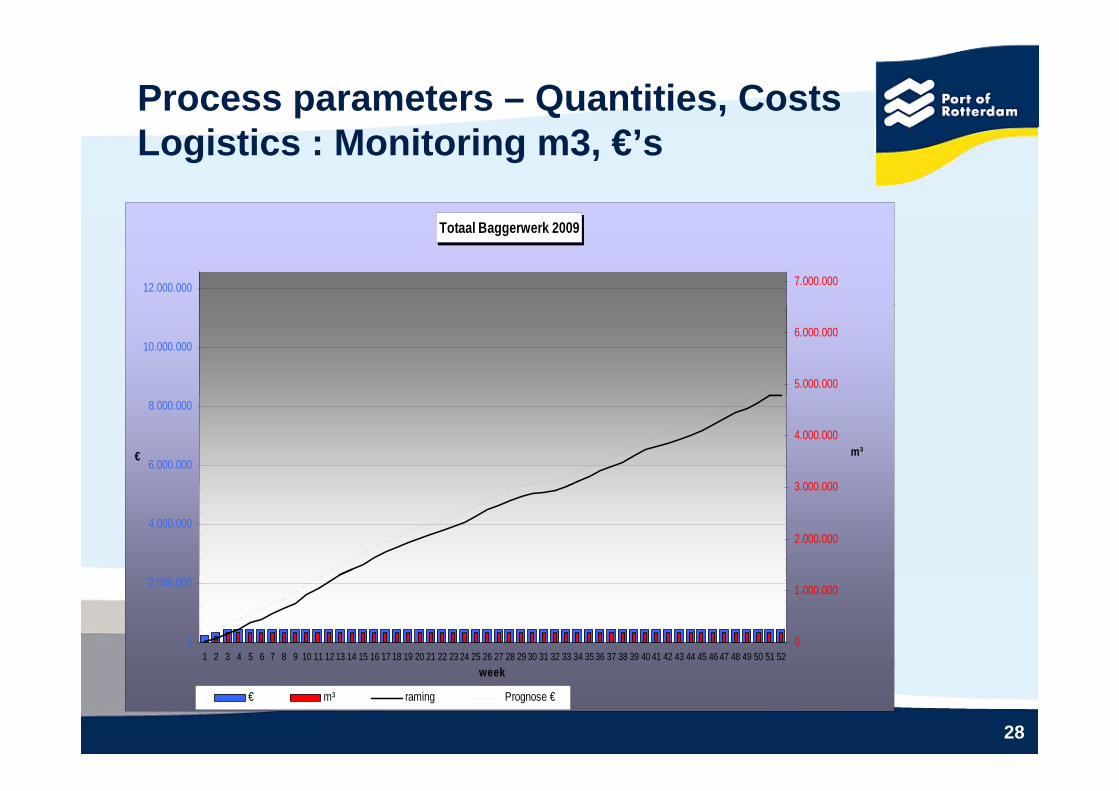
Process parameters – Quantities, Costs Logistics : Monitoring m3, €’s
Totaal Baggerwerk 2009
12.000.000 7.000.000
10.000.000
5.000.000
6.000.000
6.000.000
8.000.000
€
3 000 000
4.000.000m³
4.000.0002.000.000
3.000.000
0
2.000.000
1 2 3 4 5 6 7 8 9 10 11 12 13 14 15 16 17 18 19 20 21 22 23 24 25 26 27 28 29 30 31 32 33 34 35 36 37 38 39 40 41 42 43 44 45 46 47 48 49 50 51 520
1.000.000
28
week
€ m³ raming Prognose €